In the published article, there was an error in Tables 3–7 as published. The unit of serum Amadori products should be nmol/mg protein instead of μmol/mg protein. A typical unintentional editing mistake was made. The corrected Tables 3–7 appear below.
Table 3
| Healthy controls | Prostate cancer group | p | ||
|---|---|---|---|---|
| Serum | AOPP (nmol/mg protein) | 213.83 (192.02 − 291.16) | 239.55 (195.37 − 425.47) | 0.346 |
| 3-nitrotyrosine (nmol/mg protein) | 0.116 (0.11 − 0.14) | 0.119 (0.1 − 0.16) | 0.748 | |
| Thiol groups (mmol/L) | 643.92 (557.17 − 753.72) | 573.87 (485.81 − 699.9) | 0.044 | |
| Amadori products (nmol/mg protein) | 1745.69 (1587.43 − 2176.05) | 1987.22 (1826.28 − 2299.01) | 0.031 | |
| TAC (ABTS•, μmol TE/L) | 285.27 (271.48 − 294.88) | 210.15 (201.85 − 217.55) | <0.001 | |
| TAC (FRAP, μmol TE/L) | 217.55 (184.24 − 237.92) | 193.13 (168.65 − 225.12) | 0.133 | |
| MDA (μmol) | 3.27 (3.11 − 3.41) | 3.56 (3.39 − 4.02) | <0.001 | |
| 4-HNE (pg/mL) | 345.62 (238.01 − 508.88) | 412.08 (301.17 − 487.3) | 0.746 | |
| Urine | AOPP (μmol/mmol creatinine) | 12.72 (9.96 − 17.11) | 14.87 (9.03 − 19.98) | 0.538 |
| Amadori products (mmol/mmol creatinine) | 0.352 (0.28 − 0.48) | 0.384 (0.31 − 0.54) | 0.467 | |
| TAC (ABTS•, μmol TE/L) | 856.83 (720.44 − 963.18) | 758.85 (573.7 − 1026.94) | 0.194 | |
| TAC (FRAP, μmol TE/L) | 564.90 (448.23 − 625.55) | 451.44 (297.01 − 638.48) | 0.047 | |
| MDA (μmol/mmol creatinine) | 0.86 (0.71 − 1.01) | 1.15 (0.96 − 1.34) | <0.001 |
Markers of oxidative stress in healthy controls and patients with prostate cancer.
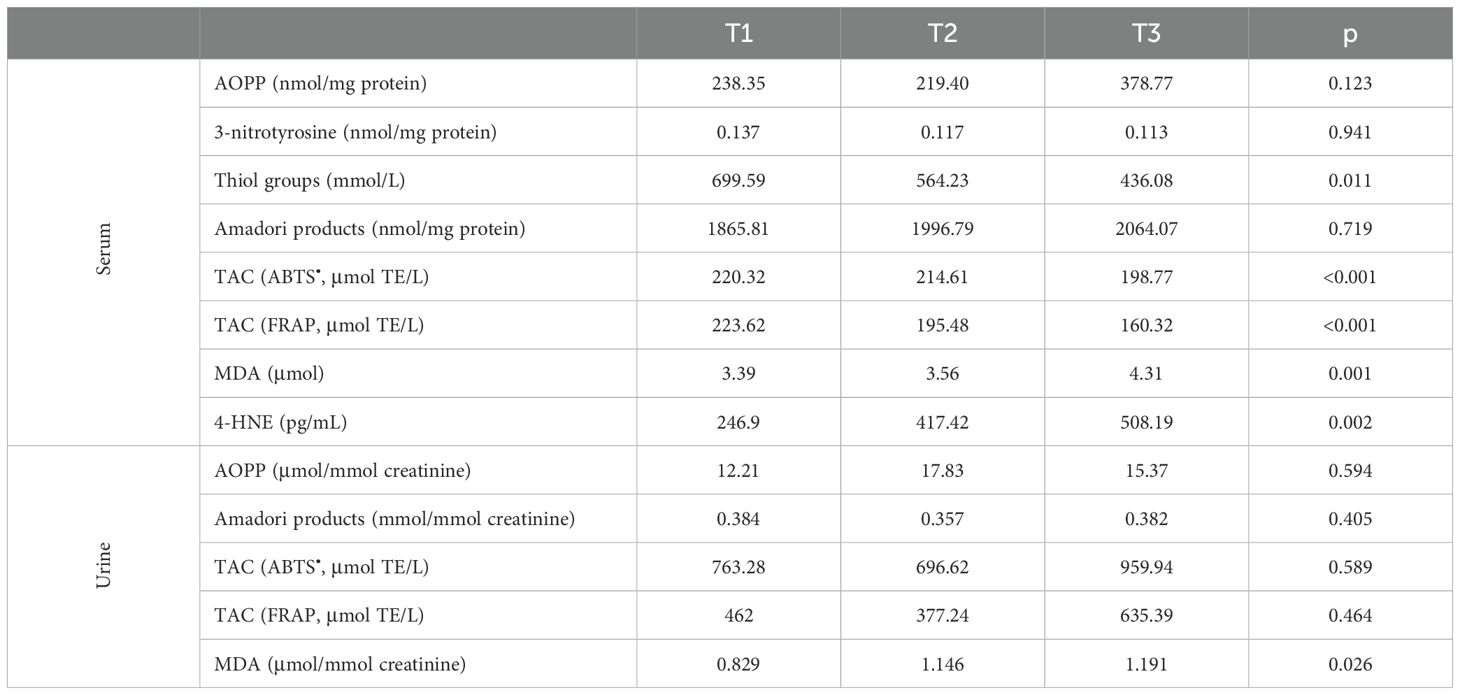
Table 4
| T1 | T2 | T3 | p | ||
|---|---|---|---|---|---|
| Serum | AOPP (nmol/mg protein) | 238.35 | 219.40 | 378.77 | 0.123 |
| 3-nitrotyrosine (nmol/mg protein) | 0.137 | 0.117 | 0.113 | 0.941 | |
| Thiol groups (mmol/L) | 699.59 | 564.23 | 436.08 | 0.011 | |
| Amadori products (nmol/mg protein) | 1865.81 | 1996.79 | 2064.07 | 0.719 | |
| TAC (ABTS•, μmol TE/L) | 220.32 | 214.61 | 198.77 | <0.001 | |
| TAC (FRAP, μmol TE/L) | 223.62 | 195.48 | 160.32 | <0.001 | |
| MDA (μmol) | 3.39 | 3.56 | 4.31 | 0.001 | |
| 4-HNE (pg/mL) | 246.9 | 417.42 | 508.19 | 0.002 | |
| Urine | AOPP (μmol/mmol creatinine) | 12.21 | 17.83 | 15.37 | 0.594 |
| Amadori products (mmol/mmol creatinine) | 0.384 | 0.357 | 0.382 | 0.405 | |
| TAC (ABTS•, μmol TE/L) | 763.28 | 696.62 | 959.94 | 0.589 | |
| TAC (FRAP, μmol TE/L) | 462 | 377.24 | 635.39 | 0.464 | |
| MDA (μmol/mmol creatinine) | 0.829 | 1.146 | 1.191 | 0.026 |
Markers of oxidative stress in patients divided in groups considering the cancer stage depending on the TNM classification.
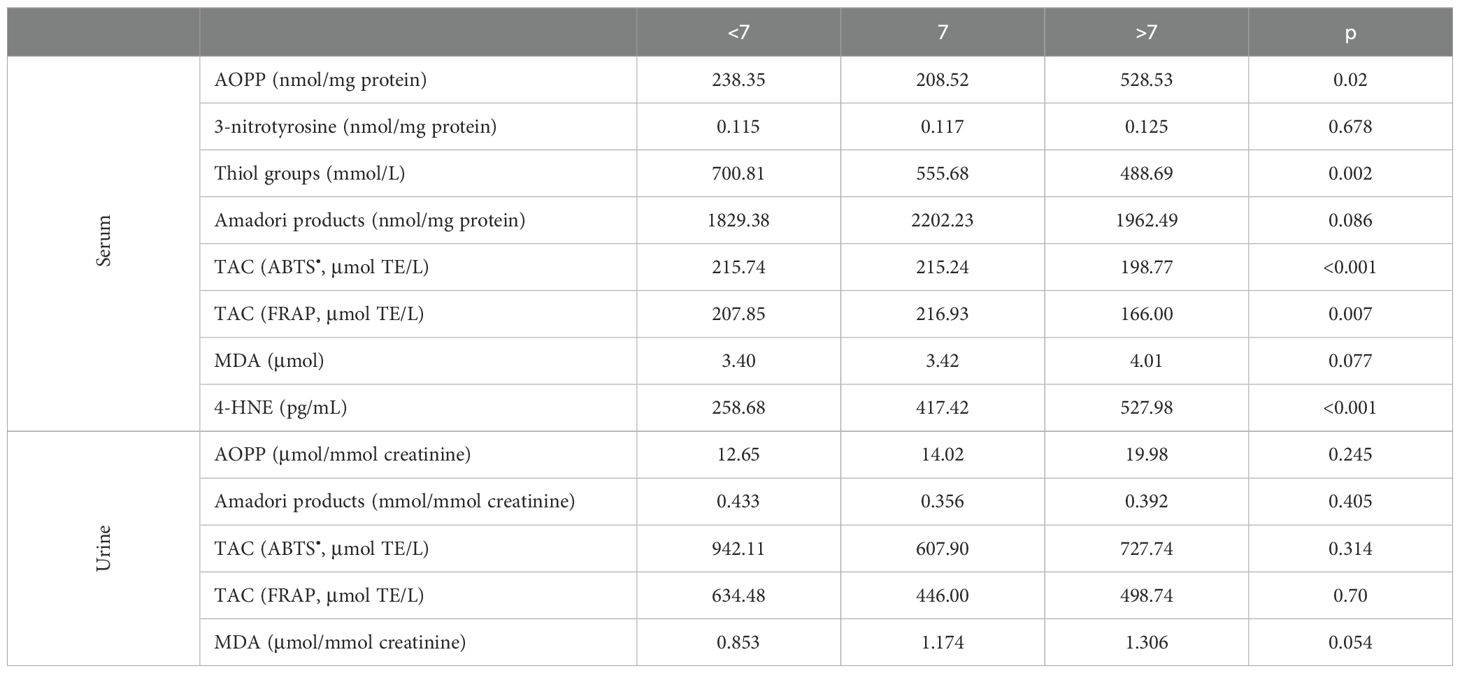
Table 5
| <7 | 7 | >7 | p | ||
|---|---|---|---|---|---|
| Serum | AOPP (nmol/mg protein) | 238.35 | 208.52 | 528.53 | 0.02 |
| 3-nitrotyrosine (nmol/mg protein) | 0.115 | 0.117 | 0.125 | 0.678 | |
| Thiol groups (mmol/L) | 700.81 | 555.68 | 488.69 | 0.002 | |
| Amadori products (nmol/mg protein) | 1829.38 | 2202.23 | 1962.49 | 0.086 | |
| TAC (ABTS•, μmol TE/L) | 215.74 | 215.24 | 198.77 | <0.001 | |
| TAC (FRAP, μmol TE/L) | 207.85 | 216.93 | 166.00 | 0.007 | |
| MDA (μmol) | 3.40 | 3.42 | 4.01 | 0.077 | |
| 4-HNE (pg/mL) | 258.68 | 417.42 | 527.98 | <0.001 | |
| Urine | AOPP (μmol/mmol creatinine) | 12.65 | 14.02 | 19.98 | 0.245 |
| Amadori products (mmol/mmol creatinine) | 0.433 | 0.356 | 0.392 | 0.405 | |
| TAC (ABTS•, μmol TE/L) | 942.11 | 607.90 | 727.74 | 0.314 | |
| TAC (FRAP, μmol TE/L) | 634.48 | 446.00 | 498.74 | 0.70 | |
| MDA (μmol/mmol creatinine) | 0.853 | 1.174 | 1.306 | 0.054 |
Markers of oxidative stress in patients divided in groups considering Gleason grading system.
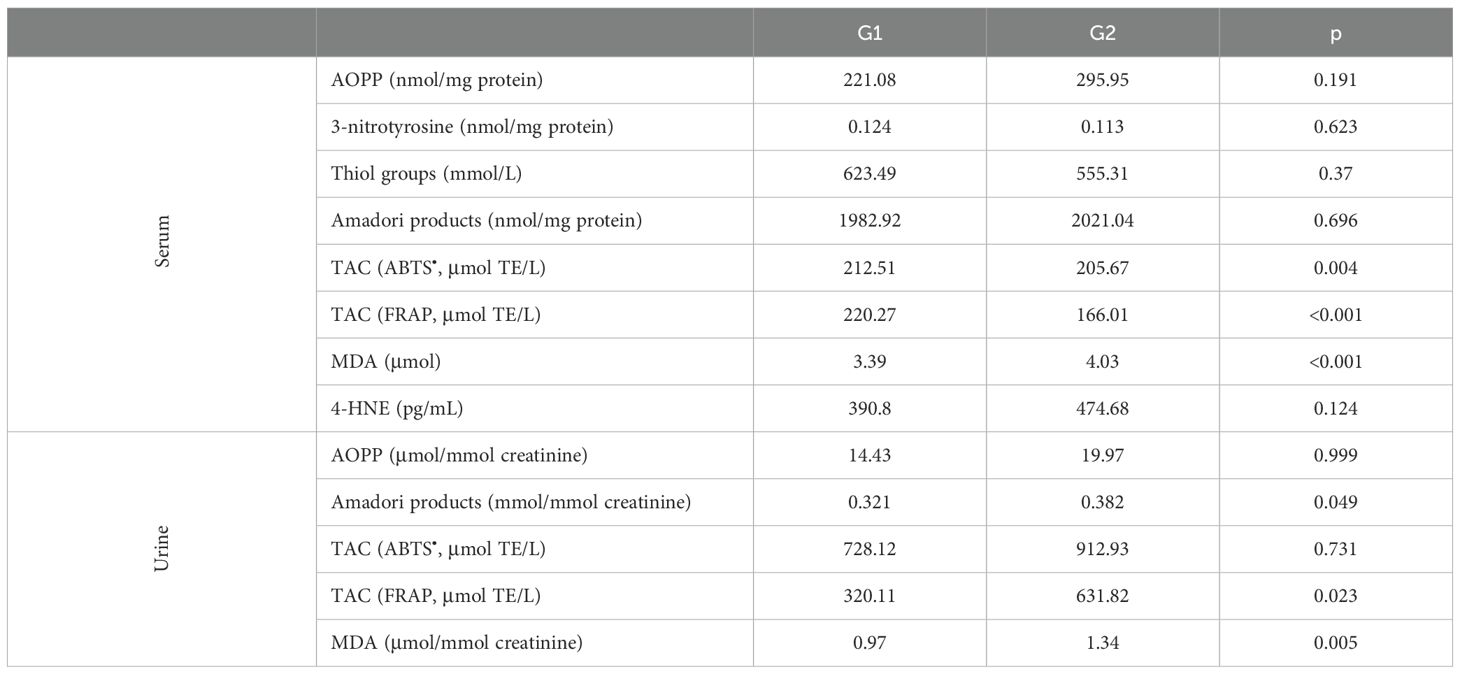
Table 6
| G1 | G2 | p | ||
|---|---|---|---|---|
| Serum | AOPP (nmol/mg protein) | 221.08 | 295.95 | 0.191 |
| 3-nitrotyrosine (nmol/mg protein) | 0.124 | 0.113 | 0.623 | |
| Thiol groups (mmol/L) | 623.49 | 555.31 | 0.37 | |
| Amadori products (nmol/mg protein) | 1982.92 | 2021.04 | 0.696 | |
| TAC (ABTS•, μmol TE/L) | 212.51 | 205.67 | 0.004 | |
| TAC (FRAP, μmol TE/L) | 220.27 | 166.01 | <0.001 | |
| MDA (μmol) | 3.39 | 4.03 | <0.001 | |
| 4-HNE (pg/mL) | 390.8 | 474.68 | 0.124 | |
| Urine | AOPP (μmol/mmol creatinine) | 14.43 | 19.97 | 0.999 |
| Amadori products (mmol/mmol creatinine) | 0.321 | 0.382 | 0.049 | |
| TAC (ABTS•, μmol TE/L) | 728.12 | 912.93 | 0.731 | |
| TAC (FRAP, μmol TE/L) | 320.11 | 631.82 | 0.023 | |
| MDA (μmol/mmol creatinine) | 0.97 | 1.34 | 0.005 |
Markers of oxidative stress in patients divided in groups considering the cancer histological grade.
Table 7
| Absent of perineural invasion | Presence of perineural invasion | p | ||
|---|---|---|---|---|
| Serum | AOPP (nmol/mg protein) | 219.36 | 277.59 | 0.346 |
| 3-nitrotyrosine (nmol/mg protein) | 0.114 | 0.134 | 0.603 | |
| Thiol groups (mmol/L) | 542.56 | 586.98 | 0.223 | |
| Amadori products (nmol/mg protein) | 1962.49 | 2092.05 | 0.19 | |
| TAC (ABTS•, μmol TE/L) | 215.63 | 208.95 | 0.154 | |
| TAC (FRAP, μmol TE/L) | 207.92 | 176.32 | 0.036 | |
| MDA (μmol) | 3.52 | 3.84 | 0.147 | |
| 4-HNE (pg/mL) | 326.92 | 453.66 | 0.102 | |
| Urine | AOPP (μmol/mmol creatinine) | 10.63 | 22.56 | <0.001 |
| Amadori products (mmol/mmol creatinine) | 0.356 | 0.388 | 0.89 | |
| TAC (ABTS•, μmol TE/L) | 998.71 | 694.79 | 0.063 | |
| TAC (FRAP, μmol TE/L) | 638.48 | 296.42 | <0.001 | |
| MDA (μmol/mmol creatinine) | 1.11 | 1.19 | 0.452 |
Markers of oxidative stress in patients divided in groups considering the presence of perineural invasion.
The authors apologize for this error and state that this does not change the scientific conclusions of the article in any way. The original article has been updated.
Statements
Publisher’s note
All claims expressed in this article are solely those of the authors and do not necessarily represent those of their affiliated organizations, or those of the publisher, the editors and the reviewers. Any product that may be evaluated in this article, or claim that may be made by its manufacturer, is not guaranteed or endorsed by the publisher.
Summary
Keywords
oxidative stress, nitrosative stress, oxidative damage of protein, prostate cancer, cancer progression
Citation
Biesiadecki M, Mołoń M, Balawender K, Kobylińska Z and Galiniak S (2024) Corrigendum: Shedding light on the shadows: oxidative stress and its pivotal role in prostate cancer progression. Front. Oncol. 14:1468582. doi: 10.3389/fonc.2024.1468582
Received
22 July 2024
Accepted
06 August 2024
Published
20 August 2024
Volume
14 - 2024
Edited and reviewed by
Shafiq Khan, Clark Atlanta University, United States
Updates
Copyright
© 2024 Biesiadecki, Mołoń, Balawender, Kobylińska and Galiniak.
This is an open-access article distributed under the terms of the Creative Commons Attribution License (CC BY). The use, distribution or reproduction in other forums is permitted, provided the original author(s) and the copyright owner(s) are credited and that the original publication in this journal is cited, in accordance with accepted academic practice. No use, distribution or reproduction is permitted which does not comply with these terms.
*Correspondence: Marek Biesiadecki, mbiesiadecki@ur.edu.pl
Disclaimer
All claims expressed in this article are solely those of the authors and do not necessarily represent those of their affiliated organizations, or those of the publisher, the editors and the reviewers. Any product that may be evaluated in this article or claim that may be made by its manufacturer is not guaranteed or endorsed by the publisher.