 Jia-gui Chai
 Yu-hang Li
 Chang-xing Ke
- Department of Urology, The Second Affiliated Hospital of Kunming Medical University, Kunming, China
Purpose: To develop novel nomograms for predicting prostate cancer (PCa) and clinically significant prostate cancer (csPCa) in patients with prostate-specific antigen (PSA) < 10 ng/ml and PI-RADS v2.1 score ≤ 3.
Methods: We retrospectively collected data from 327 men with PSA < 10 ng/ml and PI-RADS score ≤ 3 from June 2020 to June 2024 in our hospital. Clinical data were compared among the PI-RADS scores 1-3 population, PI-RADS scores 1-2 population, and PI-RADS score 3 population. Logistic regression analyses were conducted to identify independent risk factors for PCa or csPCa, and nomograms were subsequently developed. The nomograms were evaluated via receiver operating curves (ROC), calibration curves, and decision curve analysis (DCA). Internal validation was conducted using bootstrap methods.
Results: Among the 327 patients, 224 (68.50%) were diagnosed with benign, 65 (19.87%) with csPCa, and 38 (11.62%) with clinically insignificant prostate cancer (cisPCa). Prostate-specific antigen density (PSAD), lesion volume (LV), lesion location, and apparent diffusion coefficient (ADC) were found to be independent risk factors for PCa and csPCa in PI-RADS scores 1-3 population. PSAD and lesion location were independent risk factors for PCa in the PI-RADS scores 1-2 population, while PSAD, lesion location and ADC were independent risk factors for PCa in the PI-RADS score 3 population. Four nomograms were established based on these variables. For the population with PI-RADS scores 1-3, the area under the ROC (AUC) for predicting PCa and csPCa was 0.78 and 0.79, respectively. For patients with PI-RADS scores 1-2, the AUC for predicting PCa was 0.75. For patients with PI-RADS score 3, the AUC for predicting PCa was 0.78. The calibration curves revealed good concordance between the predicted probability and the actual probability. DCA demonstrated the net benefit of nomograms. Internal validation revealed strong discrimination of the nomograms.
Conclusion: We developed novel nomograms with acceptable discriminability for predicting PCa and csPCa in patients with PSA < 10 ng/ml and PI-RADS score ≤ 3. These models can assist urologists in determining the necessity of prostate biopsy.
Introduction
Prostate cancer (PCa) is the second most common malignant tumor in men, with over 1.462 million new cases and 394,200 deaths worldwide each year (1). Increasing evidence indicates that early screening for PCa significantly reduces morbidity and mortality (2, 3). Currently, early PCa screening predominantly relies on multiparametric magnetic resonance imaging (mp-MRI) and prostate-specific antigen (PSA) testing (4, 5).
Based on mp-MRI, Prostate Image-Reporting and Data System (PI-RADS) score can be obtained, which provides clues for early PCa screening (6, 7). PI-RADS score ≤ 3 is generally classified as low-risk, often leading to prostate biopsy (PBx) not being recommended (8, 9). Additionally, PSA is widely used for early PCa screening (10). PSA < 10 ng/ml is considered a gray zone, leading to ongoing debate about the necessity of biopsy in these cases (11).
Recent studies have reported whether individuals with PI-RADS score ≤ 3 should undergo PBx (11, 12). However, decision-making becomes challenging in patients with PI-RADS scores 1-3 and PSA < 10 ng/ml, especially for patients with PI-RADS scores 1-2. To our knowledge, this issue is rarely explored. In this study, we aimed to address this clinical challenge by developing novel nomograms to predict the likelihood of PCa and clinically significant prostate cancer (csPCa) in patients with PI-RADS scores 1-3 and PSA < 10 ng/ml.
Materials and methods
Patients
This retrospective analysis was approved by the Institutional Review Board of our hospital. Patient informed consent requirement was waived. We evaluated clinical data from 1,808 patients who underwent mp-MRI and PBx at the Second Affiliated Hospital of Kunming Medical University from June 2020 to June 2024. The PBx criteria were: suspicious nodules detected by digital rectal examination, suspicious lesions detected by ultrasound or mp-MRI, PSA greater than 10 ng/ml, PSA at 4-10 ng/ml with abnormal f/t PSA and/or prostate-specific antigen density (PSAD). When one or more of the above were present, PBx was recommended (2). All patients received ultrasound-guided transrectal or transperineal biopsies, including 12 + x (12 cores in peripheral zone [PZ] and transitional zone [TZ]; x represents cores obtained from suspicious or positive areas by mp-MRI). The csPCa was defined as gleason scores (GS) ≥ 7, or > 3 biopsy cores positive, or at least one biopsy core with > 50% involvement. Clinically insignificant prostate cancer (cisPCa) was defined as GS < 7 without gleason pattern 4 or 5, less than 3 core samples, and no core sample > 50% involved (13). Biopsy-naive was defined as undergoing PBx for the first time and had not previously undergone any PBx or prostate surgery. The end point of the study was to obtain accurate and detailed pathological results for the biopsy-naive patient. Biopsy negative patients were regularly followed up (3 months/time).
The exclusion criteria included: (1) Any possible situations that influenced PSA, such as indwelling catheters. (2) poor mp-MRI image quality (the lesion volume and PI-RADS v2.1 score cannot be obtained through MRI). (3) repeated biopsy. (4) previous prostate surgery. (5) PI-RADS scores 4-5 or PSA ≥ 10 ng/ml. Ultimately, 327 men with PSA < 10 ng/ml and PI-RADS v2.1 score ≤ 3 were included in the study (Figure 1).
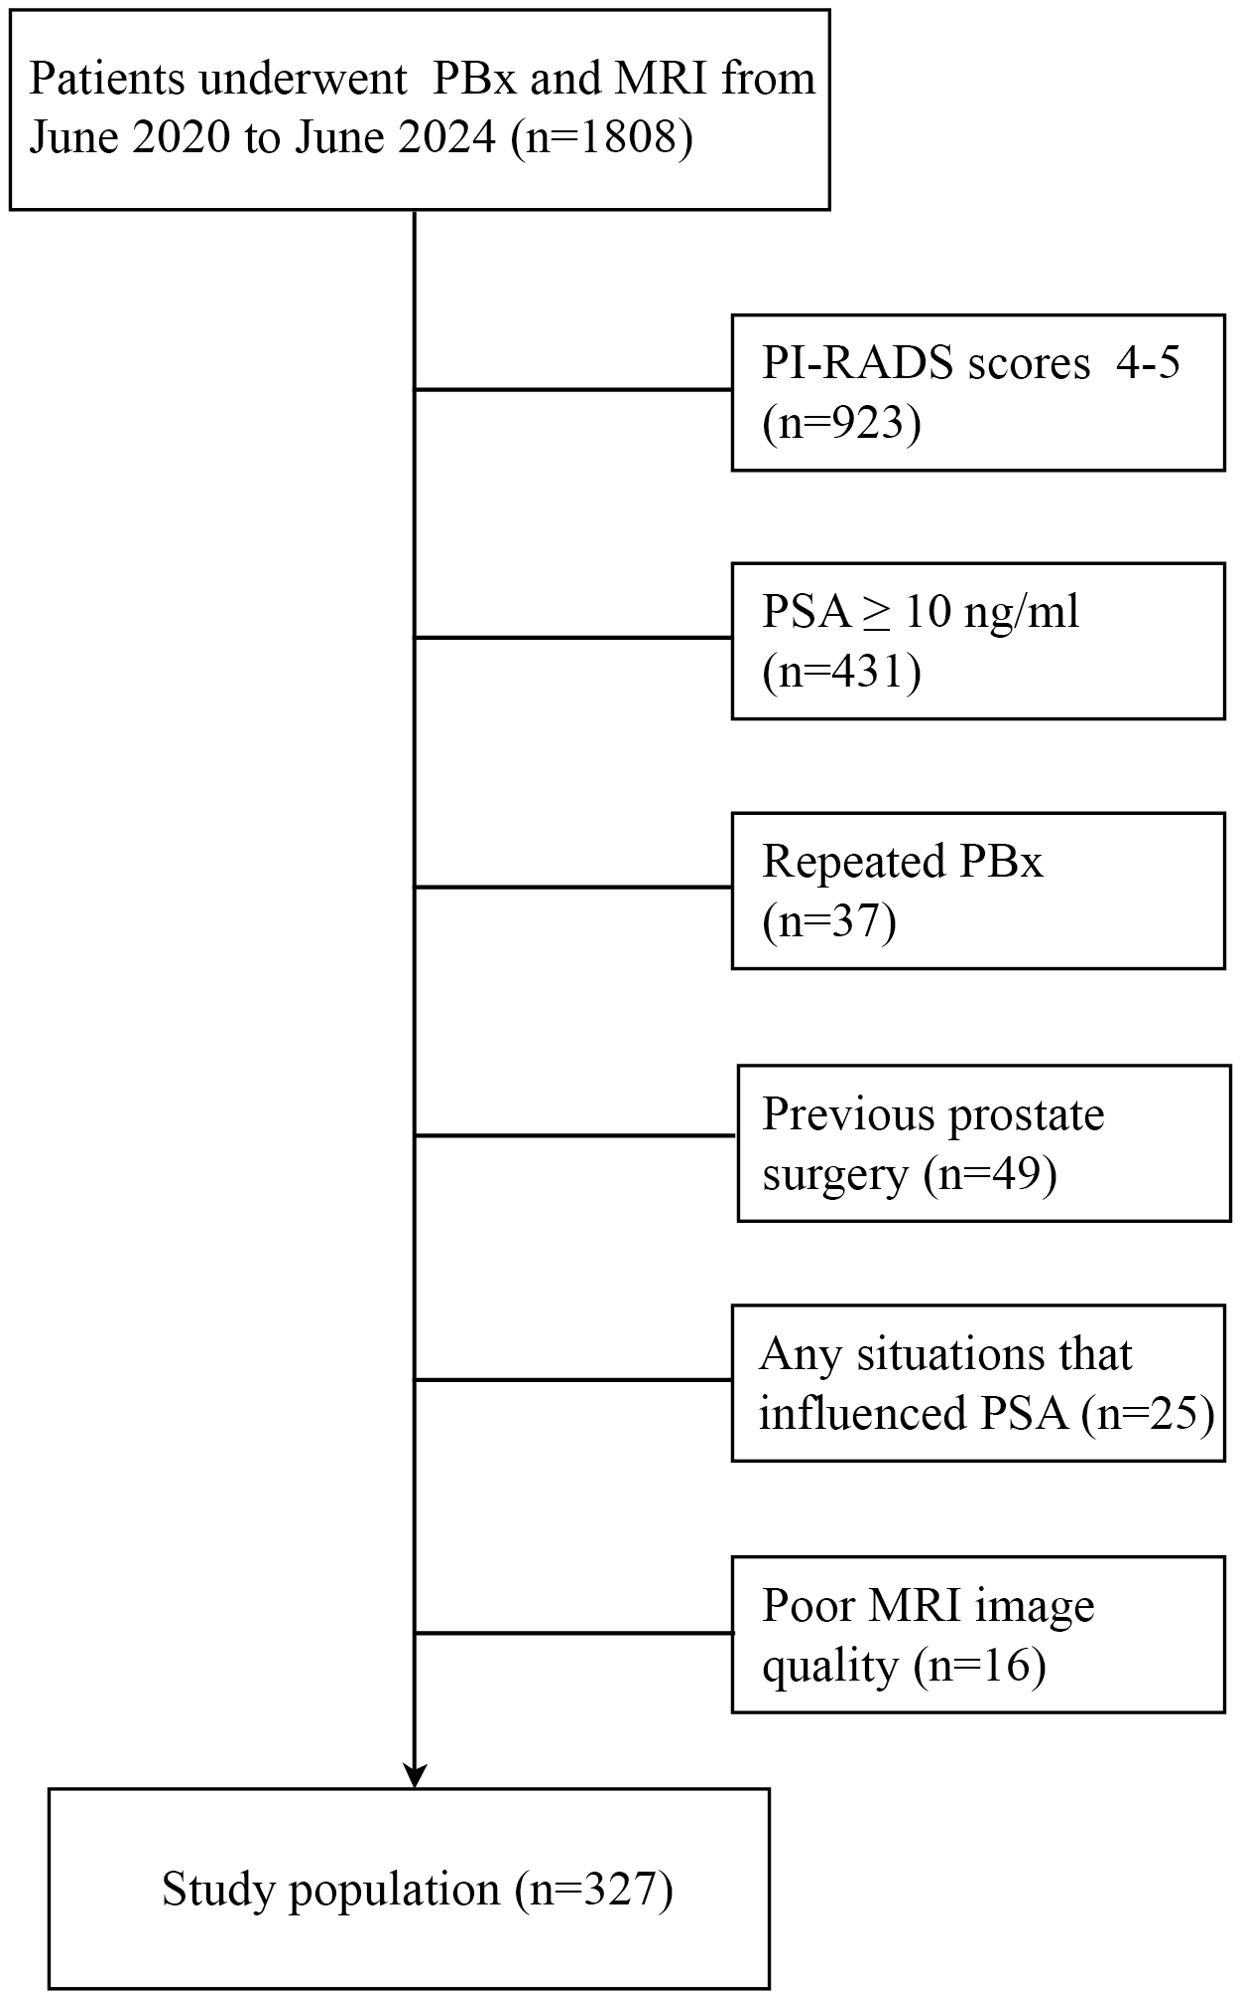
Figure 1. The detailed patient inclusion and exclusion follow charts.
MRI protocol
The prostate mp-MRI (Philips Achieva, Netherlands) was performed with a 3-Tesla system. Three main scan sequences were included: axial T2 weighted image (T2WI), diffusion weighted imaging (DWI), and dynamic contrast enhancement (DCE) images. Apparent diffusion coefficient (ADC) value was calculated by the highest b‐value (14). All mp-MRI images were evaluated by two radiologists with over 7 years of experience in prostate imaging. The index lesion was scored by PI‐RADS v2.1. The lesion volume (LV) was calculated via the following formula: horizontal plane diameter × sagittal plane diameter × coronal plane diameter × 0.523 (15).
Statistical analysis
Continuous variables with non-normal distribution were expressed as median (interquartile range). Differences among groups were compared using the Mann–Whitney test. Categorical variables were presented as absolute and relative frequency, and were compared using chi-square test. Univariate and multivariate logistic regression analyses were conducted to identify independent risk factors for PCa or csPCa. Variables with statistical significance in the univariate logistic analysis were retained in the multivariate logistic analysis. Subsequently, the variables with statistical significance in the multivariate logistic analysis were included in the construction of the nomogram. Receiver operating curves (ROC) were established and the area under the curves (AUC) was calculated to assess the discriminatory ability of the models. Cutoff was found by the Youden’s index. Calibration curves were constructed to assess the extent of overestimation or underestimation of the models. Decision curves were made to determine the clinical net benefit. Internal validation was carried out with 1000 bootstrap resamples and Harrell’s C‐index was used to assess the discrimination performance. All analyses were performed with SPSS software (Version 27.0, IBM) and R software (version 3.6.2, R foundation for statistical computing, Vienna, Austria). Two-sided p < 0.05 was considered to indicate a statistical significance.
Results
Clinical characteristics and nomogram construction
All the data including demographic, clinical and imaging features was presented in Table 1. A total of 327 patients were included in the study, of whom 224 (68.50%) were diagnosed with benign, 65 (19.87%) with csPCa, and 38 (11.62%) with cisPCa. Compared to those without PCa, lower f/t PSA, higher PSAD, smaller prostate volume (PV), larger LV, lower ADC, and lesions located mostly in the PZ were observed in patients with PCa or csPCa. Independent risk factors of PCa and csPCa were explored by univariable and multivariable logistic regression analyses (Tables 2, 3). LV, ADC, PSAD and lesion location were screened out to establish the nomograms in patients with PI-RADS score ≤ 3 and PSA < 10 ng/ml (Figures 2A, B).
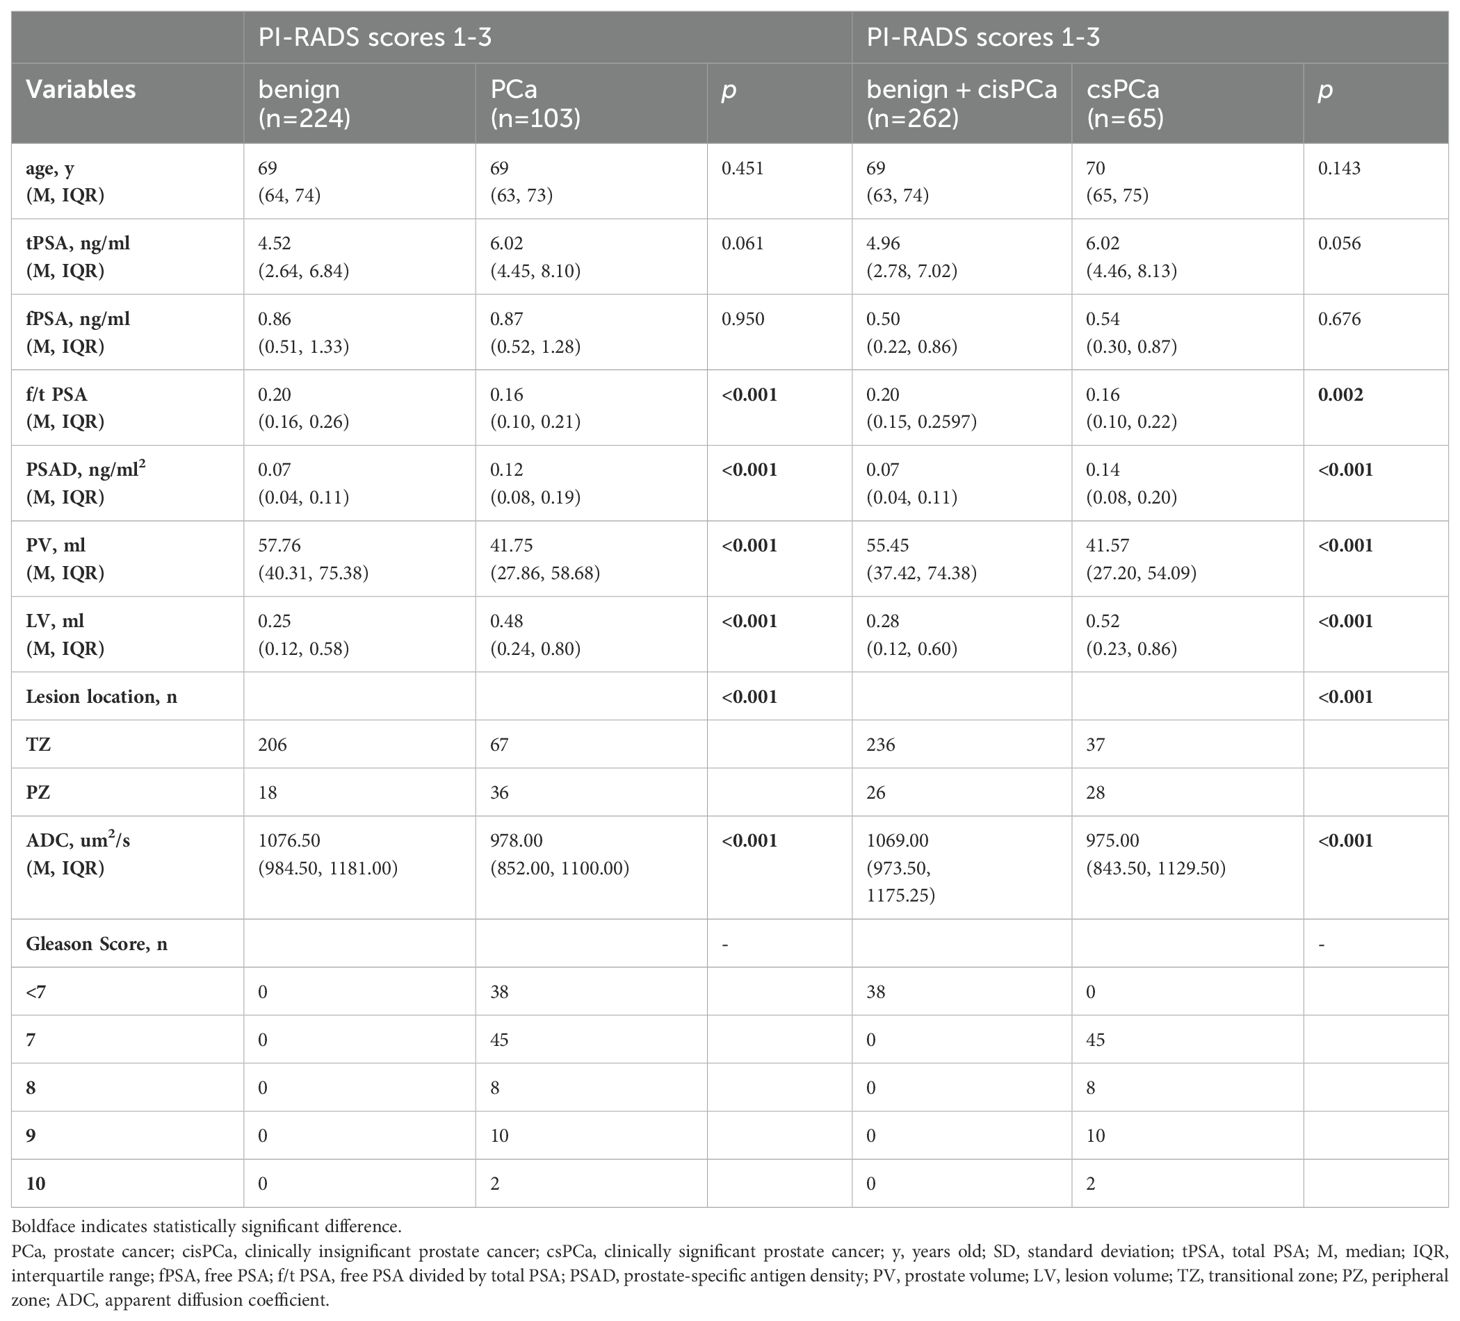
Table 1. Comparison of variables for benign and PCa, benign + cisPCa and csPCa in PI-RADS scores 1-3 population.
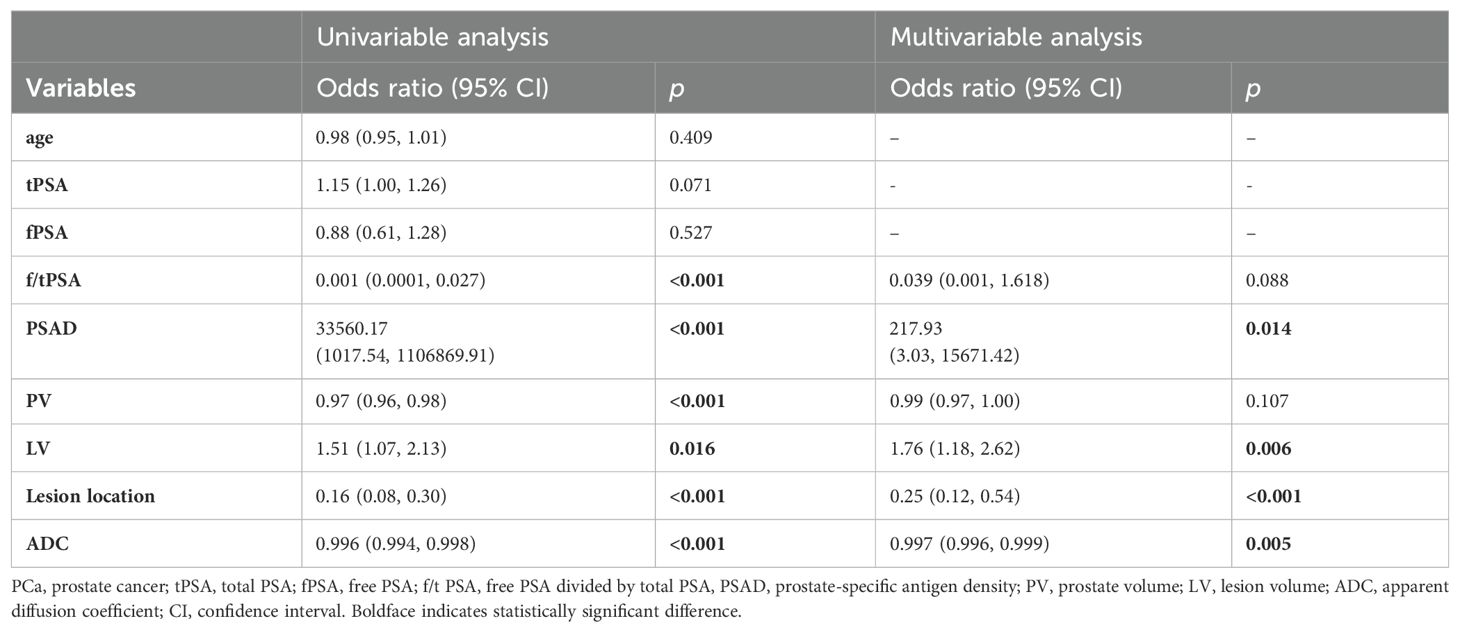
Table 2. Univariable and multivariable binary logistic regression analysis testing variables as independent risk factors of PCa in PI-RADS scores 1-3 population.
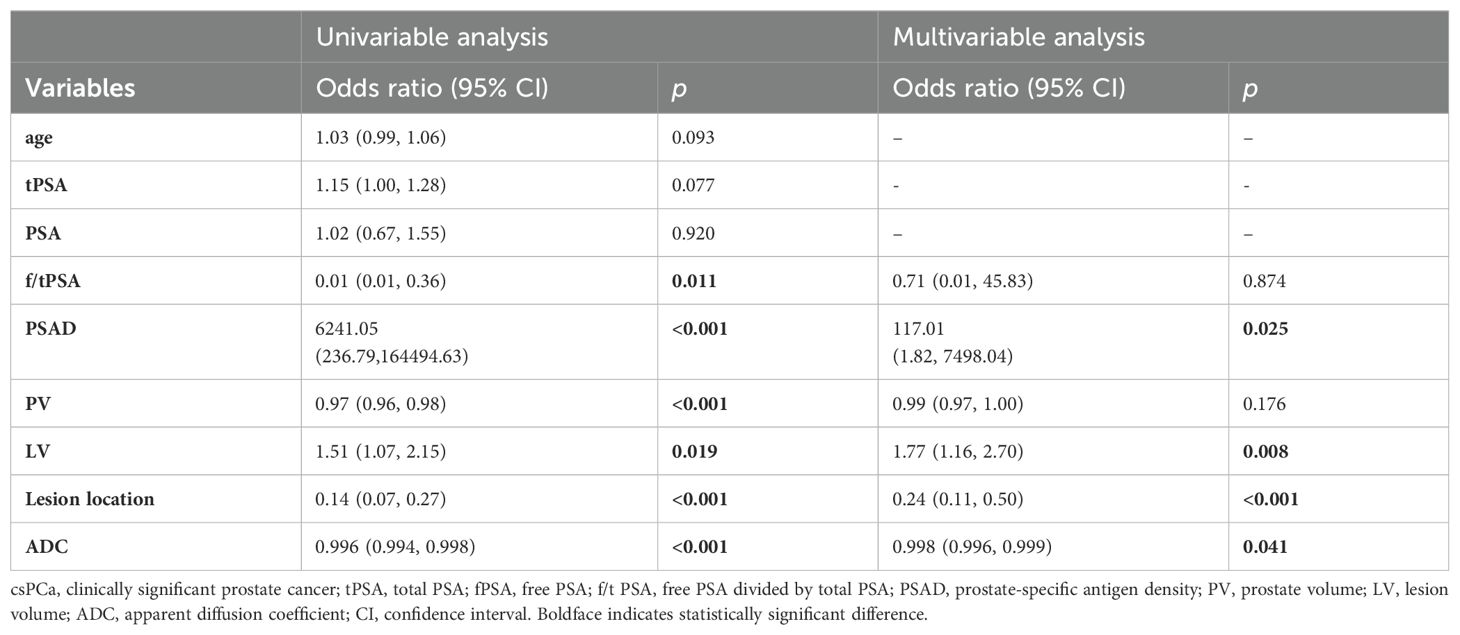
Table 3. Univariable and multivariable binary logistic regression analysis testing variables as independent risk factors of csPCa in PI-RADS scores 1-3 population.
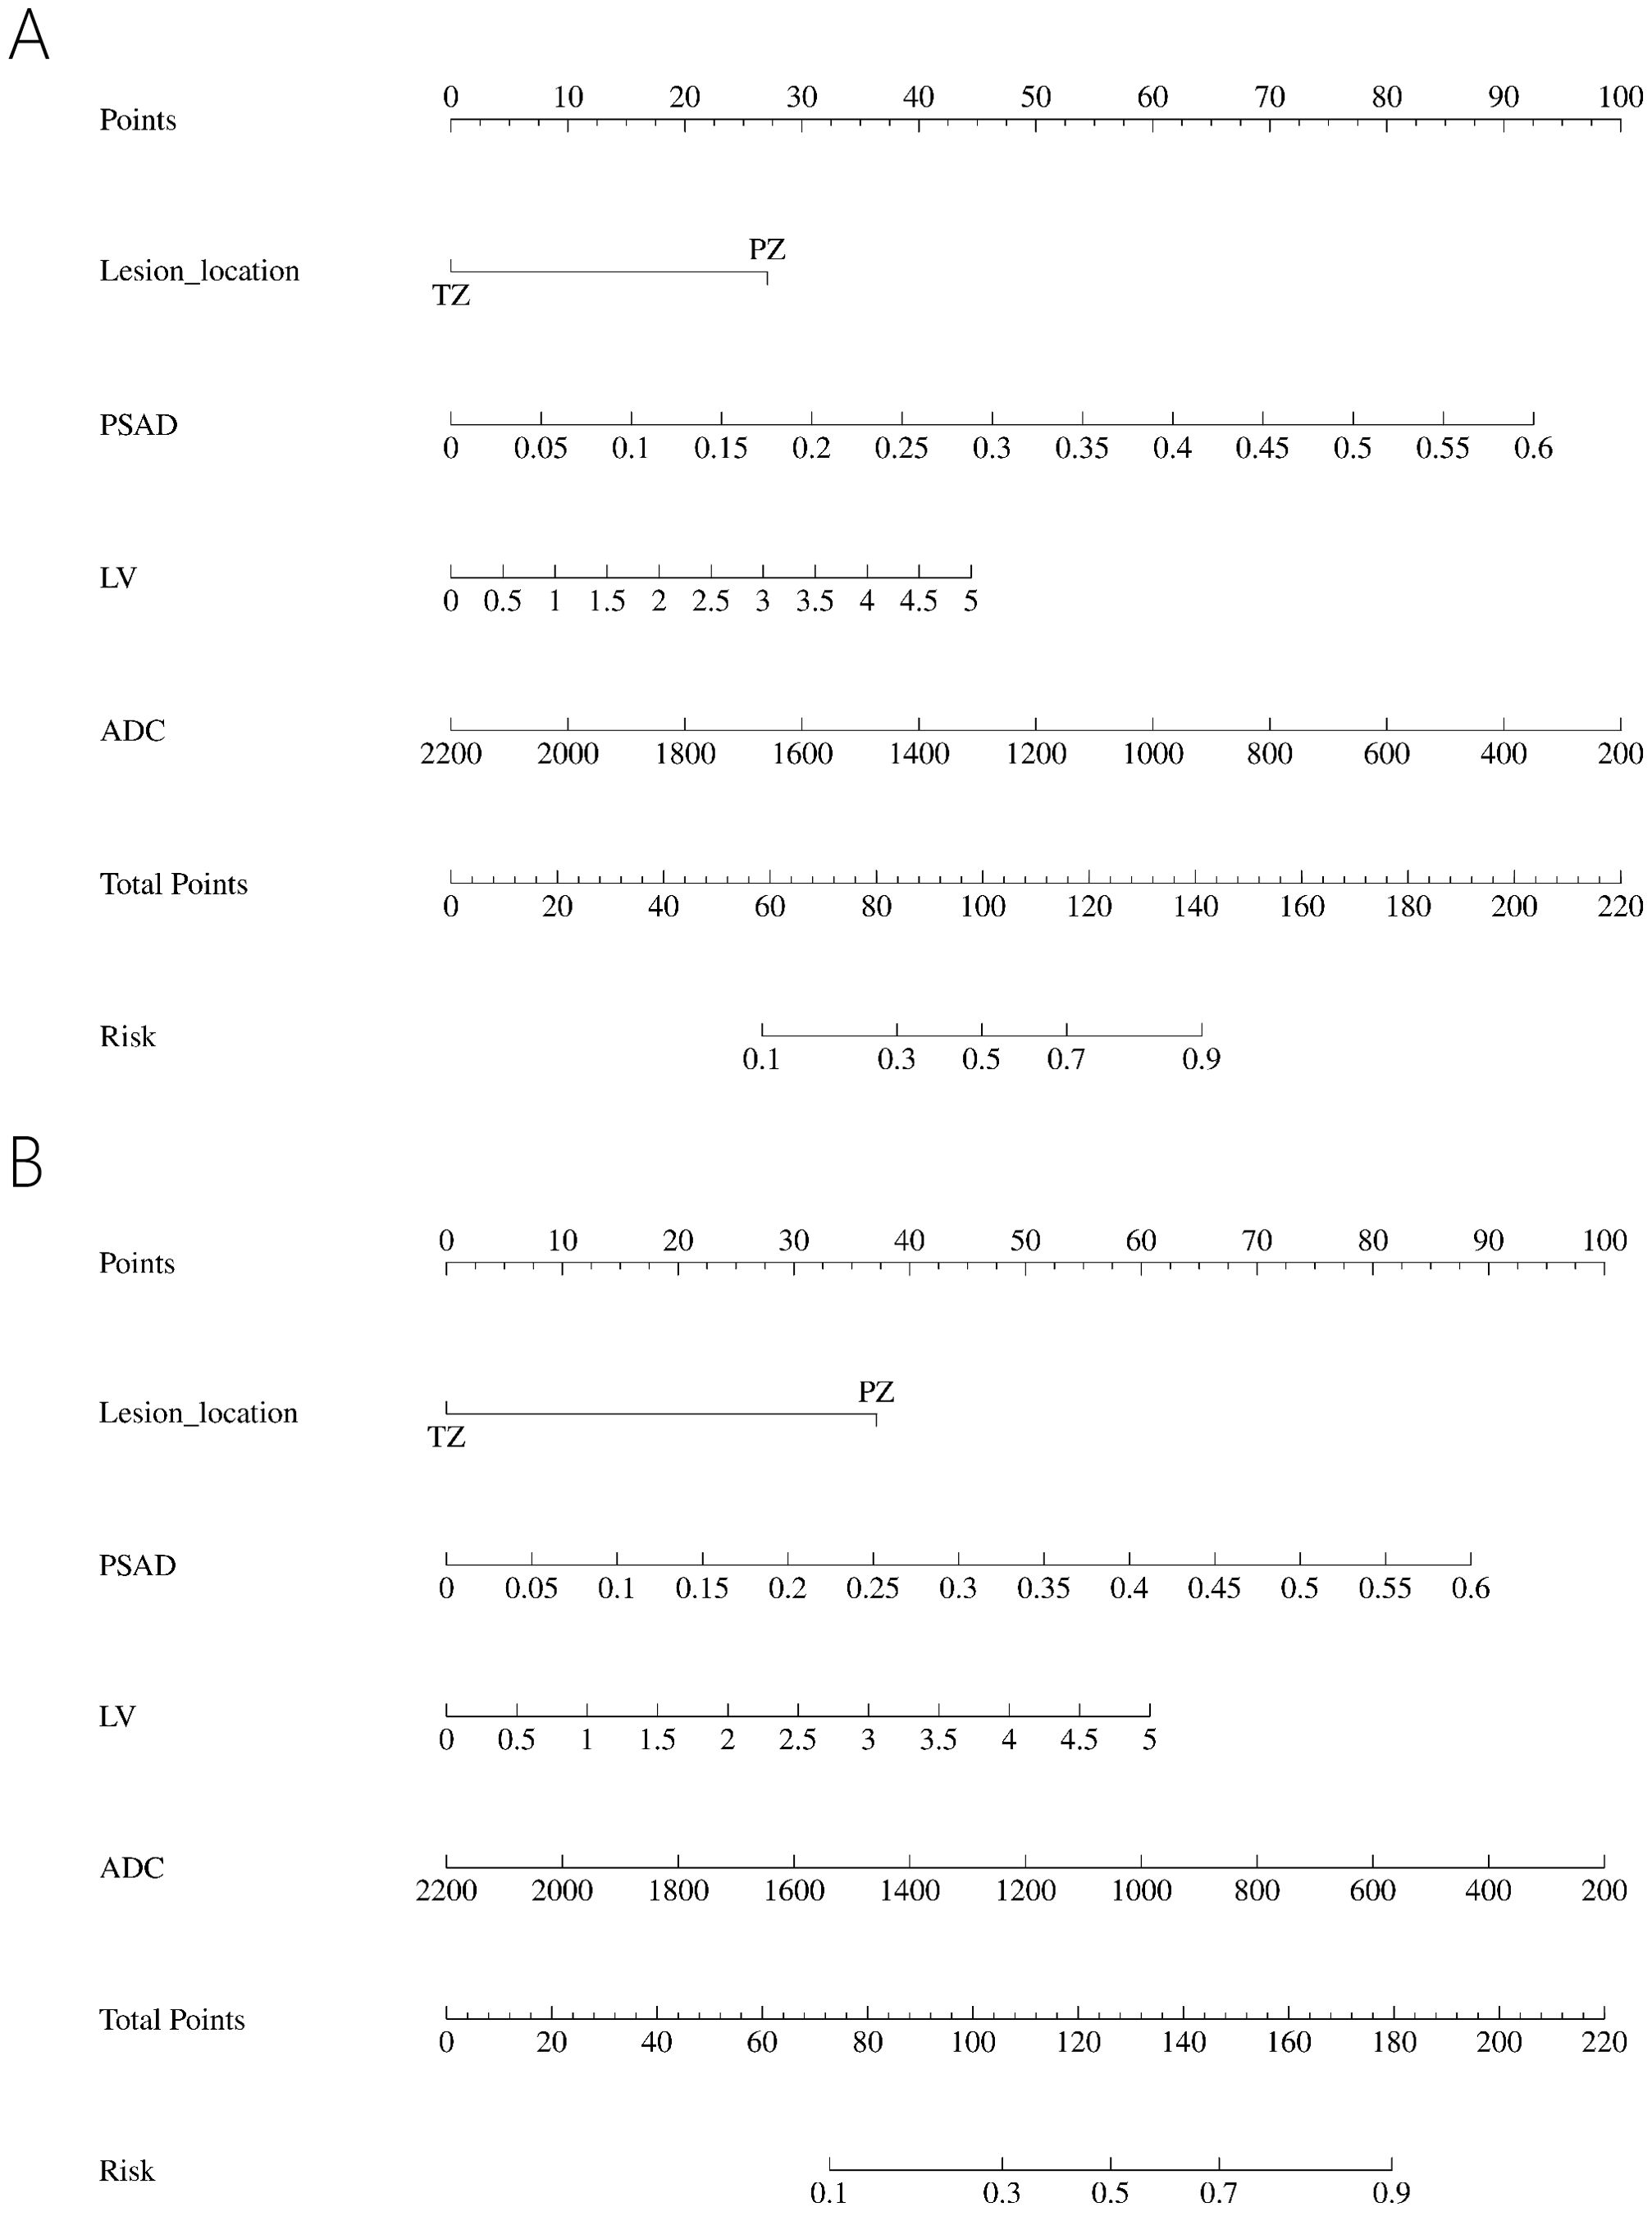
Figure 2. Nomogram predicting PCa (A) and predicting csPCa (B) in PI-RADS scores 1-3 population.
To further explore the risk factors for PCa in patients with PI-RADS scores 1-2 and PI-RADS score 3. We divided the 327 patients into two subgroups: PI-RADS scores 1-2 and PI-RADS score 3. The demographic, clinical, and imaging features of the patients are listed in Table 4.
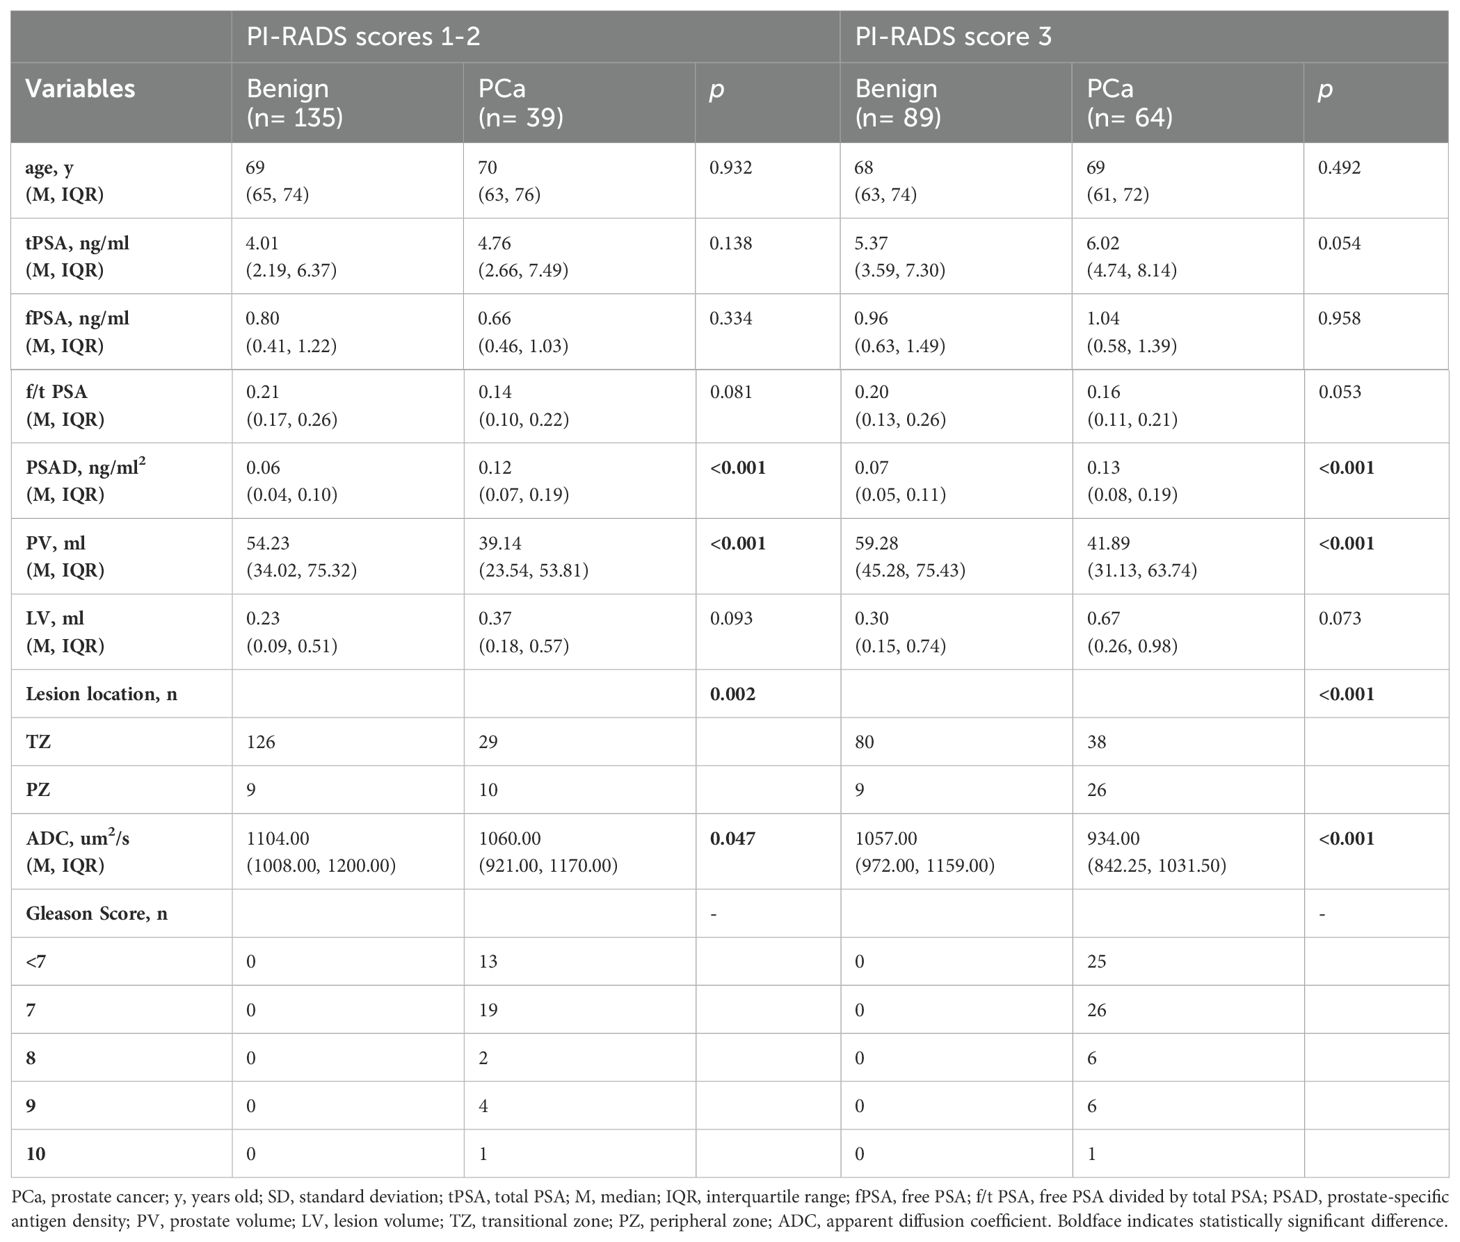
Table 4. Comparison of variables for benign and PCa in PI-RADS scores 1-2 population and PI-RADS score 3 population.
In the PI-RADS scores 1-2 subgroup, patients with PCa exhibited higher PSAD, lower PV, lower ADC, and more lesions in the PZ compared to those with benign. Independent risk factors for PCa were explored through univariable and multivariable logistic regression analyses (Table 5). PSAD and lesion location were screened out to develop the nomogram (Figure 3A).
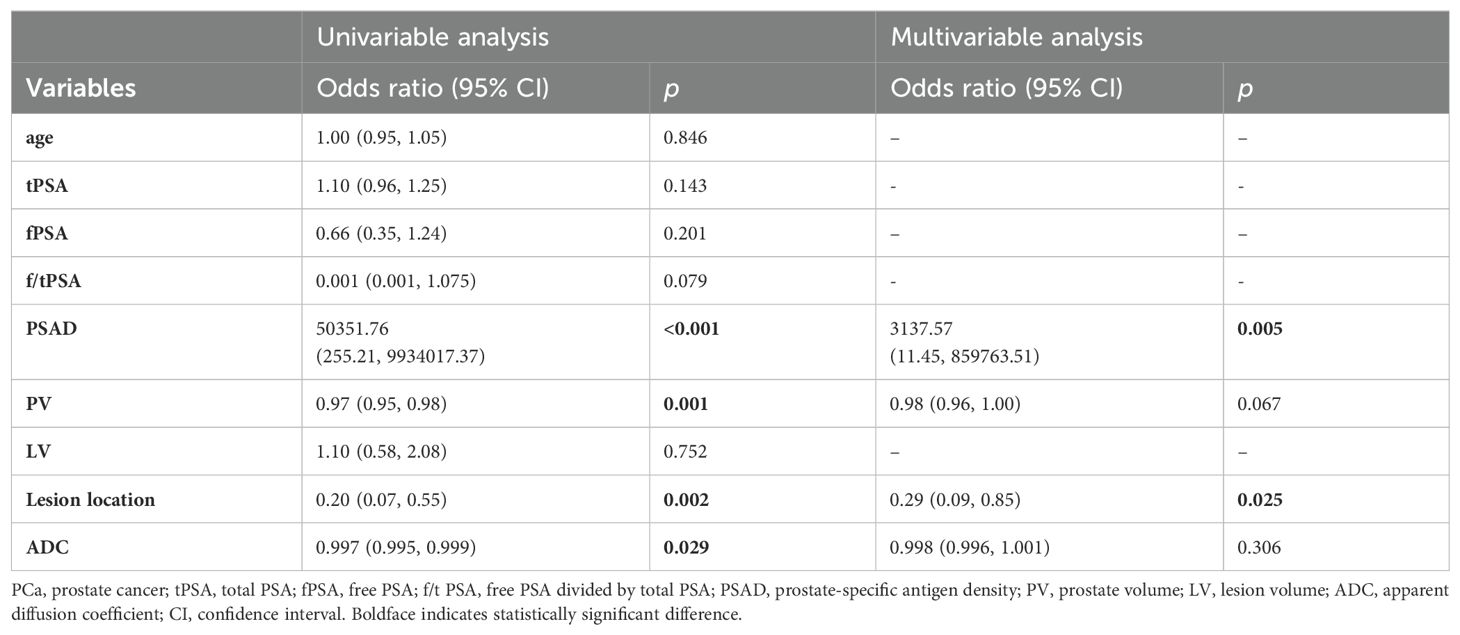
Table 5. Univariable and multivariable binary logistic regression analysis testing variables as independent risk factors of PCa in PI-RADS scores 1-2 population.
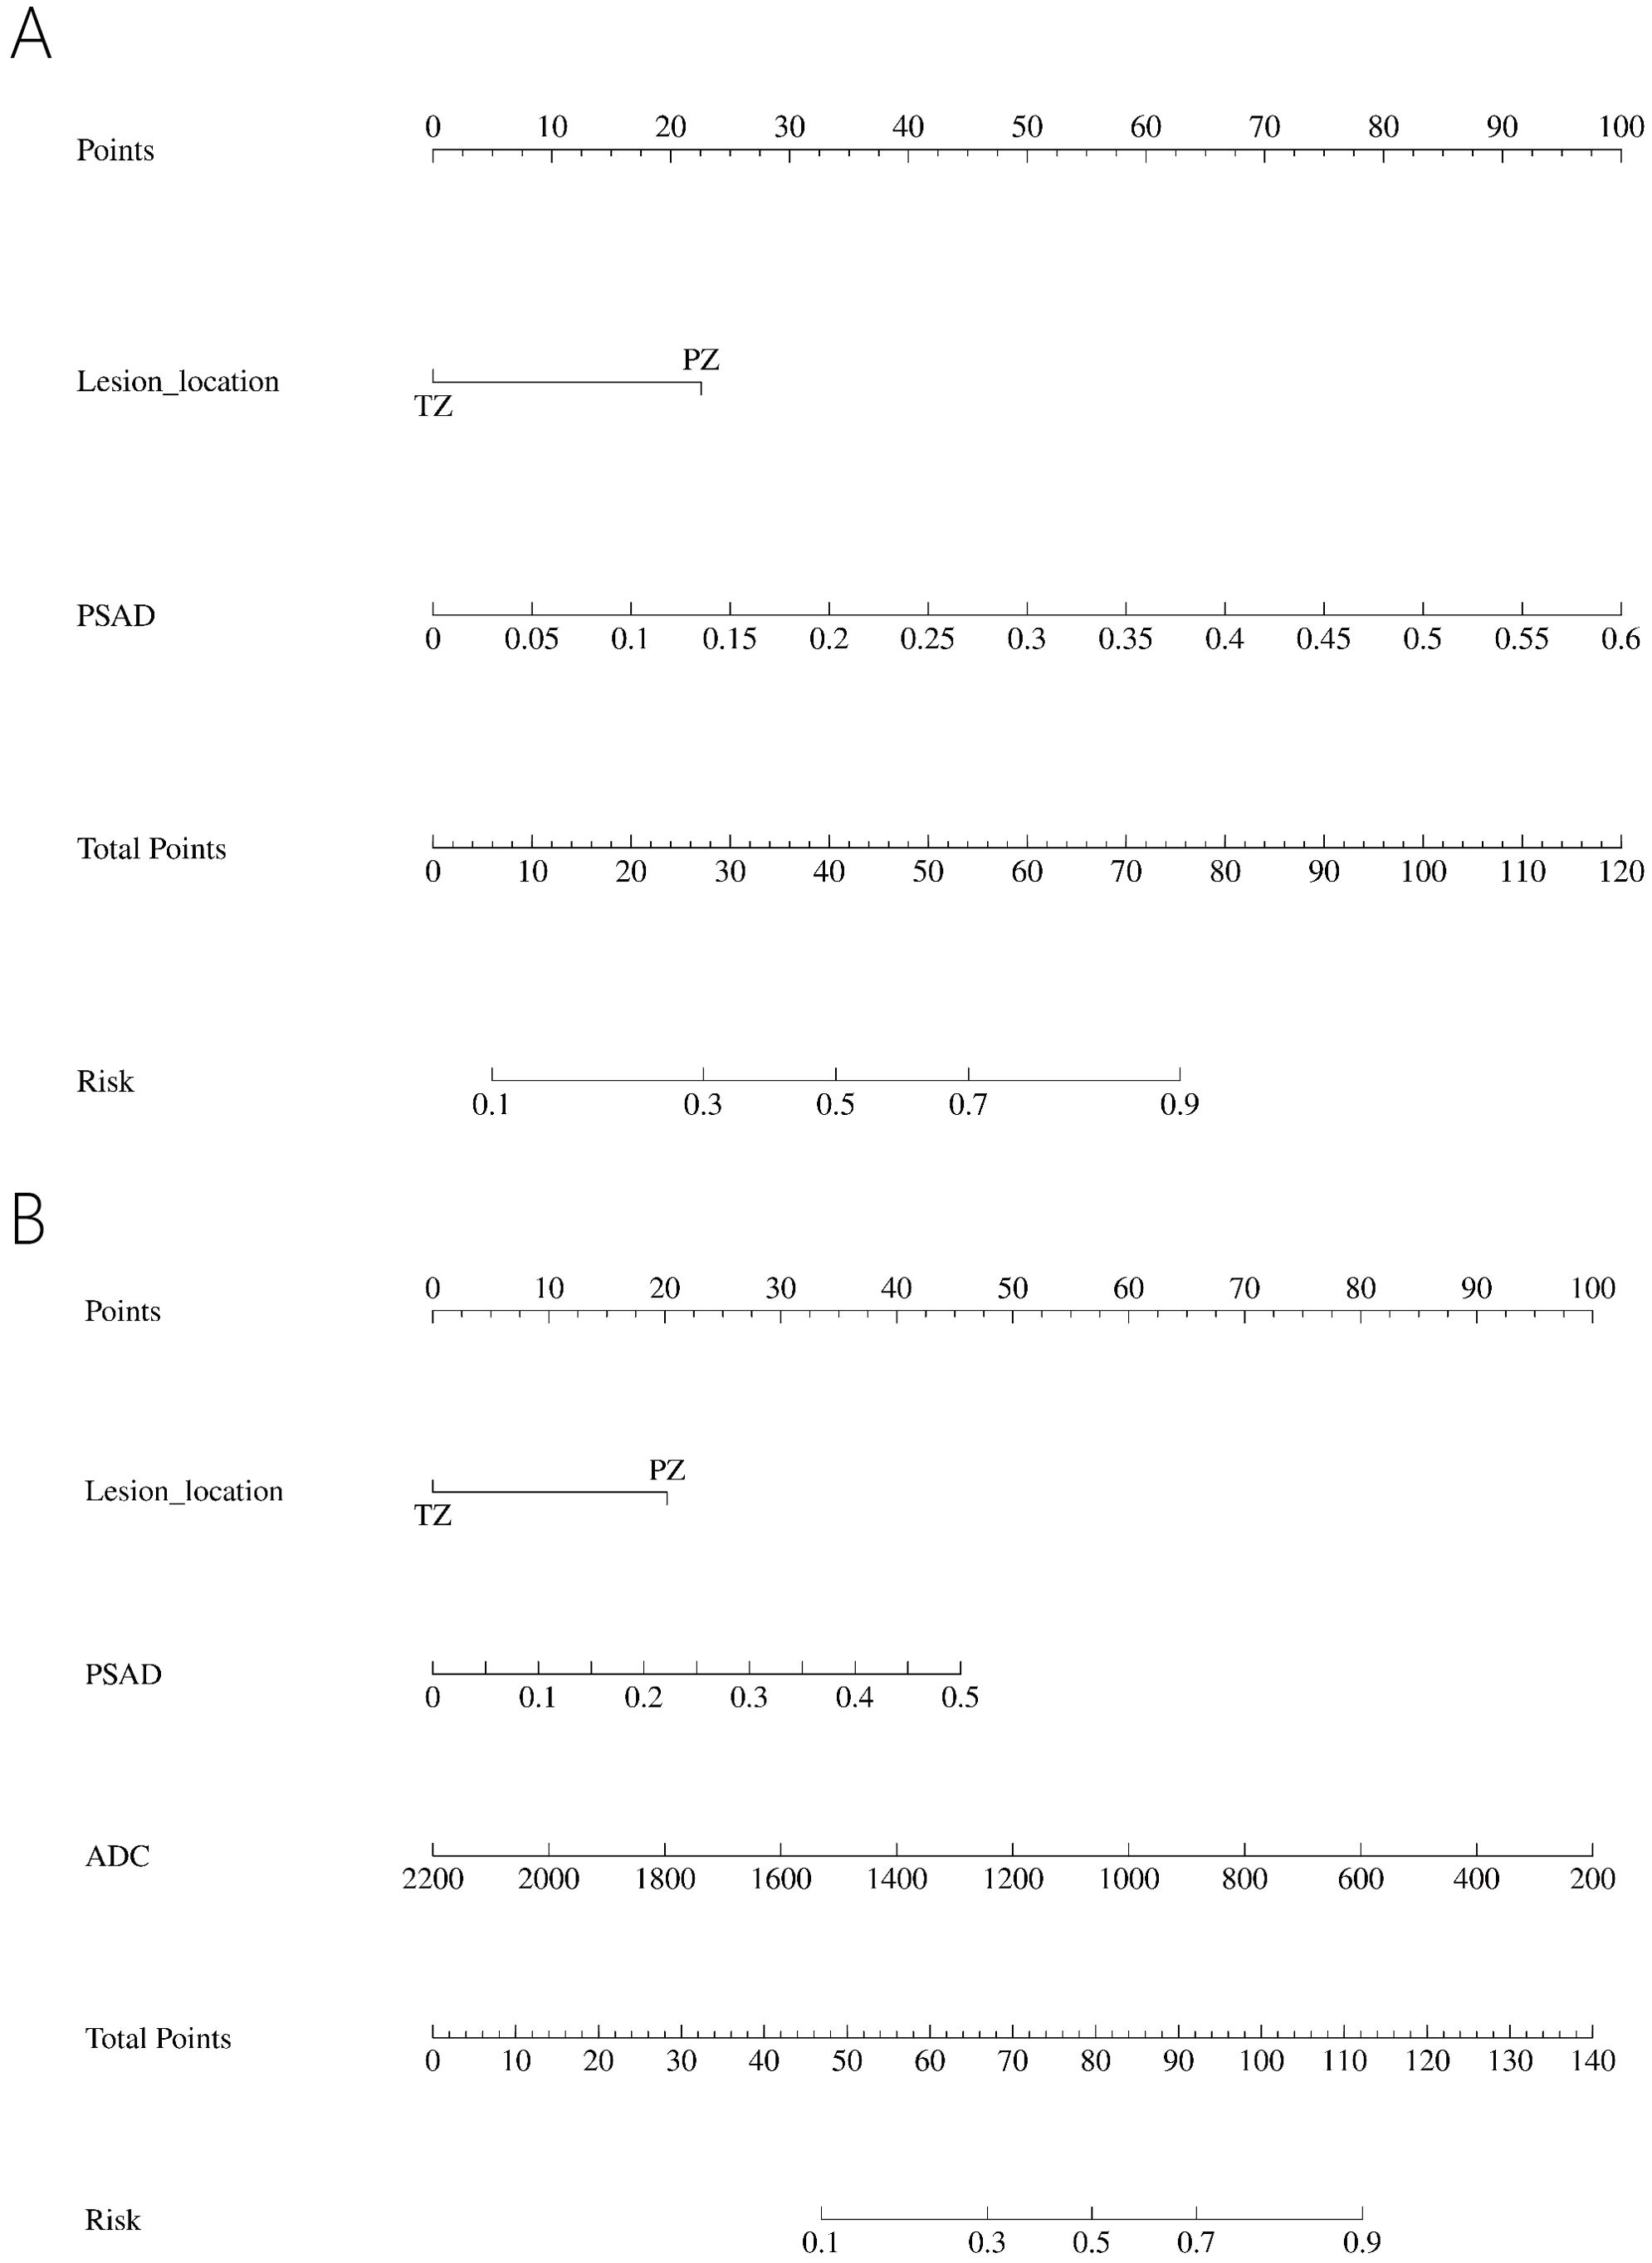
Figure 3. Nomogram predicting PCa in PI-RADS scores 1-2 population (A) and PI-RADS score 3 population (B).
In the PI-RADS score 3 subgroup, higher PSAD, lower PV, lower ADC, and lesions located mostly in the PZ were also observed in patients with PCa compared to those with benign. Logistic regression analysis identified PSAD, ADC, and lesion location as independent risk factors for PCa (Table 6), leading to the development of another nomogram for this subgroup (Figure 3B).
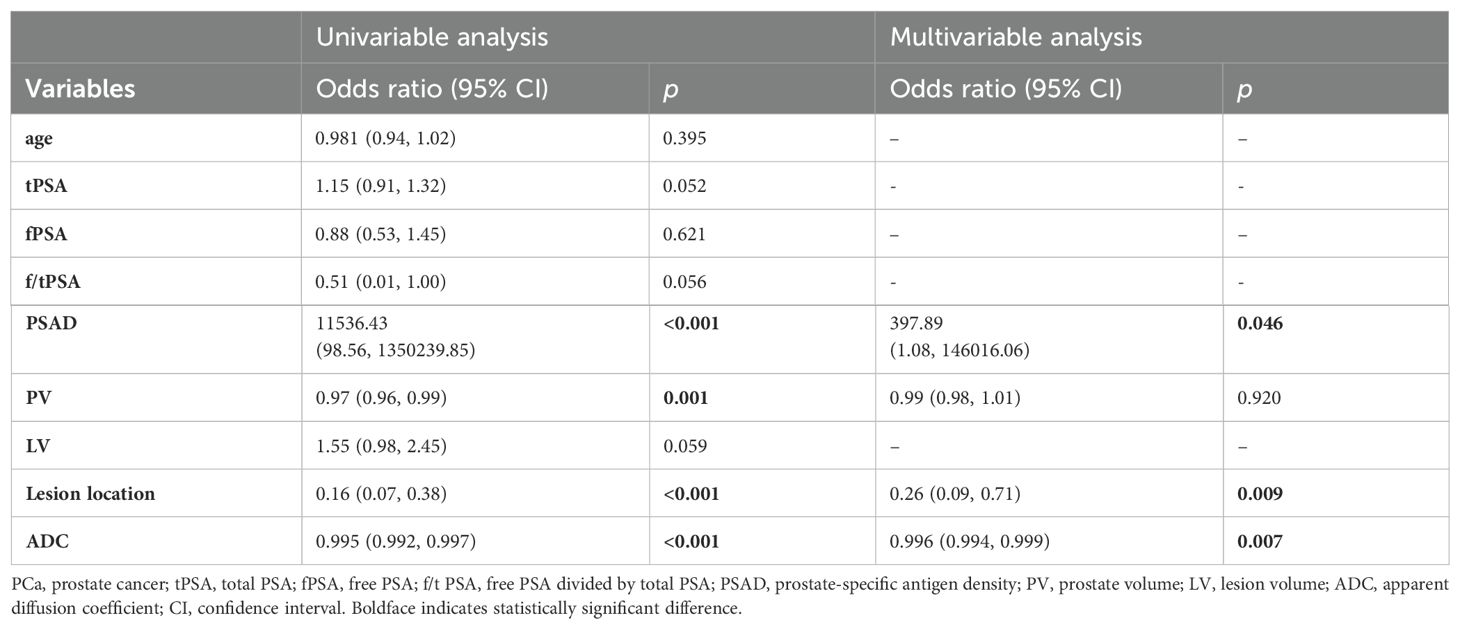
Table 6. Univariable and multivariable binary logistic regression analysis testing variables as independent risk factors of PCa in PI-RADS score 3 population.
Nomogram evaluation
All four nomograms showed acceptable discrimination through internal validation with 1000 bootstrap resamples. In patients with PI-RADS scores 1-3, the C-index was 0.775 for PCa and 0.779 for csPCa. In patients with PI-RADS scores 1-2, the C-index was 0.749 for PCa. In patients with PI-RADS score 3, the C-index was 0.777 for PCa.
Calibration curves showed good concordance between the predicted probability and the actual probability for the four nomograms. For patients with PI-RADS scores 1-3, the risk may be overestimated when the threshold exceeds 36% for PCa and 56% for csPCa (Figures 4A, B). For patients with PI-RADS scores 1-2, the risk may be overestimated when the threshold is above 33% for PCa (Figure 4C). For patients with PI-RADS score 3, the risk may be overestimated when the threshold is greater than 41% for PCa (Figure 4D).
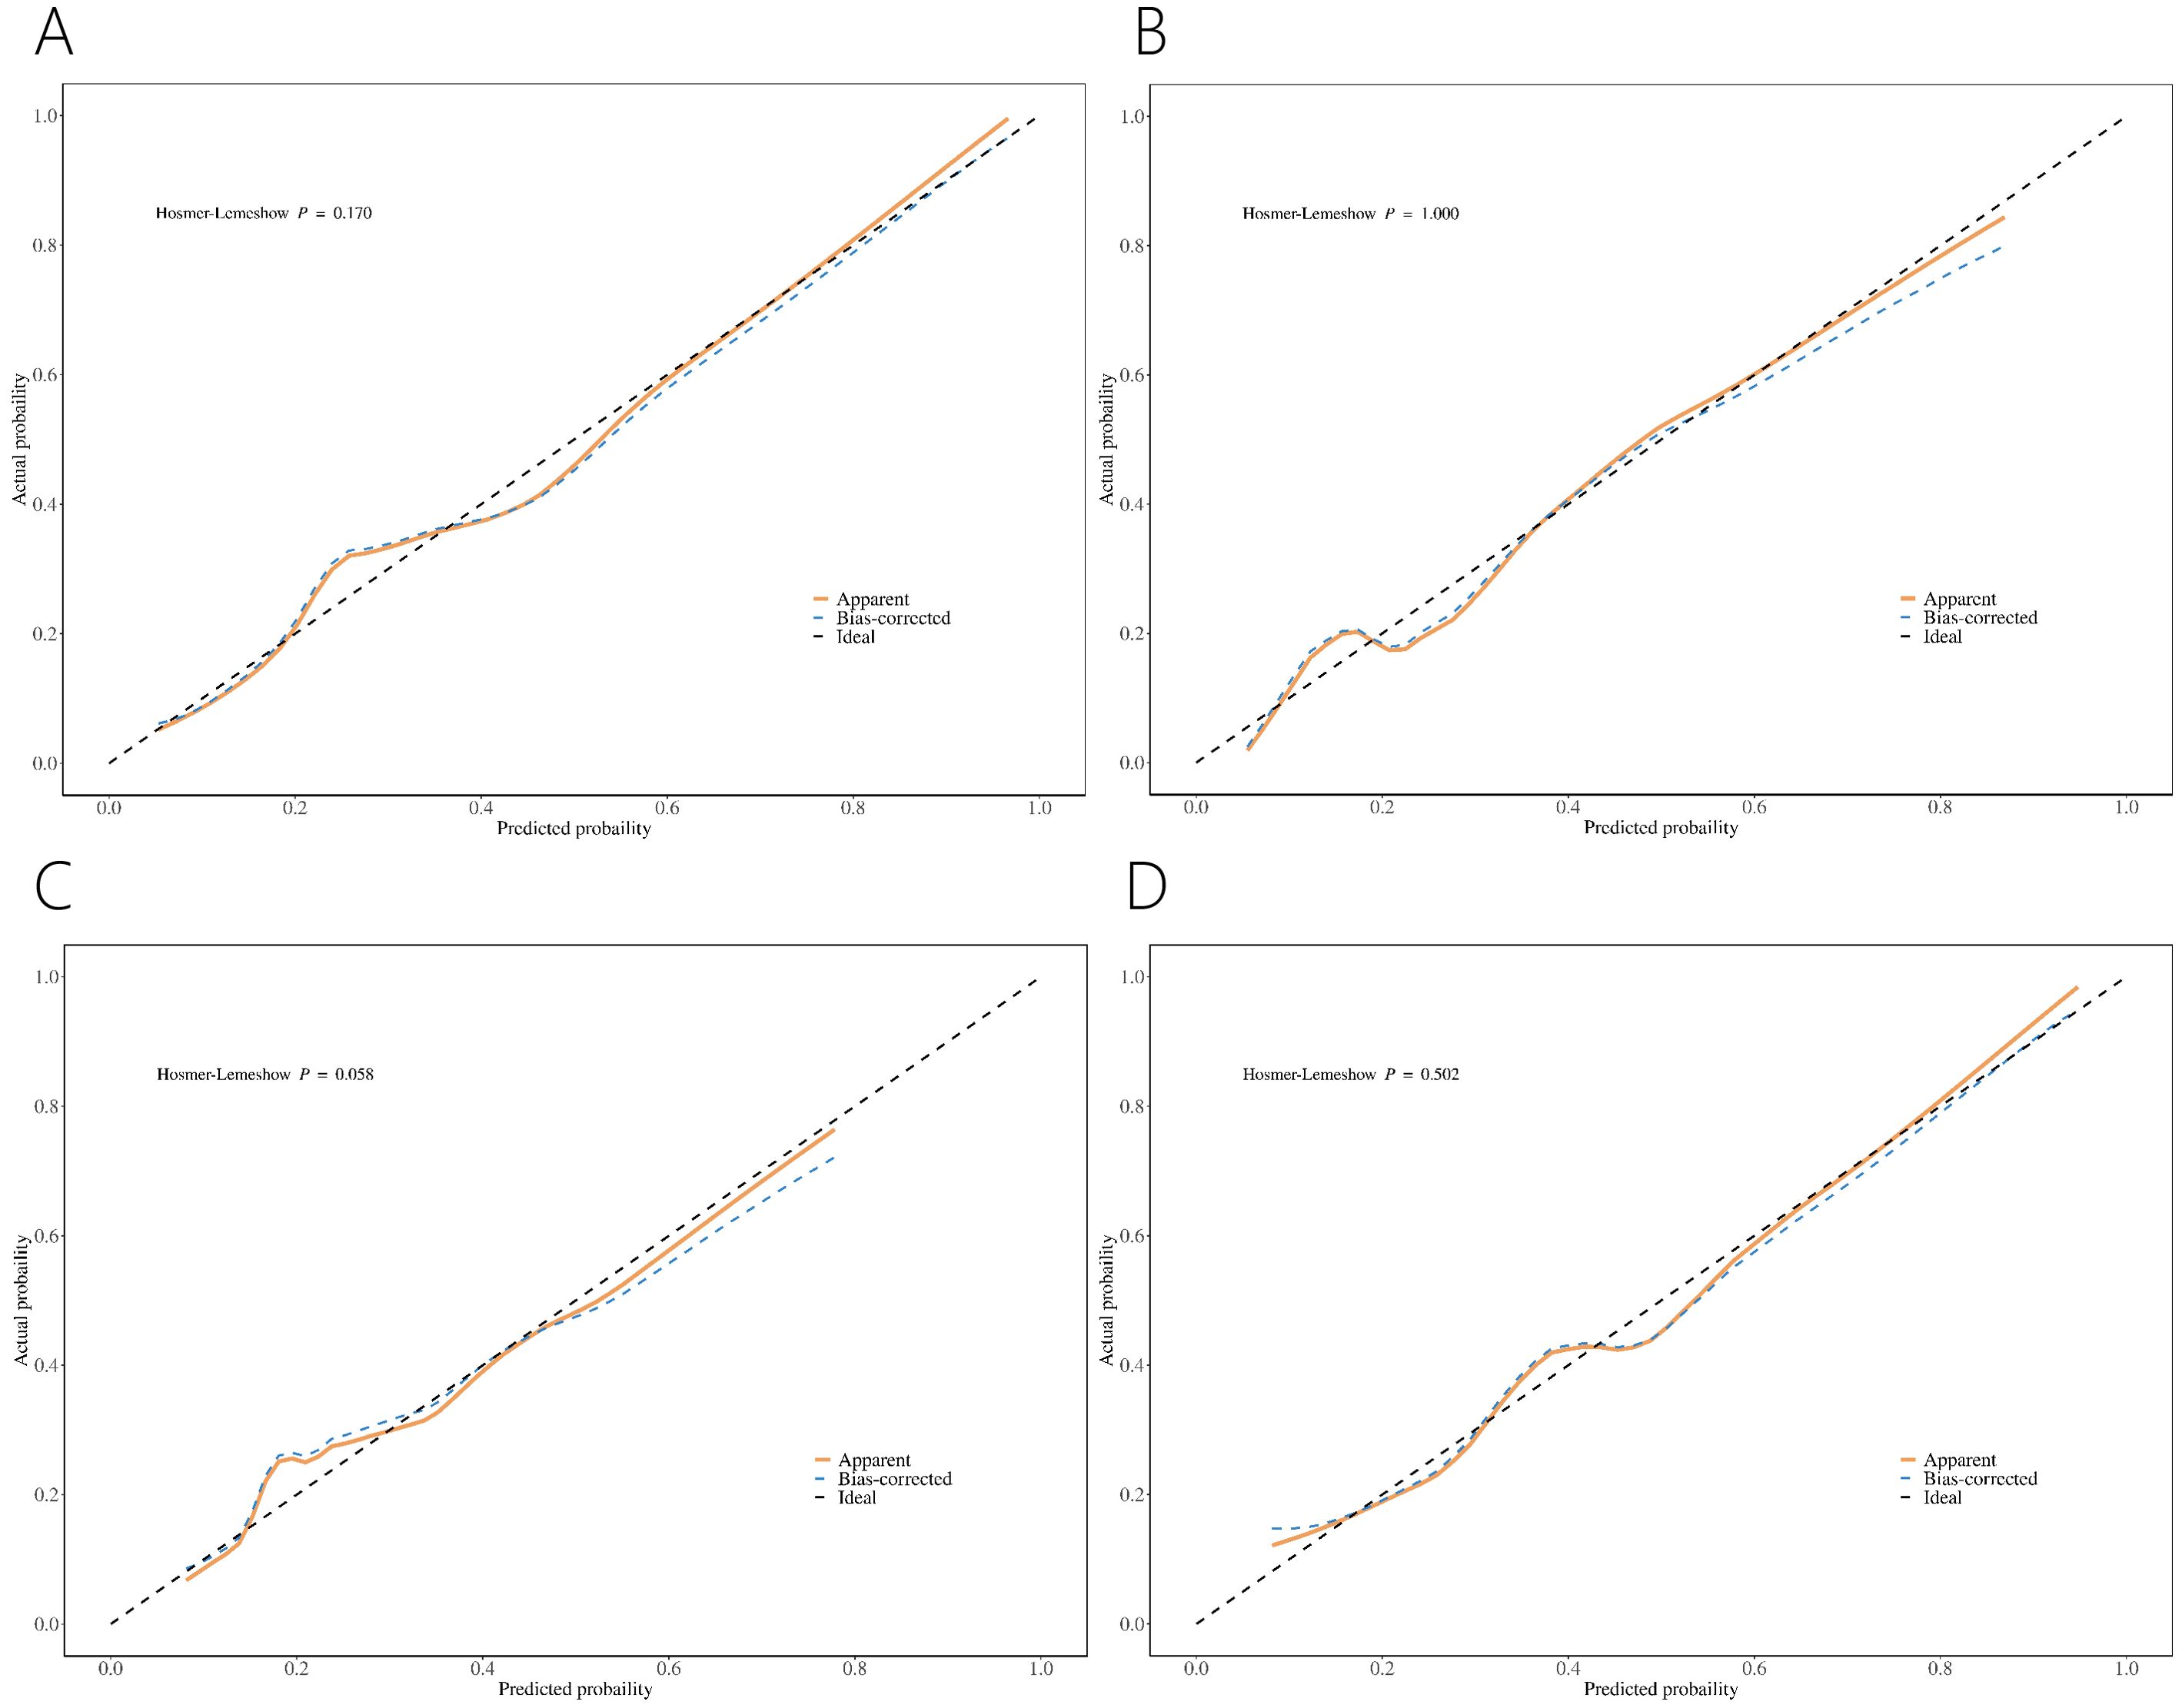
Figure 4. Calibration curve of nomograms for PCa (A) and csPCa (B) in PI-RADS scores 1-3 population. Calibration curve of nomograms for PCa in PI-RADS scores 1-2 population (C) and PI-RADS score 3 population (D).
Decision curve analysis (DCA) revealed greater net benefits for predicted probabilities between 10% and 95% for the four nomograms (Figure 5).
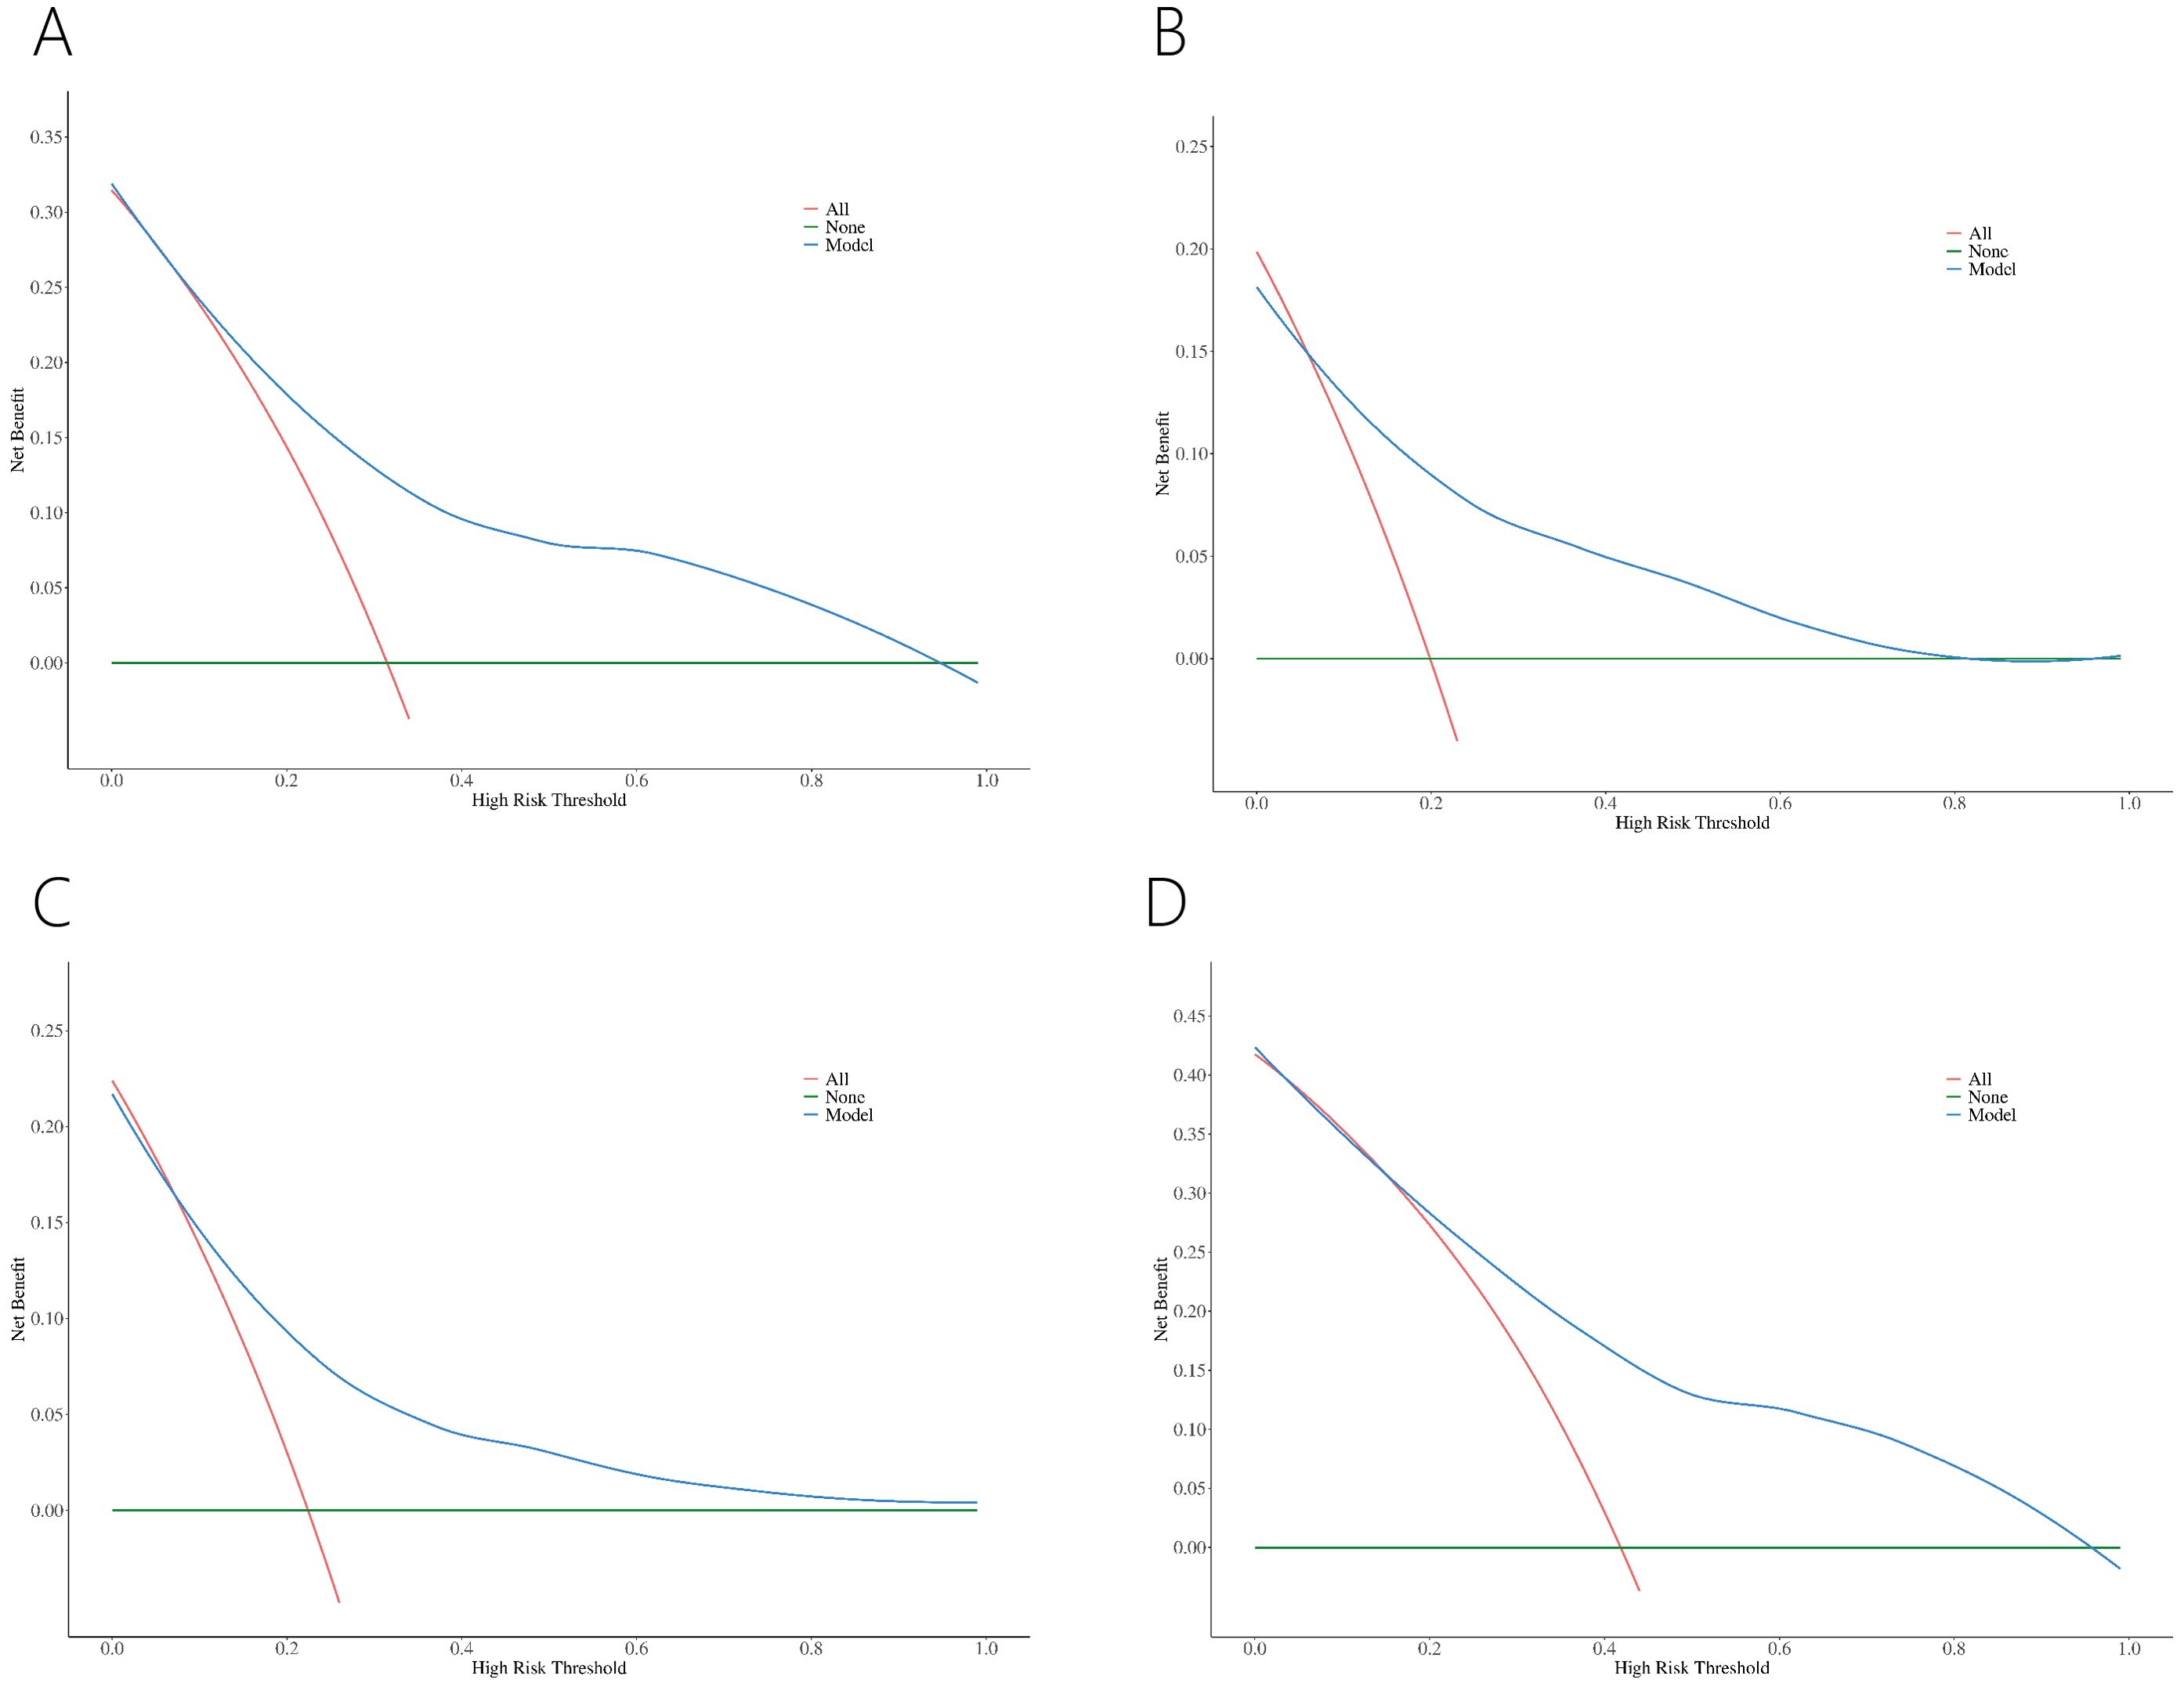
Figure 5. DCA of nomograms for PCa (A) and csPCa (B) in PI-RADS scores 1-3 population. DCA of nomograms for PCa in PI-RADS scores 1-2 population (C) and PI-RADS score 3 population (D).
ROC showed acceptable discrimination for the four nomograms (Figure 6, Table 7). For patients with PI-RADS scores 1-3, the AUC for predicting PCa and csPCa were 0.78 and 0.79, with sensitivity of 0.68 and 0.57, and specificity of 0.80 and 0.83, respectively (Figures 6A, B). For patients with PI-RADS scores 1-2, the AUC for predicting PCa was 0.75, with a sensitivity of 0.71 and specificity of 0.74 (Figure 6C). For patients with PI-RADS score 3, the AUC for predicting PCa was 0.78, with a sensitivity of 0.71 and specificity of 0.72 (Figure 6D). Thus, dividing the samples into PI-RADS scores 1-2 subgroup and PI-RADS score 3 subgroups did not improve the AUC of predicting PCa.
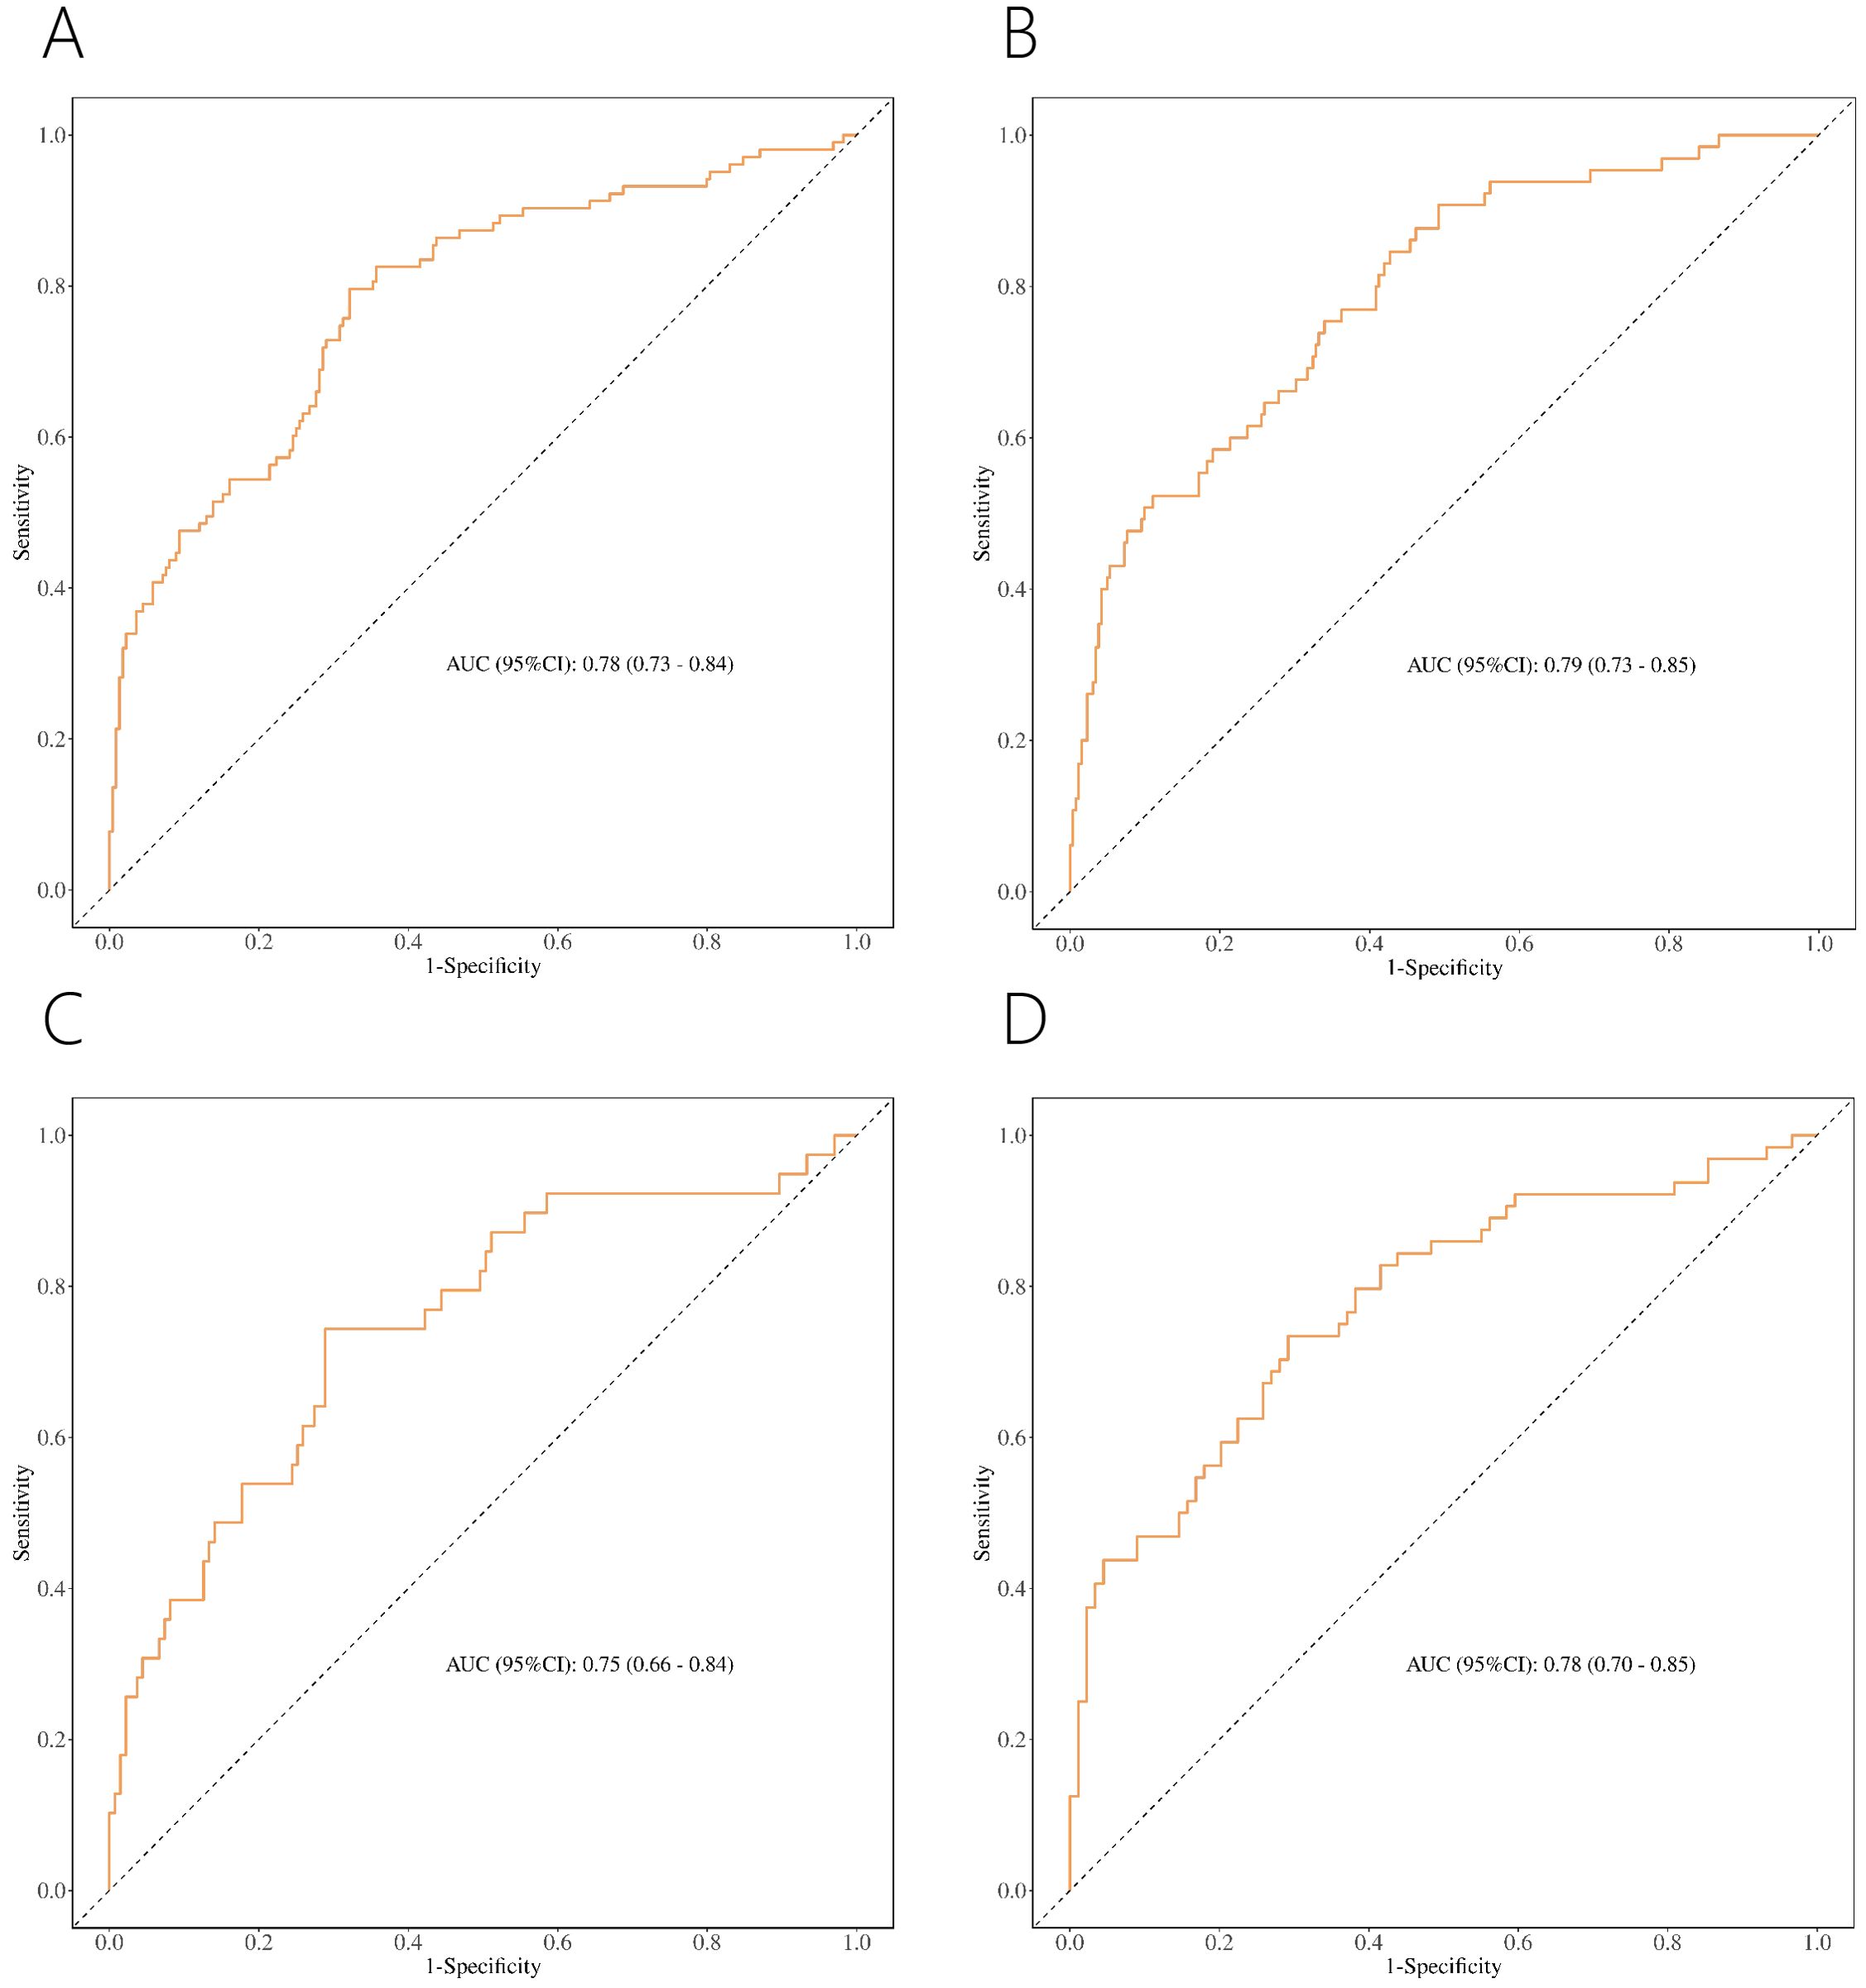
Figure 6. ROC of nomograms for PCa (A) and csPCa (B) in PI-RADS scores 1-3 population. ROC of nomograms for PCa in PI-RADS scores 1-2 population (C) and PI-RADS score 3 population (D).
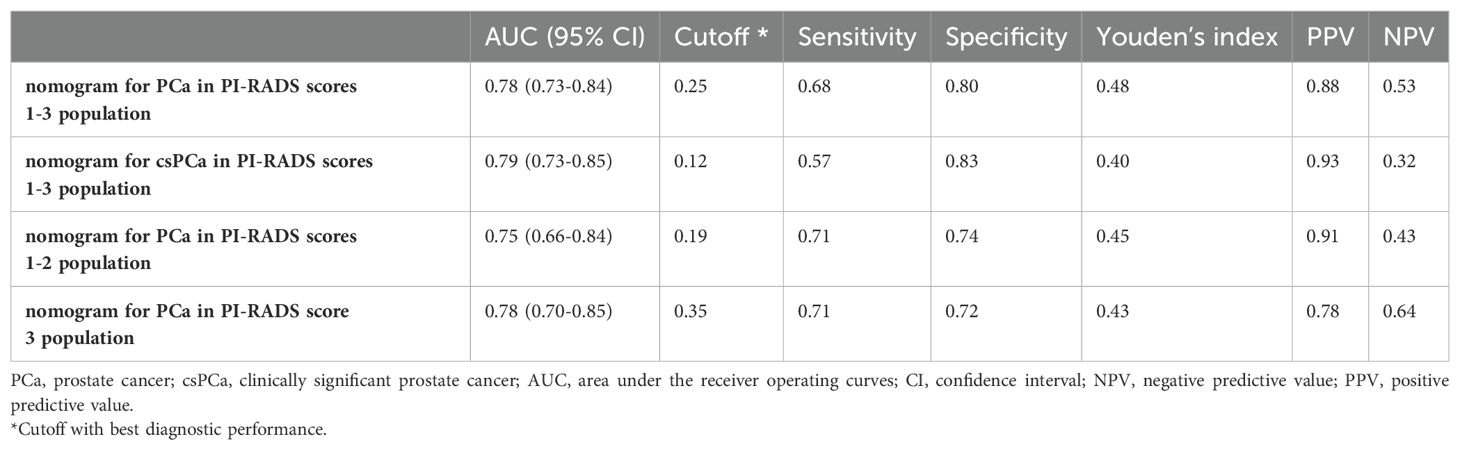
Table 7. Nomograms’ discrimination for PCa or csPCa.
The number of avoided biopsies was calculated at a sensitivity of 0.85 to further analyze the clinical utility of each nomogram (Table 8). Biopsy could be avoided by at least 36.60% through nomograms.
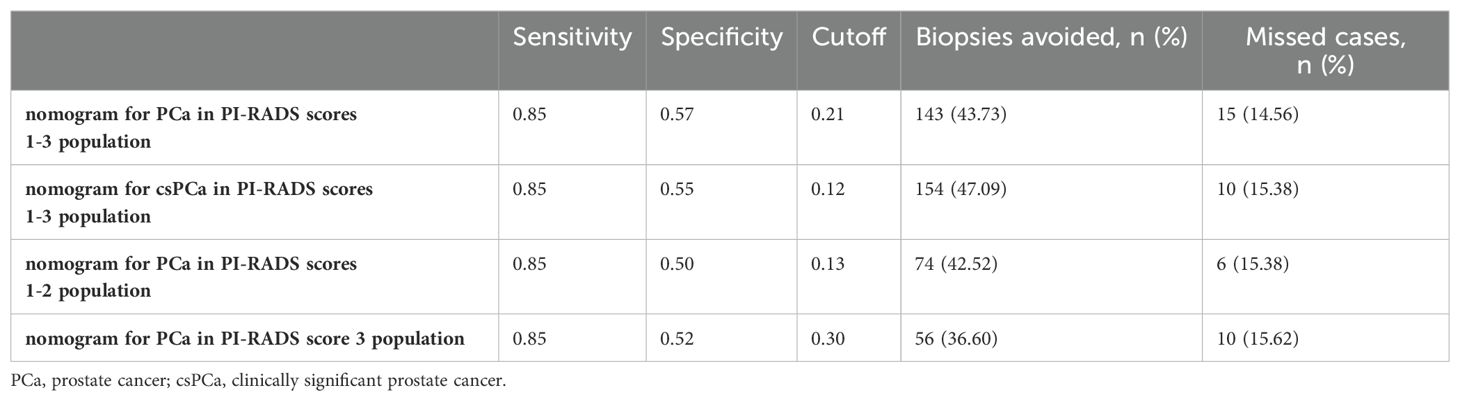
Table 8. Avoiding biopsy numbers at a sensitivity of 0.85 for nomogram.
Discussion
Multiple models have been developed to predict PCa and csPCa, focusing primarily on population with PI-RADS score 3 or PSA < 10 ng/ml, but fewer studies have addressed the population with PI-RADS scores 1-3, regardless of PSA level (11, 16, 17). To our knowledge, no model has been developed to predict PCa or csPCa in special population of PI-RADS scores 1-3 and PSA < 10 ng/ml. However, PCa and csPCa cases do occur in the PI-RADS scores 1-3 and PSA < 10 ng/ml, and are challenging to detect (18, 19). Accordingly, how to identify PCa or csPCa in the special population is still a challenge. In this study, we aimed to address this interesting issue.
We found that PSAD, LV, lesion location and ADC are independent risk factors for PCa. These findings are consistent with other studies highlighting these factors as predictors for PCa and csPCa in PI-RADS score 3 (20–23). Typically, lower ADC, higher PSAD, larger LV, and lesions in the PZ increase the likelihood of PCa or csPCa (20–24). Although some studies suggest age may also be a risk factor, we did not include it in our analysis due to the lack of significant age differences in our cohort and the conflicting results reported in the literature (25, 26).
We developed nomograms with acceptable discriminability for predicting PCa and csPCa in patients with PI-RADS scores 1-3, achieving AUC of 0.78 and 0.79, respectively (Figures 6A, B). Given the different risks of PCa for PI-RADS scores 1-2 versus PI-RADS score 3, and the varying recommendations for PBx (PBx is generally not recommended for PI-RADS scores 1-2 and is controversial for PI-RADS score 3) (9, 17), we further divided the population into two subgroups (PI-RADS scores 1-2 and PI-RADS score 3 subgroups). This allowed us to explore whether PCa could be predicted more accurately. Although the AUC for predicting PCa was 0.75 in PI-RADS scores 1-2 and 0.78 in PI-RADS score 3 (Figures 6C, D), these did not show improved discriminative ability compared to the nomogram for the PI-RADS scores 1-3 (AUC = 0.78). Accordingly, the nomogram for PI-RADS scores 1-3 appears to be the more practical choice for clinical application.
Previous studies have developed predictive models for PCa or csPCa, specifically for those with PI-RADS score 3 (15, 27–29). For example, Hectors et al. (27) developed radiomics classifier with an AUC of 0.76 for predicting csPCa in PI-RADS score 3, while Martorana et al. (15) developed nomogram with an AUC of 0.86 for the same score. These models demonstrate good discriminability. However, these studies did not address prediction in the context of PSA levels in the “gray zone” (PSA < 10 ng/ml). Research has indicated that PCa may be missed in the gray zone, potentially leading to delayed diagnosis and missed treatment opportunities (16). Our study, focusing on patients with PSA < 10 ng/ml and PI-RADS score 3, achieved an AUC of 0.78 for predicting PCa (Figure 6D), which underscores the importance of our findings for this specific population.
Few studies have developed nomograms for PCa or csPCa specifically in populations with PI-RADS scores 1-3 (12, 17). For example, Zhang et al. (12) developed nomogram to predict the absence of PCa and csPCa, achieving AUC of 0.75 and 0.76, respectively. However, their model may not be as clinically applicable because it does not directly provide a probability estimate for PCa or csPCa (30). Additionally, their study did not specifically address patients with PSA levels in the gray zone. In contrast, our nomogram, designed for PI-RADS scores 1-3 and PSA < 10 ng/ml, may be better suited for clinical practice (Figures 6A, B).
To our knowledge, no nomograms have been reported for predicting PCa in the population with PI-RADS scores 1-2 and PSA < 10 ng/ml (31). Although studies by Abdul et al. (17) and Buisset et al. (32) identified the presence of PCa in individuals with PI-RADS scores of 1-2, they did not develop prediction models. We constructed a nomogram (AUC = 0.75) specifically for this population, which may offer a valuable clinical tool for predicting PCa in individuals with PI-RADS scores 1-2 and PSA < 10 ng/ml (Figure 6C).
Our models demonstrated good concordance between predicted and actual probabilities (Figure 4). However, in clinical practice, it is important to evaluate whether the risk of PCa is being overestimated or underestimated. For instance, in a population with PI-RADS scores 1-3 and PSA < 10 ng/ml, the nomogram may overestimate the risk of PCa when the predicted probability exceeds 36%. Further evaluation is necessary to decide whether to proceed with PBx.
At a sensitivity of 85%, biopsy could be avoided by at least 36.60% through nomograms (Table 8). Although the results differed slightly from those of Hu et al. (11) and Yang et al. (22), our nomograms still had acceptable clinical utility.
This study has several limitations. First, it was conducted at a single center and lacked external validation, although internal validation through bootstrap demonstrated good discriminability. Second, the retrospective nature of the study introduces the potential of selection bias. Finally, the relatively small sample size limited further exploration of models for csPCa in patients with PI-RADS scores 1-2 and PI-RADS score 3.
In conclusion, for the specific population with PI-RADS scores 1-3 and PSA < 10 ng/ml, research on detecting PCa and csPCa to avoid unnecessary PBx is limited. To address this gap, we developed novel nomograms with acceptable discriminability for predicting PCa and csPCa in this population. These models can assist urologists in making informed decisions about whether to proceed with a PBx.
Data availability statement
The original contributions presented in the study are included in the article/supplementary material. Further inquiries can be directed to the corresponding author.
Ethics statement
The studies involving humans were approved by Ethics Committee of the Second Affiliated Hospital of Kunming Medical University. The studies were conducted in accordance with the local legislation and institutional requirements. Written informed consent for participation in this study was provided by the participants’ legal guardians/next of kin.
Author contributions
J-GC: Writing – original draft. Y-HL: Writing – original draft. C-XK: Writing – review & editing.
Funding
The author(s) declare financial support was received for the research, authorship, and/or publication of this article. This study was supported by the Kunming Medical University Graduate Innovation Fund Project (No. 2024S102) and the Special Project of the “Ten Thousand Talents Plan” in Yunnan Province (No. YNWR-MY-2020-055).
Conflict of interest
The authors declare that the research was conducted in the absence of any commercial or financial relationships that could be construed as a potential conflict of interest.
Publisher’s note
All claims expressed in this article are solely those of the authors and do not necessarily represent those of their affiliated organizations, or those of the publisher, the editors and the reviewers. Any product that may be evaluated in this article, or claim that may be made by its manufacturer, is not guaranteed or endorsed by the publisher.
References
1. Bray F, Laversanne M, Sung H, Ferlay J, Siegel RL, Soerjomataram I, et al. Global cancer statistics 2022: GLOBOCAN estimates of incidence and mortality worldwide for 36 cancers in 185 countries. CA: Cancer J Clin. (2024) 74:229–63. doi: 10.3322/caac.21834
2. Van Poppel H, Roobol MJ, Chandran A. Early detection of prostate cancer in the european union: combining forces with PRAISE-U. Eur Urol. (2023) 84:519–22. doi: 10.1016/j.eururo.2023.08.002
3. de V II, Meertens A, Hogenhout R, Remmers S, Roobol MJ. A detailed evaluation of the effect of prostate-specific antigen-based screening on morbidity and mortality of prostate cancer: 21-year follow-up results of the rotterdam section of the european randomised study of screening for prostate cancer. Eur Urol. (2023) 84:426–34. doi: 10.1016/j.eururo.2023.03.016
4. Hugosson J, Månsson M, Wallström J, Axcrona U, Carlsson SV, Egevad L, et al. Prostate cancer screening with PSA and MRI followed by targeted biopsy only. New Engl J Med. (2022) 387:2126–37. doi: 10.1056/NEJMoa2209454
5. Fenton JJ, Weyrich MS, Durbin S, Liu Y, Bang H, Melnikow J. Prostate-specific antigen-based screening for prostate cancer: evidence report and systematic review for the US preventive services task force. Jama. (2018) 319:1914–31. doi: 10.1001/jama.2018.3712
6. Barentsz JO, Richenberg J, Clements R, Choyke P, Verma S, Villeirs G, et al. ESUR prostate MR guidelines 2012. Eur Radiol. (2012) 22:746–57. doi: 10.1007/s00330-011-2377-y
7. Turkbey B, Rosenkrantz AB, Haider MA, Padhani AR, Villeirs G, Macura KJ, et al. Prostate imaging reporting and data system version 2.1: 2019 update of prostate imaging reporting and data system version 2. Eur Urol. (2019) 76:340–51. doi: 10.1016/j.eururo.2019.02.033
8. Turkbey B, Purysko AS. PI-RADS: where next? Radiology. (2023) 307:e223128. doi: 10.1148/radiol.223128
9. Nicola R, Bittencourt LK. PI-RADS 3 lesions: a critical review and discussion of how to improve management. Abdominal Radiol (New York). (2023) 48:2401–5. doi: 10.1007/s00261-023-03929-7
10. Yim K, Ma C, Carlsson S, Lilja H, Mucci L, Penney K, et al. Free PSA and clinically significant and fatal prostate cancer in the PLCO screening trial. J Urol. (2023) 210:630–8. doi: 10.1097/ju.0000000000003603
11. Hu C, Sun J, Xu Z, Zhang Z, Zhou Q, Xu J, et al. Development and external validation of a novel nomogram to predict prostate cancer in biopsy-naïve patients with PSA <10 ng/ml and PI-RADS v2.1 = 3 lesions. Cancer Med. (2023) 12:2560–71. doi: 10.1002/cam4.5100
12. Zhang Y, Zeng N, Zhang F, Huang Y, Tian Y. How to make clinical decisions to avoid unnecessary prostate screening in biopsy-naïve men with PI-RADs v2 score ≤ 3? Int J Clin Oncol. (2020) 25:175–86. doi: 10.1007/s10147-019-01524-9
13. Ploussard G, Epstein JI, Montironi R, Carroll PR, Wirth M, Grimm MO, et al. The contemporary concept of significant versus insignificant prostate cancer. Eur Urol. (2011) 60:291–303. doi: 10.1016/j.eururo.2011.05.006
14. Rosenkrantz AB, Padhani AR, Chenevert TL, Koh DM, De Keyzer F, Taouli B, et al. Body diffusion kurtosis imaging: Basic principles, applications, and considerations for clinical practice. J magnetic resonance imaging: JMRI. (2015) 42:1190–202. doi: 10.1002/jmri.24985
15. Martorana E, Aisa MC, Grisanti R, Santini N, Pirola GM, Datti A, et al. Lesion volume in a bi- or multivariate prediction model for the management of PI-RADS v2.1 score 3 category lesions. Turkish J Urol. (2022) 48:268–77. doi: 10.5152/tud.2022.22038
16. Möller F, Månsson M, Wallström J, Hellström M, Hugosson J, Arnsrud Godtman R. Prostate cancers in the prostate-specific antigen interval of 1.8-3 ng/ml: results from the göteborg-2 prostate cancer screening trial. Eur Urol. (2024) 86:95–100. doi: 10.1016/j.eururo.2024.01.017
17. Abdul Raheem R, Razzaq A, Beraud V, Menzies-Wilson R, Odeh R, Ibiok I, et al. Can a prostate biopsy be safely deferred on PI-RADS 1,2 or 3 lesions seen on pre-biopsy mp-MRI? Arab J Urol. (2023) 21:10–7. doi: 10.1080/2090598x.2022.2119711
18. Li T, Sun L, Li Q, Luo X, Luo M, Xie H, et al. Development and validation of a radiomics nomogram for predicting clinically significant prostate cancer in PI-RADS 3 lesions. Front Oncol. (2021) 11:825429. doi: 10.3389/fonc.2021.825429
19. Roddam AW, Duffy MJ, Hamdy FC, Ward AM, Patnick J, Price CP, et al. Use of prostate-specific antigen (PSA) isoforms for the detection of prostate cancer in men with a PSA level of 2-10 ng/ml: systematic review and meta-analysis. Eur Urol. (2005) 48:386–99; discussion 98-9. doi: 10.1016/j.eururo.2005.04.015
20. Dong Q, Wang C, Shen D, Ma Y, Zhang B, Xu S, et al. Combination of prostate volume and apparent diffusion coefficient can stratify patients with a PI-RADS score of 3 to reduce unnecessary prostate biopsies. Prostate. (2024) 84:780–7. doi: 10.1002/pros.24695
21. Pepe P, Garufi A, Priolo GD, Pennisi M, Fraggetta F. Early second round targeted biopsy of PI-RADS score 3 or 4 in 256 men with persistent suspicion of prostate cancer. In Vivo (Athens Greece). (2019) 33:897–901. doi: 10.21873/invivo.11556
22. Yang S, Zhao W, Tan S, Zhang Y, Wei C, Chen T, et al. Combining clinical and MRI data to manage PI-RADS 3 lesions and reduce excessive biopsy. Trans Andrology Urol. (2020) 9:1252–61. doi: 10.21037/tau-19-755
23. Scialpi M, Martorana E, Aisa MC, Rondoni V, D’Andrea A, Bianchi G. Score 3 prostate lesions: a gray zone for PI-RADS v2. Turkish J Urol. (2017) 43:237–40. doi: 10.5152/tud.2017.01058
24. Wang W, Shao ZH, Huang XH, Xu Y, Feng X, Wang PJ. Effects of dynamic contrast enhancement on diffusion weighted imaging score of 3 in prostate imaging reporting and data system version 2 of peripheral zone. Zhonghua yi xue za zhi. (2020) 100:1002–6. doi: 10.3760/cma.j.cn112137-20190816-01820
25. Kim M, Ryu H, Lee HJ, Hwang SI, Choe G, Hong SK. Who can safely evade a magnetic resonance imaging fusion-targeted biopsy (MRIFTB) for prostate imaging reporting and data system (PI-RADS) 3 lesion? World J Urol. (2021) 39:1463–71. doi: 10.1007/s00345-020-03352-3
26. Liang Z, Feng T, Zhou Y, Yang Y, Sun Y, Zhou Z, et al. Nomograms for predicting clinically significant prostate cancer in men with PI-RADS-3 biparametric magnetic resonance imaging. Am J Cancer Res. (2024) 14:73–85. doi: 10.62347/xbbi9870
27. Hectors SJ, Chen C, Chen J, Wang J, Gordon S, Yu M, et al. Magnetic resonance imaging radiomics-based machine learning prediction of clinically significant prostate cancer in equivocal PI-RADS 3 lesions. J magnetic resonance imaging: JMRI. (2021) 54:1466–73. doi: 10.1002/jmri.27692
28. Shi J, Li D, Chen M, Fu Y, Peng S, Zhang Q, et al. The value of (68)Ga-PSMA PET/MRI for classifying patients with PI-RADS 3 lesions on multiparametric MRI: A prospective single-center study. J Nucl medicine: Off publication Soc Nucl Med. (2024) 65:555–9. doi: 10.2967/jnumed.123.266742
29. Fang AM, Shumaker LA, Martin KD, Jackson JC, Fan RE, Khajir G, et al. Multi-institutional analysis of clinical and imaging risk factors for detecting clinically significant prostate cancer in men with PI-RADS 3 lesions. Cancer. (2022) 128:3287–96. doi: 10.1002/cncr.34355
30. Deniffel D, Healy GM, Dong X, Ghai S, Salinas-Miranda E, Fleshner N, et al. Avoiding unnecessary biopsy: MRI-based risk models versus a PI-RADS and PSA density strategy for clinically significant prostate cancer. Radiology. (2021) 300:369–79. doi: 10.1148/radiol.2021204112
31. Padhani AR, Weinreb J, Rosenkrantz AB, Villeirs G, Turkbey B, Barentsz J. Prostate imaging-reporting and data system steering committee: PI-RADS v2 status update and future directions. Eur Urol. (2019) 75:385–96. doi: 10.1016/j.eururo.2018.05.035
Keywords: prostate cancer, PI-RADS, prostate-specific antigen, nomogram, diagnosis
Citation: Chai J-g, Li Y-h and Ke C-x (2025) Development of novel nomograms for predicting prostate cancer in biopsy-naive patients with PSA < 10 ng/ml and PI-RADS ≤ 3 lesions. Front. Oncol. 14:1500010. doi: 10.3389/fonc.2024.1500010
Received: 22 September 2024; Accepted: 12 December 2024;
Published: 07 January 2025.
Edited by:
Parthasarathy Seshacharyulu, University of Nebraska Medical Center, United StatesReviewed by:
Luis Mariano Esteban, University of Zaragoza, SpainZhimin Ding, Southern University of Science and Technology, China
Copyright © 2025 Chai, Li and Ke. This is an open-access article distributed under the terms of the Creative Commons Attribution License (CC BY). The use, distribution or reproduction in other forums is permitted, provided the original author(s) and the copyright owner(s) are credited and that the original publication in this journal is cited, in accordance with accepted academic practice. No use, distribution or reproduction is permitted which does not comply with these terms.
*Correspondence: Chang-xing Ke, Q2hhbmd4aW5nS2U2NjZAMTI2LmNvbQ==