 Yuxuan Han1†
 Lizhi Xie
 Yang Dong
- 1Department of Radiology, The Second Affiliated Hospital of Dalian Medical University, Dalian, China
- 2GE Healthcare, MR Research China, Beijing, China
Purpose: A model for preoperative prediction of molecular subtypes of breast cancer using tumor and peritumor radiomics features from multiple magnetic resonance imaging (mMRI) sequences, combined with semantic features.
Materials and methods: A total of 254 female patients with pathogically confirmed breast cancer were enrolled in this study. Preoperative mMRI, including T2-weighted imaging (T2WI), diffusion-weighted imaging (DWI), and dynamic contrast-enhanced MRI (DCE) sequences, covered the entire breast. To analyze the MRI semantic features of different molecular subtypes of breast cancer and identify independent predictive risk factors. Thirty-three binary classification models were established based on the radiomic features of different sequences and peritumoral ranges. The best radiomics model was selected by comparing the performance of the above radiomics models. At the same time, the best sequence and peritumoral extent were extracted from the target features, the radiomics score was calculated, and independent risk factors were predicted. Finally, a nomogram was established for preoperative prediction of Triple-Negative Breast Cancer (TNBC), Hormone Receptor (HR) positive and HER2 negative (HR+/HER2−), and HER2+ molecular staging types of breast cancer.
Results: Tumor length, edge enhancement, and peritumoral edema were independent risk factors for predicting the different molecular types of breast cancer. The best MRI sequence was DCE and the best peritumoral margin was 6 mm. The AUC of the nomogram based on the optimal sequence(DCE) and optimal peritumoral range (6 mm) combined with independent risk factors were 0.910, 0.909, and 0.845, respectively.
Conclusion: The nomogram based on independent predictors combined with intratumoral and peritumoral radiomics scores can be used as an auxiliary diagnostic tool for molecular subtype prediction in breast cancer.
Highlights
● Preoperative prediction of molecular subtypes of breast cancer is very important.
● Intratumoral and peritumoral radiomics features of breast cancer contain useful information.
● Nomogram may provide a tool for the prediction of molecular subtypes of breast cancer.
Introduction
Breast cancer has become the most common cancer in women, is responsible for the largest number of cancer-related deaths, and is gradually increasing (1, 2). Molecular subtypes are used to determine the important basis of treatment. Hormone receptor-positive type (Estrogen Receptor (ER)+ or Progesterone Receptor (PR)+) can be treated with endocrine therapy, Human Epidermal growth factor Receptor2 (HER2)+ can be treated with targeted therapy with anti-HER2 monoclonal antibody, and all receptor deficiency types, namely triple negative type, are mainly treated with chemotherapy (3, 4). Preoperative non-invasive prediction of breast cancer molecules is an important indicator of the biological behavior and prognosis of breast cancer and provides valuable information for the formulation of neoadjuvant chemotherapy regimens and prognosis of breast cancer.
Currently, immunohistochemistry using surgical specimens is the main method for molecular subtyping of breast cancer, and is determined by the expression of ER, PR, and HER2. However, preoperative biopsy is invasive and time consuming. Due to the tumor heterogeneity, a sampling bias exists. Radiomics may provide a non-invasive method for the preoperative prediction of molecular subtypes of breast cancer and has become a hot topic in medical imaging research.
Radiomics research on breast cancer has made some progress, but the optimal sequence used to establish radiomics models for breast cancer molecular typing has not been fully compared (5, 6). Magnetic Resonance Imaging (MRI) signals in the peritumoral region of breast cancer can provide complementary imaging information to the intratumoral region, which can be used to evaluate microenvironmental characteristics such as peritumoral angiogenesis, lymphangiogenesis activity, lymphatic and vascular invasion, tumor tissue stromal reaction, and lymphocyte infiltration immune response (7, 8). However, the optimal peritumoral region for the evaluation of molecular subtypes of breast cancer has not been clarified (9). There is still room for further research on radiomics of the molecular subtypes of breast cancer.
The aim of this study was to explore the optimal MRI sequence and peritumoral range for the establishment of a predictive model for molecular classification of breast cancer, combined with the risk predictors in Breast Imaging Reporting And Data System (BI-RADS) evaluation of breast cancer, and to establish a radiomics nomogram, which can provide a reference for radiomics research on molecular classification of breast cancer.
Materials and methods
Patients and MRI acquisition
Approved by the ethics committee of our institution, this study retrospectively collected 363 female breast cancer patients who were admitted to our hospital between January 2019 and December 2021 and confirmed by postoperative pathology. Finally, we included 254 women who met the criteria for this study and were randomly divided into two datasets (178 in the training set and 76 in the validation set) at a ratio of 7:3 in the binary classification analysis. The inclusion and exclusion criteria for these cases are listed in Supplementary Table 1. All patients were scanned with three MRI scanners, including one 1.5 T MRI scanner (General Electric Signa HDxt) and two 3.0 T MRI scanners (General Electric Discovery MR 750 W and Siemens Verio). All patients were in the prone position and scanned using a matching bilateral breast-dedicated coil. All patients underwent T1-Weighted Imaging (T1WI), Fat Sat T2-Weighted Imaging (FS-T2WI), Diffusion-Weighted Imaging (DWI), and Dynamic Contrast-Enhanced (DCE) MRI examinations. Detailed parameters are listed in Supplementary Table 2.
Analysis of MRI semantic features
MRI images were analyzed according to BI-RADS 2013 of the American College of Radiology by two radiologists with 3 years and 15 years of experience in breast MRI diagnosis, respectively. In cases of disagreement, a third radiologist (with 15 years of experience in breast MRI) made the final decision. The content and methods of the analysis are shown in Supplementary Table 2.
Radiomics analysis
Segmentation of breast cancer lesions
The FS-T2WI, DWI, and DCE images were imported into 3D Slicer (version 4.10.2) software and completed by two radiologists with 3 years and 15 years of imaging diagnosis experience, respectively. Three different Volume Of Interest (VOI) models were constructed by the following methods (Figure 1): Tumor model; The combined model of tumor and peritumoral: the range was selected to expand 3 mm, 6 mm, 9 mm, and 12 mm, which was represented by “com-;” Peritumoral model: denoted by “peri-.”
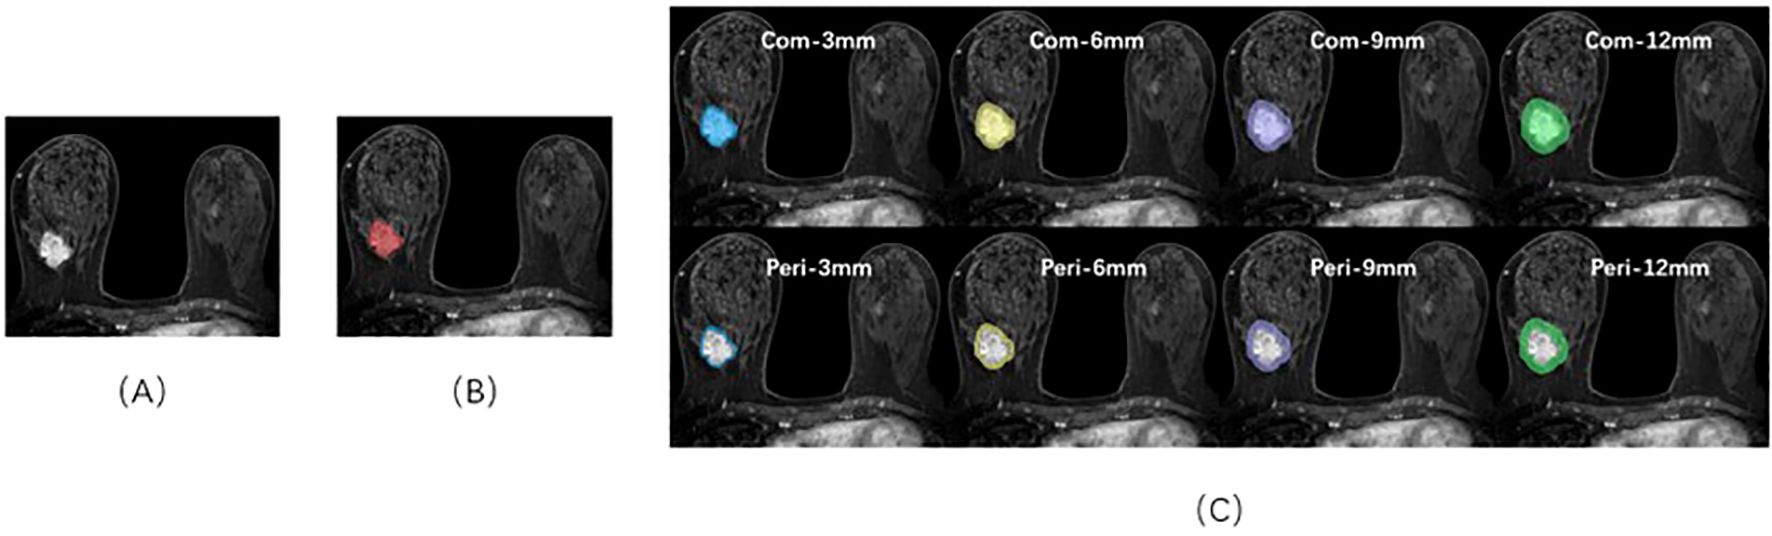
Figure 1. Sketch of the breast cancer ROI on DCE-MRI images using 3D-Slicer software. (A) A 46-year-old female patient with triple-negative breast cancer. (B) The red area represents the ROI of the tumor body. (C) ROIs of the tumor bodies and peritumoral and peritumoral regions in different ranges.
Radiomics feature extraction
The “radiomics” module in the open-source software 3D Slicer was used to preprocess and segment the images. Four categories were extracted from intratumoral and peritumoral VOI, including shape features, first-order features, texture features, and higher-order statistical features. A total of 1,130 quantitative radiomics features (ICC >0.75) and detailed features are shown in Supplementary Table 4, which were in accordance with the Image Biomarkers Standardization Organization (IBSI) standard (10). Before feature extraction, the MR Images of each sequence of all patients were resampled and voxels with different original sizes in medical images were normalized to the same size (11).
Dimensionality reduction of radiomics features
Upload 1,130 features of the above-mentioned documents to the Yizhun–Darwin intelligence platform (http://premium.darwin.yizhun-ai.com/). To prevent the effect of size differences between features on feature selection, minimum and maximum normalizations were used to normalize the feature size, and all pixel values were normalized to 0 and 1. To avoid dimension disasters, we used two methods to gradually select the optimal features. First, the percentile selection method was used to select the top 10% of the most important features for classification. The variable with the highest correlation was then selected using the minimum redundancy maximum association, and redundant features with strong correlations between features were removed. After dimension reduction, 10 key features were retained for subsequent model training under the DCE, T2WI, and DWI sequences, as shown in Figure 2.
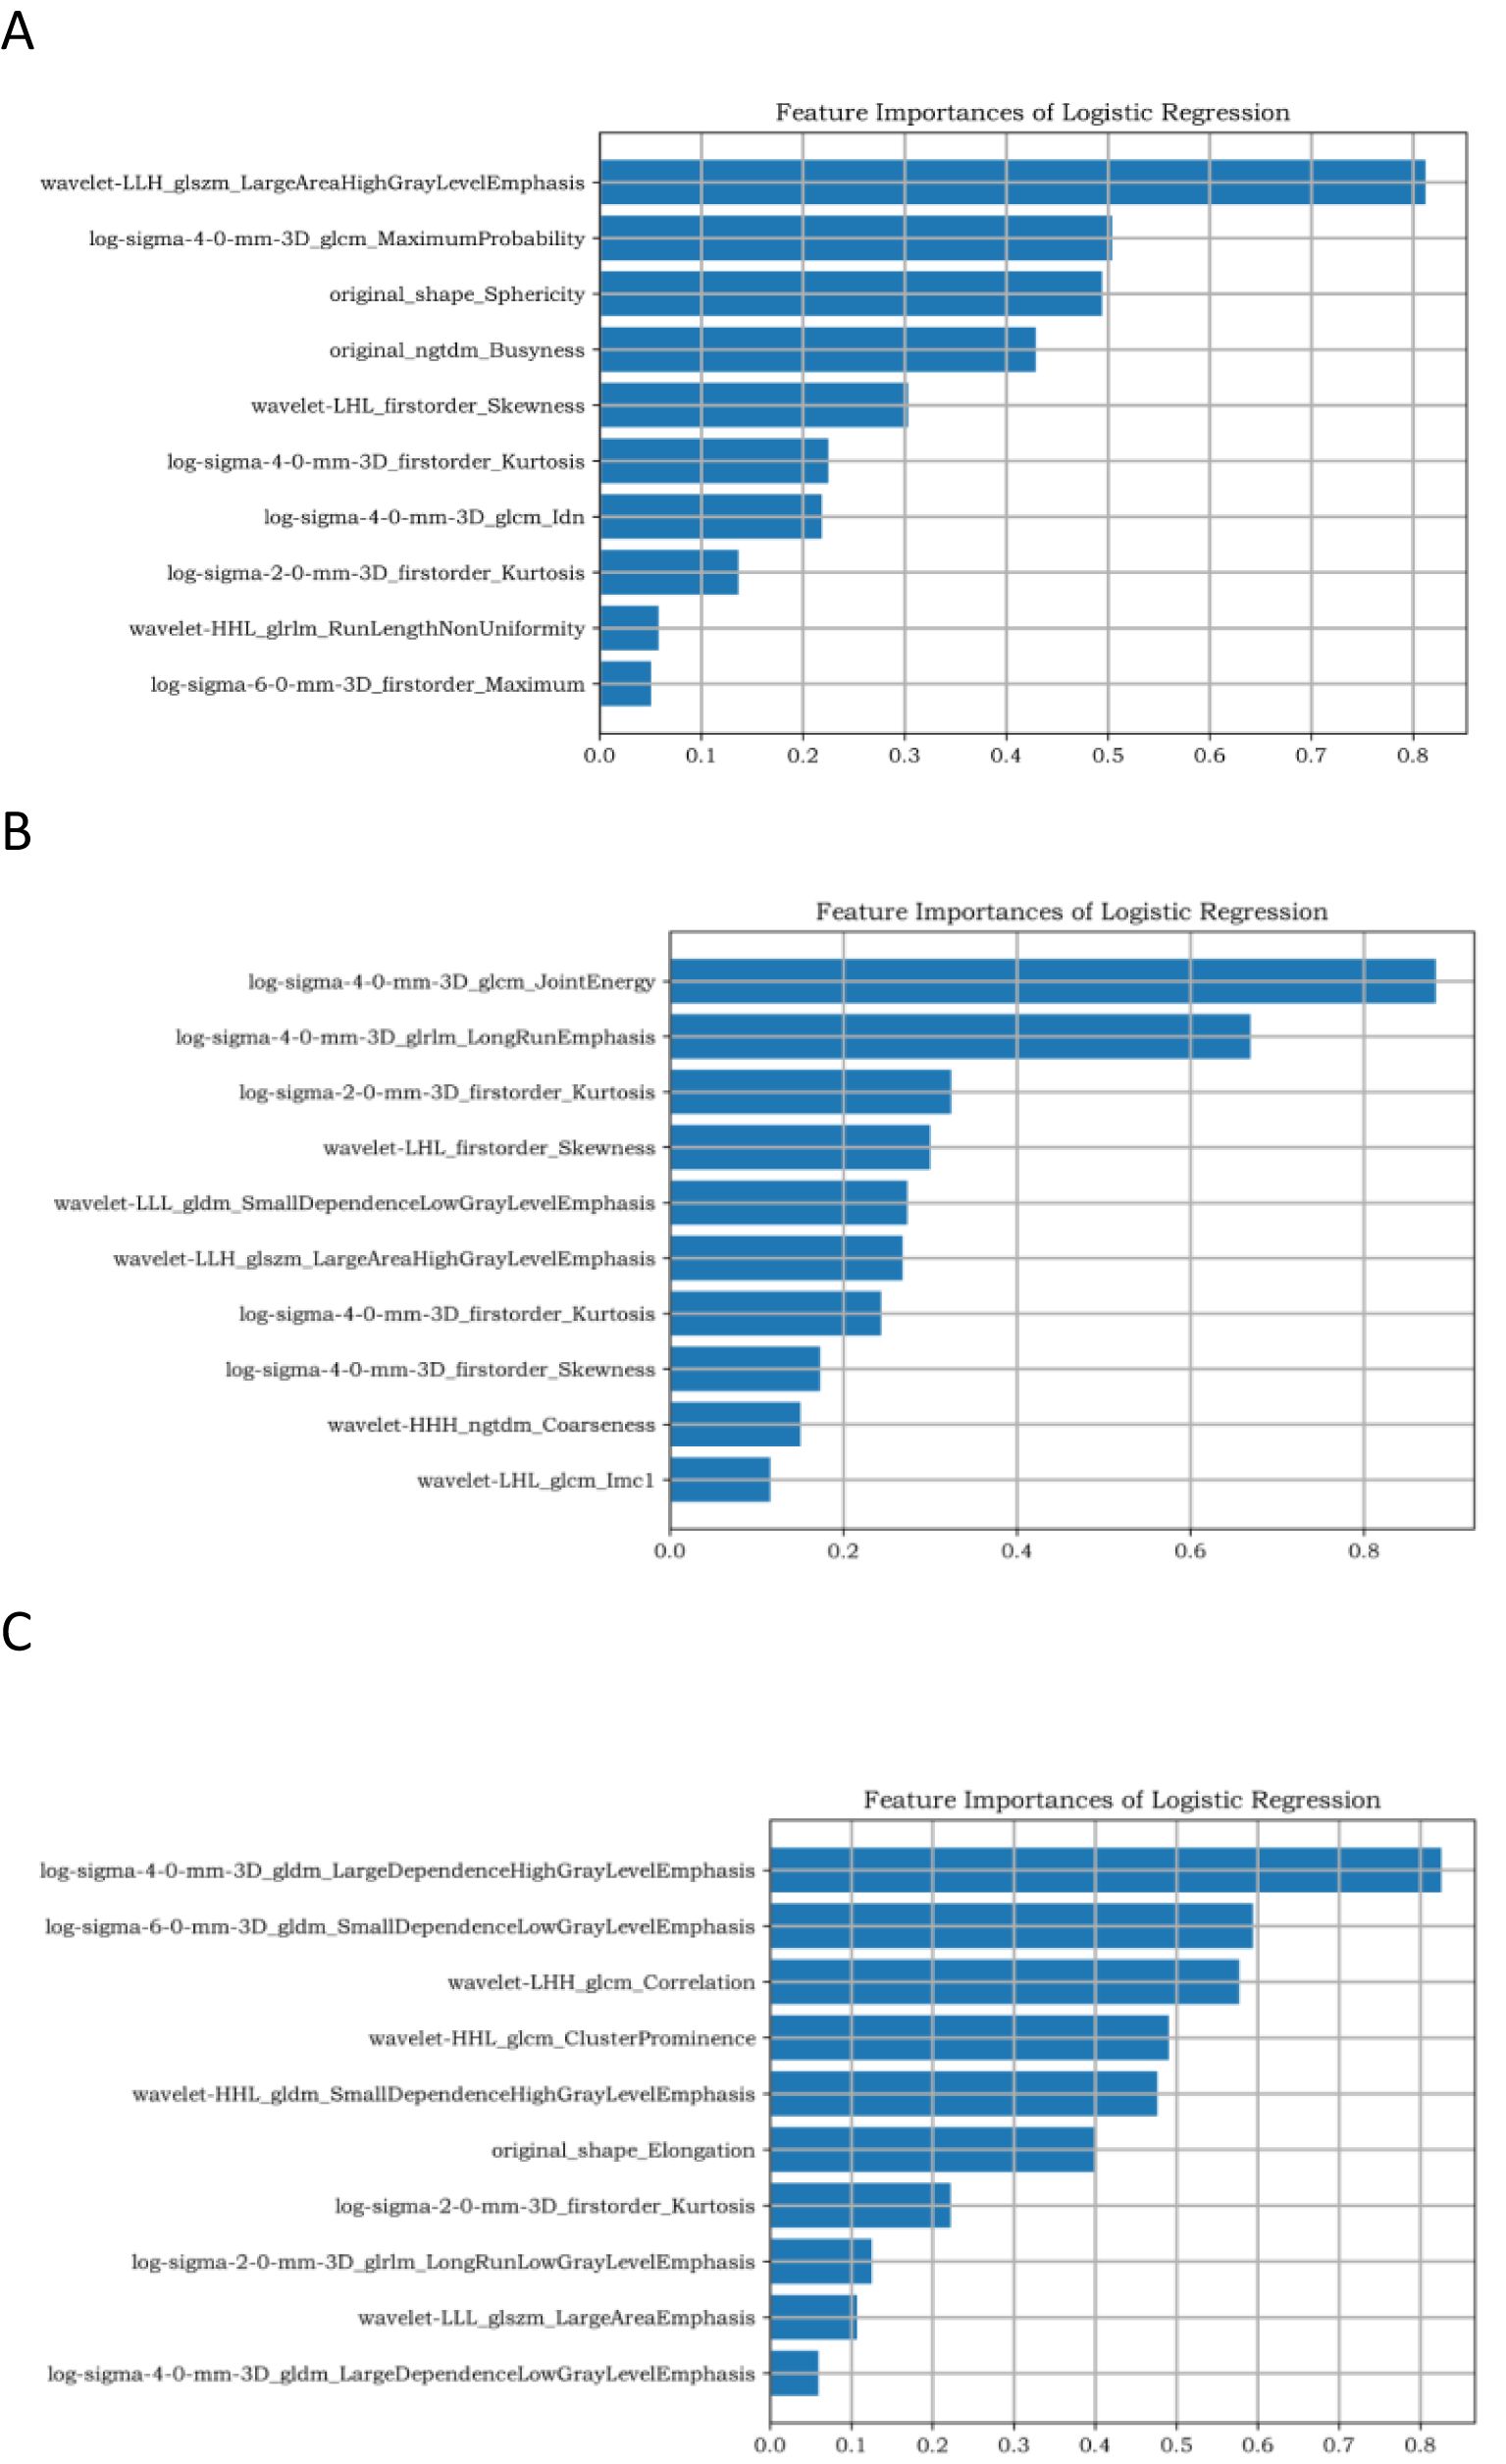
Figure 2. Ten target features based on DCE sequences. (A–C) represent the dimensionality reduction results of TNBC, HR+/HER2−, and HER2+ breast cancer, respectively.
Construction of radiomics model
A logistic regression classifier was used to establish the radiomics model. First, an Optimization Function was constructed. The function of the Optimization Function is to adjust the corresponding parameters such that the Loss Function becomes increasingly smaller. The calculation method is usually the derivative of the Loss Function with respect to parameter. Through multiple-cycle training, the Loss Function value tends to be minimized, and the prediction effect tends to be the best. A receiver operating characteristic (ROC) curve was used to evaluate the prediction efficiency of the model. The area under the curve (AUC), 95% confidence interval (CI), accuracy, sensitivity, and specificity were also calculated. The flowchart is shown in Figure 3.
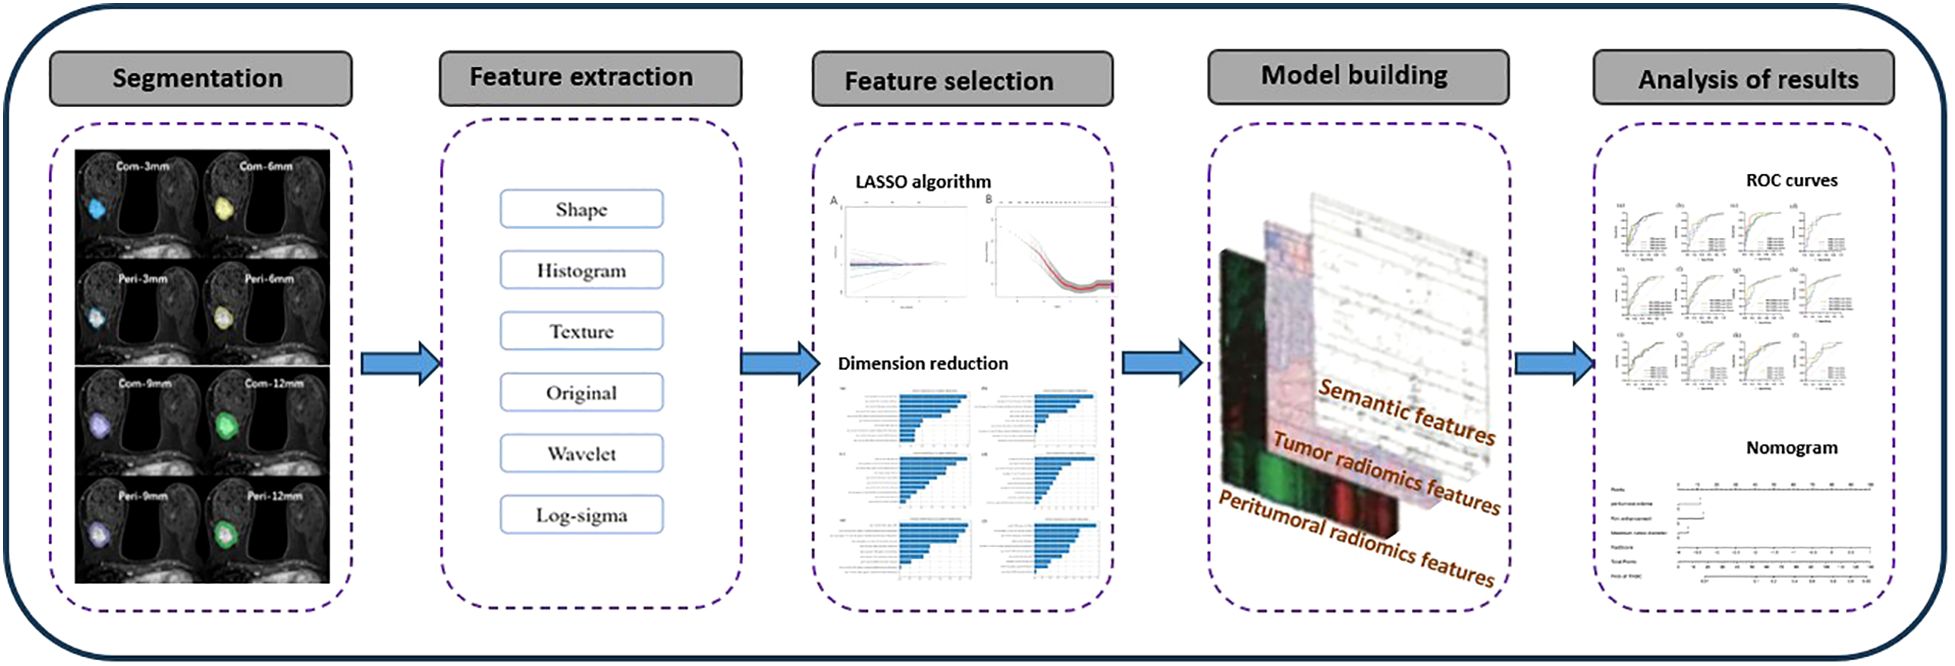
Figure 3. Flowchart of radiomics methods.
Nomogram
Correlation analysis of the clinical information, MRI semantic features, and molecular subtypes of breast cancer was performed. Variables with statistically significant differences were included in univariate and multivariate logistic regression analyses to screen for independent predictors to distinguish the three groups of breast cancer molecular subtypes. The radiomics score (Rad-score) was calculated using Least Absolute Shrinkage and Selection Operator (LASSO) regression to construct the nomogram.
Histopathological analyses
The expression of ER, PR, and HER2 in each patient was recorded using immunohistochemistry (IHC) and Fluorescence In Situ Hybridization (FISH). Ki-67 expression was defined as 14%, ≥14% as high expression, and <14% as low expression.
Statistical methods
SPSS 26.0 software and R software (version 4.1.2) were used for statistical analyses. The count data were analyzed using the chi-square test or Fisher’s exact probability method, and the measurement data were analyzed using the Kruskal–Wallis test. Univariate and multivariate logistic regression analyses were used to identify the independent predictors of the molecular subtype of breast cancer. The results were expressed as odds ratios (ORs) and 95% confidence intervals (CIs), and the regression coefficients of the regression model were displayed using the nomogram. AUC was calculated to evaluate the diagnostic efficacy of the nomogram. P value of less than 0.05 was considered statistically significant.
Results
Clinical data of the patients
A total of 363 breast cancer patients were included in this study, and 254 breast cancer patients were finally included, including 148 cases of HR+/HER2− breast cancer, 57 cases of HER2+ breast cancer, and 49 cases of Triple-Negative Breast Cancer (TNBC). The clinical and pathological details of the three breast cancer subtypes are provided in Supplementary Table 5.
Analysis of MRI semantic features
There were significant differences between the molecular subtypes of breast cancer and tumor location, length, margin, enhancement characteristics, and peritumoral edema (P <0.05) (Supplementary Table 3).
As shown in Table 1, tumor length, edge enhancement, and peritumoral edema were independent risk factors for TNBC (P = 0.004, 0.005, and 0.032, respectively). Tumor length, edge spiculation, and peritumoral edema were independent risk factors for HR+/HER2− breast cancer (P = 0.002, 0.005, and 0.001, respectively). Peritumoral edema was an independent risk factor for HER2+ breast cancer (P = 0.039).
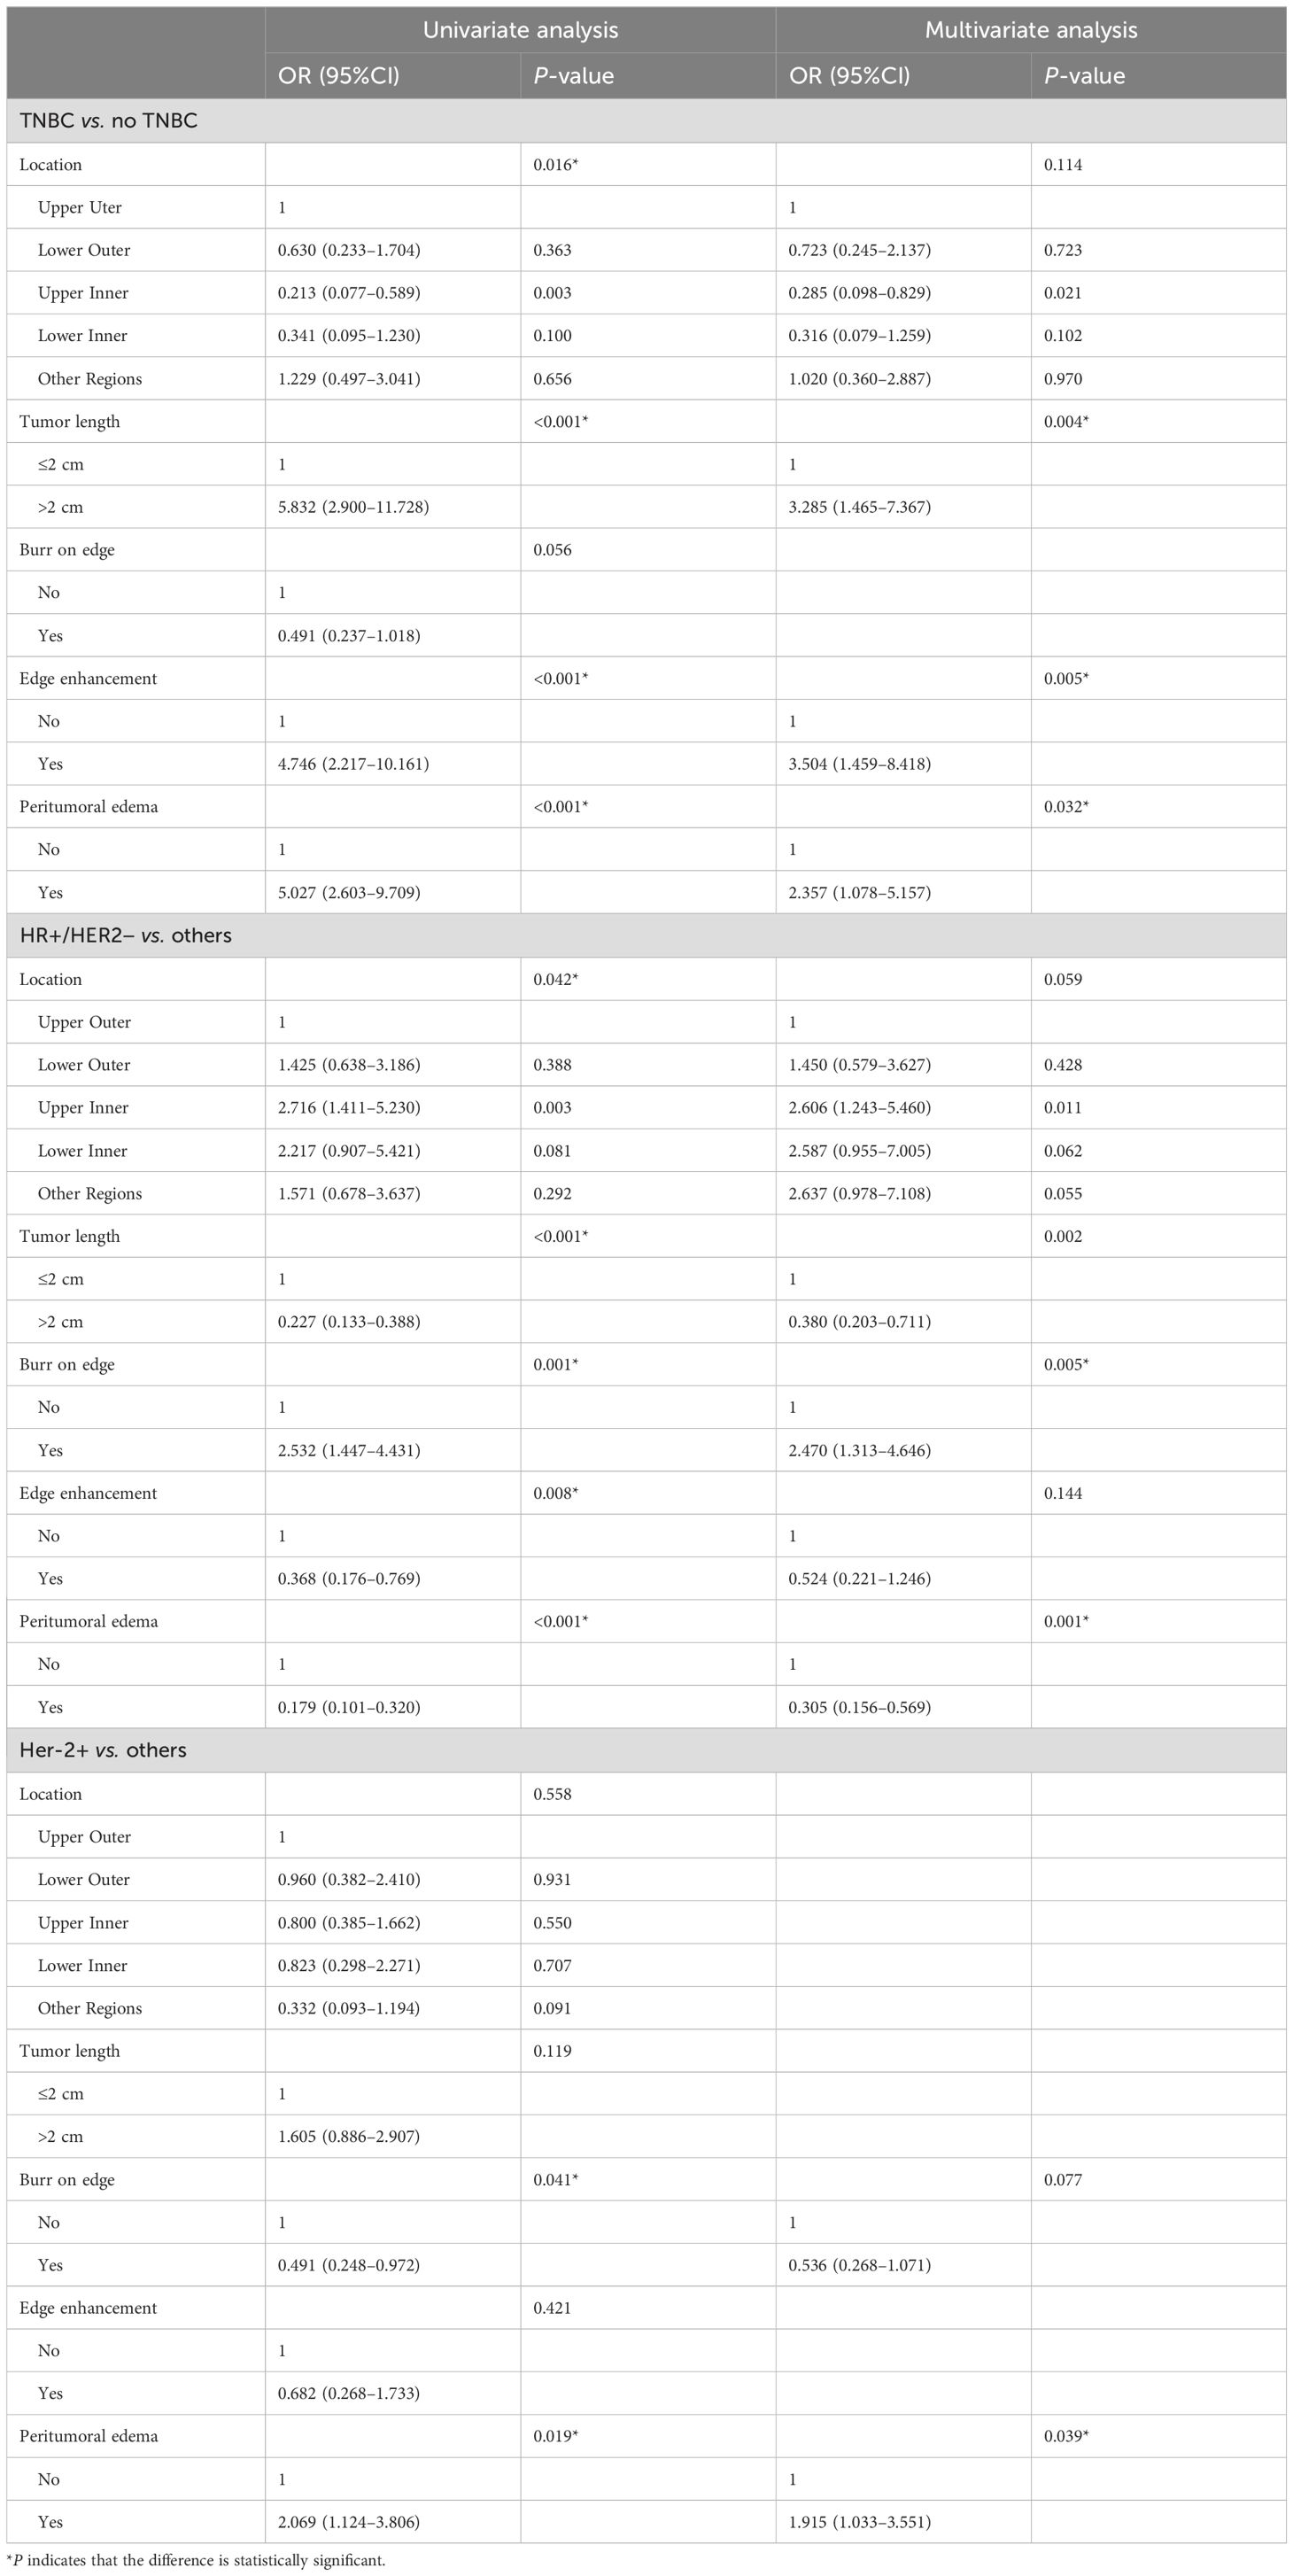
Table 1. Analysis of semantic features of clinical radiology in different molecular subtypes of breast cancer.
The diagnostic efficacy of MRI semantic features in identifying molecular subtypes of breast cancer is as follows: The AUC of TNBC was 0.78 (95%CI: 0.70–0.85). The AUC of HR+/HER2− was 0.74 (95%CI: 0.66–0.82). The AUC of HER2+ was 0.58 (95%CI: 0.50–0.67).
Radiomics model
Radiomics model of tumor based on different sequences
A logistic regression classifier was used to establish a prediction model. A total of 1,130 features were extracted from the T2WI, DWI, and DCE sequences. After dimensionality reduction, 10 target features were retained for each sequence. In the task of identifying TNBC, HR+/HER2−, and HER2+ breast cancer, the top-ranked features in radiomics feature coefficients were Wavelet-LLH_glszm_ LargeAreaHighGrayLevelEmphasis, log-sigma-4-0-mm-3D_glcm_JointEnergy, and log-sigma-4-0-mm-3D_gldm_Large dependenceHighGrayLevelEmphasis.
Table 2 shows that in the task of predicting molecular subtypes of breast cancer, the logistic regression model based on DCE radiomics features had the best prediction performance, with AUC values of 0.80, 0.78, and 0.76 in the training set and AUC values of 0.78, 0.79, and 0.72 in the validation set. For TNBC and HR+/HER2− breast cancer, the radiomics feature prediction model based on DWI outperformed the radiomics feature prediction model based on T2WI. Conversely, for HER2+ breast cancer, the radiomics feature prediction model based on T2WI demonstrated superior performance compared with the model based on DWI.
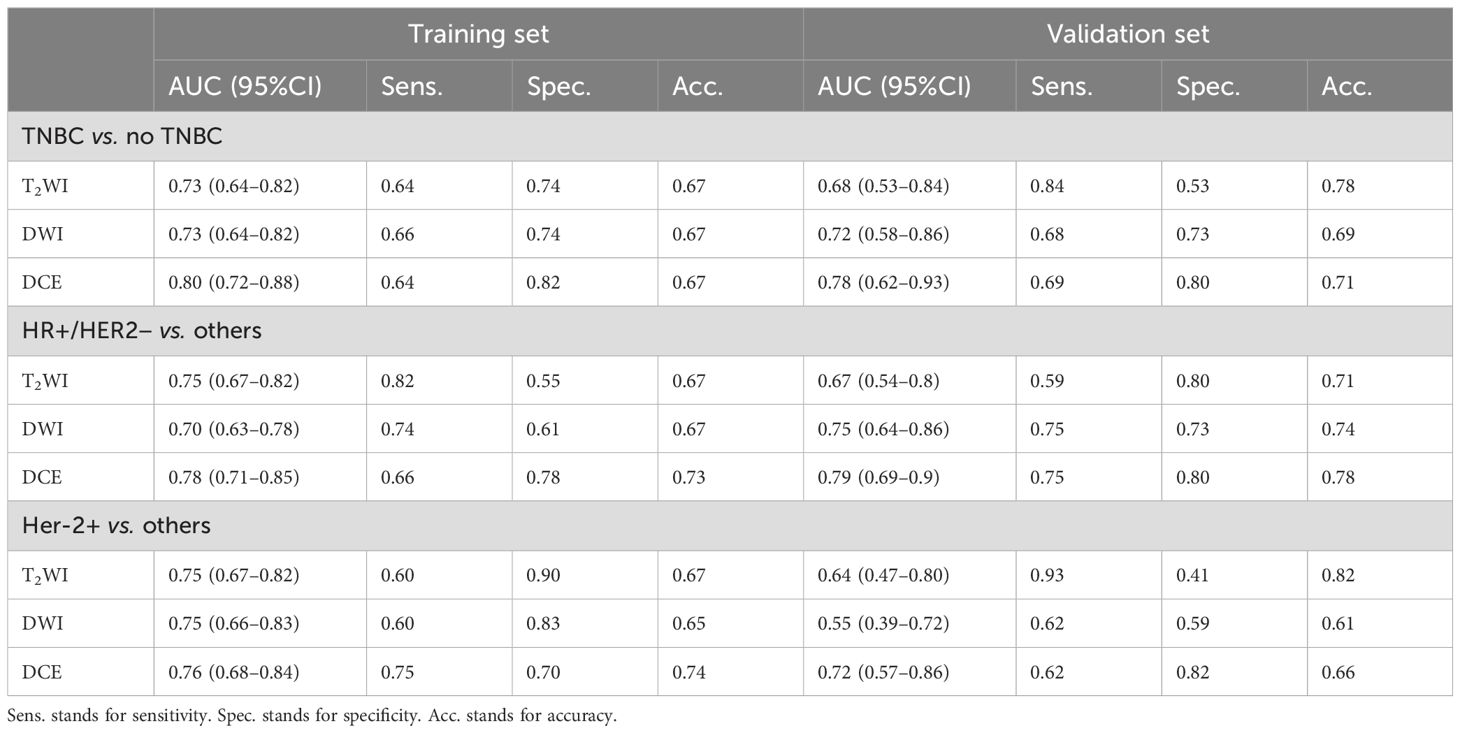
Table 2. Diagnostic performance of different MR sequence radiomics models in differentiating molecular subtypes of breast cancer.
Radiomics model of different peritumoral ranges based on DCE sequence
Under the DCE sequence, 1,130 features were extracted from each peritumoral region, combined with intratumoral radiomics features, and 10 target features were retained after dimensionality reduction. In the task of identifying TNBC, HR+/HER2−, and HER2+ breast cancer, the top-ranked features in the radiomics feature coefficients were log-sigma-4-0-mm-3D_ngtdm_Contrast, log-sigma-6-0-mm-3D_glcm_ldn, and wavelet-LHL_glcm_Correlation.
Table 3; Figure 4 show the prediction performance of peritumoral features obtained with different peritumoral region sizes (3 mm, 6 mm, 9 mm, and 12 mm) in the training and validation sets. Among the three groups of breast cancer molecular subtypes, the AUC of the 6 mm peritumor model was the highest (training set: 0.82, 0.79, and 0.76; validation set: 0.80, 0.80, and 0.78, respectively). Moreover, after combining tumor and peritumoral features, it was found that the AUC of the combination model with peritumoral 6mm was the highest (training set: 0.92, 0.86, and 0.84; validation set: 0.85, 0.84, and 0.82). Among the radiomics models, it had the best performance in identifying TNBC (training set: 0.92, validation set: 0.85).
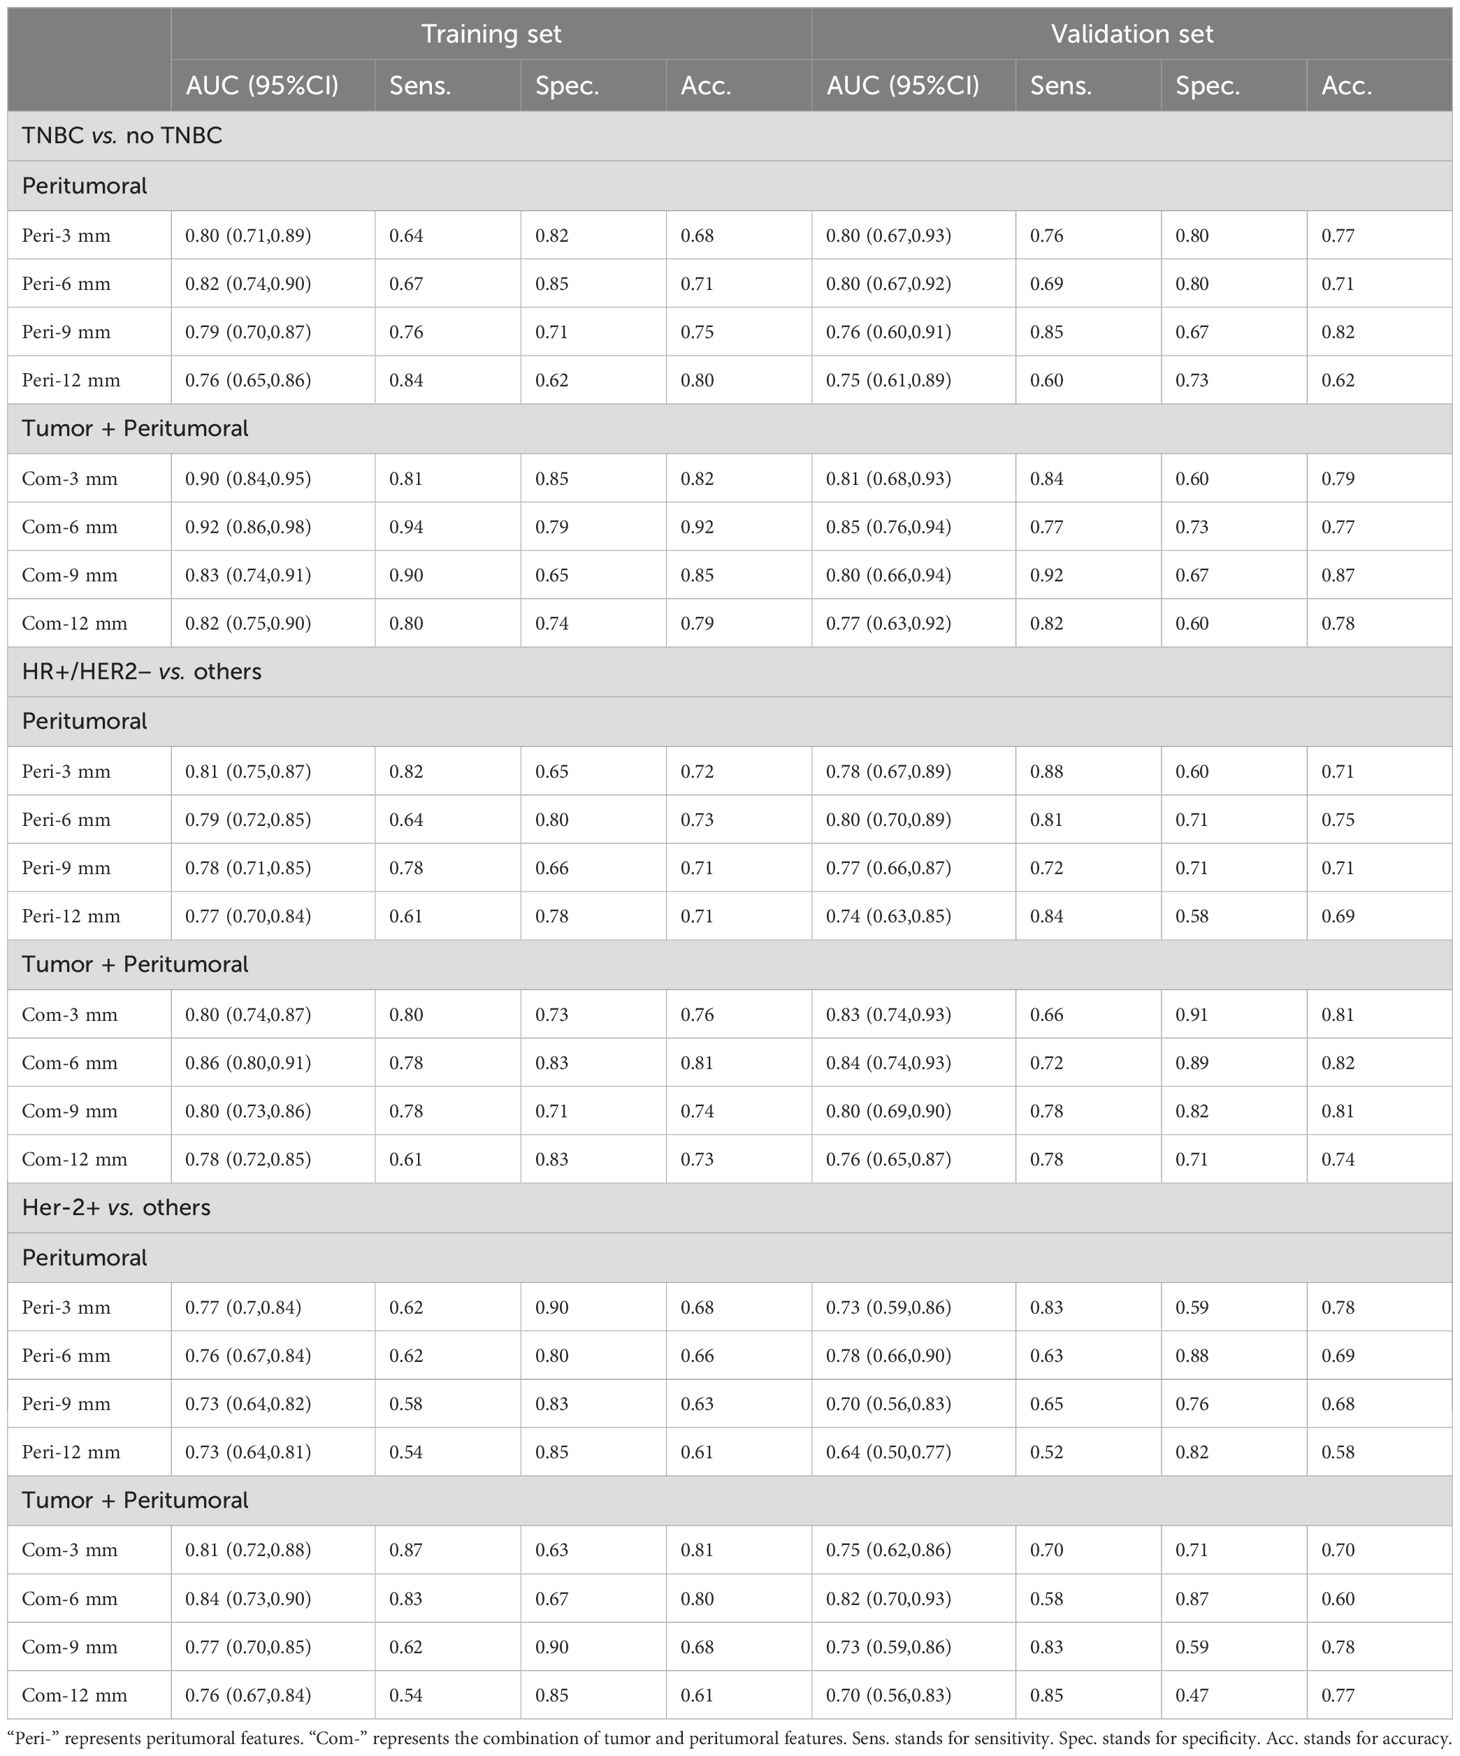
Table 3. Diagnostic efficacy of DCE-MRI peritumoral and tumor + peritumoral combined radiomics models in differentiating molecular subtypes of breast cancer.
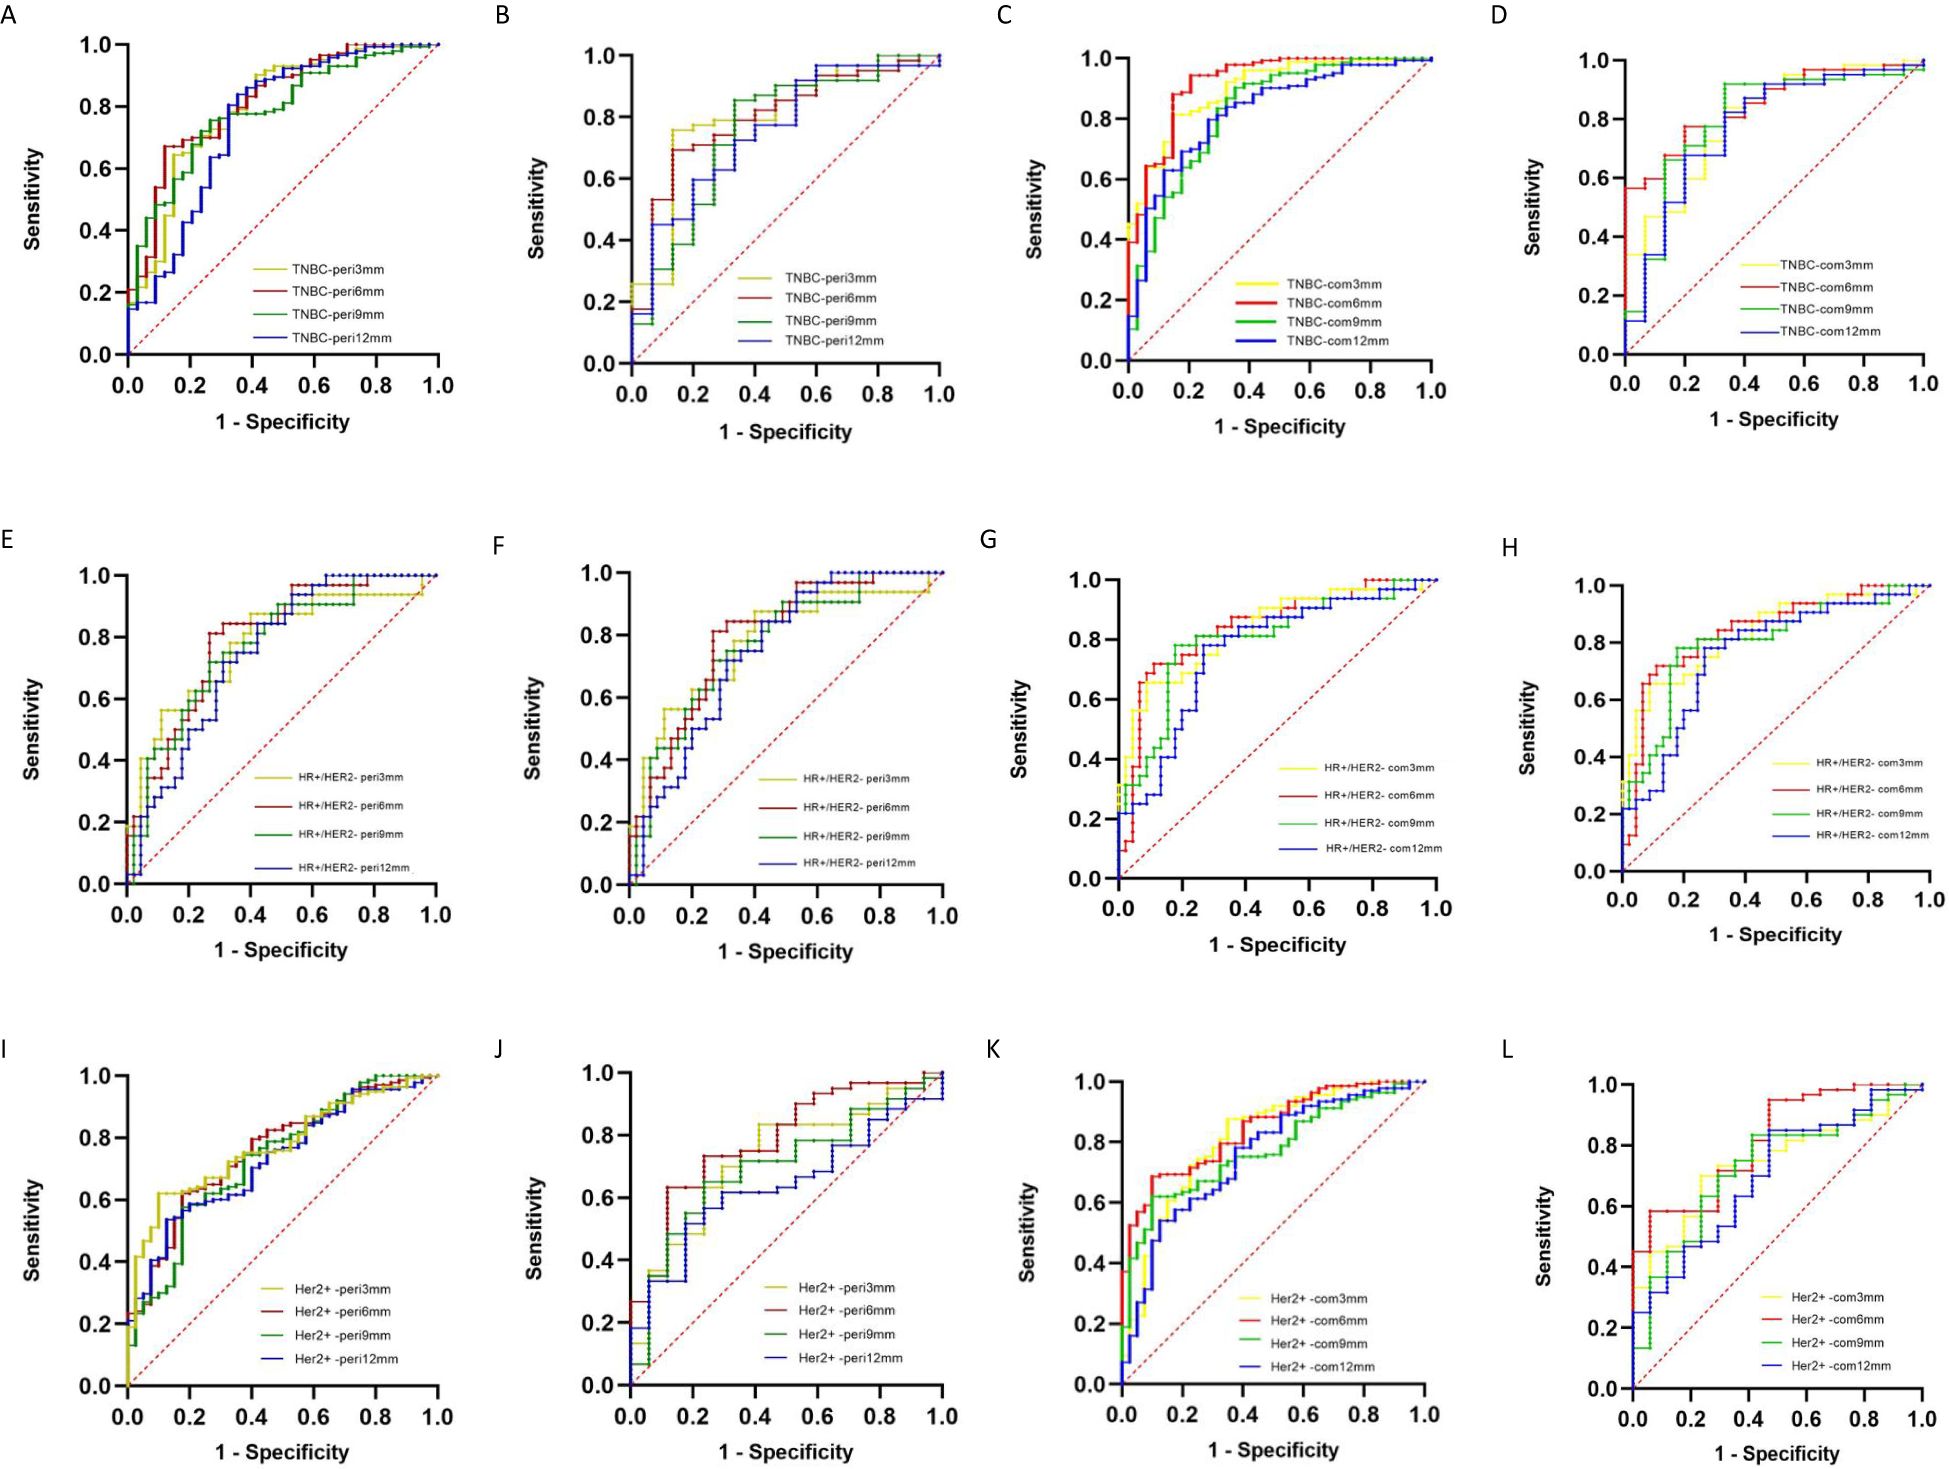
Figure 4. ROC curves of DCE-MRI peritumoral and tumor + peritumoral radiomics models for differentiating molecular subtypes of breast cancer (A, B) TNBC peritumoral model training and validation sets; (C, D) TNBC tumor + peritumoral model training and validation sets; (E, F) HR+/HER2− peritumoral model training and validation sets; (G, H) HR+/HER2− tumor + peritumoral model training and validation sets; (I, J) HER2+ peritumoral model training and validation sets; (K, L) HER2+ tumor + peritumoral model training and validation sets.
Nomogram
Radiomics score calculation results
The Com-6 mm radiomics model had the best performance in predicting the molecular subtypes of breast cancer, and the radiomics score was calculated based on the combined model.
A total of 2,260 highly reproducible features were analyzed by univariate regression analysis and the LASSO algorithm, and ten-fold cross-validation was used. Finally, 14, 14, and 13 optimal features with nonzero coefficients were selected for TNBC, HR+/HER2−, and HER2+ breast cancer, respectively (Table 4 and Figure 5).

Table 4. Radiomics features and coefficients after LASSO dimensionality reduction.
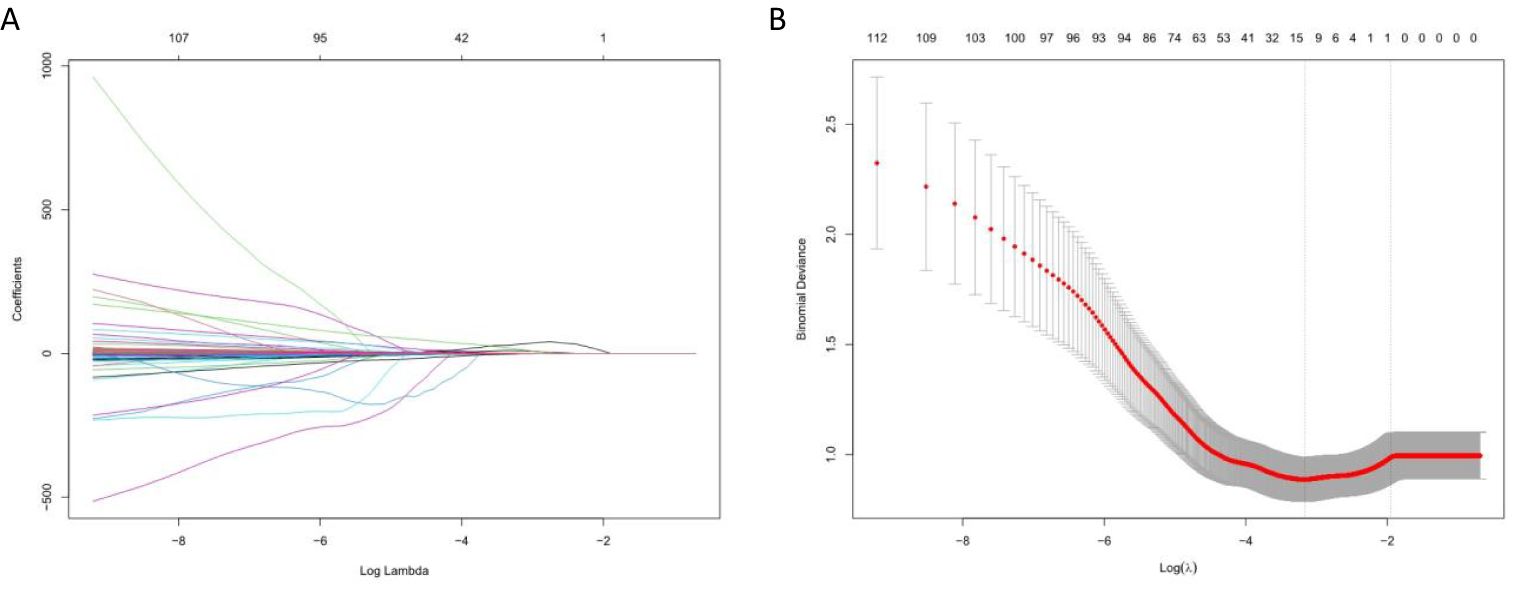
Figure 5. Selection of radiomics features using LASSO algorithm. (A) LASSO coefficient curve of radiomics features, each colored line represents the coefficient of each feature, and the unimportant feature coefficients were compressed to zero by adjusting λ; (B) Tenfold cross-validation was used to select the best performance radiomics feature map: the lower abscissa is the Log (λ) value, and the upper abscissa is the number of features after LASSO dimension reduction corresponding to the Log (λ) value.
Construct the nomogram
1. To identify TNBC breast cancer
Independent predictors (tumor length, edge enhancement, and peritumoral edema) combined with the Rad-score were used to construct a nomogram. The AUC of the constructed nomogram in the training and validation sets were 0.848 (95%CI: 0.778–0.918) and 0.910 (95%CI: 0.840–0.979), respectively (Figure 6). The Rad-score was calculated using Equation 1.
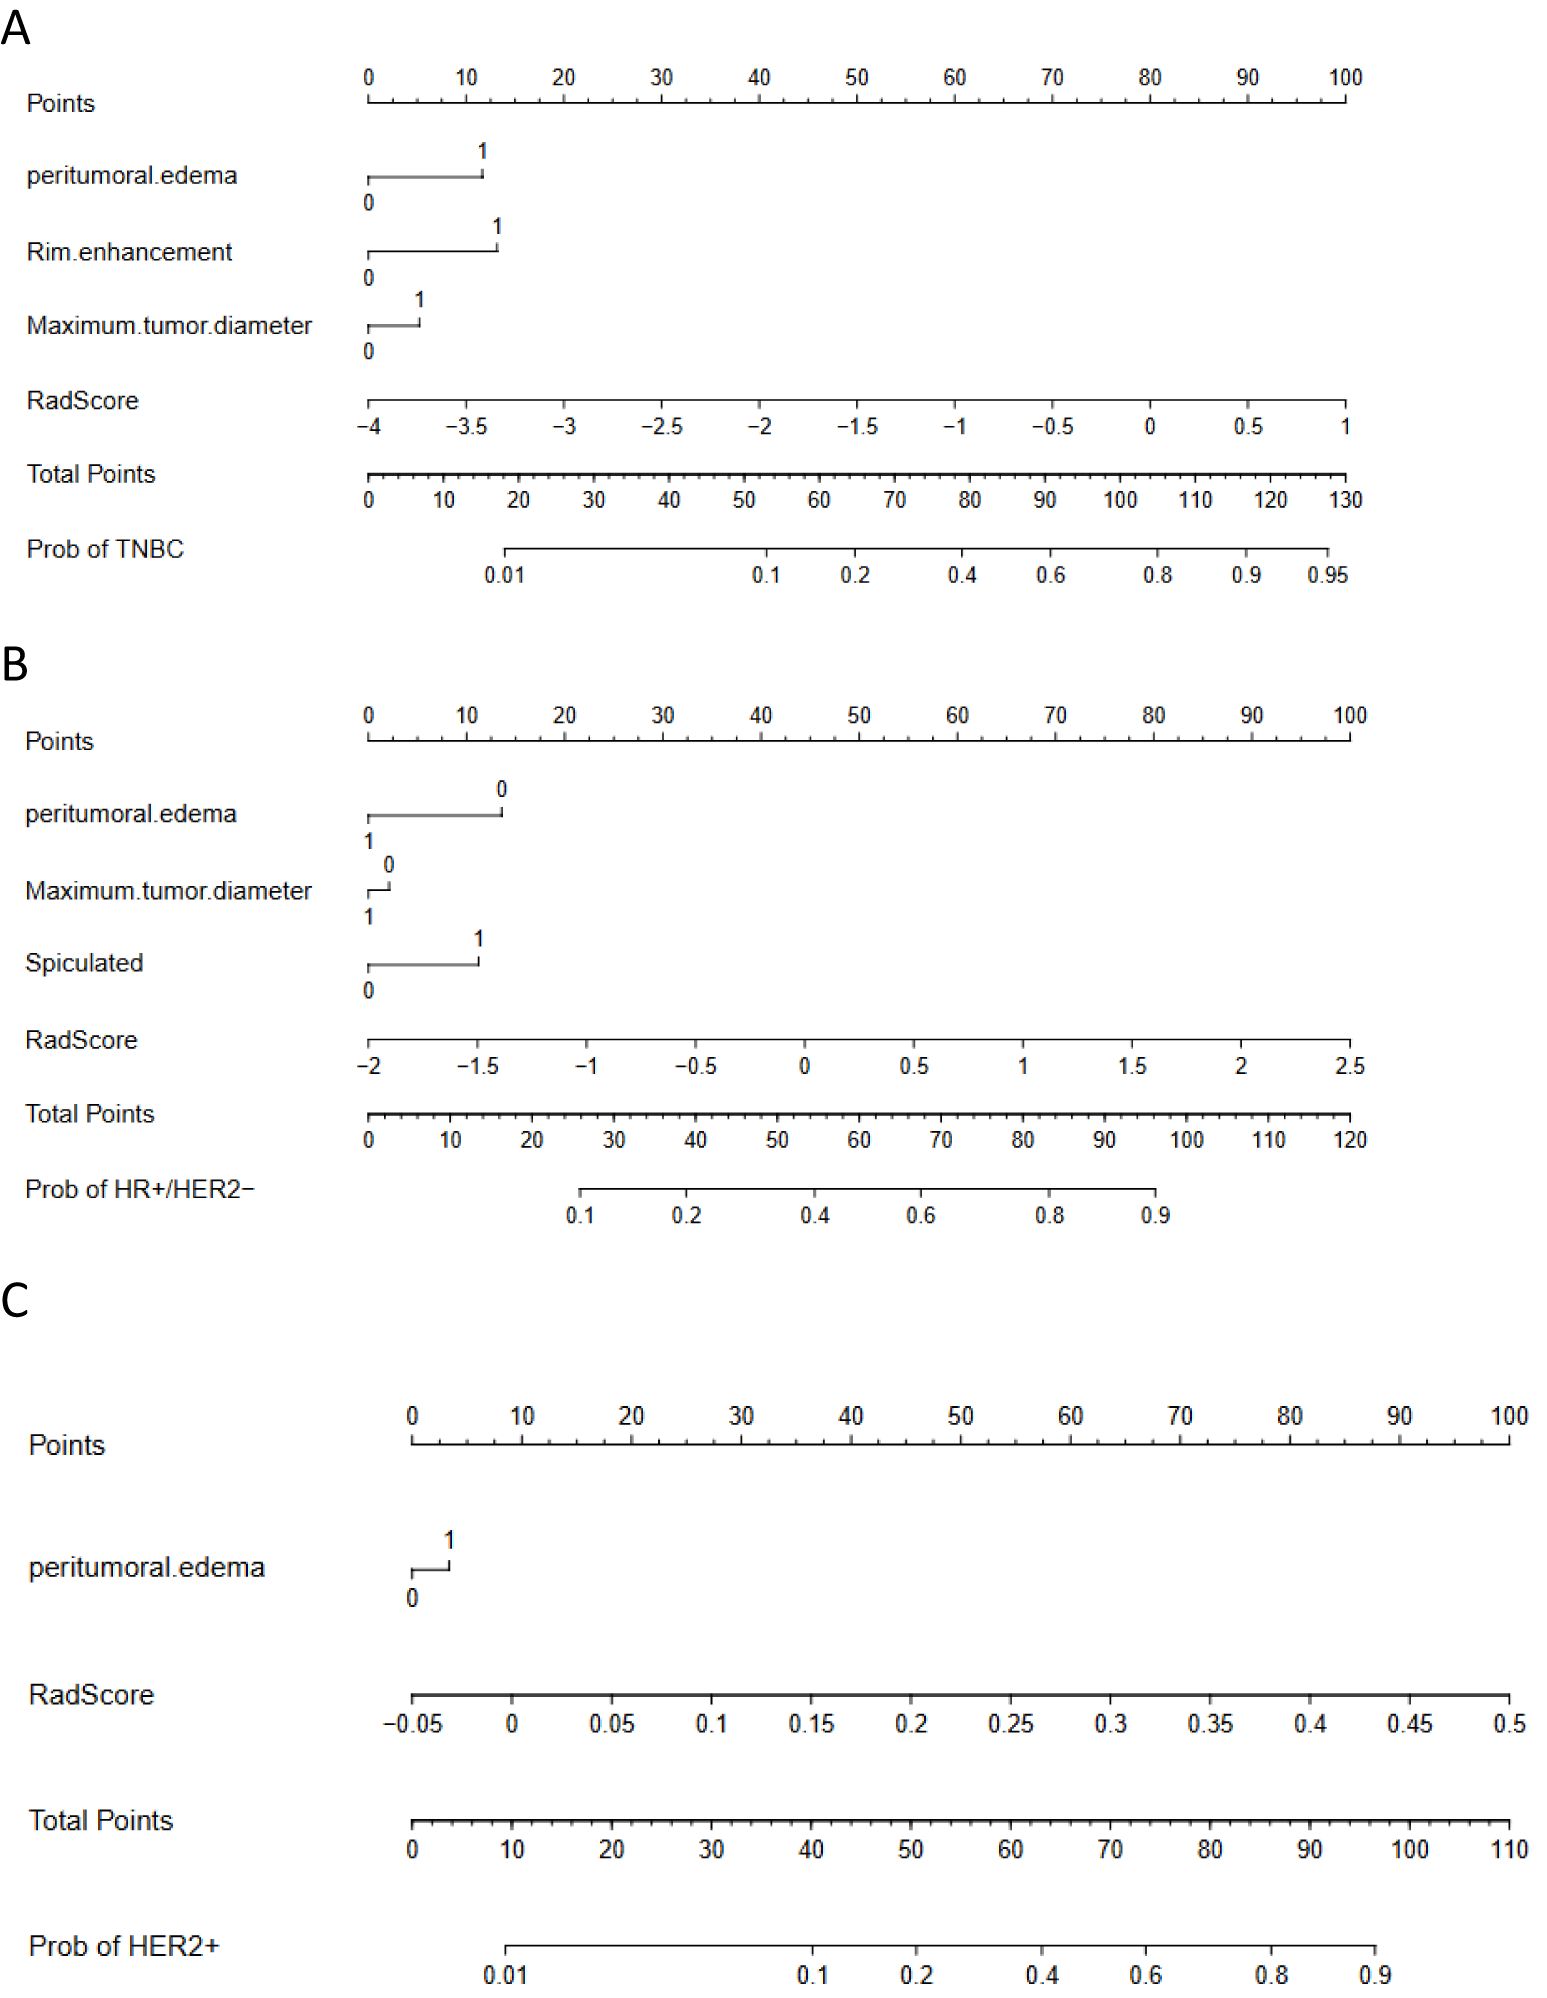
Figure 6. Nomograms. (A) to identify TNBC breast cancer. The nomogram was composed of peritumoral edema, rim enhancement, tumor length and radiomics score. Peritumoral edema: 0 = absent, 1 = present; Ring enhancement: 0 = no, 1 = yes; Tumor length: 0 = ≤2 cm, 1 = >2 cm. (B) to identify HR+/HER2− breast cancer. The nomogram was composed of peritumoral edema, tumor length, spiculation sign, and radiomics score. Peritumoral edema: 0 = absent, 1 = present; Tumor length: 0 = 2 cm, 1 = >2 cm; Spiculation: 0 = none, 1 = yes. (C) to identify HER2 + breast cancer. The nomogram consisted of peritumoral edema and radiomics score. Peritumoral edema: 0 = none, 1 = presence.
2. To identify HR+/HER2− breast cancer
Independent predictors (tumor length, edge spiculation, and peritumoral edema) combined with the Rad-score were used to construct a nomogram. The AUC of the constructed nomogram in the training and validation sets were 0.834 (95%CI: 0.776–0.892) and 0.909 (95%CI: 0.839–0.978), respectively (Figure 6). The Rad-score was calculated using Equation 2.
3. To identify HER2+ breast cancer
An independent predictor (peritumoral edema) combined with the Rad-score was used to construct a nomogram. The AUC of the constructed nomogram in the training and validation sets were 0.802 (95%CI: 0.730–0.873) and 0.845 (95%CI: 0.742–0.948), respectively (Figure 6). The Rad-score was calculated using Equation 3.
Discussion
This study aimed to investigate the performance of radiomics and nomogram models based on multiple MRI sequences for the noninvasive prediction of molecular subtypes of breast cancer.
We analyzed the semantic features of breast cancer on MRI and found that edge spiculation, edge enhancement, and peritumoral edema correlated with the molecular subtype of breast cancer. Previous studies have also found that tumor edge enhancement is closely related to the overexpression of vascular endothelial growth factor and tumor hypoxia, which is common in fast-growing tumors and is related to tumor size, grade, ER and/or PR expression, Ki-67 expression, lymph node status, and DNA S-phase percentage (12, 13). TNBC is the most aggressive breast cancer. We also conclude that edge enhancement is a predictor. Tumor edge spiculation is associated with positive ER and PR expression, negative HER2 and Epidermal Growth Factor Receptor (EGFR) expression, and lymph node metastasis (14), and we believe that it is a predictor of HR+/HER2− breast cancer. Peritumoral edema is mainly caused by increased endothelial permeability of tumor neovascularization and peritumoral cytokine release, and is commonly seen in triple-negative breast cancer and HR-deficient breast cancer (15–17). We support the conclusion that peritumoral edema is a positive predictor for TNBC and HER2+ subtype breast cancer, and a negative predictor for HR+/HER2− subtype breast cancer. The results of this study not only support the conclusions of previous studies but also transform the traditional qualitative analysis method of semantic features into a quantitative analysis method. By constructing the nomogram model, the weight proportion of the semantic features in the construction of the prediction model was accurately quantified.
Studies have reported that DCE sequences reflect more detailed biological information of tumors by analyzing the hemodynamic characteristics of tumors (17, 18), and that texture features are correlated with the levels of multiple biomarkers, such as estrogen receptor (ER), progesterone receptor (PR), and HER2 (19, 20). Our study compared radiomics models based on T2WI, DWI, and DCE sequences, and the results showed that the DCE-based model had the highest diagnostic efficiency (AUC = 0.910), especially in the differentiation of TNBC and non-TNBC breast cancer, which may be related to the higher heterogeneity of TNBC breast cancer. The heterogeneity of tumor morphology and contrast enhancement in the DCE sequence can better reflect pathophysiological characteristics, such as tumor proliferation and angiogenesis (21). The AUC result of this validation set was better than that of previous models established to differentiate TNBC from non-TNBC breast cancer, such as the study by Zhang et al. (22) (AUC =0.879) and Zhang et al. (23) (AUC = 0.890), which reflects that we have a superior model scheme.
In addition to the tumor body, the radiomics features of the surrounding areas of breast cancer are also of great significance. Based on DWI images, Fan et al. (24) explored the relationship between radiomics features of tumors and their surrounding areas and molecular subtypes of breast cancer, and found that the model established when the peritumoral area was 5 mm had the best prediction performance. Zhang et al. (22) used peritumoral radiomics features based on DCE-MRI to establish a molecular classification model for breast ductal carcinoma in situ. The best peritumoral area was 6 mm for differentiating between TNBC and non-TNBC, HR+/HER2−, and non-HR+/HER2−. The optimal peritumoral area for distinguishing HER2+ cells from non-HER2+ cells was 8 mm. Hao et al. (8) studied the distance of 4 mm around the tumor and established a preoperative molecular classification model of breast cancer. Based on DCE-MRI images, we compared various peritumoral ranges (3 mm, 6 mm, 9 mm, and 12 mm) and established multiple radiomics logistic regression models. We found that the peritumoral 6 mm radiomics feature model had the best performance in identifying molecular subtypes of breast cancer, and the performance was better than that of previous studies. In addition, our study included a variety of histological types of breast cancer, and the conclusions were more generalized and applicable.
In this study, the proportion of high-order features extracted from T2WI, DWI, and DCE sequences for the differentiation of the three groups of breast cancer molecular subtypes was much higher than that of the low-order features. Higher-order features reflect the consistency between texture roughness and tumor texture images, which is beneficial for better predicting the heterogeneity within the tumor and the subtle differences in gray texture features, and provides more information for the evaluation of breast cancer molecular typing diagnosis. As an important part of high-order features, wavelet transform analyzes the local time and spatial frequency, extracts high-frequency and low-frequency signals in the image extensively and effectively, and reflects the texture changes of the image more carefully and comprehensively. The Gabor transform performed by the Gabor filter based on the wavelet transform can be used to solve the lack of localization-analysis ability of the Fourier transform and the analysis ability of non-stationary signals.
Previous studies have also found that wavelet features contain more detailed information about breast cancer and are a key component in radiomics model construction (25). Braman et al. (26) found that Gabor features are of great significance in the molecular classification of breast cancer, which can improve the ability to distinguish HER2+ from other breast cancers (such as TNBC). In this study, wavelet features demonstrated good predictive power for HER2+ breast cancer and can be used to quantify tumor heterogeneity comprehensively and broadly at different spatial scales and directions. In this study, the wavelet features demonstrated good predictive power for HER2+ breast cancer and can be used to quantify tumor heterogeneity comprehensively and broadly at different spatial scales and directions. The mixture of a variety of low- and high-order features has heterogeneous information complementary values for distinguishing the molecular subtypes of breast cancer. Niu et al. (27) found that shape features could distinguish TNBC from other molecular types of breast cancer. In this study, shape feature-sphericity was also of great significance in identifying TNBC. It is the only low-order feature retained after the LASSO dimension reduction, and its absolute value of the feature coefficient is at the 8th place.
In recent years, an increasing number of studies have developed nomograms to intuitively assist the clinical decision-making process and make the treatment strategy for breast cancer patients more convenient, accurate, and personalized. Kim et al. (28) developed a nomogram based on MRI and clinical-pathological variables to predict breast cancer Polymerase Chain Reaction (PCR), which showed higher efficiency than a single clinical-pathological model. Yu et al. (29) developed a nomogram combining radiomics and clinical features for preoperative prediction of axillary lymph node metastasis and disease recurrence risk in early breast cancer. Decision curve analysis showed that the clinical-radiomics nomogram had better predictive performance than clinical or radiomics alone. In this study, a nomogram based on semantic features and tumor + peritumoral 6 mm radiomics score was constructed to identify molecular subtypes of breast cancer, and the diagnostic efficiency was significantly higher than that of MRI semantic feature analysis and radiomics model alone. In this study, the Rad-score had the widest predictive score and the largest contribution in the nomogram and was the most important independent factor for the identification of molecular subtypes of breast cancer. Clinicians can perform nomogram analyses based on individual differences and available information, which provides methodological information for the prediction of molecular subtypes of breast cancer.
This study has several limitations. First, it should be noted that the retrospective nature of the study introduces a certain degree of selection bias. Second, it is important to acknowledge that this study was conducted at a single center, which may limit the generalizability of the findings. Therefore, future multicenter studies are required to validate the radiomics model proposed in this study. Lastly, while peritumoral radiomics models were successfully established using DCE sequences, similar models utilizing T2WI and DWI sequences have not been developed. Although the DCE sequence outperforms T2WI and DWI sequences in predicting breast cancer molecular subtypes without compromising the final results, it is also essential to consider experimental integrity. In future research endeavors, we aim to delve deeper into extracting valuable information from the T2WI and DWI sequences.
Conclusions
The nomogram based on independent predictors combined with intratumoral and peritumoral radiomics scores can be used as an auxiliary diagnostic tool for the molecular subtype prediction of breast cancer.
Data availability statement
The original contributions presented in the study are included in the article/Supplementary Material. Further inquiries can be directed to the corresponding authors.
Ethics statement
The studies involving humans were approved by Ethics Committee of the Second Affiliated Hospital of Dalian Medical University 2023-XWLW61. The studies were conducted in accordance with the local legislation and institutional requirements. Written informed consent for participation was not required from the participants or the participants’ legal guardians/ next of kin in accordance with the national legislation and institutional requirements.
Author contributions
YH: Writing – original draft, Writing – review & editing. MH: Writing – original draft, Writing – review & editing. LX: Writing – original draft. YC: Writing – review & editing. YD: Validation, Writing – review & editing.
Funding
The author(s) declare that no financial support was received for the research, authorship, and/or publication of this article.
Acknowledgments
We would like to thank the Second Affiliated Hospital of Dalian Medical University for their endless support.
Conflict of interest
Author LX was employed by GE Healthcare, MR Research China.
The remaining authors declare that the research was conducted in the absence of any commercial or financial relationships that could be construed as a potential conflict of interest.
Publisher’s note
All claims expressed in this article are solely those of the authors and do not necessarily represent those of their affiliated organizations, or those of the publisher, the editors and the reviewers. Any product that may be evaluated in this article, or claim that may be made by its manufacturer, is not guaranteed or endorsed by the publisher.
Supplementary material
The Supplementary Material for this article can be found online at: https://www.frontiersin.org/articles/10.3389/fonc.2025.1379048/full#supplementary-material
Abbreviations
mMRI, multiple Magnetic Resonance Imaging; T1WI, T1-Weighted Imaging; T2WI, T2-Weighted Imaging; Fat Sat T2WI, FS T2-Weighted Imaging; DWI, Diffusion Weighted Imaging; DCE-MRI, Dynamic Contrast-Enhanced MRI; ER, Estrogen Receptor; PR, Progesterone Receptor; HER2, Human Epidermal growth factor Receptor-2; HR, Hormone Receptor; TNBC, Triple-Negative Breast Cancer; BI-RADS, Breast Imaging Reporting And Data System; VOI, Volume of Interest; AUC, Area Under Curve; CI, Confidence Interval; OR, Odds Ratio; LASSO, Least Absolute Shrinkage and Selection Operator; ROC, Receiver Operating Characteristic; Rad-score, Radiomics Score; IHC, Immunohistochemistry; FISH, Fluorescence In Situ Hybridization; TE, Echo Time; TR, Repetition Time; EGFR, Epidermal Growth Factor Receptor; PCR, Polymerase Chain Reaction.
References
1. Sung H, Ferlay J, Siegel RL, Laversanne M, Soerjomataram I, Jemal A, et al. Global cancer statistics 2020: GLOBOCAN estimates of incidence and mortality worldwide for 36 cancers in 185 countries. CA: Cancer J Clin. (2021) 71:209–49. doi: 10.3322/caac.21660
2. Siegel RL, Miller KD, Fuchs HE, Jemal A. Cancer statistics, 2022. CA: Cancer J Clin. (2022) 72:7–33. doi: 10.3322/caac.21708
3. Park S, Koo JS, Kim MS, Park HS, Lee JS, Lee JS, et al. Characteristics and outcomes according to molecular subtypes of breast cancer as classified by a panel of four biomarkers using immunohistochemistry. Breast (Edinburgh Scotland). (2012) 21:50–7. doi: 10.1016/j.breast.2011.07.008
4. Engstrøm MJ, Opdahl S, Hagen AI, Romundstad PR, Akslen LA, Haugen OA, et al. Molecular subtypes, histopathological grade and survival in a historic cohort of breast cancer patients. Breast Cancer Res Treat. (2013) 140:463–73. doi: 10.1007/s10549-013-2647-2
5. Kim JH, Ko ES, Lim Y, Lee KS, Han BK, Ko EY, et al. Breast cancer heterogeneity: MR imaging texture analysis and survival outcomes. Radiology. (2017) 282:665–75. doi: 10.1148/radiol.2016160261
6. Xu H, Liu J, Chen Z, Wang C, Liu Y, Wang M, et al. Intratumoral and peritumoral radiomics based on dynamic contrast-enhanced MRI for preoperative prediction of intraductal component in invasive breast cancer. Eur Radiol. (2022) 32:4845–56. doi: 10.1007/s00330-022-08539-3
7. Mehraj U, Ganai RA, Macha MA, Hamid A, Zargar MA, Bhat AA, et al. The tumor microenvironment as driver of stemness and therapeutic resistance in breast cancer: New challenges and therapeutic opportunities. Cell Oncol (Dordrecht). (2021) 44:1209–29. doi: 10.1007/s13402-021-00634-9
8. Braman NM, Etesami M, Prasanna P, Dubchuk C, Gilmore H, Tiwari P, et al. Intratumoral and peritumoral radiomics for the pretreatment prediction of pathological complete response to neoadjuvant chemotherapy based on breast DCE-MRI. Breast Cancer Res: BCR. (2017) 19:57. doi: 10.1186/s13058-017-0846-1
9. Wu M, Zhong X, Peng Q, Xu M, Huang S, Yuan J, et al. Prediction of molecular subtypes of breast cancer using BI-RADS features based on a “white box” machine learning approach in a multi-modal imaging setting. Eur J Radiol. (2019) 114:175–84. doi: 10.1016/j.ejrad.2019.03.015
10. Zwanenburg A, Vallières M, Abdalah MA, Aerts HJWL, Andrearczyk A, Apte A, et al. The image biomarker standardization initiative: standardized quantitative radiomics for high-throughput image-based phenotyping. Radiology. (2020) 295:328–38. doi: 10.1148/radiol.2020191145
11. Carré A, Klausner G, Edjlali M, Lerousseau M, Briend-Diop J, Sun R, et al. Standardization of brain MR images across machines and protocols: bridging the gap for MRI-based radiomics. Sci Rep. (2020) 10:12340. doi: 10.1038/s41598-020-69298-z
12. Yetkin D, Akpınar MG, Durhan G, Demirkazik FB. Comparison of clinical and magnetic resonance imaging findings of triple-negative breast cancer with non-triple-negative tumours. Polish J Radiol. (2021) 86:e269–e76. doi: 10.5114/pjr.2021.106137
13. Jeh SK, Kim SH, Kim HS, Kang BJ, Jeong SH, Yim HW, et al. Correlation of the apparent diffusion coefficient value and dynamic magnetic resonance imaging findings with prognostic factors in invasive ductal carcinoma. J Magn Reson Imaging: JMRI. (2011) 33:102–9. doi: 10.1002/jmri.22400
14. Angelini G, Marini C, Iacconi C, Mazzotta D, Moretti M, Picano E, et al. Magnetic resonance (MR) features in triple negative breast cancer (TNBC) vs receptor positive cancer (nTNBC). Clin Imaging. (2018) 49:12–6. doi: 10.1016/j.clinimag.2017.10.016
15. Santucci D, Faiella E, Cordelli E, Calabrese A, Landi R, de Felice C, et al. The impact of tumor edema on T2-weighted 3T-MRI invasive breast cancer histological characterization: A pilot radiomics study. Cancers. (2021) 13(18):4635. doi: 10.3390/cancers13184635
16. Baltzer PA, Yang F, Dietzel M, Herzog A, Simon A, Vag T, et al. Sensitivity and specificity of unilateral edema on T2w-TSE sequences in MR-Mammography considering 974 histologically verified lesions. Breast J. (2010) 16:233–9. doi: 10.1111/j.1524-4741.2010.00915.x
17. Costantini M, Belli P, Distefano D, Bufi E, Matteo MD, Rinaldi P, et al. Magnetic resonance imaging features in triple-negative breast cancer: comparison with luminal and HER2-overexpressing tumors. Clin Breast Cancer. (2012) 12:331–9. doi: 10.1016/j.clbc.2012.07.002
18. Cheon H, Kim HJ, Kim TH, Ryeom HK, Lee J, Kim GC, et al. Invasive breast cancer: prognostic value of peritumoral edema identified at preoperative MR imaging. Radiology. (2018) 287:68–75. doi: 10.1148/radiol.2017171157
19. Kuhl CK, Schrading S, Bieling HB, Wardelmann E, Leutner CC, Koenig R, et al. MRI for diagnosis of pure ductal carcinoma in situ: a prospective observational study. Lancet (London England). (2007) 370:485–92. doi: 10.1016/S0140-6736(07)61232-X
20. Leithner D, Wengert GJ, Helbich TH, Thakur S, Ochoa-Albiztegui RE, Morris EA, et al. Clinical role of breast MRI now and going forward. Clin Radiol. (2018) 73:700–14. doi: 10.1016/j.crad.2017.10.021
21. Li H, Zhu Y, Burnside ES, Huang E, Drukker K, Hoadley KA, et al. Quantitative MRI radiomics in the prediction of molecular classifications of breast cancer subtypes in the TCGA/TCIA data set. NPJ Breast Cancer. (2016) 2:16012–. doi: 10.1038/npjbcancer.2016.12
22. Zhang S, Wang X, Yang Z, Zhu Y, Zhao N, Li Y, et al. Intra- and peritumoral radiomics model based on early DCE-MRI for preoperative prediction of molecular subtypes in invasive ductal breast carcinoma: A multitask machine learning study. Front Oncol. (2022) 12:905551. doi: 10.3389/fonc.2022.905551
23. Zhang Y, Chen JH, Lin Y, Chan S, Zhou J, Chow D, et al. Prediction of breast cancer molecular subtypes on DCE-MRI using convolutional neural network with transfer learning between two centers. Eur Radiol. (2021) 31:2559–67. doi: 10.1007/s00330-020-07274-x
24. Fan M, He T, Zhang P, Cheng H, Zhang J, Gao X, et al. Diffusion-weighted imaging features of breast tumours and the surrounding stroma reflect intrinsic heterogeneous characteristics of molecular subtypes in breast cancer. NMR Biomed. (2018) 31(2):3869. doi: 10.1002/nbm.v31.2
25. Li C, Song L, Yin J. Intratumoral and peritumoral radiomics based on functional parametric maps from breast DCE-MRI for prediction of HER-2 and Ki-67 status. J Magn Reson Imaging: JMRI. (2021) 54:703–14. doi: 10.1002/jmri.27651
26. Braman N, Prasanna P, Whitney J, Singh S, Beig N, Etesami M, et al. Association of peritumoral radiomics with tumor biology and pathologic response to preoperative targeted therapy for HER2 (ERBB2)-positive breast cancer. JAMA Netw Open. (2019) 2:e192561. doi: 10.1001/jamanetworkopen.2019.2561
27. Niu S, Jiang W, Zhao N, Jiang T, Dong Y, Luo Y, et al. Intra- and peritumoral radiomics on assessment of breast cancer molecular subtypes based on mammography and MRI. J Cancer Res Clin Oncol. (2022) 148:97–106. doi: 10.1007/s00432-021-03822-0
28. Kim SY, Cho N, Choi Y, Lee SH, Ha SM, Kim ES, et al. Factors affecting pathologic complete response following neoadjuvant chemotherapy in breast cancer: development and validation of a predictive nomogram. Radiology. (2021) 299:290–300. doi: 10.1148/radiol.2021203871
29. Yu Y, Tan Y, Xie C, Hu Q, Ouyang J, Chen Y, et al. Development and validation of a preoperative magnetic resonance imaging radiomics-based signature to predict axillary lymph node metastasis and disease-free survival in patients with early-stage breast cancer. JAMA Netw Open. (2020) 3:e2028086. doi: 10.1001/jamanetworkopen.2020.28086
Keywords: breast cancer, molecular typing, radiomics, magnetic resonance imaging, peritumoral
Citation: Han Y, Huang M, Xie L, Cao Y and Dong Y (2025) The value of intratumoral and peritumoral radiomics features based on multiparametric MRI for predicting molecular staging of breast cancer. Front. Oncol. 15:1379048. doi: 10.3389/fonc.2025.1379048
Received: 30 January 2024; Accepted: 28 January 2025;
Published: 11 March 2025.
Edited by:
Ana Salomé Pires, University of Coimbra, PortugalReviewed by:
Ruiqi Li, University of Texas Southwestern Medical Center, United StatesJie He, Zhejiang University School of Medicine, China
Copyright © 2025 Han, Huang, Xie, Cao and Dong. This is an open-access article distributed under the terms of the Creative Commons Attribution License (CC BY). The use, distribution or reproduction in other forums is permitted, provided the original author(s) and the copyright owner(s) are credited and that the original publication in this journal is cited, in accordance with accepted academic practice. No use, distribution or reproduction is permitted which does not comply with these terms.
*Correspondence: Yuhai Cao, aGFpeWFuZ18xNDIyQDEyNi5jb20=; Yang Dong, MjMxMjE1NDZAcXEuY29t
†These authors have contributed equally to this work and share first authorship