 Fei Li1†Baiyang Jiang2†Ye Fu2†Qingyang Yu2Guangwen Duan2Jiayang Yan2Qinling Jiang2Hongbiao Sun2
 Yi Xiao2Qi Chen3Shaochun Xu2*Xiang Wang2*
 Shiyuan Liu2*
- 1Department of Research and Development, Shanghai United Imaging Intelligence Co., Ltd., Shanghai, China
- 2Department of Radiology, Changzheng Hospital, Naval Medical University, Shanghai, China
- 3Department of Radiology, Kunshan Third People’s Hospital, Kunshan, Jiangsu, China
Objective: This study aimed to construct and validate a fusion diagnostic model based on Fluorodeoxyglucose-Positron Emission Tomography/Computed Tomography(FDG-PET/CT) radiomics for predicting overall survival of multiple myeloma (MM) patients.
Methods: A total of 199 patients newly diagnosed with MM were included from two centers. All patients underwent whole-body PET/CT scans within one month before the initiation of treatment and were followed up for over five years. Radiomic features of MM were extracted from CT images and dimensionality reduction was performed by LASSO regression analysis. Cox Proportional Hazards Model was then constructed to predict patient survival. A clinical-radiomic fusion model was constructed by integrating independent clinical risk factors, including comprehensive laboratory parameters, R-ISS, and PET functional metabolic parameters, with the radiomic model. The discrimination ability of the model was evaluated using the C-index, and it’s calibration was assessed using calibration curves.
Results: The C-indexes for the radiomics model in the training and testing cohorts were 0.736 and 0.708, respectively; for the clinical model, they were 0.676 and 0.696, respectively; and for the integrated model, they were 0.791 and 0.776, respectively. The integrated diagnostic model outperformed both the radiomics and clinical models, showcasing higher discriminative ability and improved calibration. In the training set, the C-index was 0.791 (95% confidence interval [CI]: 0.713-0.853), with an ICI of 0.015, E50 of 0.014, and AIC of 10.987. In the testing set, the C-index was 0.776 (95% CI: 0.654–0.894), with an ICI of 0.069, E50 of 0.04, and AIC of 11.492.
Conclusions: This integrated prediction model exhibited satisfactory performance in predicting survival outcomes for patients diagnosed with MM and improved precision in discriminating between patients with a good prognosis and poor prognosis.
Introduction
Multiple myeloma (MM) is a hematological malignancy, which is characterized by the abnormal production of monoclonal immunoglobulin M components within plasma cells situated in the bone marrow (1). Worldwide, MM is responsible for about 1% of cancer deaths, mainly affecting people aged 65–70 and more common in males, accounting for 10-15% of hematological malignancies (2). Significant progress has been made in treatment strategies, particularly with the development of new drugs that can elicit long-lasting responses. However, the prognosis for specific patients has shown limited improvement (3). A critical aspect of clinical practice involves accurately assessing patient risks and implementing precise treatment protocols. Osteopathy in MM patients significantly affect their quality of life and increase both incidence rates and mortality (4–6). Imaging examination plays a critical role in managing MM patients. According to the latest staging system, accurate treatment selection, follow-up procedures, and prognosis evaluation for newly diagnosed patients are significantly dependent on imaging assessments such as CT, Magnetic Resonance Imaging (MRI), or PET/CT.
CT, MRI, and PET/CT imaging modalities are increasingly utilized in clinical practice for their ability to offer a thorough evaluation of tumor burden. Additionally, these imaging methods offer supplementary predictive information for patients receiving systemic treatment. Whole-body low-dose computed tomography (WBLDCT) is a highly accurate method for detecting osteolytic lesions while offering a low radiation dose (7, 8). The introduction of whole-body MRI has redirected attention in imaging towards bone marrow and extramedullary involvement (9). However, variations in signal intensity within bone marrow involvement present notable differences linked to age disparities (10). The International Myeloma Working Group (IMWG) recommends FDG-PET as a valuable technique for visualizing and offering functional and metabolic information of lesions, thereby highlighting disease activity. This method is particularly useful in monitoring treatment response, especially in cases of oligo-secretory and non-secretory myeloma, and aid in disease monitoring for patients with these particular subtypes.
PET/CT modality plays a vital role in the initial staging, treatment assessment, and minimal residual disease determination in MM (11, 12). However, its primarily utilization is dependent on subjective visual assessment by clinicians and basic quantitative metrics like maximum standardized uptake value (SUVmax) for evaluating MM tumor burden and predicting prognosis (13). Bartel et al. demonstrated that baseline MRI and PET/CT scans have prognostic significance for event-free survival and overall survival (OS) in patients (14). In clinical practice, quantitative values such as SUVmax, metabolic tumor volume (MTV), and total lesion glycolysis(TLG) primarily reflect the metabolic functional information of MM lesions, while neglecting a more in-depth analysis of CT anatomical information. Therefore, it is important to study the quantitative features of CT images to enhance predictive accuracy in MM by analyzing the spatial distribution and metabolic heterogeneity of focal lesions in MM.
Radiomics entails the extraction of lesion imaging features through high-throughput analysis, yielding quantitative parameters that are frequently undetectable by visual inspection (15–17). The increasing interest among researchers in radiomic research highlights its significance as a valuable tool for evaluating the prognosis of tumor patients. Nevertheless, numerous radiomic models fail to incorporate clinical and laboratory data. We hypothesize that by integrating baseline PET/CT radiomics information with genetic and laboratory examination indicators, personalized prognostic evaluation models can be constructed. In this retrospective multi-center study, we developed a prediction model for multiple myeloma (MM) using a combination of multi-modal PET/CT radiomics data and various clinical variables from two medical centers.
Materials and methods
Study population
A total of 199 patients diagnosed with MM were included in this study between December 2015 and December 2022. Each patient was diagnosed as MM through comprehensive histological and hematological examinations, adhering to the IMWG guidelines for both diagnosis and treatment (18). Additionally, all patients provided written informed consent to participate. Full-body PET/CT examinations were conducted within one month before the initiation of treatment for each patient.
The exclusion criteria were: (a) patients with combined malignant tumors or hematological diseases in other systems; (b) patients with concomitant cardiac amyloidosis; (c) patients received chemotherapy and radiation therapy before the examination; (d) patients with poor image quality. Following the inclusion criteria, a total of 199 patients (110 males and 89 females) were enrolled, with a median age of 61 years and an age range between 34 and 86 years. All patients underwent comprehensive blood-based laboratory tests. Laboratory indicators encompassed M protein, sFLC (free light chain), hemoglobin, creatinine, albumin, Ca2+, lactate dehydrogenase, β2-microglobulin levels, platelets, hypersensitive C-reactive protein, and PET/CT quantitative parameters. Serum protein, serum albumin, glucose filtration rate, beta-2 microglobulin, hemoglobin, hematocrit, calcium levels, and serum lactate dehydrogenase were additionally quantified. The treatment plans are divided into three categories: chemotherapy regimens based on proteasome inhibitor–based therapy(PI-based), chemotherapy regimens based on immunomodulatory drug-based therapy(IMiD-based), and chemotherapy regimens based on the combination of proteasome inhibitor-containing therapy and immunomodulatory drug-based therapy(IMiD+PI).
Imaging data for this study were obtained from two centers, with clinical treatment administered at Changzheng Hospital for a cohort of 199 patients. The primary endpoint of the study was overall survival (OS), defined as the duration from disease diagnosis to death or last follow-up. OS was calculated from the time of initial diagnosis until death or the study’s endpoint in December 2022 for surviving patients. The baseline characteristics and treatment information of patients are described in Table 1. A flowchart illustrating patients selection and the study process is presented in Figure 1.
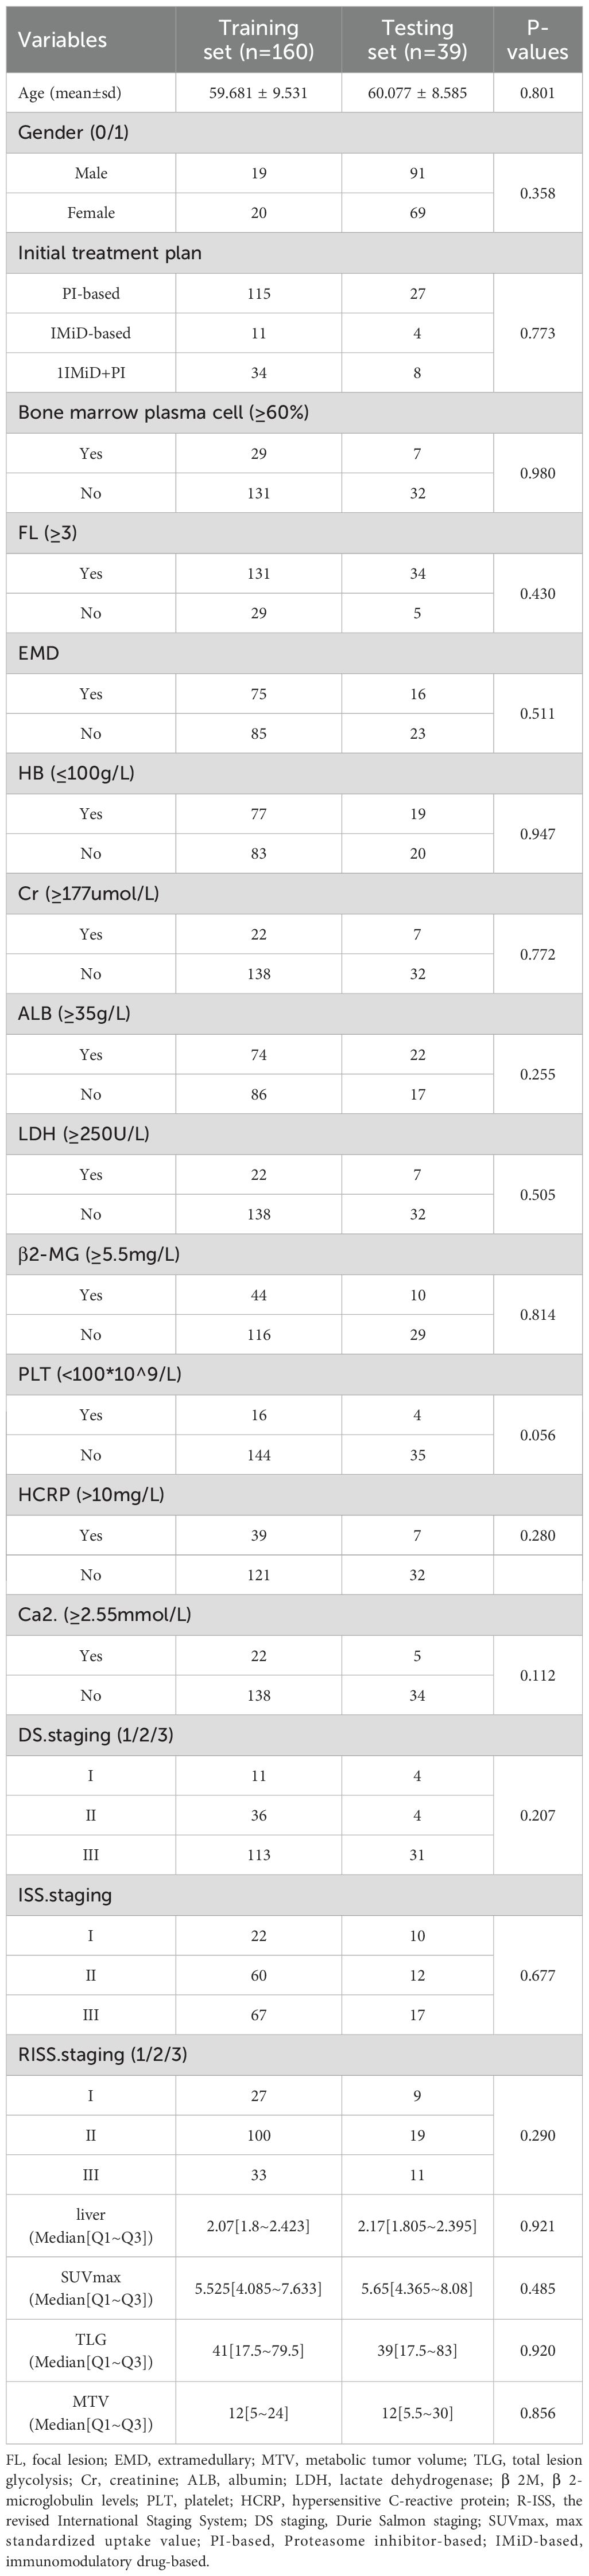
Table 1. Basic patient information of training set and testing set.
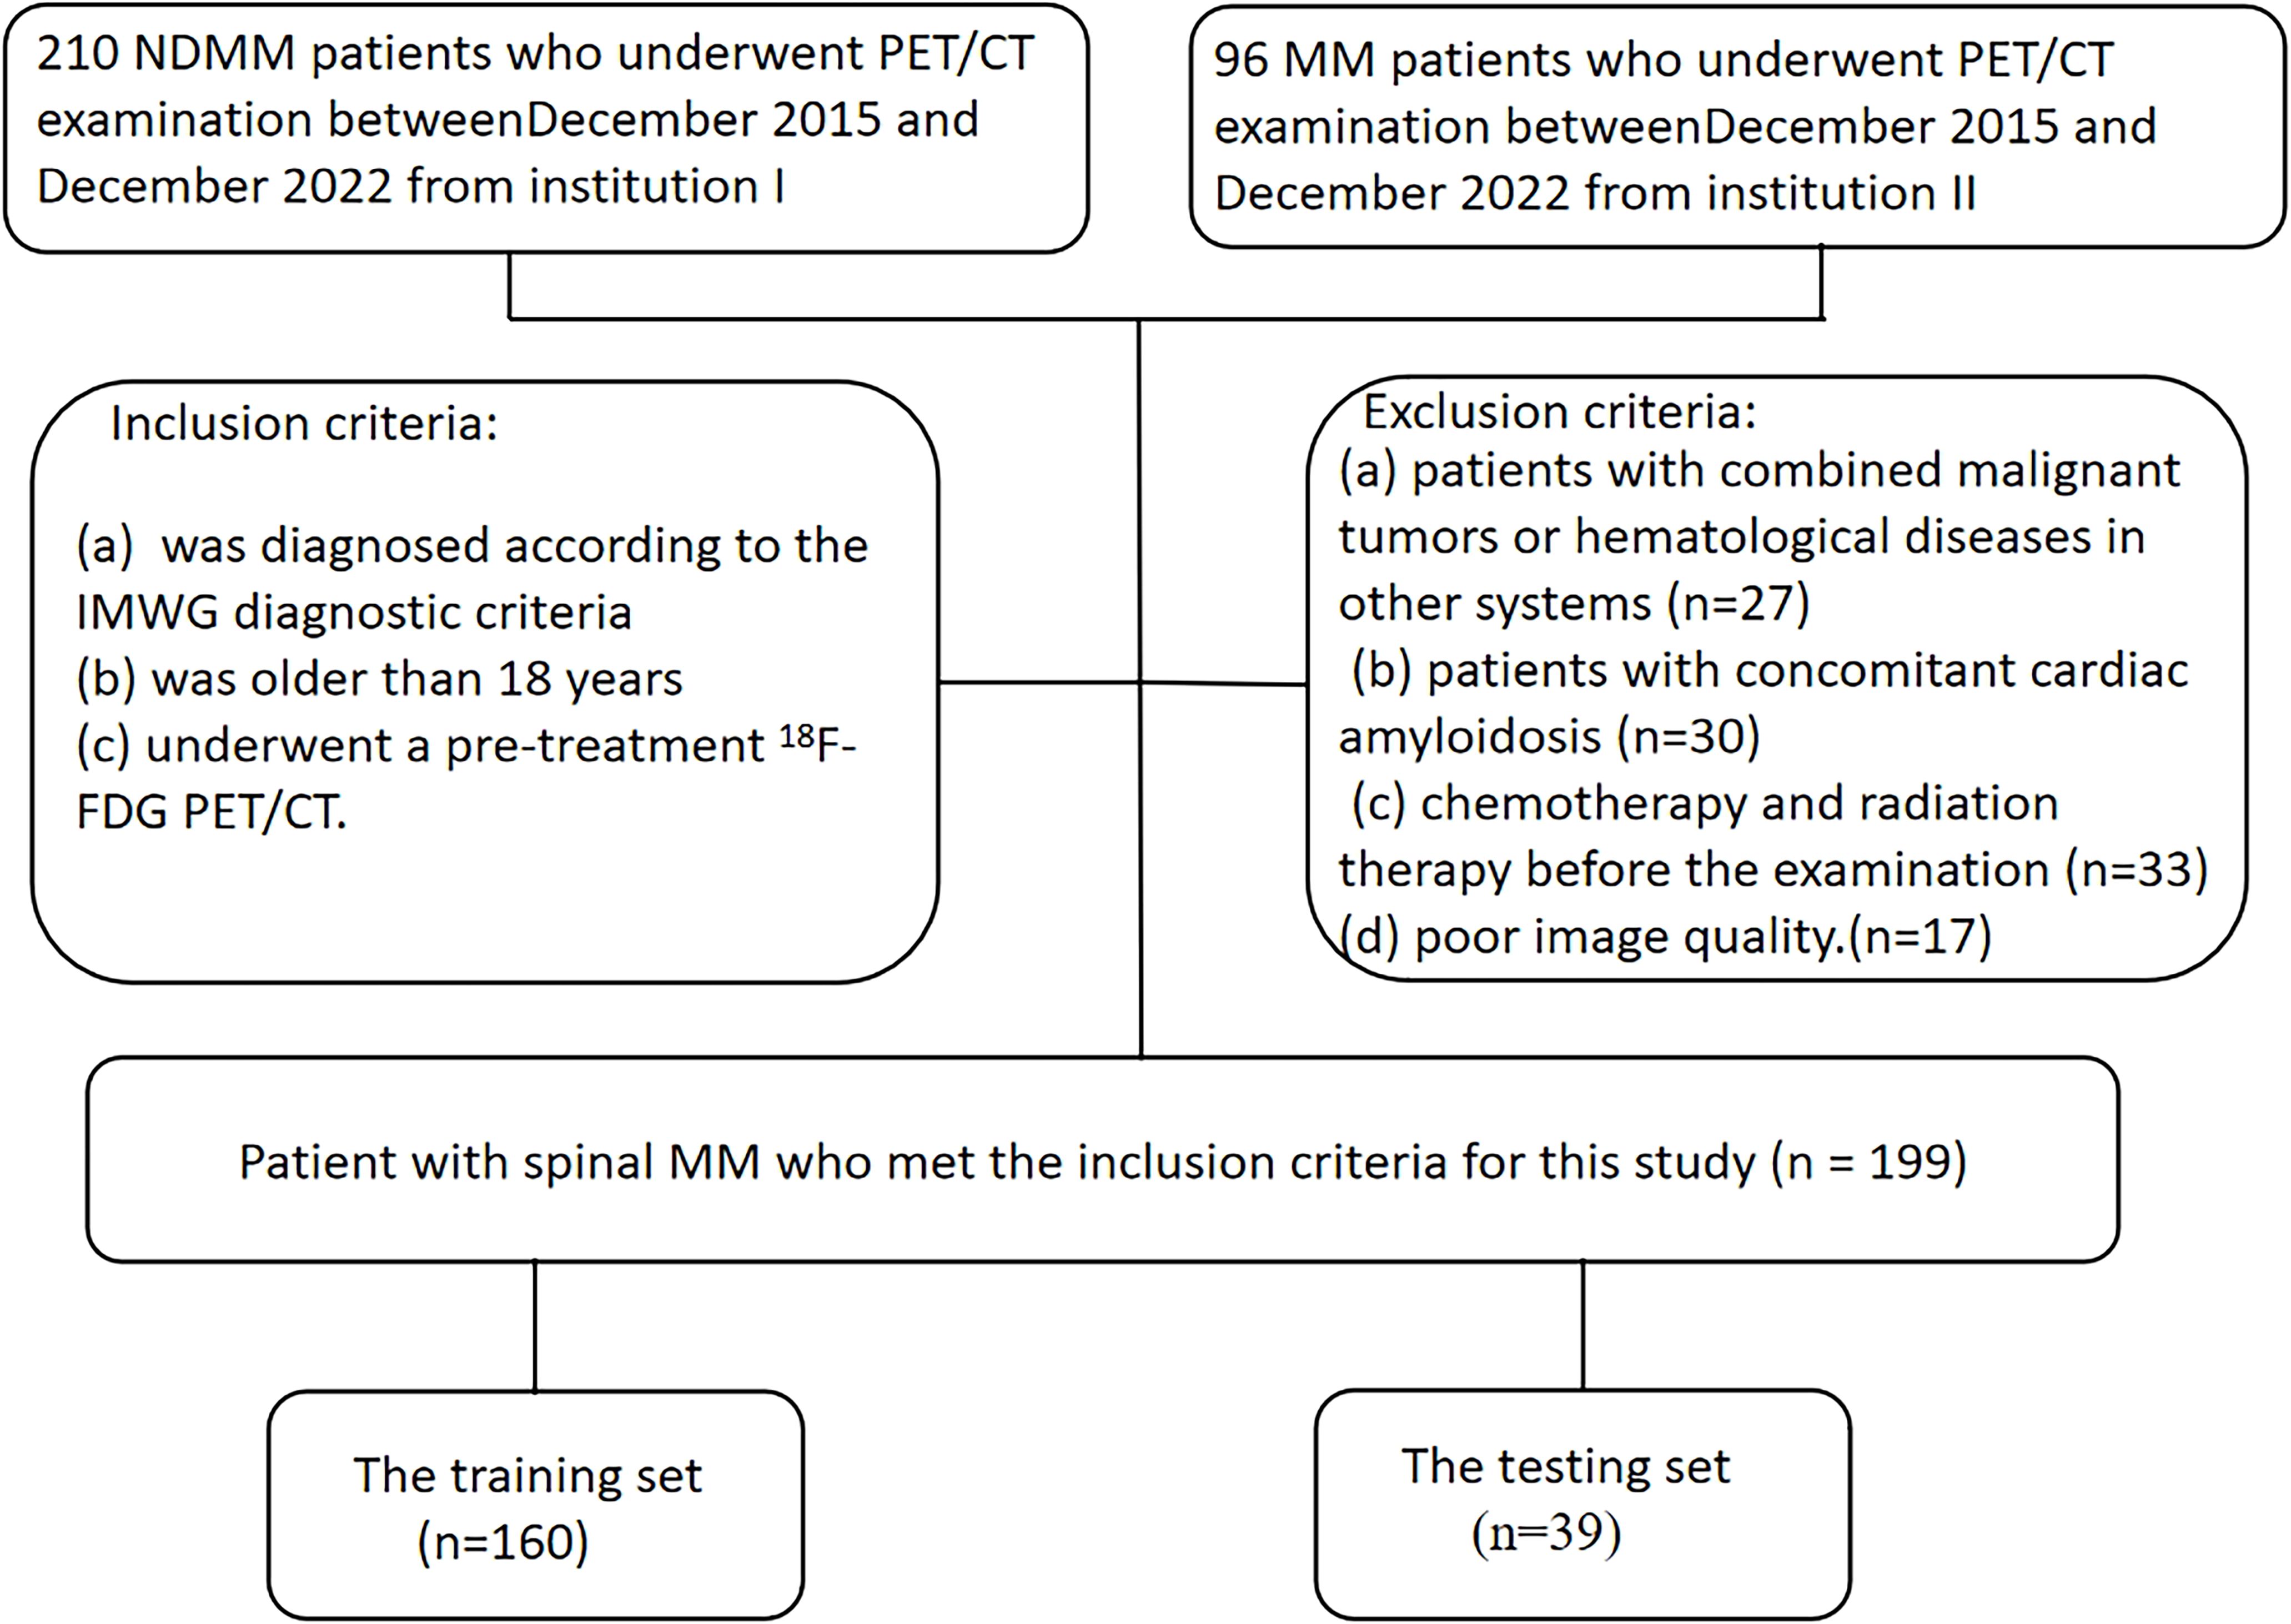
Figure 1. Flowchart summarizing patient enrolment process and study cohorts.
Equipment and parameters
All images were obtained from the hospital’s Picture Archiving and Communication System (PACS) and scanned using the SIEMENS Biograph 64-layer PET/CT equipment. Patients underwent a fasting period of over 6 hours before being injected with 18F-FDG at a concentration of 0.15-0.18 mCi/kg. Typically, the PET/CT scan commenced 60 minutes post-injection. Patients were positioned supine with both upper arms placed above their heads to minimize chest artifacts.
The procedure began with a body CT scan, using scanning parameters of tube voltage of 120 kV, tube current of 150 mA, layer thickness of 3mm, and scanning range from the top of the skull to the middle of the femur. The body PET/CT scan was collected for 5–6 beds, with a conventional collection time of two minutes per bed. Subsequently, CT data was utilized for attenuation correction and PET image enhancement, followed by image reconstruction and fusion. Lesions were further analyzed via multi-planar reconstruction at the post-processing workstation.
PET image delineation and registration between PET and CT images
Two experienced radiologists, with 6 and 7 years of expertise respectively, conducted blind segmentation of lesions exhibiting the highest uptake on PET scans. In cases of discrepancies concerning PET/CT findings, a consensus was reached through a collaborative review involving a senior nuclear medicine physician with over 10 years of experience. The interpretation of PET images adhered to IMWG standards, defining focal lesions as those exhibiting higher uptake than the hematopoietic bone marrow background (BM) or liver, with a minimum diameter of 5 mm. Diffuse uptake was defined as uptake above that of the liver (19).
Evaluation of images was carried out by a team of experienced nuclear medicine physicians (W.X. and X.S.) following established criteria for assessing myeloma lesions. Briefly, positive areas were indicated by the presence of focal areas with increased tracer uptake within bones (SUV ≥2.5), with or without any underlying lesions identified on CT or osteolytic CT areas >0.5 cm (20). The total Metabolic Tumor Volume (TMTV) was defined as the volume of all MM lesions throughout the body on PET/CT with an SUV≥2.5. To enhance segmentation consistency, two radiologists randomly selected 20 patients for intra- and inter-observer consistency tests. Intra-group and inter-group consistency coefficients (ICC) between features were computed to identify and retain features demonstrating robust repeatability (ICC>0.70).
We employed the PET/CT registration method available on the platform (https://www.uii-ai.com/en/uai/scientific-research) for the automated alignment of PET and CT images. Subsequently, a senior medical radiologist reviewed the registered images to confirm the precise alignment of major organ boundaries, such as the skin, skeletal structures, and liver. A registration matrix was generated to quantify this alignment. Ultimately, the regions of interest (ROI) identified from the PET images were overlaid onto corresponding locations within CT images (Figure 2).
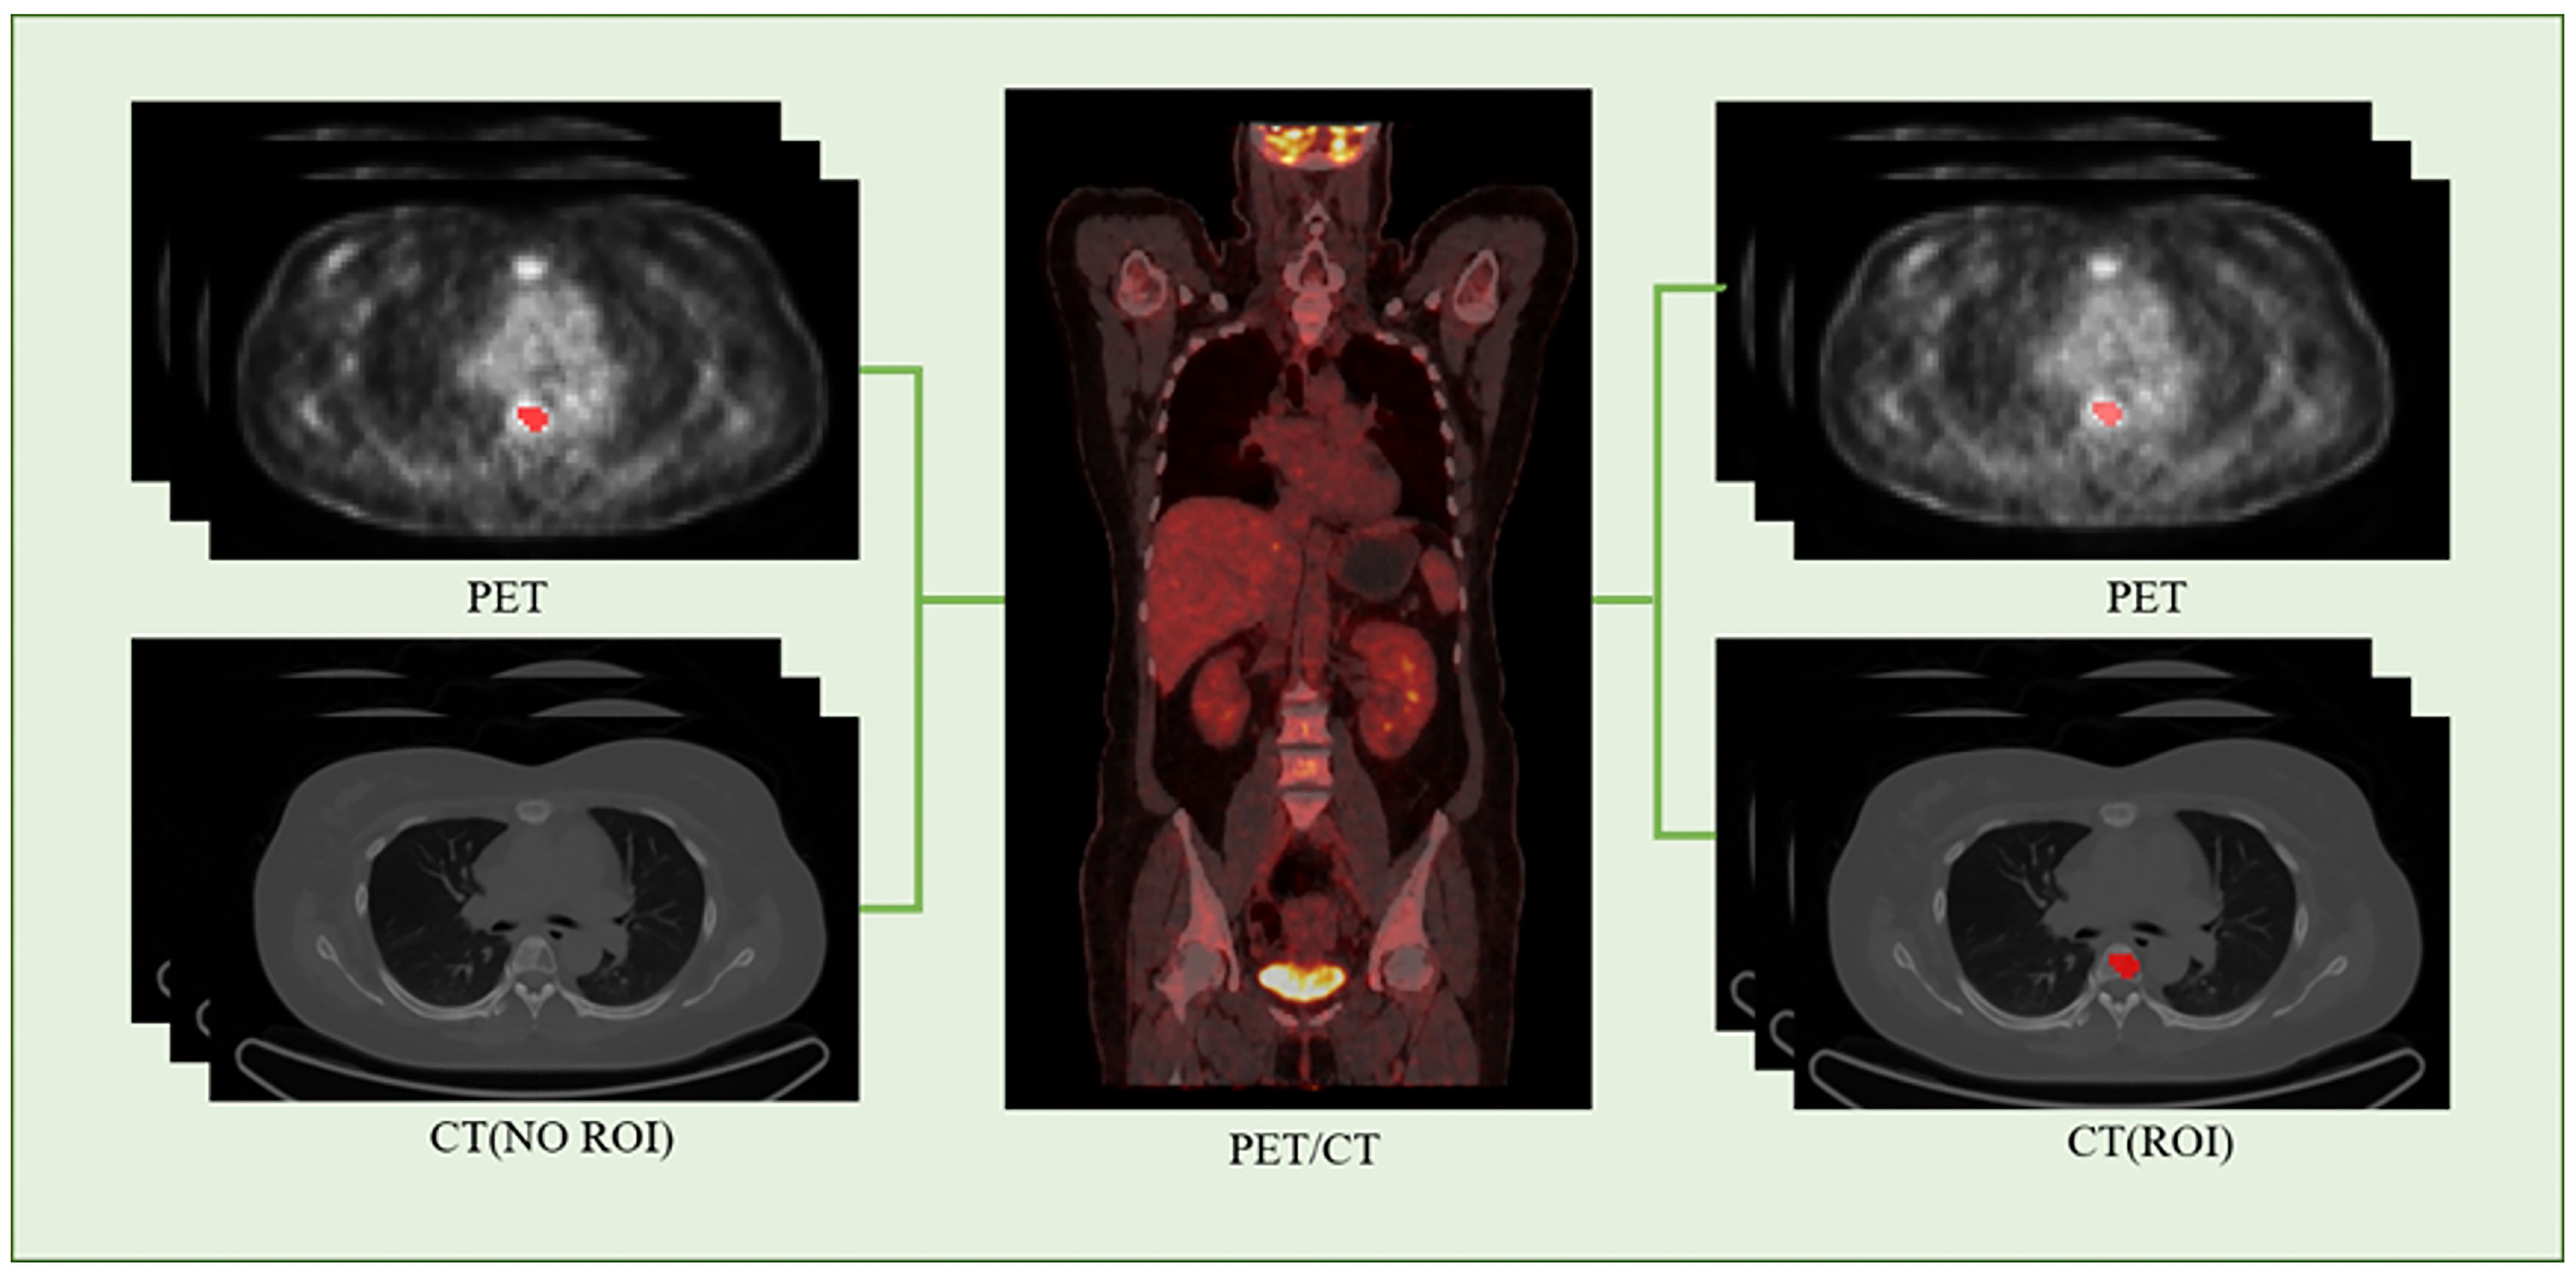
Figure 2. PET-CT registration process flowchart.
Radiomics extraction and selection
The flowchart of the radiomics analysis is shown in Figure 3. Initially, all parametric maps underwent normalization using maximum and minimum truncation processing. Subsequently, 14 image filters were used to generate derived images, from which first-order statistics and texture features were extracted, resulting in a total of 2,160 derived features. From the largest focal area of myeloma in each patient, 2,264 radiomics features were automatically extracted. These features encompass three groups: 14 shape features, 450 first-order features quantifying the distribution of voxel intensities in images, and 1,800 texture features. The texture features consist of 525 gray level co-occurrence matrix (GLCM) features, 350 gray level run length matrix (GLRLM) features, 400 gray level size zone matrix (GLSZM) features, 400 neighboring gray tone difference matrix (NGTDM) features, 125 gray level dependent matrix (GLDM) features, collectively capturing regional heterogeneity differences. All radiomics features were standardized using Z-score normalization to mitigate dimensional disparities.
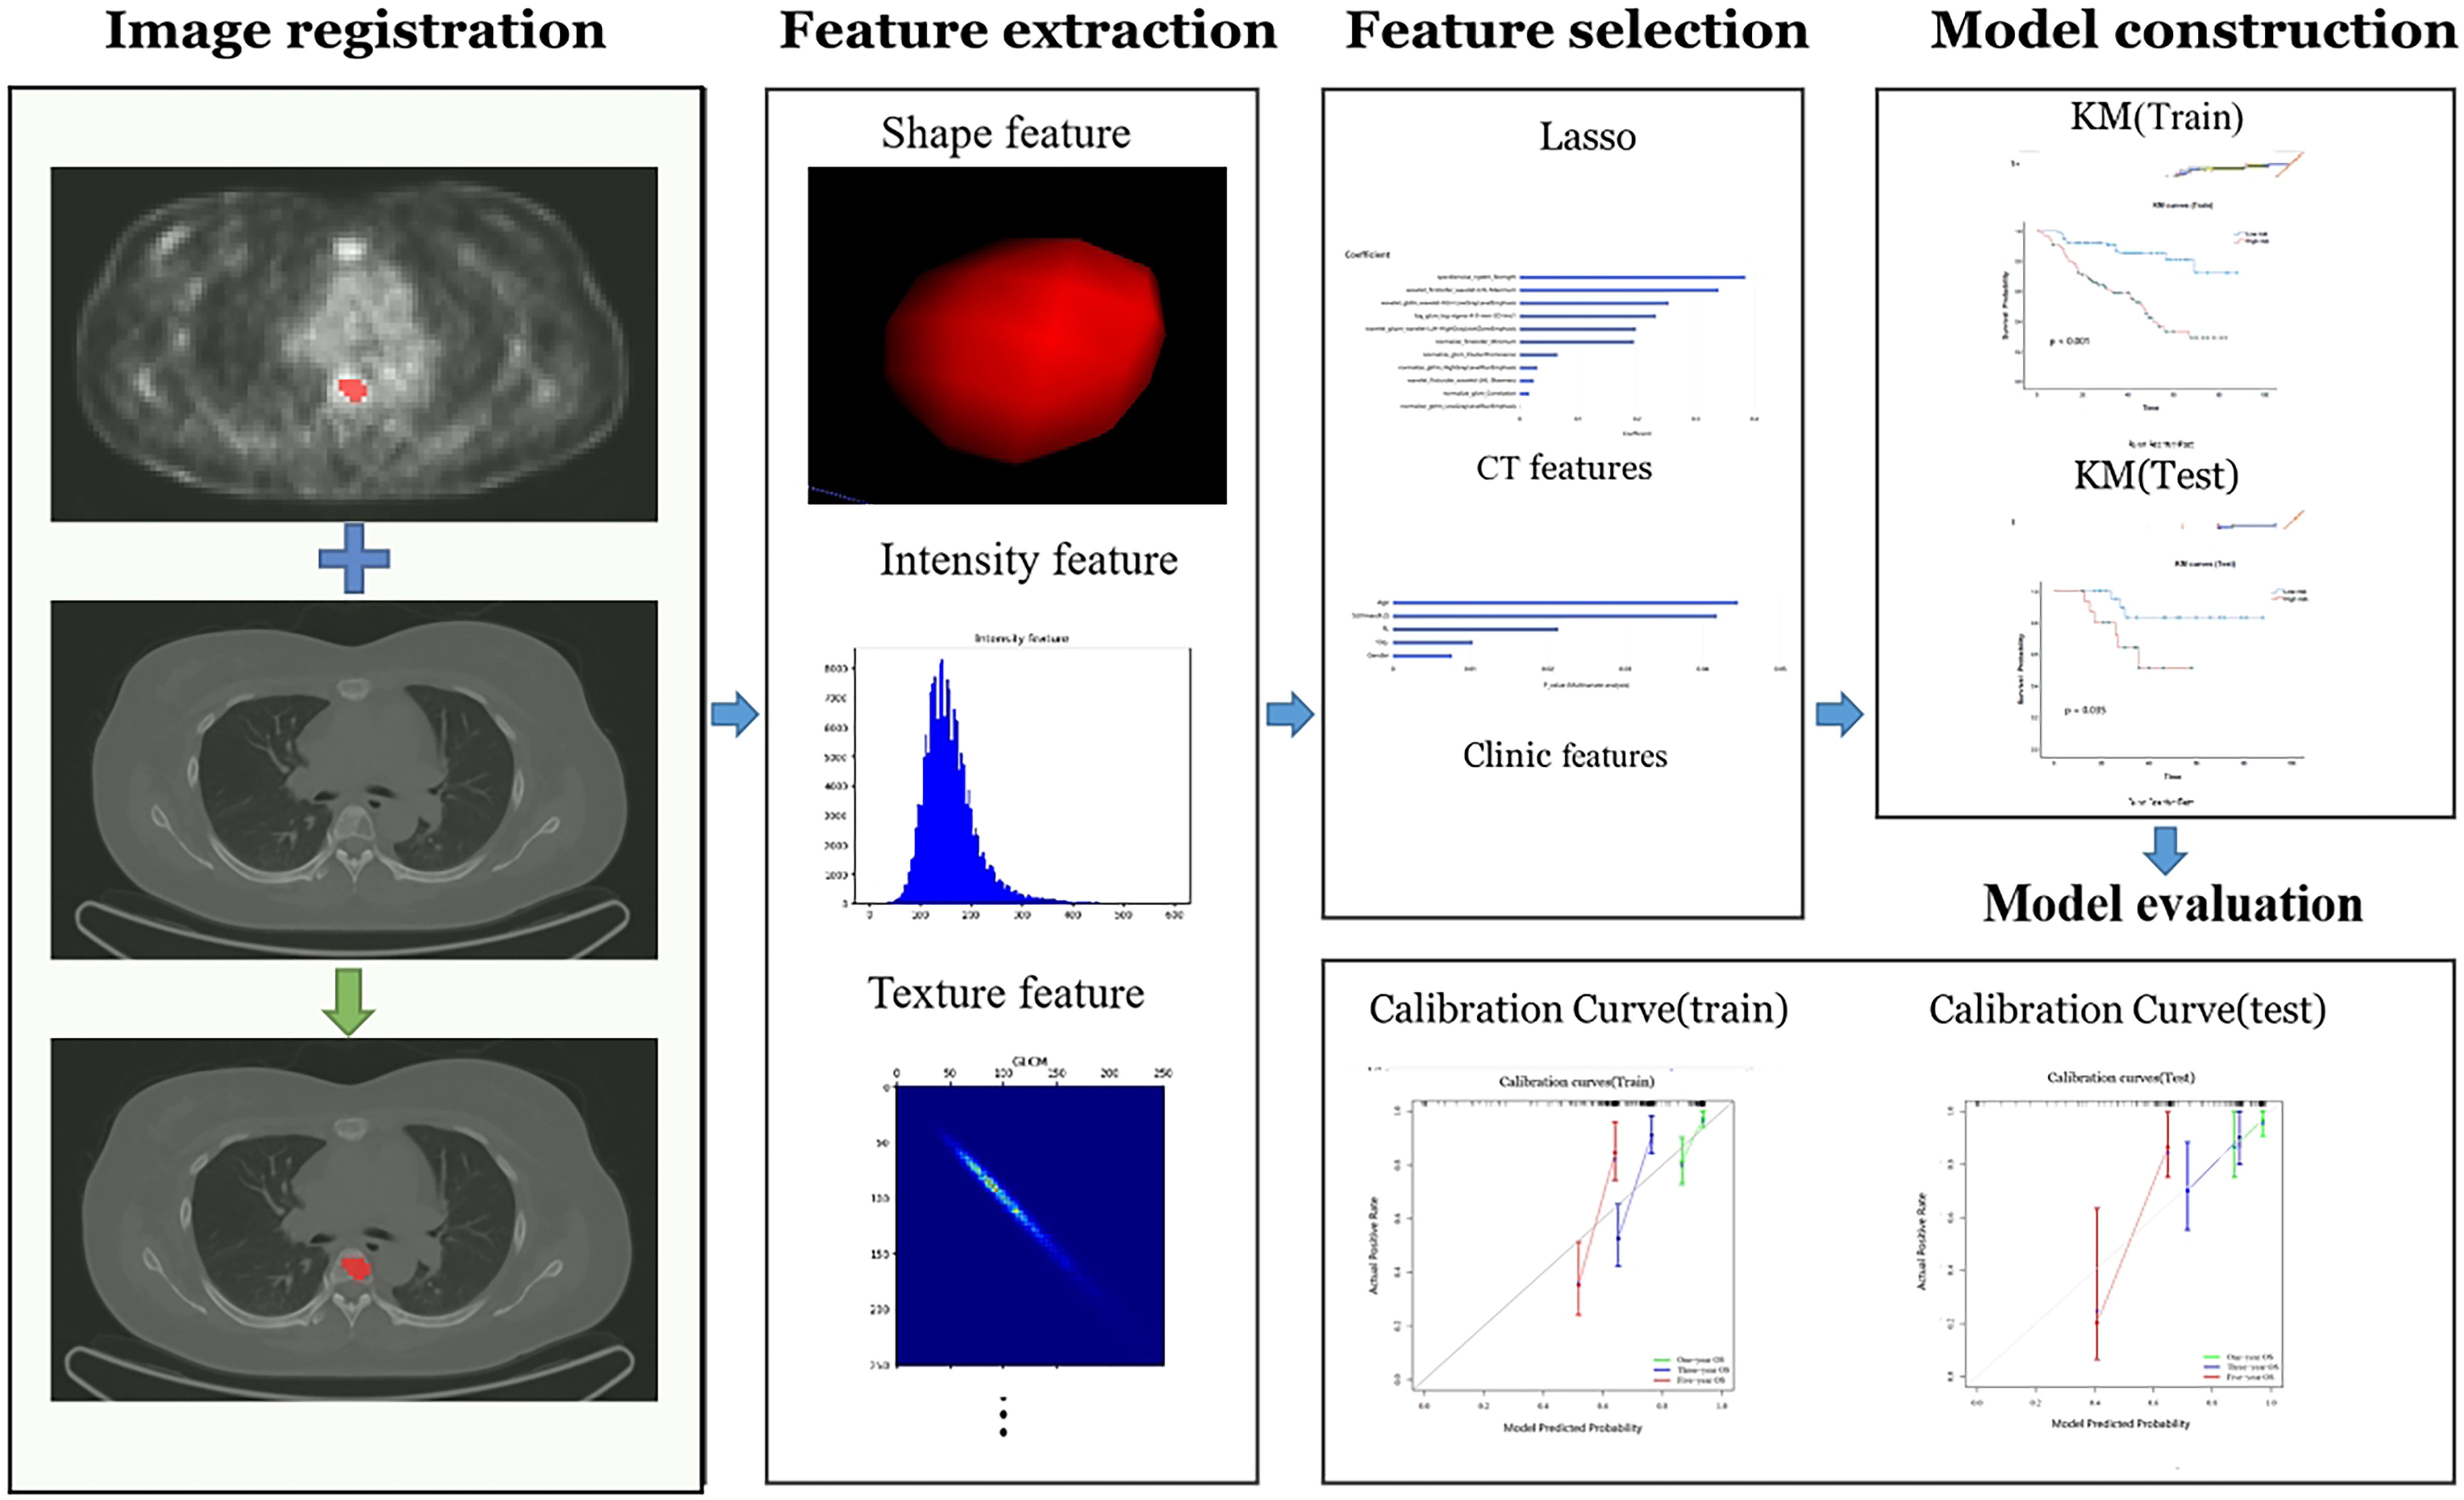
Figure 3. The radiomics workchart by uAI research portal. On the medical images, segmentation is performed to define the fibroids region. From this region the features are extracted, e.g. fibroids shape, intensity, and texture features. And then these features are used for analysis, which Those important features will be selected and used to construct predictive model. Finally, the model is evaluated.
For PET data, the functional metabolic parameters SUVmax, MTV, and TLG are indicators for indicating the tumor metabolic information. CT images are more suitable for radiomics extraction tasks related to texture, shape, and intensity features of multiple myeloma. We employed the Least Absolute Shrinkage and Selection Operator (LASSO) selection method to identify the most reliable predictive radiomic features. Initially, we focused on radiomics features extracted from CT images, leveraging these extracted features to construct a Cox proportional hazards regression model. Then we merged these CT features with clinical and PET features (SUVmax, MTV and TLG) to obtain a comprehensive combined model.
Prognosis model
Predictive task
Our predictive task aimed to accurately forecast the prognosis of MM patients. To mitigate risks of bias and overfitting, we employed two methods. Firstly, we filtered features by employing the intraclass correlation coefficient (ICC) within and between observers, establishing a threshold of ICC > 0.70. Secondly, we applied the least absolute shrinkage and selection operator (LASSO) to the training dataset, using a five-fold cross-validation approach to identify the most predictive features. These strategies were employed to identify the most informative features while ensuring optimal predictive performance.
Development and validation of the predictive model
We developed three models: the Clinical Model, the CT Radiomics Model, and the Combined Model. In the Clinical Model, we conducted a univariate analysis (p < 0.1) using COX regression on clinical data, encompassing parameters such as SUVmax, MTV, and TLG PET quantitative parameters. Moreover, based on the clinical relevance and results of the univariate Cox analysis (p < 0.05), candidate factors potentially associated with OS were identified. These candidate factors were further incorporated into a multivariable Cox regression model, facilitating the selection of clinical variables that could impact OS and contributing to the construction of the clinical model.
Regarding the CT radiomics model, we employed LASSO to select radiomics features extracted from the images. These selected features were subsequently employed in a COX regression analysis to construct the radiomics model. In the Combined Model, we integrated clinical risk factors and radiomics features to establish a combined model. This combined model was used to further predict postoperative survival in MM patients. To assess the efficacy of our model, we evaluated the performance of the CT Radiomics Model, Clinical Model, and Combined Model based on both discrimination and calibration.
To assess discrimination, we compared these models using four metrics: C-index values, Integrated Calibration Index (ICI), E50 statistic, and Akaike Information Criterion (AIC). The Akaike Information Criterion (AIC) is a widely used measure for evaluating the goodness-of-fit and complexity of a model. It is calculated as AIC = 2k - 2ln(L), where k represents the number parameters of in the model, and L is the maximum likelihood estimate of the model. In this study, we employed the Cox proportional hazards model to calculate the likelihood values for each model and subsequently used AIC to compare the performance of different models. The C-index is another important metric used to evaluate the predictive ability of a survival model, measuring the consistency between the survival probabilities predicted by the model and the actual survival outcomes. The calculation of the C-index is based on all possible patient pairs, assessing agreement by comparing the predicted survival times with the actual survival times. Specifically, the C-index is calculated as the ratio of the number of consistent pairs to the number of useful pairs. In our analysis, we utilized the survival and survcomp packages in R to compute the C-index and evaluate the predictive ability of the model separately in the training set and the test set.
These metrics provided a comprehensive evaluation of each model’s efficacy in distinguishing between patients. Additionally, calibration curves were used to evaluate the calibration of each model, enabling us to pinpoint models with superior calibration performance. In summary, through comprehensive evaluation from both discrimination and calibration perspectives, we identified the optimal predictive model among the CT Radiomics Model, Clinical Model, and Combined Model for predicting postoperative survival in patients with MM.
Statistical analysis
To assess the normality of continuous features, we employed the Kolmogorov-Smirnov test. The T-test was used to compare variables with a normal distribution, which are represented as mean ± SD (standard deviation). For non-normally distributed data, the Mann-Whitney U test was used, and the data was represented using the median (inter-quartile range). Categorical variables were analyzed using either the chi-square test or Fisher’s exact test. The data was represented as counts (%). Survival analysis was conducted via Kaplan-Meier survival curves and validated using the log-rank test. A p-value lower than 0.05 was considered statistically significant. The R software package (version 4.0.3) was used to process the demographic data for evaluating significant differences in the variables between the training and the validation set. Python (version 3.6) was employed for programming model training, validating the prediction model, as well as conducting statistical analysis.
Results
Basic characteristics
This study included a total of 199 patients (110 males: with a median age of 61 years). Patients were continuously monitored until either the date of demise or August 1, 2022, with a median follow-up period of 35 months for the entire cohort. Among them, 64 patients survived. The treatment plan involved 160 patients within the training set and 39 patients within the testing set.
Assessment of radiomic features
A total of 2,264 radiomics features were initially extracted from CT images, with a specific emphasis on the largest lesions of MM. Subsequent refinement through consistency testing yielded 2,151 robust features. To select the most relevant features, we employed the LASSO algorithm in conjunction with five-fold cross-validation. Features that received three or more votes in a voting process were retained. Following this rigorous selection process, a subset of 11 optimal radiomic features was identified for implementation in machine learning models. This subset comprised three first-order features, and eight texture features (Figure 4). The coefficient of each selected feature is shown in Table 2.
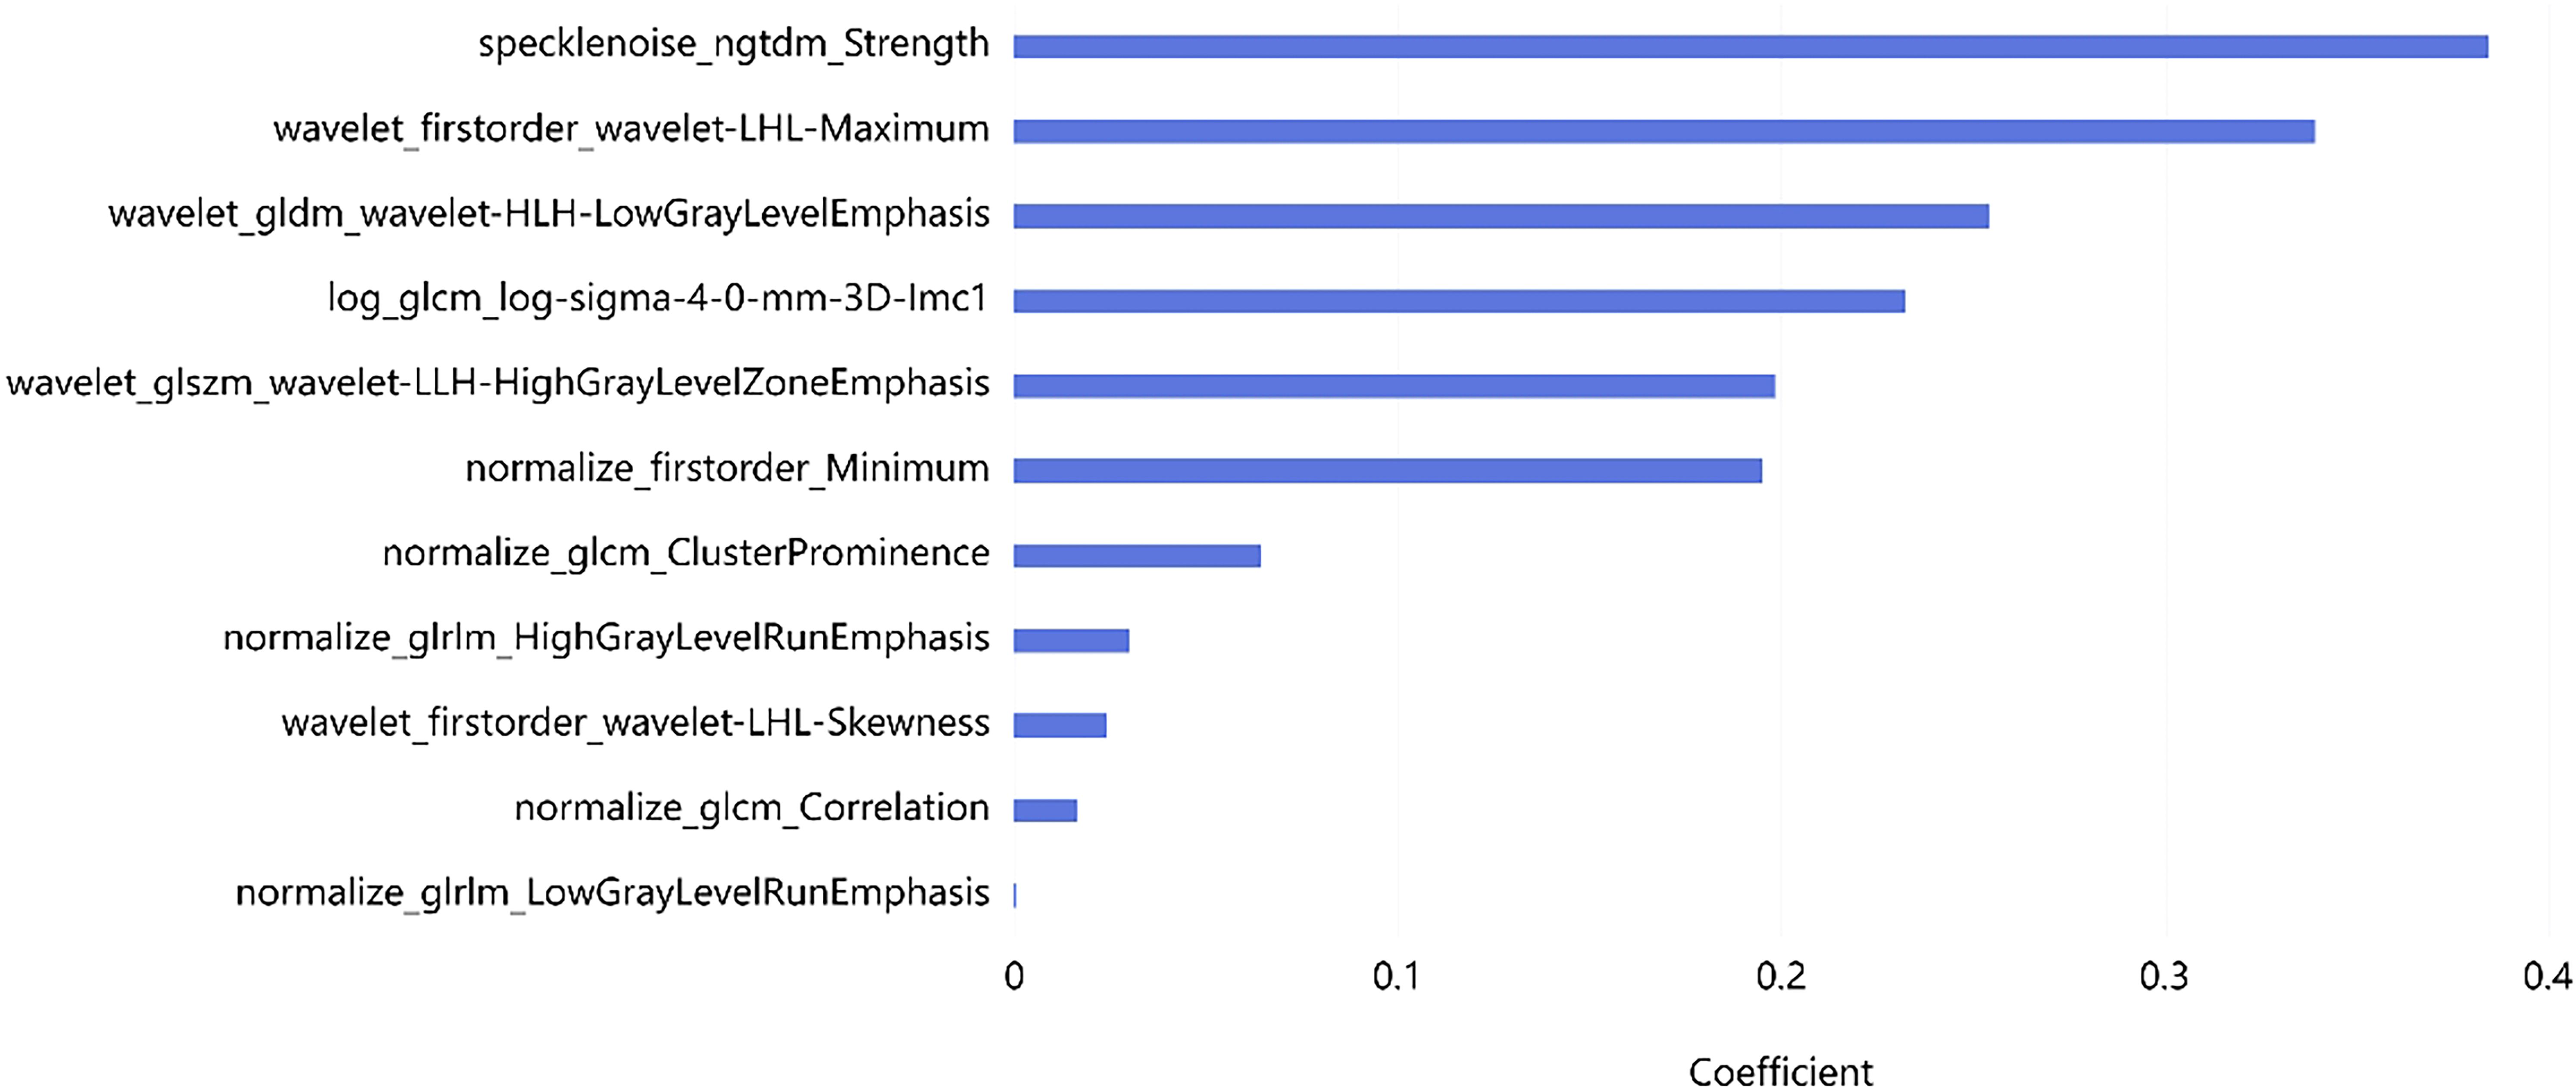
Figure 4. Radiomics feature selection. The 11 most significant feature subsets selected by LASSO.
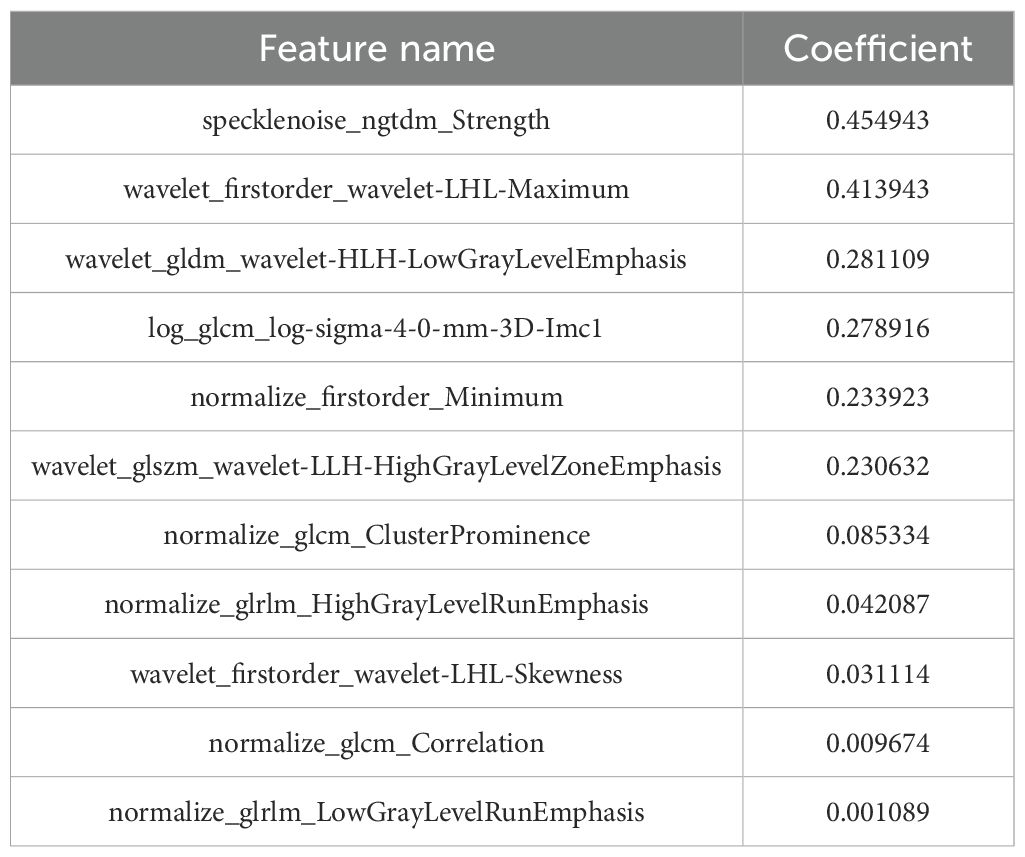
Table 2. Results of radiomic feature selection for OS.
Assessment of clinic features
Nine clinical features were extracted following univariate analysis, with significant correlations observed with OS for HCRP, SUVmax, ISS-staging, RISS-staging, PLT, Age, FL, Bone Marrow Plasma Cell, and Gender (p<0.10). Subsequent adjustment for relevant factors using the Cox multivariate model revealed that Age, SUVmax, FL, and Gender were identified da independent predictors of OS in the clinical setting (Table 3).
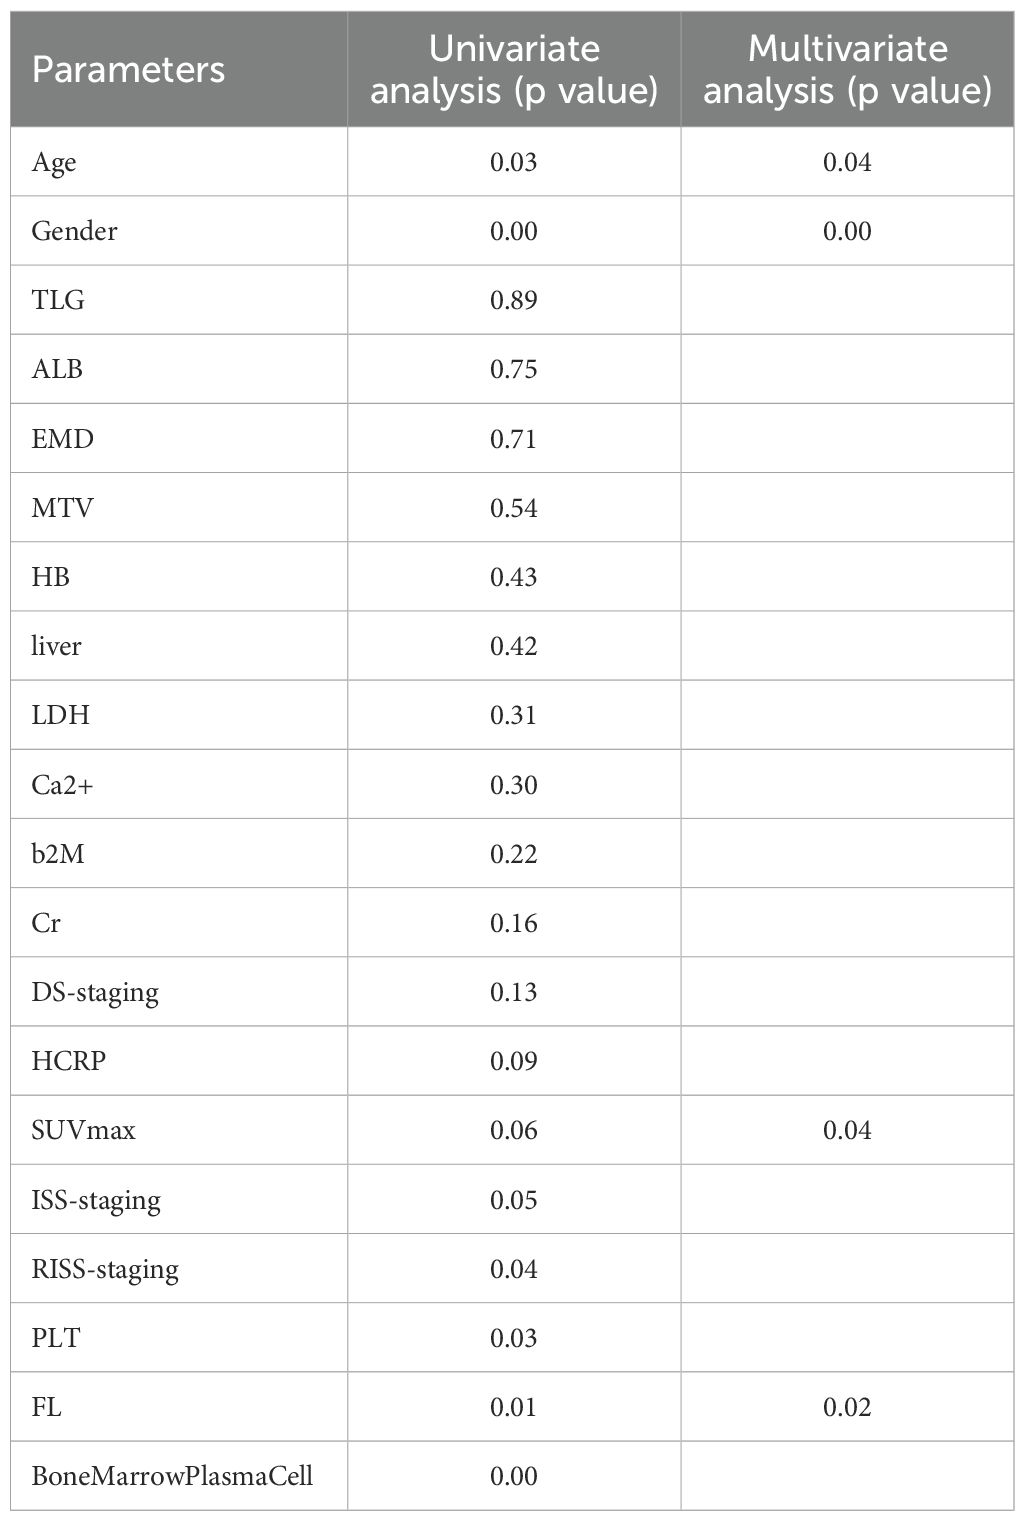
Table 3. Univariate and multivariate Cox regression analysis.
Comparison between different models
A radiomics model and a clinical model were constructed by utilizing radiomic features selected through LASSO screening and clinical features chosen through Cox multivariate analysis, respectively. Furthermore, the integration of variables from the clinical and radiomics models resulted in the establishment of a integrated model. The results of the radiomics model, clinical model, and combined model are presented in Table 4.
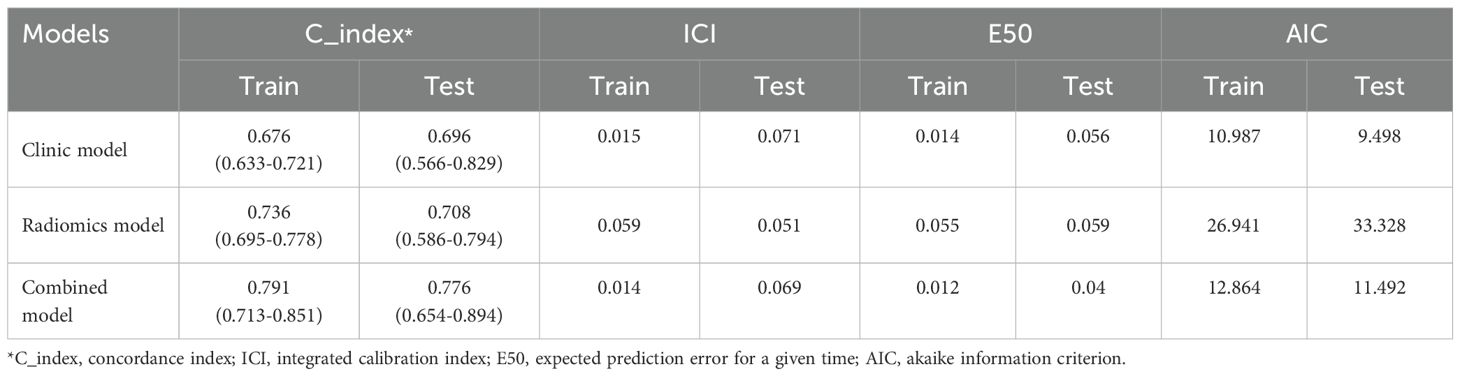
Table 4. The performance of the prediction models.
The results showed that the integrated model exhibited superior predictive capabilities in comparison to individual models. In the training set, the C-index was 0.791 [95% confidence interval (CI): 0.713-0.853], ICI was 0.015, E50 was 0.014, and AIC was 10.987. In the testing set, C-index was 0.776 (95% CI: 0.654–0.894), ICI was 0.069, E50 was 0.04, and AIC was 11.492 (Table 2).
Model interpretability
We generated a nomogram to predict the probability of long-term outcomes using the multi-clinical feature set (Figure 5). A total score was calculated by summing the scores of five factors: Age, SUVmax, FL, Gender, and CT radiomics score. The corresponding 1-year, 3-year, and 5-year survival rates were associated with the total score. Besides, calibration curves of the integrated model in both the training and validation set are illustrated in Figure 6. In this depiction, the diagonal line symbolized the predictive accuracy of an ‘ideal model’, whereas the curve represented the predictive performance of the integrated model. The proximity of the curve to the diagonal line in the graph suggests a higher level of calibration in the model. The findings presented in Figure 6 illustrate a strong alignment between predicted values and observed outcomes in both the training and validation datasets, thus confirming the model’s dependability and precision in forecasting long-term results.
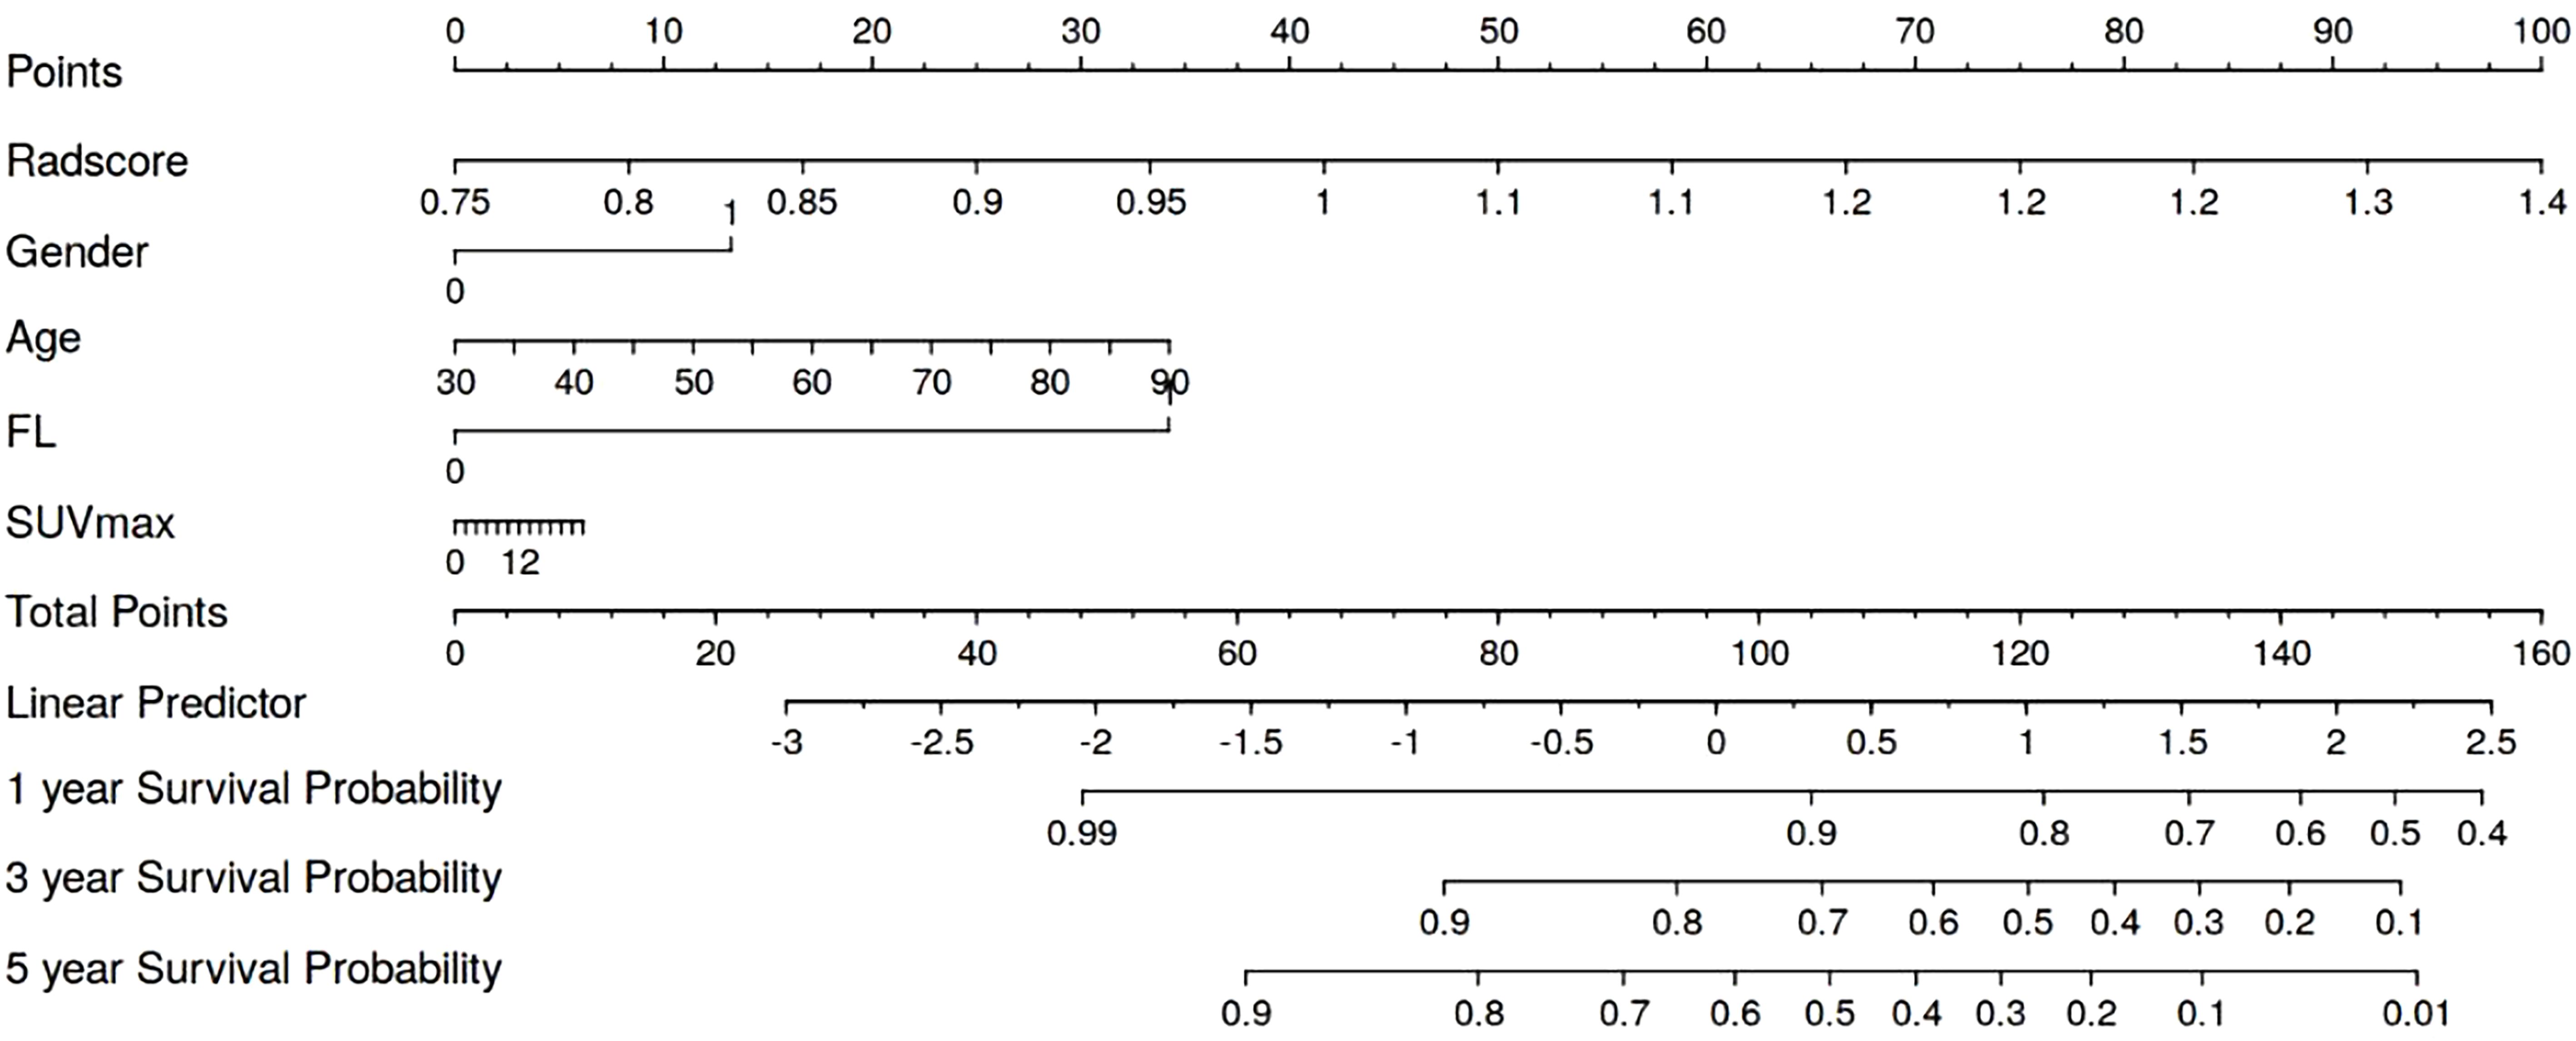
Figure 5. Combined model nomogram.
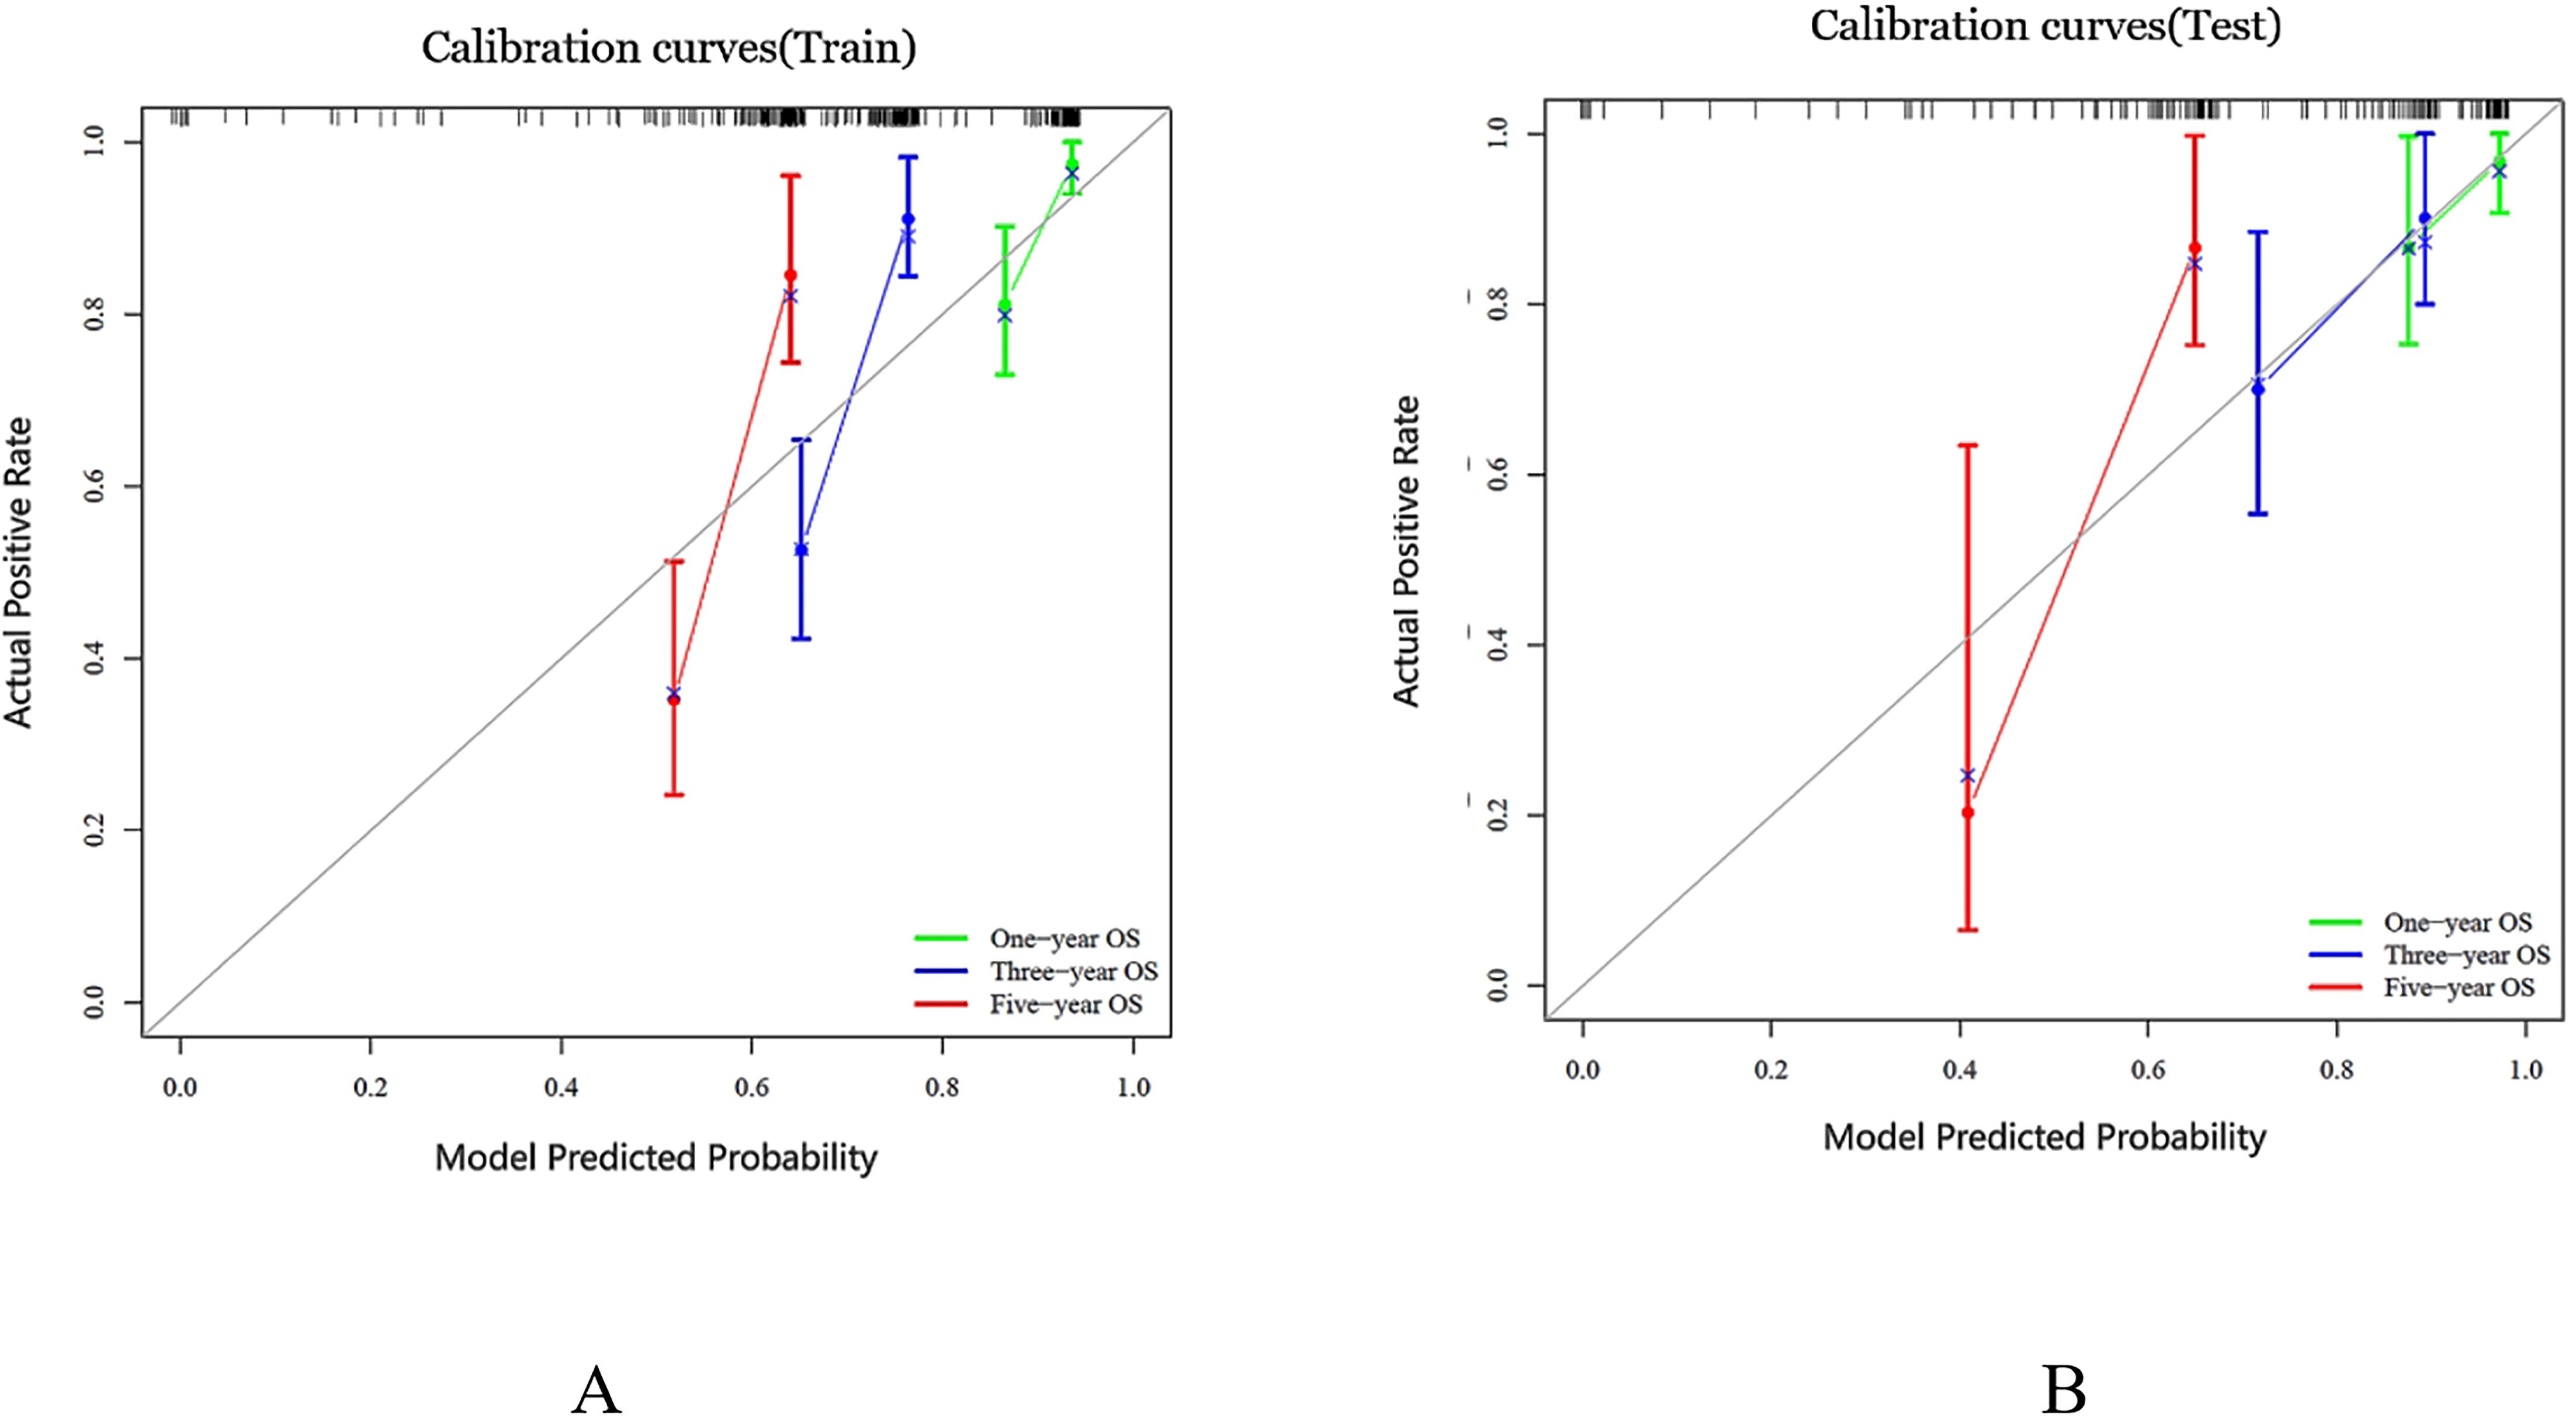
Figure 6. Calibration curves were generated for the prediction model in both the training and test cohorts, represented as (A, B) respectively. The ideal prediction is depicted by the black solid line, while the red, blue and green lines showcase the model’s predictive ability. The closer these lines fit to the dashed line, the higher the model’s accuracy in making predictions.
Survival analysis
At the end of follow-up, it was determined that out of 199 patients, 64 (32%) had died, while 135 (68%) had survived. The median survival duration was 35 months. The median value of risk prediction from the combined model served as a threshold to categorize patients into high-risk and low-risk groups. In the training set, the high-risk group had a median survival time of 29.0 months (95% CI: 28.5-29.5), whereas the low-risk group had a median survival time of 41.0 months (95% CI: 40.5-41.5).The survival outcomes of the low-risk group significantly exceeded those of the high-risk group (P < 0.001) (Figure 7A). In the testing set, the high-risk group showed a median survival time of 30.0 months (95% CI: 28.2-31.8), whereas the low-risk group exhibited a median survival time of 40.5 months (95% CI: 38.1-42.9). The survival outcomes in the low-risk group were significantly better than those in the high-risk group (P = 0.035). Kaplan-Meier (KM) curves for both high-risk and low-risk groups of patients are shown in Figure 7B. The ROC curves for survival prediction are shown in the Supplementary Figure S1.
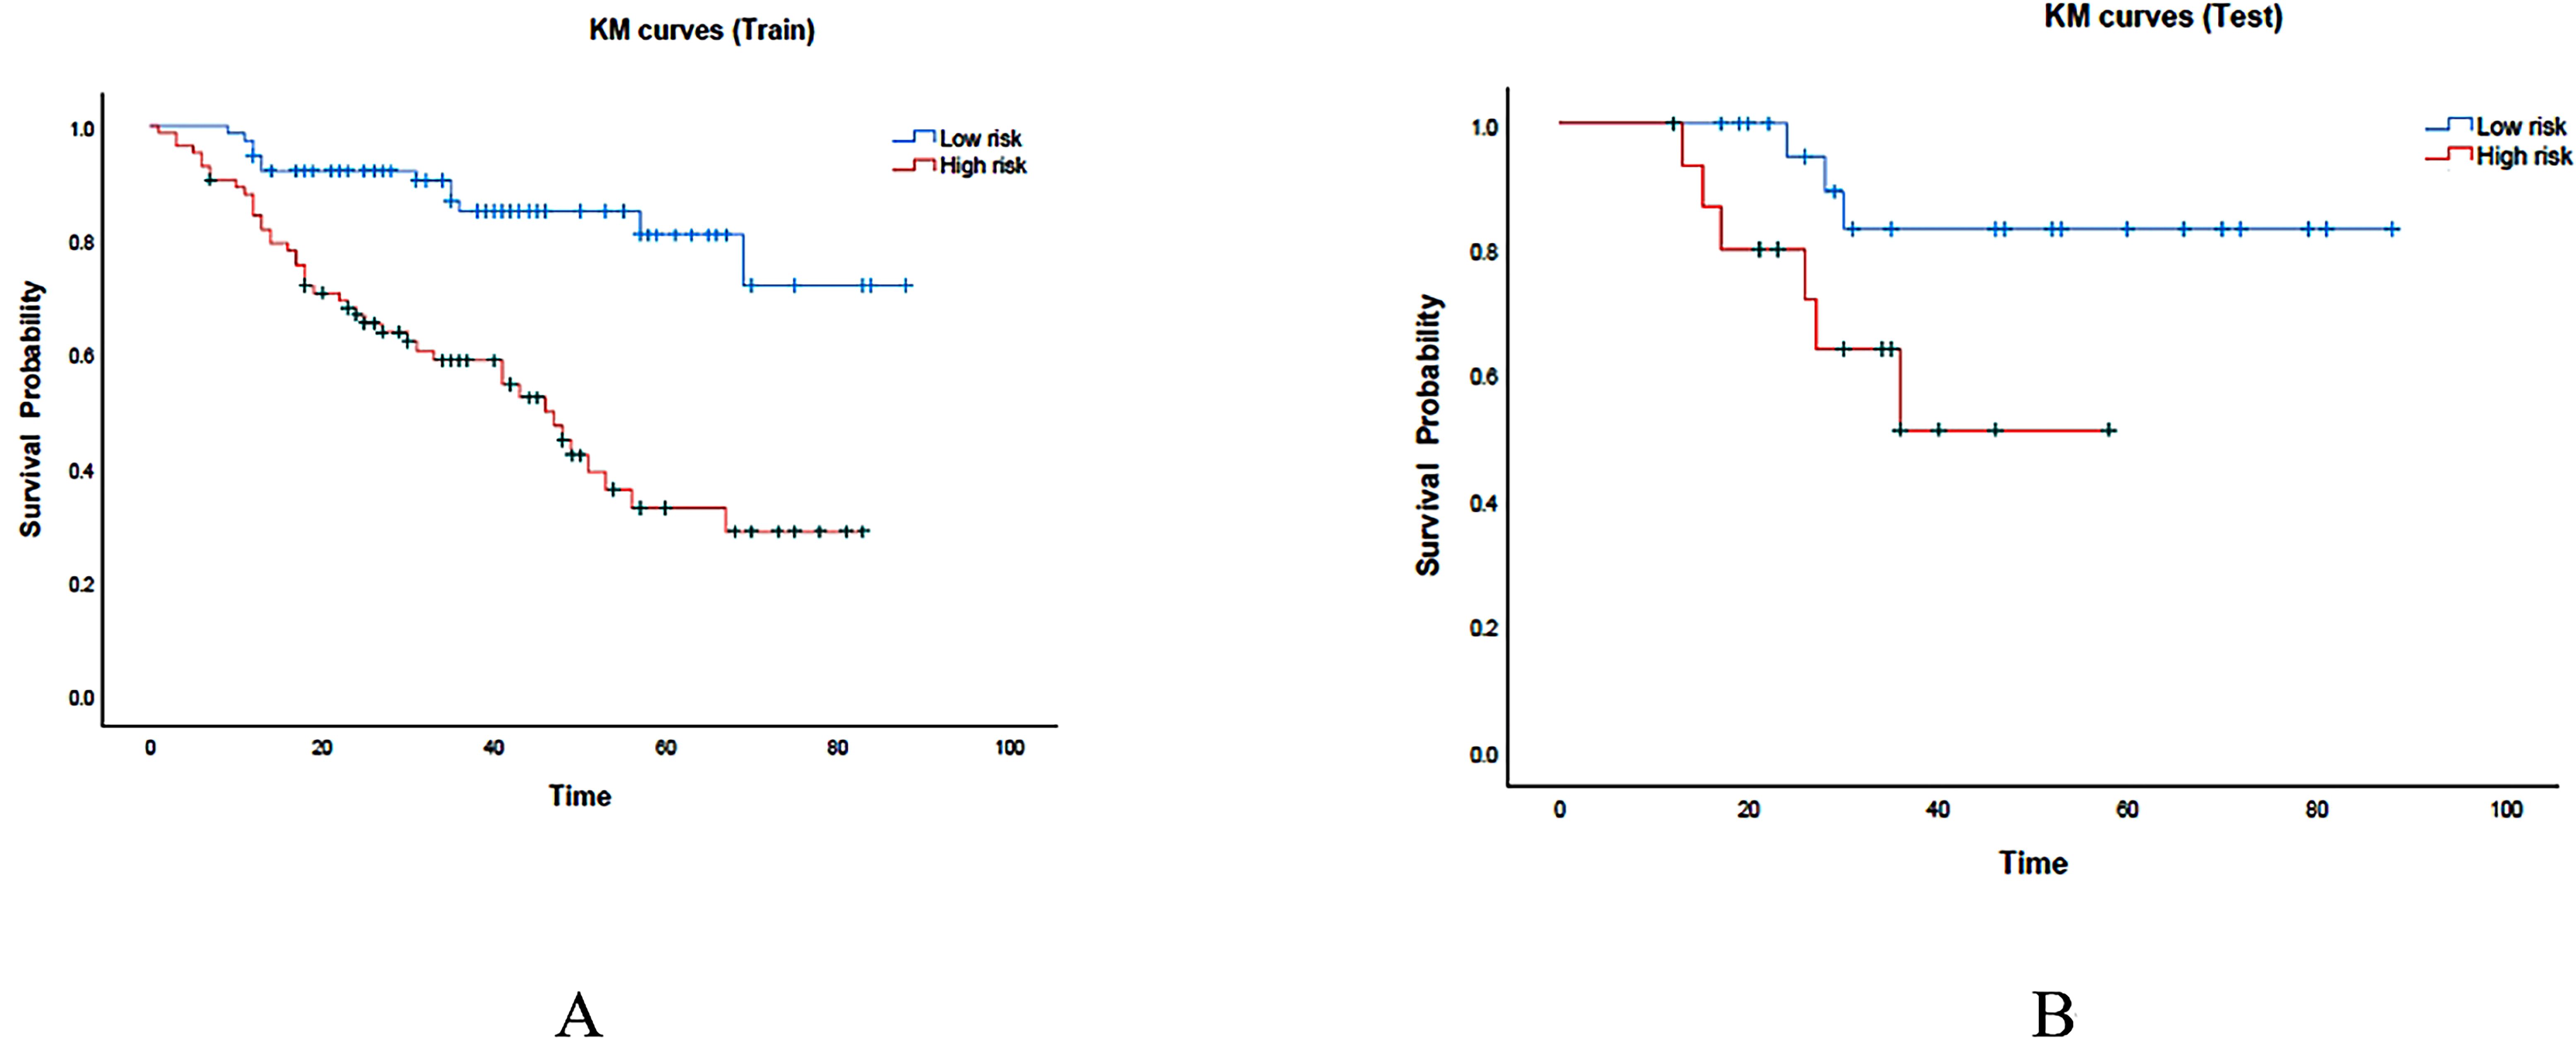
Figure 7. KM curves were generated for the prediction model in both the training and test cohorts, represented as (A, B) respectively. The red region represents the high-risk group, while the cyan region represents the low-risk group.
Discussion
In this retrospective multicenter study, we developed a Cox regression model based on CT radiomics features and multi-clinical factors to predict long-term prognosis in patients diagnosed with MM. Through the implementation of an independent data validation model, the integrated model exhibited notable discrimination and calibration capabilities. Subsequently, the model facilitated the stratification of MM patients into high-risk and low-risk subgroup, showcasing significant disparities in OS. Moreover, the integrated model nomogram was developed to offer clinicians with a more intuitive and concise prognostic tool for guiding personalized treatment strategies for patients with MM.
Currently, clinical evaluations predominantly utilize blood-based laboratory parameters to assess effectiveness and prognosis in patients. Nevertheless, this method is associated with limitations such as invasiveness and susceptibility to sampling errors due to the restricted sample size. Bone marrow punctures, a frequently employed technique, may fail to capture regions with the greatest disease burden, thereby restricting its capacity to comprehensively represent the diversity of MM (21). Prior studies have explored the correlation between imaging data and MM survival (22, 23). Relevant findings suggested that Apparent Diffusion Coefficient (ADC) could assess of tumor burden in patients. However, bone marrow ADC measurements are influenced by various factors including the bone marrow cell count, cell morphology, intracellular nuclear-cytoplasmic ratio, size of extracellular spaces, and cell membrane adhesion (24). PET/CT serves as an essential tool for MM assessment, demonstrating that factors such as the count of focal lesions, metabolic activity, volume of highly metabolic lesions, and extramedullary lesions significantly influenced survival. Our recent research suggested that radiomics models could be used to differentiate newly diagnosed myeloma lesions (25, 26). In this study, we developed an integrated model based on radiomics features derived from PET/CT and proceeded to evaluate the prognostic performance of this model.
The application of 18F-FDG PET/CT in the diagnostic and therapeutic evaluation protocols of MM has attained a high level of evidence, making it a valuable method for clinical decision-making, prognostic assessment, and treatment efficacy evaluation. However, only a few studies have determined the prognostic value of radiomic features in MM. Yang et al. confirmed a significant correlation between bone marrow MRI radiomic features and OS in MM patients using Cox regression models. Furthermore, the predictive performance of radiomic features based on radiomics is far superior to traditional clinical models (27). Currently, there is a limited number of studies that incorporate CT-based radiomic features, in conjunction with clinical parameters, to predict the five-year survival rate of patients with MM. This study has identified, for the first time, features extracted from PET/CT that have demonstrated utility in reflecting the biological behavior of MM. In this study, a total of 11 radiomics features extracted from CT scans were employed to construct both clinical and radiomics models, ultimately amalgamating into a combined model for predicting survival outcomes. Univariate and multivariate analyses revealed that SUVmax, Age, FL, and Gender were independent risk factors for predicting the survival of patients with MM. Our study found that the specklenoise_ngtdm_Strength feature has the highest weight ranking and is of significant importance for prognostic assessment. This feature is primarily used to quantify the difference between the voxel gray-level value and the average gray-level value of its neighborhood, reflecting the heterogeneity of the tumor image. A high value may indicate more texture changes, which are associated with higher malignancy or poor prognosis. Previous studies have also shown that in pancreatic ductal adenocarcinoma, high-T1WI_NGTDM_Strength is significantly correlated with poor prognosis (28). In addition, our research results indicate that wavelet-transform-based features demonstrate significant predictive value in the prognostic analysis of MM. This may be because wavelet features can capture the internal heterogeneity of tumors through multi-scale and multi-directional transformations of the images (29).
Our research findings indicate that both the SUVmax value and FL≧ 3 are independent adverse prognostic indicators for individuals with MM, which is consistent with previous research findings (30, 31). Furthermore, our investigation underscored age and gender as additional independent risk factors associated with an unfavorable prognosis in patients with MM. This observation could potentially be explained by a higher incidence of MM in men compared to women, suggesting gender-related disparities in disease susceptibility. Other factors known to affect MM prognosis include RISS, elevated LDH levels, hypercalcemia, renal insufficiency, and treatment group baseline TLG, and so on. However, in this study, due to limited data and selection bias, these factors may not have reached significance. Compared to other factors identified in this report, these factors may also have lesser prognostic significance.
Based on these clinical factors, a clinical model was constructed to predict efficacy. However, the clinical model only showed moderate predictive potential. Integrating clinical predictive factors with radiomics features, a clinical-radiomics combined model was constructed to exhibit a more robust model, outperforming both the individual clinical model and radiomics mode. This integrated model effectively categorized patients into high-risk and low-risk groups with significantly different OS. Radiomics features obtained from CT images of this study play an important role in improving model performance. After feature selection and dimensionality reduction, the retained features include first-order histogram features and texture features. The first-order histogram features include mean, median, minimum, maximum, and standard deviation. These parameters reflect the tumor density on plain scan. Texture features refer to the grayscale variations in images, including gray level co-occurrence matrix, autoregressive texture model, and wavelet transform, which can effectively reflect the heterogeneity of the internal structure of tumors. For high-risk group patients, the model guided clinicians in implementing appropriate treatments promptly. It is recommended to implement standardized treatment plans as early as possible within patient tolerance, and, if necessary, combine advanced therapy to improve prognosis. Moreover, to aid clinical-radiomics decision-making, we visualized this integrated model through a nomogram. This graphical representation streamlined the process for clinicians, swiftly providing predictive insights and enhancing the practical utility of the integrated model in real-time patient management.
There are certain limitations in this study. First, this retrospective study collected images from two centers resulting in a relatively small sample size and potential selection bias. In this study, PET/CT scans were sourced from two different centers, which may have introduced some variability. Although we normalized the images during the data pre-processing phase, including intensity normalization, this process may not have completely eliminated the differences between centers. To further mitigate this variability, we plan to introduce stricter image protocol standardization measures in future studies, such as employing techniques like ComBat tuning to reduce scanner-to-scanner variability. Additionally, this study relied solely on internal validation cohorts and lacked external independent validation cohorts. This limitation restricts the external validity of the model in different patient populations, clinical workflows, and imaging systems. Future studies should incorporate external validation cohorts to further assess the stability and applicability of the model. We plan to collaborate with more medical centers to obtain a broader dataset for comprehensive external validation. Secondly, variations in treatment plans, each with distinct working mechanisms, were administered to patients, potentially influencing therapeutic outcomes and prognosis. In this study, we primarily utilized LASSO regression for feature selection, which is highly effective for dimensionality reduction and feature selection. However, LASSO regression may not fully capture nonlinear relationships between features. To more comprehensively assess feature importance in future studies, we may consider alternative methods such as recursive feature elimination (RFE) or random forest-based approaches. These methods are better suited to capturing complex, especially nonlinear, relationships between features. Additionally, we plan to explore ensemble learning techniques, such as XGBoost or LightGBM, which not only handle nonlinear relationships effectively but also offer enhanced feature selection capabilities. Nevertheless, LASSO regression remains a reasonable choice in this study due to its interpretability, computational efficiency, and robustness in high-dimensional data.
Despite the use of LASSO regression for feature selection, the risk of overfitting persisted due to the relatively small sample size (n = 199) and the large number of radiomics features extracted (over 2000). In particular, the model’s generalization ability may be compromised when the number of features approaches or exceeds the number of events (in this study, the number of deaths was 64). To enhance model robustness and reduce the risk of overfitting, future studies may employ Bootstrap resampling or more stringent cross-validation strategies, such as repeated randomization cross-validation. Additionally, exploring other regularization methods, such as Elastic Net, may help better balance feature selection and model complexity. Another limitation was the analysis solely focused on the lesion with the highest uptake, neglecting other potentially relevant lesions. The radiomics analysis in this study was based solely on a single maximal lesion per patient, which may overlook the multifocal heterogeneity characteristic of multiple myeloma (MM). This approach may limit the model’s ability to capture the full extent of disease burden. Given that heterogeneity is a key feature of MM, multifocal analysis could provide a more comprehensive understanding of the disease. Therefore, future studies should consider developing segmentation algorithms capable of analyzing all lesions throughout the body, rather than focusing exclusively on the largest single lesion. By examining the radiomic characteristics of multiple lesions, the heterogeneity of the disease can be more fully reflected, potentially enhancing the model’s capacity to capture the overall disease burden. Additionally, the manual delineation of ROI was labor-intensive and time-consuming. In terms of lesion segmentation, although we assessed the consistency of segmentation results between two radiologists in this study and retained only features with good reproducibility (ICC > 0.70), the inherent subjectivity of manual segmentation remains a potential limitation. Variability in manual segmentation can influence the stability and reproducibility of radiomics signatures, which in turn may impact model performance. To address this issue, future research could consider incorporating automated or semi-automated segmentation algorithms to minimize the subjectivity associated with manual segmentation. Additionally, the development of detailed segmentation protocols and operational guidelines would be beneficial in standardizing the segmentation process. Conducting multi-reader studies to evaluate the consistency and reliability of segmentation results is also an important direction for future research. These approaches could collectively enhance the robustness and reproducibility of radiomics analyses. To address these limitations in future research, advancements in artificial intelligence technology are anticipated to facilitate automatic ROI segmentation, streamlining the process. This development would enable comprehensive fusion analysis encompassing all lesions, enhancing the thoroughness and accuracy of subsequent evaluations. Cytogenetic information holds significant prognostic value for multiple myeloma. This is a limitation we intend to address in future research, as high-risk cytogenetic features are crucial for improving prognostic accuracy.
Conclusions
Our study illustrated the potential of an integrated model that combined laboratory examination indicators with PET/CT radiomics features in predicting OS for patients with MM. This integrated model exhibited superior predictive capability compared to individual clinical and radiomics models, showcasing its effectiveness in both training and testing groups. The implementation of this integrated model could help tailor individualized treatment strategies and accurately predict prognosis for patients diagnosed with MM.
Data availability statement
The raw data supporting the conclusions of this article will be made available by the authors, without undue reservation.
Ethics statement
The studies involving humans were approved by the ethics committee of Changzheng Hospital-the Second Affiliated Hospital of Naval Medical University. The studies were conducted in accordance with the local legislation and institutional requirements. Written informed consent for participation was not required from the participants or the participants’ legal guardians/next of kin in accordance with the national legislation and institutional requirements.
Author contributions
FL: Data curation, Software, Writing – original draft. BJ: Data curation, Investigation, Writing – original draft. YF: Data curation, Formal analysis, Writing – original draft. QY: Data curation, Investigation, Writing – review & editing. GD: Formal analysis, Investigation, Resources, Writing – review & editing. JY: Data curation, Funding acquisition, Investigation, Software, Writing – review & editing. QJ: Data curation, Investigation, Writing – review & editing. HS: Data curation, Writing – review & editing. YX: Supervision, Writing – review & editing. QC: Data curation, Writing – review & editing. SX: Resources, Supervision, Writing – review & editing. XW: Conceptualization, Writing – original draft, Writing – review & editing. SL: Conceptualization, Project administration, Resources, Supervision, Validation, Writing – review & editing.
Funding
The author(s) declare financial support was received for the research and/or publication of this article. This work was supported by the Medical New Technology Cultivation Project (XJS2024C12), the Special Project for Promoting High-Quality Development of Industries in Shanghai, 2022-2023 (Artificial Intelligence Topic,Grant No. 2023-GZL-RGZN-01014). The key project of the National Natural Science Foundation of China (grant number 81930049 and 82441012); Shanghai Science and Technology Commission (grant number 19411951300).
Conflict of interest
Author FL was employed by Shanghai United Imaging Intelligence Co., Ltd.
The authors declare that the research was conducted in the absence of any commercial or financial relationships that could be construed as a potential conflict of interest.
Publisher’s note
All claims expressed in this article are solely those of the authors and do not necessarily represent those of their affiliated organizations, or those of the publisher, the editors and the reviewers. Any product that may be evaluated in this article, or claim that may be made by its manufacturer, is not guaranteed or endorsed by the publisher.
Supplementary material
The Supplementary Material for this article can be found online at: https://www.frontiersin.org/articles/10.3389/fonc.2025.1486495/full#supplementary-material
Supplementary Figure 1 | ROC curves for survival prediction.
References
1. Rajkumar SV. Updated diagnostic criteria and staging system for multiple myeloma. Am Soc Clin Oncol Educ Book. (2016) 36:e418–23. doi: 10.1200/EDBK_159009
2. Bray F, Ferlay J, Soerjomataram I, and Siegel R. Global cancer statistics 2018: GLOBOCAN estimates of incidence and mortality worldwide for 36 cancers in 185 countries. CA Cancer J Clin. (2018) 68(6):394–424. doi: 10.3322/caac.21492
3. Wang C, Soekojo CY, Mel S, Ooi M, Chen Y, Goh AZK, et al. Natural history and prognostic factors at first relapse in multiple myeloma. Cancers (Basel). (2020) 12(7). doi: 10.3390/cancers12071759
4. Zachary SB, Bridget K E, and Noopur RJC. Bone disease in multiple myeloma: biologic and clinical implications. Cells. (2022) 11(15):2308. doi: 10.3390/cells11152308
5. Terpos E, Zamagni E, Lentsch S, Drake MT, García-Sanz R, Abildgaard N, et al. Treatment of multiple myeloma-related bone disease: recommendations from the Bone Working Group of the International Myeloma Working Group. Lancet Oncol. (2021) 22(3):e119–e130. doi: 10.1016/S1470-2045(20)30559-3
6. Leng H, Zhang H, Li L, Zhang S, Wang Y, Chavda SJ, et al. Modulating glycosphingolipid metabolism and autophagy improves outcomes in pre-clinical models of myeloma bone disease. Nat Commun. (2022) 13(1):7868. doi: 10.1038/s41467-022-35358-3
7. Pianko MJ, Terpos E, Roodman GD, Divgi CR, Zweegman S, Hillengass J, et al. Whole-body low-dose computed tomography and advanced imaging techniques for multiple myeloma bone disease. Clin Cancer Res. (2014) 20:5888–97. doi: 10.1158/1078-0432.CCR-14-1692
8. Sebastian Z, Denise B, Marcel O, Johannes H, Michael F, Nika G, et al. Radiation exposure and establishment of diagnostic reference levels of whole-body low-dose CT for the assessment of multiple myeloma with second- and third-generation dual-source CT. (2021) 63. doi: 10.1177/02841851211003287
9. Son AY and Chung HW. Imaging for Multiple Myeloma according to the Recent International Myeloma Working Group Guidelines: Analysis of Image Acquisition Techniques and Response Evaluation in Whole-Body MRI according to MY-RADS. (2023) 84. doi: 10.3348/jksr.2021.0179
10. Shah LM and Hanrahan CJ. MRI of spinal bone marrow: part I, techniques and normal age-related appearances. AJR Am J Roentgenol. (2011) 197:1298–308. doi: 10.2214/AJR.11.7005
11. Bezzi D, Ambrosini V, and Nanni C. Clinical value of FDG-PET/CT in multiple myeloma: an update. Semin Nucl Med. (2023) 53:352–70. doi: 10.1053/j.semnuclmed.2022.10.008
12. Li J, Zhang X, Qin C, Sun X, Xu X, Cao G, et al. A prognostication system based on clinical parameters and [F]-FDG PET/CT in patients with newly diagnosed multiple myeloma. Eur J Nucl Med Mol Imaging. (2023) 50:1665–70. doi: 10.1007/s00259-022-06088-x
13. Xiaoqing D, Ruoyi W, Xiuhua Y, Jiaxuan X, Jie Y, Peipei X, et al. Construction and validation of an (18)F-FDG-PET/CT-based prognostic model to predict progression-free survival in newly diagnosed multiple myeloma patients. Hematology. (2024) 29(1):2329029. doi: 10.1080/16078454.2024.2329029
14. Bartel TB, Haessler J, Brown TL, Shaughnessy JD Jr., van Rhee F, Anaissie E, et al. F18-fluorodeoxyglucose positron emission tomography in the context of other imaging techniques and prognostic factors in multiple myeloma. Blood. (2009) 114:2068–76. doi: 10.1182/blood-2009-03-213280
15. Manco L, Albano D, Urso L, Arnaboldi M, Castellani M, Florimonte L, et al. Positron emission tomography-derived radiomics and artificial intelligence in multiple myeloma: state-of-the-art. J Clin Med. (2023) 12(24). doi: 10.3390/jcm12247669
16. Klontzas M, Triantafyllou M, Leventis D, Koltsakis E, Kalarakis G, Tzortzakakis A, et al. Radiomics analysis for multiple myeloma: A systematic review with radiomics quality scoring. Diagnostics (Basel). (2023) 13(12):2021. doi: 10.3390/diagnostics13122021
17. Tagliafico A, Dominietto A, Belgioia L, Campi C, Schenone D, and Piana M. Quantitative imaging and radiomics in multiple myeloma: A potential opportunity? Medicina (Kaunas). (2021) 57(2):94. doi: 10.3390/medicina57020094
18. Rajkumar SV, Dimopoulos MA, Palumbo A, Blade J, Merlini G, Mateos MV, et al. International Myeloma Working Group updated criteria for the diagnosis of multiple myeloma. Lancet Oncol. (2014) 15:e538–548. doi: 10.1016/S1470-2045(14)70442-5
19. Saad ZU, Alan M, Sarah W, John C, Antje H, Nathan P, et al. Prognostic implications of serial 18-fluoro-deoxyglucose emission tomography in multiple myeloma treated with total therapy. Blood. (2013) 3:121. doi: 10.1182/blood-2012-08-451690
20. Cavo M, Terpos E, Nanni C, Moreau P, Lentzsch S, Zweegman S, et al. Role of (18)F-FDG PET/CT in the diagnosis and management of multiple myeloma and other plasma cell disorders: a consensus statement by the International Myeloma Working Group. Lancet Oncol. (2017) 18:e206–17. doi: 10.1016/S1470-2045(17)30189-4
21. Rasche L, Chavan S, Stephens O, Patel P, Tytarenko R, Ashby C, et al. Spatial genomic heterogeneity in multiple myeloma revealed by multi-region sequencing. Nat Commun. (2017) 8:268. doi: 10.1038/s41467-017-00296-y
22. Christos S, Olof E, Johannes U, Annette K-S, Leyun P, Elias KM, et al. Artificial intelligence-based, volumetric assessment of the bone marrow metabolic activity in [(18)F]FDG PET/CT predicts survival in multiple myeloma. Eur J Nucl Med Mol Imaging. (2024) 51(8):2293–2307. doi: 10.1007/s00259-024-06668-z
23. Kento M, Shigehiro K, Toshiki T, Kotaro Y, Takeshi Y, Takeshi Y, et al. 3D CNN-based deep learning model-based explanatory prognostication in patients with multiple myeloma using whole-body MRI. J Med Syst. (2024) 48(1):30. doi: 10.1007/s10916-024-02040-8
24. Latifoltojar A, Hall-Craggs M, Rabin N, Popat R, Bainbridge A, Dikaios N, et al. Whole body magnetic resonance imaging in newly diagnosed multiple myeloma: early changes in lesional signal fat fraction predict disease response. Br J Haematol. (2017) 176:222–33. doi: 10.1111/bjh.14401
25. Kaili C, Jiashi C, Xin Z, Xiang W, Xiangyu Z, Qingchu L, et al. Differentiation between spinal multiple myeloma and metastases originated from lung using multi-view attention-guided network. Front Oncol. (2022) 12:981769. doi: 10.3389/fonc.2022.981769
26. Jiashi C, Qiong L, Huili Z, Yanyan W, Xiang W, Saisai D, et al. Radiomics model based on MRI to differentiate spinal multiple myeloma from metastases: A two-center study. J Bone Oncol. (2024) 45:100599. doi: 10.1016/j.jbo.2024.100599
27. Yang L, Yang L, Ping Y, Chuanxi H, Chao S, Lei C, et al. MRI-based bone marrow radiomics nomogram for prediction of overall survival in patients with multiple myeloma. Front Oncol. (2021) 11:709813. doi: 10.3389/fonc.2021.709813
28. Liang L, Ding Y, Yu Y, Liu K, Rao S, Ge Y, et al. Whole-tumour evaluation with MRI and radiomics features to predict the efficacy of S-1 for adjuvant chemotherapy in postoperative pancreatic cancer patients: a pilot study. BMC Med Imaging. (2021) 21:75. doi: 10.1186/s12880-021-00605-4
29. Granata V, Fusco R, De Muzio F, Brunese MC, Setola SV, Ottaiano A, et al. Radiomics and machine learning analysis by computed tomography and magnetic resonance imaging in colorectal liver metastases prognostic assessment. Radiol Med. (2023) 128:1310–32. doi: 10.1007/s11547-023-01710-w
30. Dimopoulos M, Terpos E, Comenzo RL, Tosi P, Beksac M, Sezer O, et al. International myeloma working group consensus statement and guidelines regarding the current role of imaging techniques in the diagnosis and monitoring of multiple Myeloma. Leukemia. (2009) 23:1545–56. doi: 10.1038/leu.2009.89
Keywords: multiple myeloma, radiomics, 18-FDG PET/CT, computer-aided diagnosis, prognostic value
Citation: Li F, Jiang B, Fu Y, Yu Q, Duan G, Yan J, Jiang Q, Sun H, Xiao Y, Chen Q, Xu S, Wang X and Liu S (2025) Prognostic significance of FDG-PET/CT based radiomics analysis in newly-diagnosed multiple myeloma: a comparative study with clinical assessment. Front. Oncol. 15:1486495. doi: 10.3389/fonc.2025.1486495
Received: 29 August 2024; Accepted: 29 July 2025;
Published: 03 September 2025.
Edited by:
Sharon R. Pine, University of Colorado Anschutz Medical Campus, United StatesReviewed by:
Antonio Giovanni Solimando, University of Bari Aldo Moro, ItalyTaku Kikuchi, Japanese Red Cross Medical Center, Japan
Copyright © 2025 Li, Jiang, Fu, Yu, Duan, Yan, Jiang, Sun, Xiao, Chen, Xu, Wang and Liu. This is an open-access article distributed under the terms of the Creative Commons Attribution License (CC BY). The use, distribution or reproduction in other forums is permitted, provided the original author(s) and the copyright owner(s) are credited and that the original publication in this journal is cited, in accordance with accepted academic practice. No use, distribution or reproduction is permitted which does not comply with these terms.
*Correspondence: Shaochun Xu, eHVzYzMzMDZAMTYzLmNvbQ==; Xiang Wang, cmFkaW9sb2d5d2FuZ3hAMTYzLmNvbQ==; Shiyuan Liu, cmFkaW9sb2d5X2N6QDE2My5jb20=
†These authors have contributed equally to this work and share first authorship