 You Pu1†‡
 Jin Yang
 Qianlong Tang
 Xianqin Zhang
- 1Department of Oncology, Sichuan Mianyang 404 Hospital, Mianyang, Sichuan, China
- 2Department of Cardiology, Sichuan Mianyang 404 Hospital, Mianyang, Sichuan, China
- 3School of Basic Medical Sciences, Chengdu Medical College, Chengdu, Sichuan, China
Background: Predictive models can identify patients at risk and thus enable personalized interventions. Despite the increasing number of prediction models used to predict the risk of dysphagia after radiotherapy in patients with head and neck cancer (HNC), there is still uncertainty about the effectiveness of these models in clinical practice and about the quality and applicability of future studies. The aim of this study was to systematically evaluate and analyze all predictive models used to predict dysphagia in patients with HNC after radiotherapy.
Methods: PubMed, Cochrane Library, EMbase and Web of Science databases were searched from database establishment to August 31, 2024. Data from selected studies were extracted using predefined tables and the quality of the predictive modelling studies was assessed using the PROBAST tool. Meta-analysis of the predictive performance of the model was performed using the “metafor” package in R software.
Results: Twenty-five models predicting the risk of dysphagia after radiotherapy in patients with HNC were included, covering a total of 8,024 patients. Common predictors include mean dose to pharyngeal constrictor muscles, treatment setting, and tumor site. Of these models, most were constructed based on logistic regression, while only two studies used machine learning methods. The area under the receiver operating characteristic curve (AUC) reported values for these models ranged from 0.57 to 0.909, with 13 studies having a combined AUC value of 0.78 (95% CI: 0.74-0.81). All studies showed a high risk of bias as assessed by the PROBAST tool.
Conclusion: Most of the published prediction models in this study have good discrimination. However, all studies were considered to have a high risk of bias based on PROBAST assessments. Future studies should focus on large sample size and rigorously designed multicenter external validation to improve the reliability and clinical applicability of prediction models for dysphagia after radiotherapy for HNC.
Systematic review registration: https://www.crd.york.ac.uk/prospero, identifier CRD42024587252.
1 Introduction
Head and neck cancer (HNC) is the sixth most common malignancy worldwide, accounting for 4% of cancer incidence (1). Among them, more than 90% of cases are squamous cell carcinoma originating from the upper respiratory and digestive tract, mainly distributed in the oral cavity, larynx and pharynx (2). HNC leads to more than 60,000 deaths per year, with an overall 5-year survival rate of approximately 60% (1). Squamous cell carcinoma is highly sensitive to radiotherapy, so radiotherapy has become the mainstay of treatment for HNC, either alone or in combination with surgery and/or chemotherapy (3). Despite significant advances in radiotherapy techniques, radiotherapy-related toxicity remains an important issue affecting patients’ quality of life and disease prognosis (4).
Dysphagia is one of the common serious complications in HNC patients after radiotherapy, and its incidence is estimated to be about 40% to 50% (5, 6). This symptom not only affects the patient’s eating habits, but may also lead to malnutrition, feeding tube dependence, inhalation airway infections, and emotional problems (4, 7–9). Almost all HNC patients may suffer from varying degrees of dysphagia during radiotherapy as well as in the early and late post-treatment periods, and approximately 50% of patients continue to be affected by this symptom even 6 months after the end of treatment (10). In addition, dysphagia significantly increases the consumption of healthcare resources, and hospitalization costs may increase by up to 40% as a result (11). For young HNC patients, dysphagia after radiotherapy not only poses a challenge to their quality of life, but may also severely affect their ability to return to work and social activities (12).
Therefore, it is essential to identify the high-risk factors for dysphagia after radiotherapy and to develop personalized preventive strategies accordingly. The development of dysphagia is a complex multifactorial interactive process involving multiple predictors such as patient characteristics, treatment modality, tumor stage and radiation dose to the organ at risk (13–16). In recent years, predictive models based on clinical and dosimetric characteristics have shown significant potential in assessing the risk of dysphagia after radiotherapy in patients with HNC (17–19). By analyzing patient information in electronic medical records and incorporating the anatomical distribution of tumors, such models identify groups of patients with similar characteristics, providing strong support for assessing the risk of dysphagia after radiotherapy and making personalized treatment decisions (20, 21).
However, as the number of predictive models increases, these models show significant heterogeneity in terms of methodology, analysis of outcome and applicability. Therefore, it becomes particularly critical to systematically assess the quality and application value of these models. The aim of this study was to provide a reference basis for clinical practice and future research by systematically reviewing and meta-analyzing all published prediction models of post-radiation dysphagia in patients with HNC.
2 Methods
The study protocol has been registered in the International Register of Prospective Systematic Reviews (PROSPERO) (registration number: CRD42024587252).
2.1 Search strategy
As of August 31, 2024, we searched four databases, PubMed, Cochrane Library, EMbase, and Web of Science, for the following keywords: “Head and Neck Neoplasm”, “Head and Neck Cancer”, “Radiotherapy”, “Radiochemotherapy”, “Pharmacotherapy”, “Targeted Radiotherapy”, “Toxicity”, “Side effect”, “Dysphagia”, “Deglutition disorders”, “Swallowing disorders”, “Tube feed”, “Tube feeding dependency”, “Predictor”, “Model”, “Risk factors”, “Risk score”, “Risk prediction model”. Using PubMed as an example, the detailed search strategy is described in Supplementary Appendix S1. In addition, we manually searched the references of studies and reviews to trace other relevant studies. All original predictive modelling studies in English that met the predefined inclusion criteria (PICOTS) were included:
P (population): Patients diagnosed with HNC.
I (index prediction model): All available prognostic models predicting the risk of dysphagia after radiotherapy.
C (comparative model): Not applicable.
O (outcomes to be predicated): Supervisor or objectively diagnosed dysphagia.
T (timing): Outcome measures without any specific limitations within the predictive range.
S (setting): Not limited to any specific clinical setting.
2.2 Outcome measures
Results covered dysphagia grades 2 to 4. Evaluation criteria were performed according to “Common toxicity criteria: version 2.0” (22).
Grade 0: none;
Grade 1: mild dysphagia, but can eat regular diet;
Grade 2: dysphagia, requiring predominantly pureed, soft, or liquid diet;
Grade 3: dysphagia, requiring feeding tube, IV hydration or hyperalimentation;
Grade 4: complete obstruction (cannot swallow saliva); ulceration with bleeding not induced by minor trauma or abrasion or perforation.
2.3 Inclusion and exclusion criteria
Two searchers independently screened the literature based on the following criteria. Inclusion criteria: a) patients with HNC aged ≥18 years who received radiotherapy; b) construction and/or validation of a predictive model for dysphagia after radiotherapy; c) for repeated studies with the same content, preference was given to studies published more recently or with more comprehensive content. Exclusion criteria: a) case reports, unpublished papers, conference abstracts, or review articles; b) studies for which the full text was not available or the data were incomplete. Two investigators independently screened the literature. Dissenting articles were arbitrated by a third investigator. Basic information and extracted data were collected and cross-checked by the two investigators mentioned above.
2.4 Study selection and data extraction
According to the admission criteria, the two investigators first screened the title and abstract of the literature, and then carefully read the full text to confirm whether the criteria were met. According to the checklist for critical appraisal and data extraction for systematic reviews of prediction modelling studies (CHARMS) proposed by Moons et al. (23), a data extraction table was developed. Two investigators independently extracted data including author(s)/year, country, study design, participants, follow-up time, main outcome, incidence of outcomes (%), missing data handling, variable selection, model development method, final predictors, model performance, validation method, model presentation. Any disagreements between authors were resolved by discussion or adjudicated by a third author.
For studies that reported multiple models and clearly indicated the best model, we considered them as reporting a single model and represented the best model. For studies that reported multiple models but did not specify a preferred model, we selected the model with the lowest C-statistic as the most conservative basis for initial assessment. Therefore, each study was treated as reporting only one model.
2.5 Quality assessment
In this study, we used prediction model risk of bias assessment tool (PROBAST) (24) to comprehensively assess the risk of bias and applicability of the included prediction models. PROBAST, as a tool specifically designed to assess the risk of bias in predictive model studies, performs a meticulous assessment from four key dimensions: participants, predictors, outcome, analysis, each containing a series of questions to determine the possible risk of bias in studies. In addition, the assessment of applicability is based on the three dimensions of participants, predictors and outcome. The evaluation results are classified according to three levels: “low risk”, “high risk” and “unclear”. In this way, we were able to make a comprehensive judgement on the risk of bias and applicability of each model, and select the best prediction model accordingly. During the evaluation process, two researchers independently evaluated the quality to ensure the objectivity and accuracy of the evaluation. Any disagreements that arose during the evaluation process were resolved through discussion, and a third party was brought in to adjudicate if necessary to reach a consensus.
2.6 Statistical analysis
In this study, the area under the receiver operating characteristic curve (AUC) was chosen as an indicator of discrimination ability. AUC was pooled by a random-effects model to assess overall discrimination across all prediction models and across clinical settings. A combined AUC of 0.5 indicates no predictive ability, > 0.5 to ≤ 0.7 indicates weak predictive ability, > 0.7 to ≤ 0.9 indicates excellent predictive ability, and an AUC of 1 is considered a perfect predictive criterion (25). Meta-analysis of the AUC of the model was performed using the “metafor” package in the R software, and inter-study heterogeneity was assessed by the I² statistic, where 25%, 50%, and 75% indicated low, medium, and high heterogeneity, respectively (26). In addition, publication bias was assessed using the Egger’s test, with p > 0.05 indicating a low likelihood of publication bias (27).
3 Results
3.1 Study selection
In total 1,715 articles were retrieved through electronic databases and 23 potentially eligible studies were manually retrieved. After deduplication and re-screening, 25 studies involving a total of 8,024 subjects were finally included. The literature screening and selection process is detailed in the PRISMA flowchart in Figure 1.
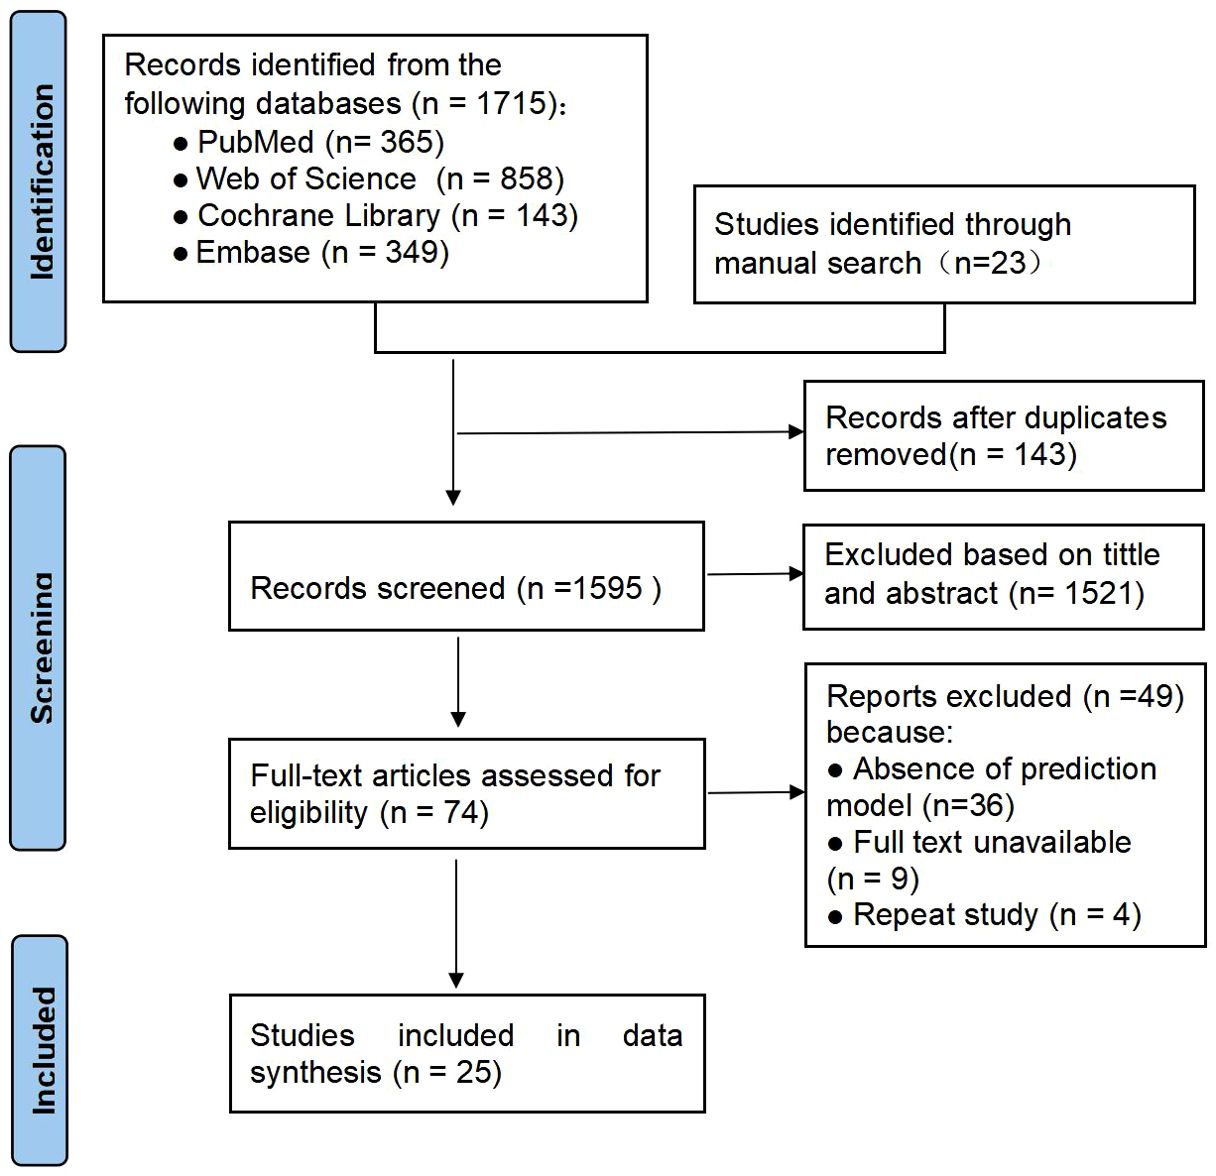
Figure 1. PRISMA flowchart of literature search and selection.
3.2 Study characteristics
This study included literature published between 2013 and 2024, mainly from the Netherlands (n = 8), the United States (n = 6), France (n = 2), and the United Kingdom (n = 2). Study types included 10 prospective studies (2 of which were multicenter) and 15 single-center retrospective studies with sample sizes ranging from 23 to 1901 participants. The primary outcome variables studied were dysphagia (n = 17), tube feeding (n = 6), and percutaneous endoscopic gastrostomy insertion (n = 2), with follow-up ranging from 4 weeks to 5 years; and other study details are detailed in Table 1.
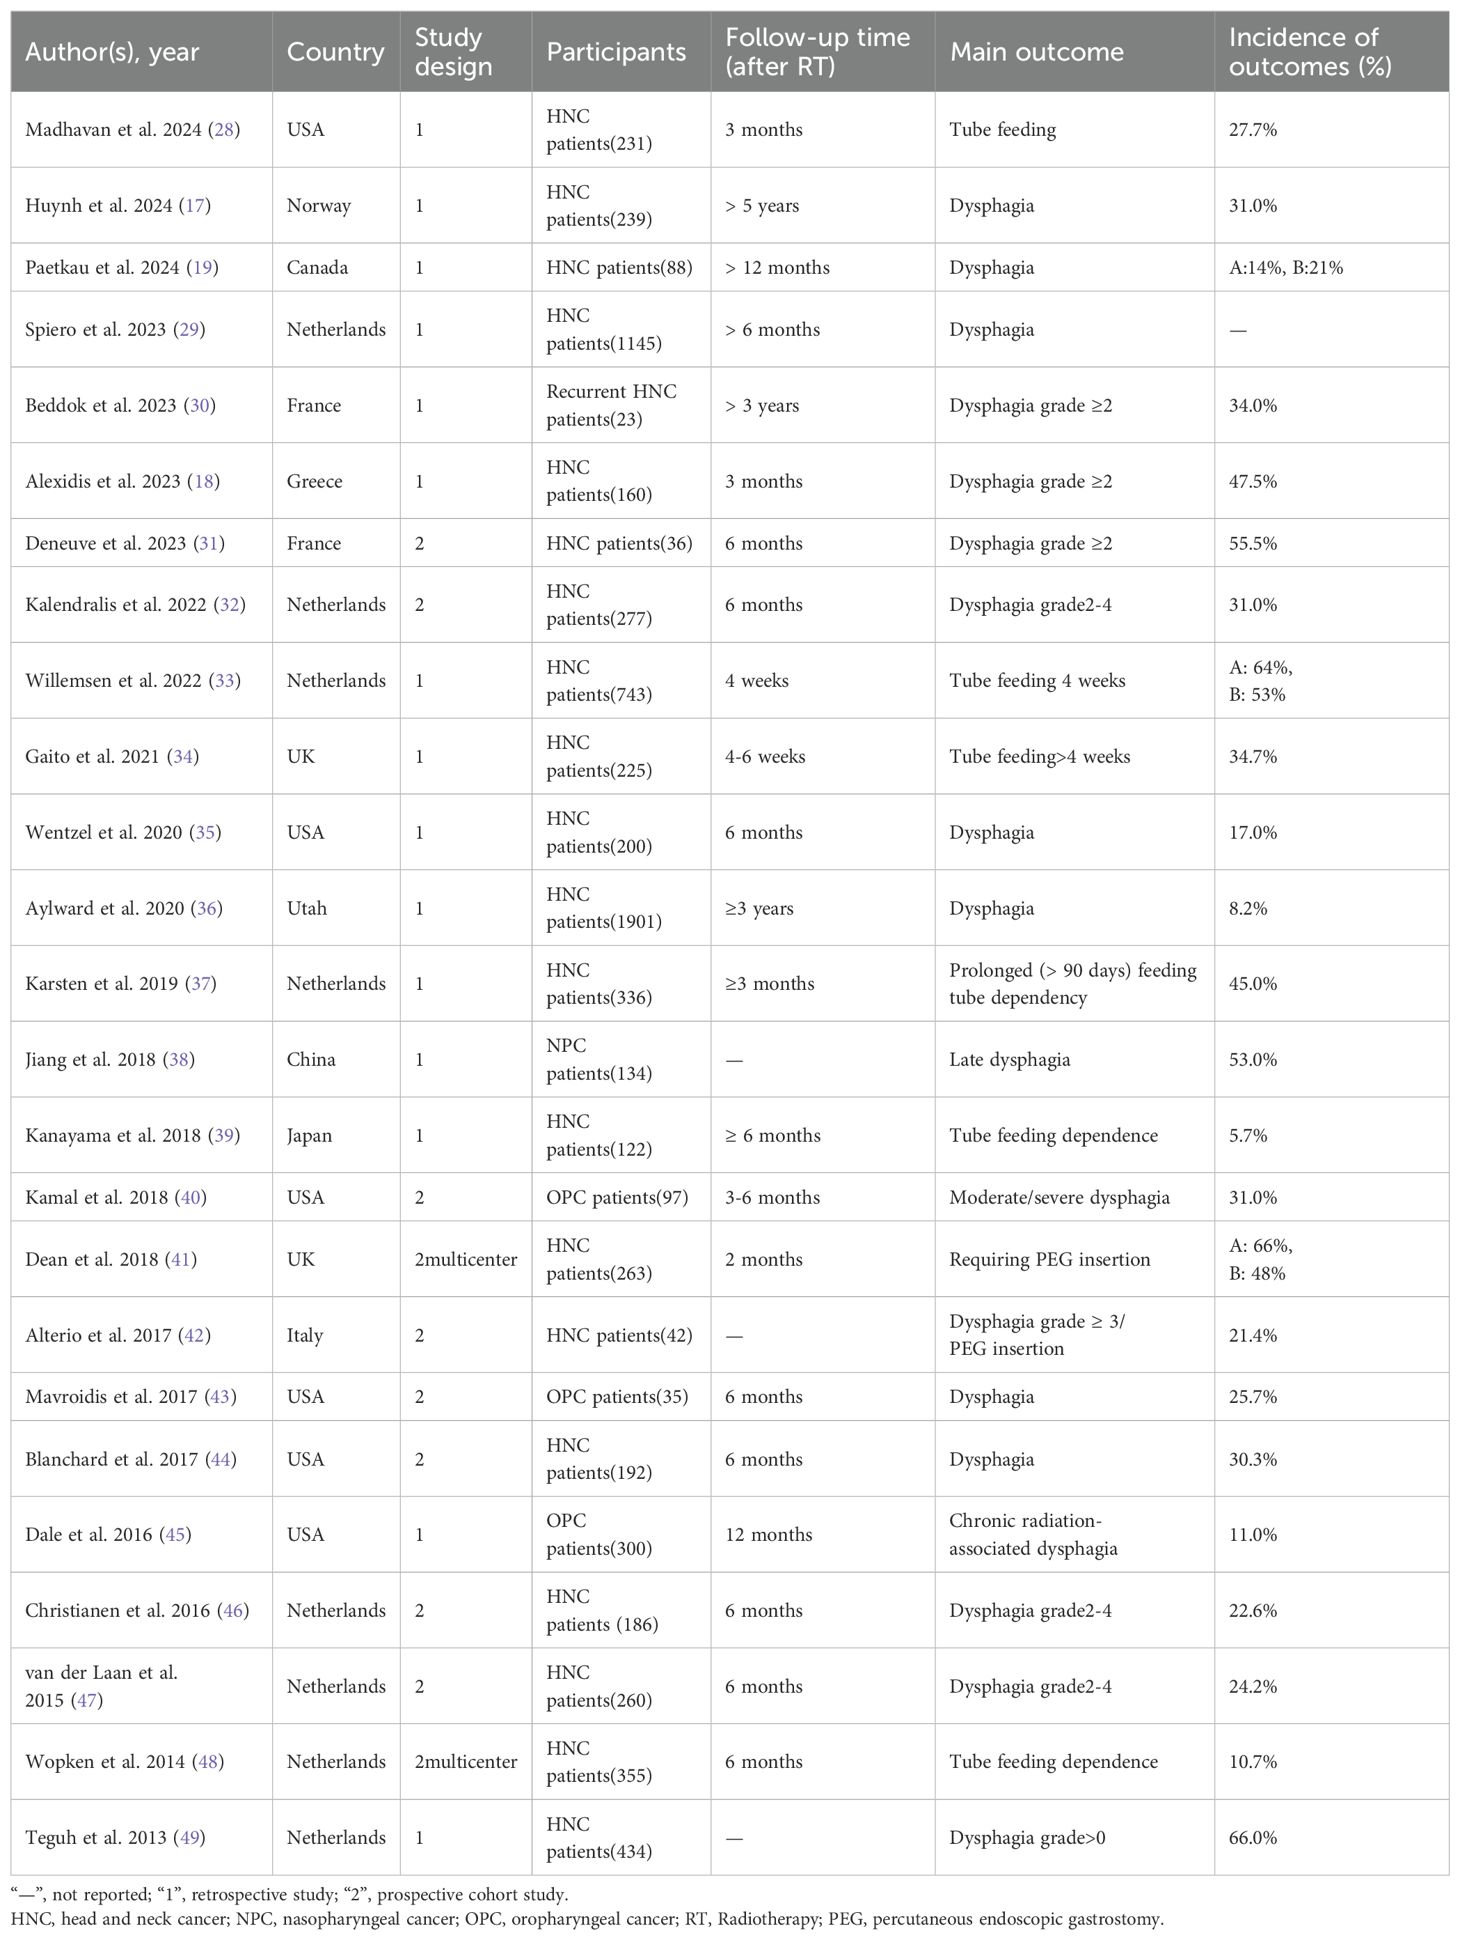
Table 1. Overview of basic data of the included studies.
3.3 Model construction, performance and presentation
Tables 2, 3 summarize the key information for model construction and validation in the studies. For missing value treatment, three studies used different interpolation methods (29, 33, 36), two studies directly deleted missing data (34, 41), and the remaining 20 did not specify the treatment. For predictor screening, one study used univariate analysis (28), one used stepwise logistic regression (40, 47), eight combined univariate analysis and multifactor logistic regression (17, 18, 33, 34, 37, 38, 42, 49), two used Least Absolute Shrinkage and Selection Operator (LASSO) regression (41, 48), and two used recursive partitioning analysis (45), one applied principal component analysis (19), and 10 did not report screening methods. The most common predictors were mean dose to pharyngeal constrictor muscles (PCM) (n=10), treatment setting (n=9) and tumor site (n=7). Other common predictors included age (n=5), tumor stage (n=5), mean dose to oral cavity (n=5), baseline weigh (n=4), baseline dysphagia (n=4), mean dose to the larynx (n=4).
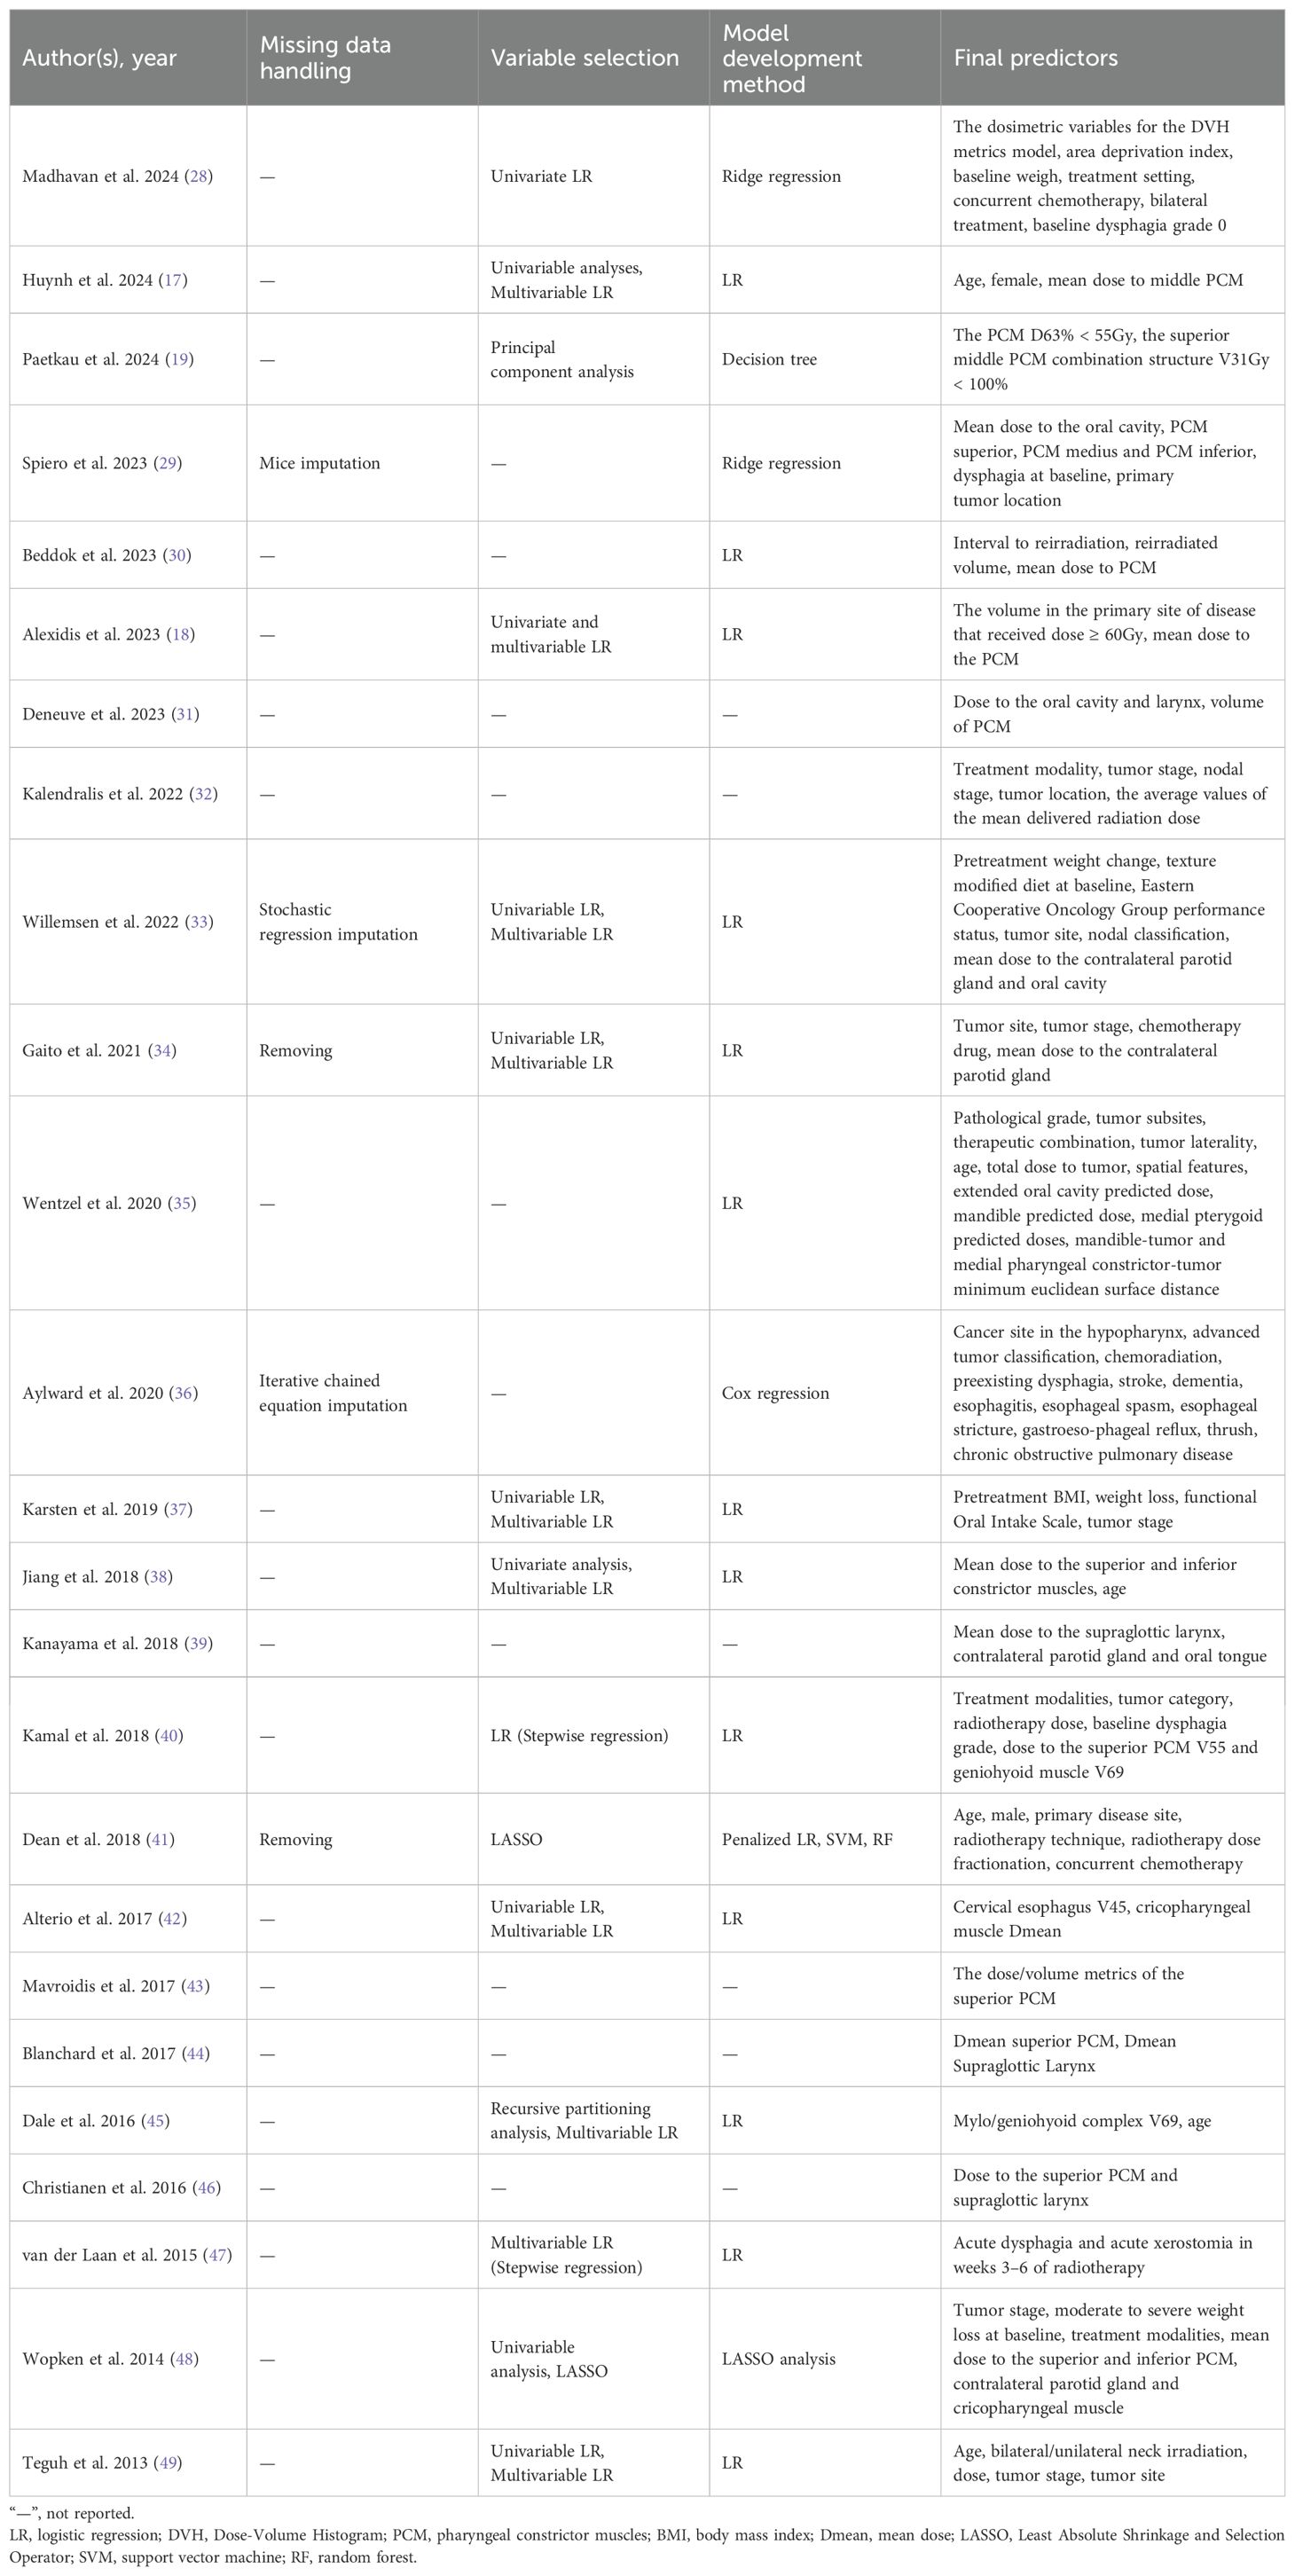
Table 2. Construction of the included predictive modelling models.
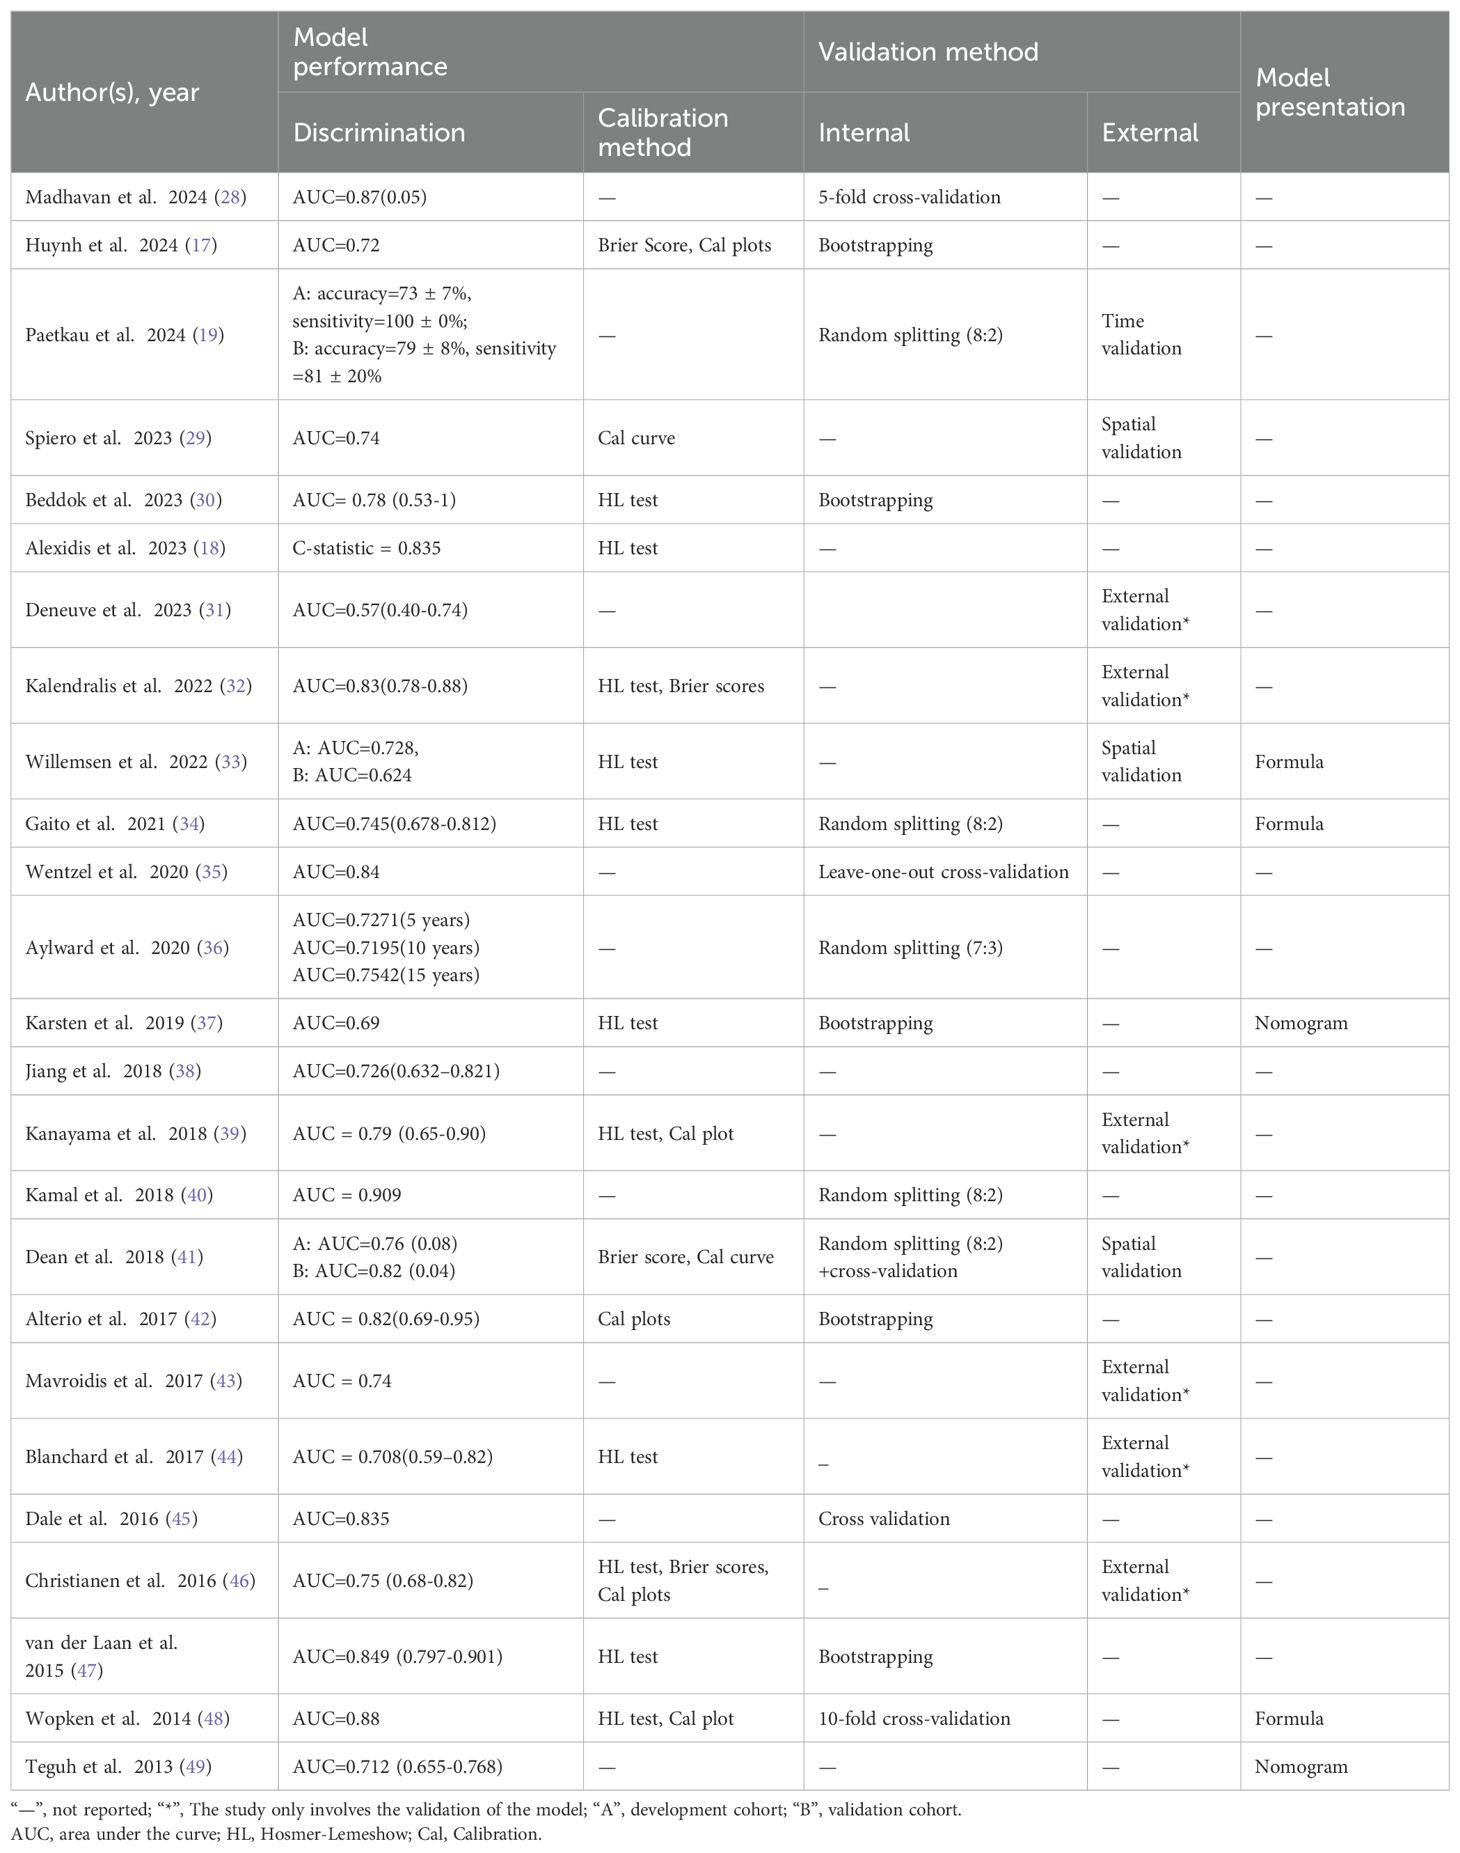
Table 3. Performance and presentation of the included predictive model models.
In most studies, logistic regression is the preferred method for constructing the model, but some studies have used cox regression (36), ridge regression (28, 29), LASSO regression (48), and decision tree (19), support vector machine (41), random forest (41), and other machine learning methods. Specifically, 19 studies focused on model development and validation, while six studies performed only model validation (31, 32, 39, 43, 44, 46). During model validation, 12 studies explicitly reported internal validation methods (17, 28, 30, 34–37, 40, 42, 45, 47, 48), four studies conducted internal and external validation (19, 29, 33, 41), six studies conducted external validation only (31, 32, 39, 43, 44, 46), and three studies did not specify their validation methods. In the process of internal validation, bootstrapping methods were used in five (17, 30, 37, 42, 47), cross-validation in four (28, 35, 45, 48), while three studies were performed by random sample splitting (34, 36, 40). In terms of model presentation, only five studies were presented, three of which were calculated using formulas (33, 34, 48) and two in the form of nomograms (37, 49).
In terms of model performance assessment, discrimination is a widely reported metric. In 25 studies, the values of AUC or C-index ranged from 0.57 to 0.909. In terms of model calibration, 15 models were evaluated, of which 11 studies used the Hosmer-Lemeshow test to assess the calibration of models (18, 30, 32–34, 37, 39, 44, 46–48). In addition, seven studies visualized the model calibration by drawing calibration plots (17, 29, 39, 41, 42, 46, 48), while four studies reported Brier scores to measure the predictive accuracy of the model (17, 32, 41, 46). Notably, only one study assessed the clinical utility of the model (37).
3.4 Results of quality assessment
Several problems in the assessment of risk of model bias were identified through the qualitative analyses conducted using the PROBAST tool. In the domain of participants, the main problem lies in the inappropriateness of data sources, such as excessive reliance on data from retrospective studies (17–19, 28–30, 33–39, 45, 49). In the domain of predictors, some studies failed to report quality control measures for predictors (19, 34, 38, 39, 42, 44, 49) and all studies did not explicitly state whether blinding was used in assessing predictor variables. In the domain of outcome, there were problems with non-standardized definitions of endpoints (19, 38, 39, 43–45); and failure to exclude factors that overlap with predictors (29, 30, 32, 35, 36, 40, 45). In addition, all models lacked information on the blinded assessment of outcome-predictor relationships and failed to clarify whether there was an appropriate time interval between predictor assessment and outcome determination. In the domain of analysis, there were insufficient sample sizes, failure to meet the recommendation of “events per variable” (EPV) of more than 10 (17, 19, 30, 31, 35, 38–43), improper handling of missing data (34, 41), and reliance on univariate analysis for variable selection (17, 18, 28, 33, 34, 37, 38, 42, 49). Meanwhile, model calibration was not assessed (19, 28, 31, 35, 36, 38, 40, 43, 45, 49). In terms of internal validation of the models, three studies relied only on a single randomized split sample (34, 36, 40) and none of the studies provided information on data complexity. The applicability risk assessment showed that most of the studies were rated as high risk. Overall, all studies in this systematic review showed a high risk of bias, suggesting that there may be methodological problems during the development or validation of the models (See Table 4).
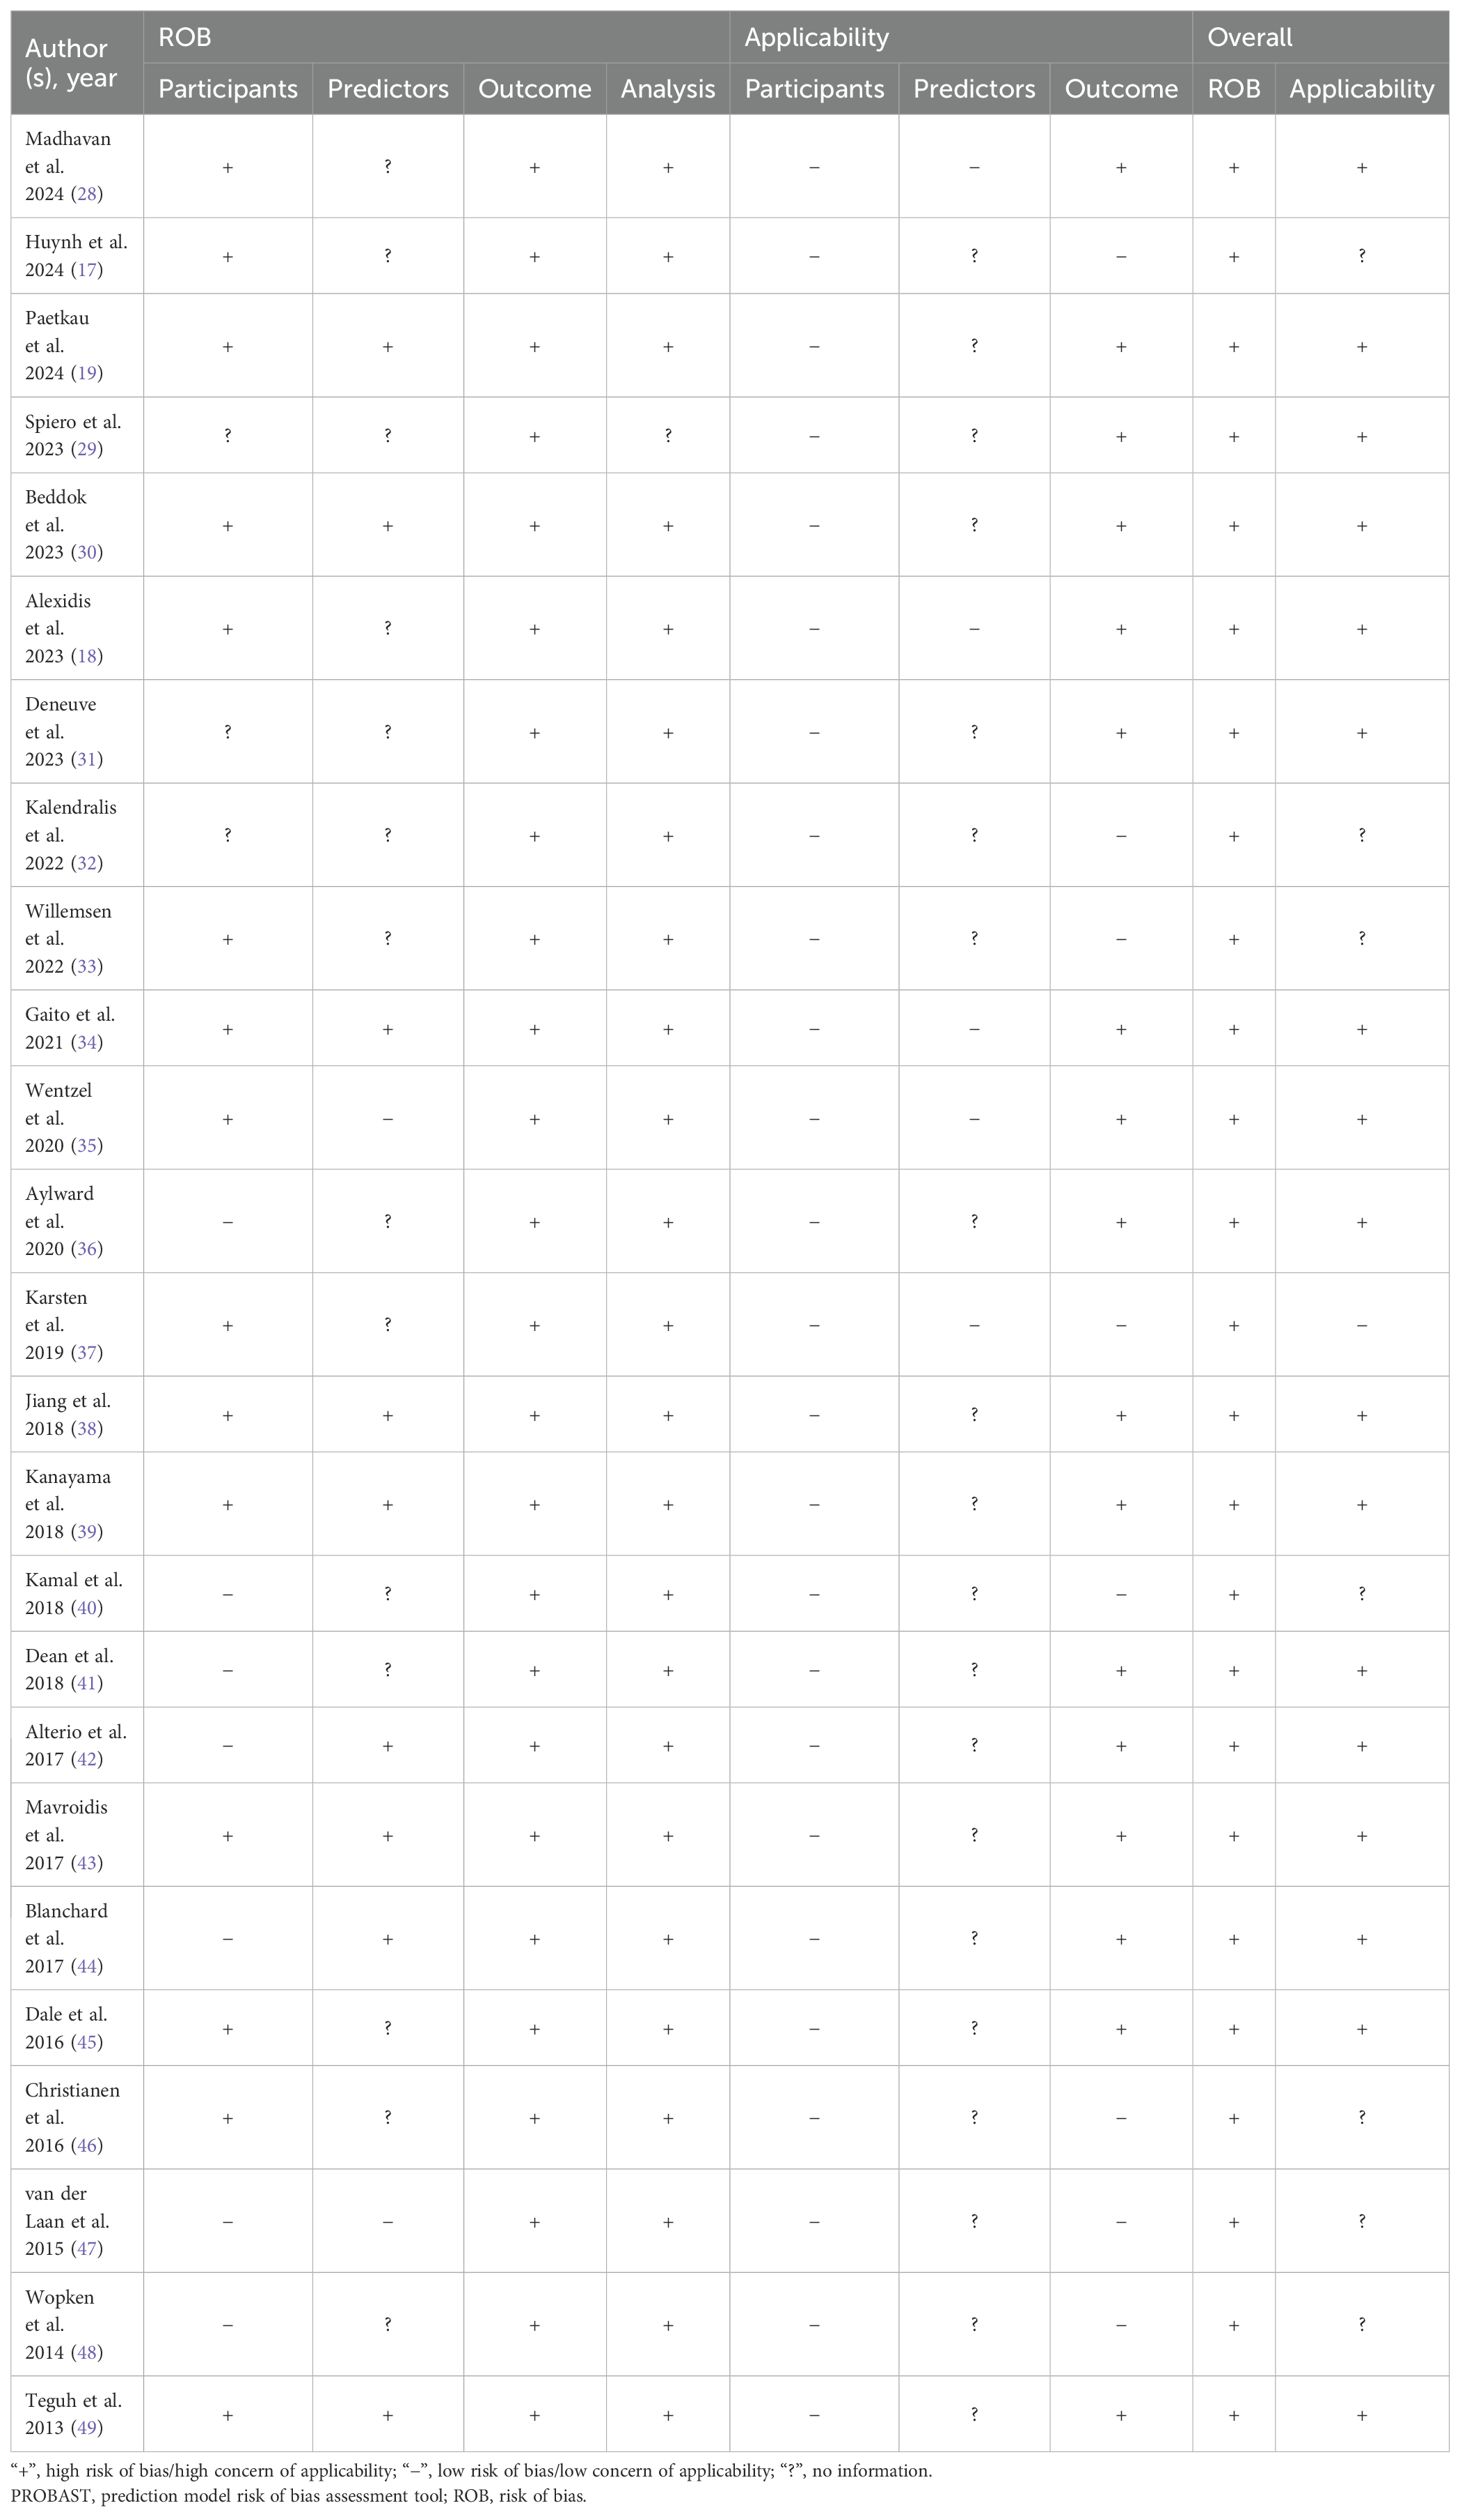
Table 4. PROBAST results of the included studies.
3.5 Meta-analysis results
Due to insufficient details reported by the models of some included studies, only 13 studies were ultimately eligible and included in the Meta-analysis. We used a random-effects model to calculate the combined AUC value, which yielded a result of 0.78 (95% CI: 0.74-0.81) (Figure 2). The I² value was 55.23% and the p-value was less than 0.01, which indicated a moderate degree of heterogeneity between studies. Furthermore, the Egger’s test showed a z-value of -0.984 (p = 0.325), indicating that there was no statistical publication bias.
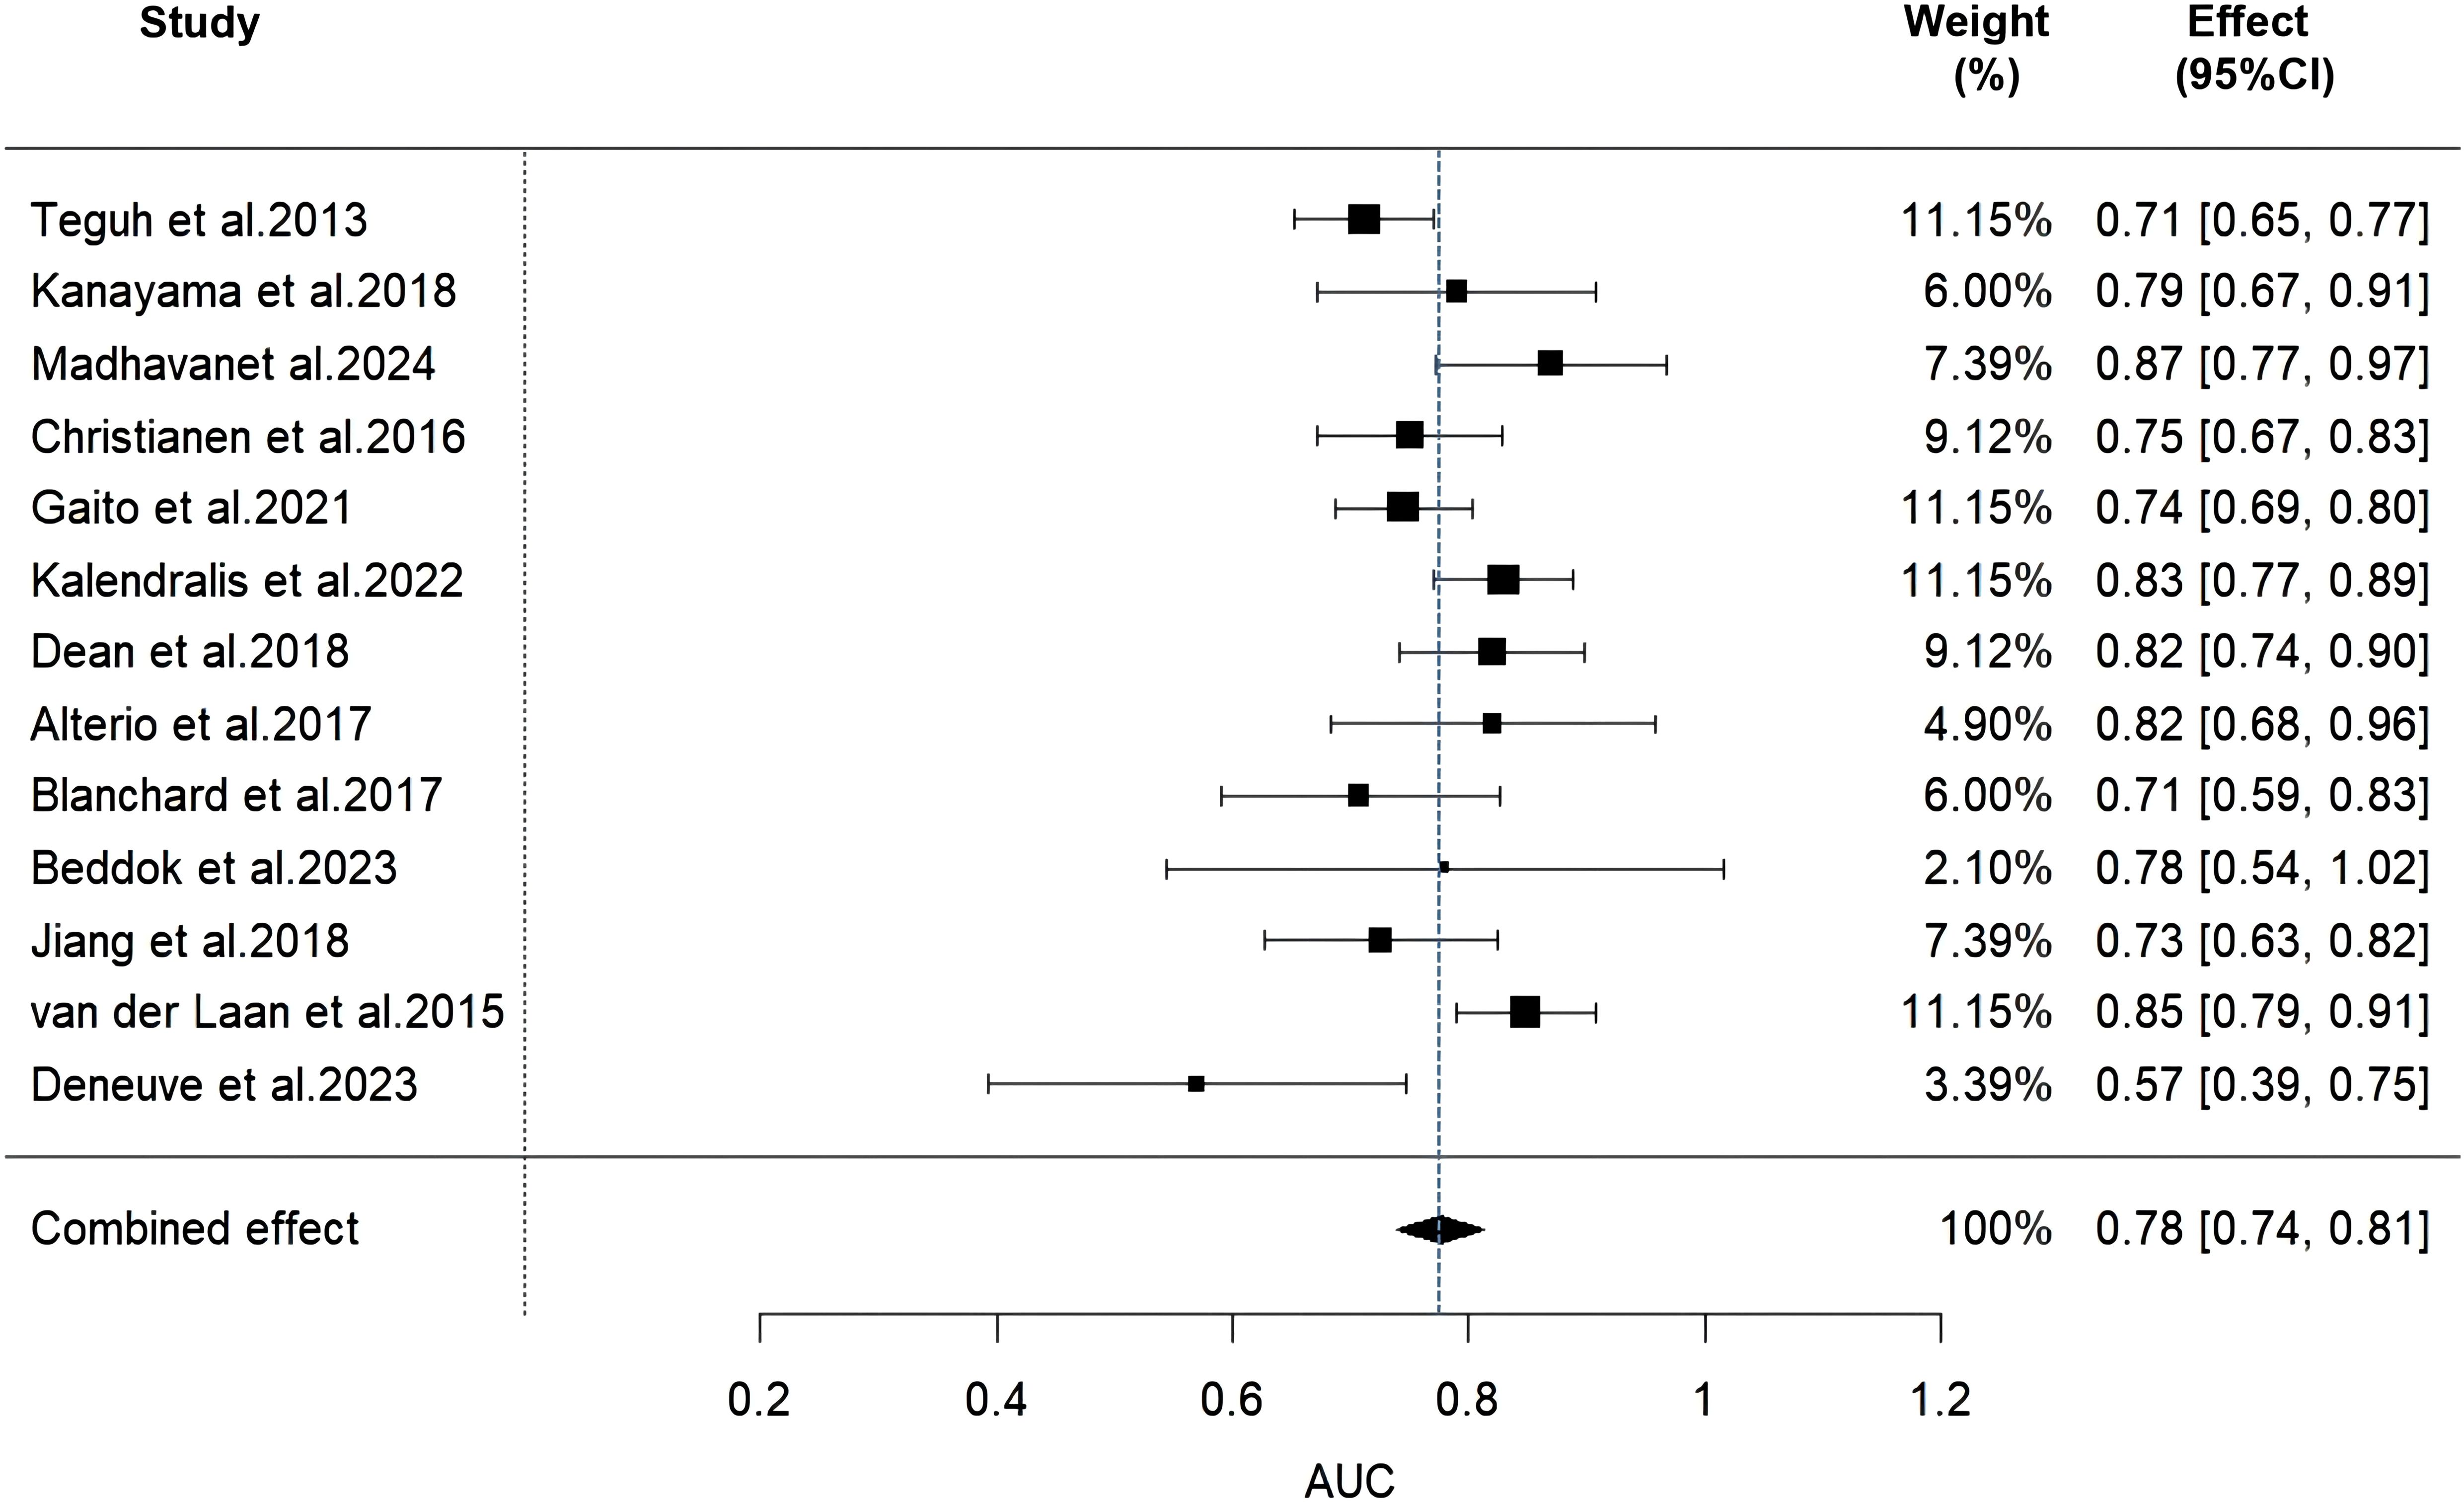
Figure 2. Forest plot of the random effects meta-analysis of combined AUC estimates for 13 validation models.
4 Discussion
In this study, we systematically reviewed 25 predictive models of dysphagia after radiotherapy for HNC, which demonstrated moderate to good predictive performance in internal or external validation, with AUC values ranging from 0.57 to 0.909. However, according to the PROBAST checklist, all included studies were rated as having a high risk of bias, which limited the application of the model in clinical practice. In addition, in a Meta-analysis of 13 validated models, we found that the combined AUC value was 0.78 (95% CI: 0.74-0.81), a result that implies that there is still room for improvement in the discriminatory power of these models. In addition, there was significant heterogeneity among the models, with an I² value of 55.23% and a p-value of less than 0.01, which may be attributed to differences in study design, sample size, predictor selection, and outcome definition.
In this study, we conducted an in-depth analysis of the risk of bias in prediction models. Two of the studies (41, 48) achieved high AUC values (0.82 and 0.88, respectively) through a multicenter prospective cohort design, which to some extent predicts the potential for clinical application. However, the study by Dean et al. (41) was limited by a small sample size (n=263) and the direct exclusion of missing data in data processing, which may have introduced information loss and selectivity bias (50). The study by Wopken et al. (48) faced a similar sample size issue (n=355) and lacked external validation, which further limited the generalizability of their model. In contrast, the two studies with sample sizes of more than 1000 cases (29, 36) were retrospective studies, in which Aylward et al. (36) performed internal validation of their model through a random sample splitting method. However, this method may be affected by chance factors, which may bias the assessment of model performance. Especially in the case of small sample sizes, this random splitting may further weaken the generalization ability of the model. In all the predictive models included in this study, the sample sizes ranged from 23 to 1901 participants, and most studies failed to meet the recommended criterion of at least 10 events (EPV≥10) per predictor variable (51), which may weaken the prediction accuracy of the models. Generally speaking, a larger sample size helps to improve the reliability and stability of the model. Therefore, future research should focus on expanding the sample size to improve the clinical application value of the model.
In this study, we paid particular attention to the transparency and reproducibility of the research methodology. We noted that none of the included studies explicitly reported whether the assessment of outcome measures and predictors was blinded. Lack of blinding may expose assessors to subjective bias, which in turn may affect the objectivity and reliability of the study results. Furthermore, we found that some studies relied on univariate analysis to screen variables, an approach that may fail to adequately consider the interactions between variables, thereby increasing the risk of model bias and potentially leading to the omission of important predictor variables. In order to improve the stability and predictive ability of the model, we suggest adopting more advanced variable screening methods, such as LASSO regression (52), which can deal with the multicollinearity problem among variables and help to identify the most predictive variables. In this systematic review, Paetkau et al. (19) and Dean et al. (41) used machine learning algorithms in model development. Although machine learning algorithms have the potential to improve prediction accuracy (53), they did not demonstrate significant benefits in this review. We believe that this phenomenon may be related to factors such as insufficient sample size, variable screening methods based on univariate analysis, and random division of data sets.
In addition to discrimination, calibration is also a key indicator when evaluating clinical prediction models. Calibration reflects the agreement between the predicted probability of a model and the actual observed probability, which is usually assessed through calibration plots (54). In this study, we found that 15 out of 25 models were assessed for calibration using the Hosmer-Lemeshow test, calibration plots, and Brier scores. However, 10 models did not report calibration results, and although most of these models showed good discrimination with AUC values greater than 0.7, the lack of calibration data may increase the risk of model bias and limit a comprehensive assessment of model performance. Therefore, future studies recommend comprehensive reporting of model results to help clinical staff assess model performance more comprehensively thus better support clinical decision-making.
In this review, we identified and evaluated a series of clinically significant predictor variables that are critical for predicting dysphagia after radiotherapy in patients with HNC. Studies have shown that the average radiotherapy dose to the PCM is a key predictor of the risk of dysphagia after radiotherapy (18, 30). An in-depth study of the effect of dose limitation of the local PCM and its combined substructures on radiosensitivity further revealed the important role of these regions in risk prediction (29, 55) and validated the applicability of the normal tissue complication probability (NTCP) model. The NTCP model emphasizes the key role of dose limitation in PCM and supraglottic laryngeal region in predicting dysphagia after radiotherapy, which provides an important reference for clinical radiotherapy strategies (46). Furthermore, treatment modalities, particularly the combination of radiotherapy and chemotherapy, have been shown to significantly increase the risk of dysphagia (56–58). This increased risk may stem from the synergistic effect between radiotherapy and chemotherapy, exacerbating tissue damage, including mucositis, fibrosis and atrophy, further deteriorating swallowing function (59). The location of the tumor has also been found to be a key predictor of postoperative dysphagia, with different sites of tumors having varying effects on the function of surrounding tissues and organs, especially those structures directly involved in the swallowing process (60). The effect of age as another important predictor on the risk of dysphagia is associated with radiotherapy-induced tissue fibrosis and atrophy (59). This risk rises significantly with age, which may be related to increased comorbidities and decreased body reserve capacity in older patients (61). Among all clinical variables, T stage of the tumor (especially T4 stage) is the strongest predictor of dysphagia because it not only reflects the size of the tumor, but also reveals the aggressiveness and spread extent of the tumor, which together influence the choice and intensity of treatment options (62). Finally, the mean dose to oral cavity was also shown to be an important predictor of dysphagia after radiotherapy. Radiotherapy may lead to reduced elasticity and contraction ability of oral and pharyngeal muscles, affecting normal swallowing function, and may reduce the sensitivity of swallowing reflex, increasing the risk of choking or swallowing by mistake when eating (63).
Therefore, identifying and understanding these predictors is essential for optimizing clinical treatment strategies. When designing and improving predictive models, these key factors should be prioritized for incorporation to increase the value of the models in guiding clinical decisions. Especially in radiotherapy, dose-volume limitation has become an important clinical consideration. For example, limiting the radiation dose for PCM and supraglottic larynx not only effectively reduces the incidence of dysphagia, but also provides key parameters for optimizing prediction models. Future studies should further explore the applicability and impact of these factors and their dose-volume limitations in different patient populations, so as to enhance the clinical relevance and accuracy of prediction models and provide more reliable support for individualized treatment strategies.
This systematic review has the following limitations: (1) This study included only the literature published in English on prediction models for dysphagia risk, which may have led to our failure to cover important research findings in other languages. (2) Due to the heterogeneity of the included studies, we were only able to perform a meta-analysis of some of the studies, which limited our in-depth analysis of the sources of heterogeneity and potential publication bias. (3) Most models have not yet included some commonly used variables, such as xerostomia and severe acute toxicity (mucositis). It is recommended that future studies fully consider the inclusion of these recognized predictors into the model to further improve the accuracy and clinical applicability of the prediction. (4) The high variability observed in the study may be partly due to differences in methodology and treatment options (such as the definition of dysphagia grading, chemotherapy standards and irradiation techniques, etc.). Due to the lack of unified standards, further subgroup analysis cannot be carried out, thus limiting our accurate identification of specific sources of heterogeneity in predictive model research. In order to improve the clinical applicability and scientific accuracy of predictive models, future studies should consider these limitations and take appropriate improvements during study design and execution.
5 Conclusion
In this systematic review, we comprehensively analyzed 25 models predicting the risk of dysphagia after chemoradiotherapy in patients with HNC. Although some models showed good predictive performance, all included studies were assessed as having a high risk of bias in methodological quality, which limits the potential use of these models in clinical practice for prophylactic treatment of people at high risk of dysphagia after radiotherapy. In order to improve the quality of future studies and the clinical applicability of the models, investigators should strictly follow methodological and reporting guidelines and systematically evaluate the model development and validation process to reduce the risk of bias. In addition, conducting more external validation studies is essential to comprehensively assess the performance of existing models, which will help to guide clinical decision-making and practice more effectively.
Data availability statement
The original contributions presented in the study are included in the article/Supplementary Material. Further inquiries can be directed to the corresponding authors.
Author contributions
YP: Conceptualization, Data curation, Formal analysis, Methodology, Writing – original draft. JY: Funding acquisition, Conceptualization, Data curation, Formal analysis, Software, Writing – original draft. LS: Data curation, Validation, Writing – original draft. QT: Data curation, Validation, Writing – original draft. XZ: Funding acquisition, Methodology, Supervision, Writing – review & editing. GL: Methodology, Project administration, Supervision, Writing – review & editing.
Funding
The author(s) declare financial support was received for the research, authorship, and/or publication of this article. This study was supported by the Development and Regeneration Key Laboratory of Sichuan Province (23LHNBZYB23) and Health Commission of Sichuan Province Medical Science and Technology Program (24WSXT033).
Conflict of interest
The authors declare that the research was conducted in the absence of any commercial or financial relationships that could be construed as a potential conflict of interest.
Generative AI statement
The author(s) declare that no Generative AI was used in the creation of this manuscript.
Publisher’s note
All claims expressed in this article are solely those of the authors and do not necessarily represent those of their affiliated organizations, or those of the publisher, the editors and the reviewers. Any product that may be evaluated in this article, or claim that may be made by its manufacturer, is not guaranteed or endorsed by the publisher.
Supplementary material
The Supplementary Material for this article can be found online at: https://www.frontiersin.org/articles/10.3389/fonc.2025.1502404/full#supplementary-material
References
1. Gatta G, Botta L, Sánchez MJ, Anderson LA, Pierannunzio D, Licitra L, et al. Prognoses and improvement for head and neck cancers diagnosed in Europe in early 2000s: The EUROCARE-5 population-based study. Eur J Cancer. (2015) 51:2130–43. doi: 10.1016/j.ejca.2015.07.043
2. Samara P, Athanasopoulos M, Mastronikolis S, Kyrodimos E, Athanasopoulos I, Mastronikolis NS. The role of oncogenic viruses in head and neck cancers: epidemiology, pathogenesis, and advancements in detection methods. Microorganisms. (2024) 12:1482. doi: 10.3390/microorganisms12071482
3. Mody MD, Rocco JW, Yom SS, Haddad RI, Saba NF. Head and neck cancer. Lancet. (2021) 398:2289–99. doi: 10.1016/S0140-6736(21)01550-6
4. McDowell LJ, Rock K, Xu W, Chan B, Waldron J, Lu L, et al. Long-term late toxicity, quality of life, and emotional distress in patients with nasopharyngeal carcinoma treated with intensity modulated radiation therapy. Int J Radiat Oncol. (2018) 102:340–52. doi: 10.1016/j.ijrobp.2018.05.060
5. Cristofaro MG, Barca I, Ferragina F, Novembre D, Ferro Y, Pujia R, et al. The health risks of dysphagia for patients with head and neck cancer: a multicentre prospective observational study. J Transl Med. (2021) 19:472. doi: 10.1186/s12967-021-03144-2
6. Hutcheson KA, Nurgalieva Z, Zhao H, Gunn GB, Giordano SH, Bhayani MK, et al. Two-year prevalence of dysphagia and related outcomes in head and neck cancer survivors: An updated SEER-Medicare analysis. Head Neck. (2019) 41:479–87. doi: 10.1002/hed.25412
7. Ortigara GB, Bonzanini LIL, Schulz RE, Ferrazzo KL. Late radiation effects in survivors of head and neck cancer: State of the science. Crit Rev Oncol Hematol. (2021) 162:103335. doi: 10.1016/j.critrevonc.2021.103335
8. Crowder SL, Douglas KG, Yanina Pepino M, Sarma KP, Arthur AE. Nutrition impact symptoms and associated outcomes in post-chemoradiotherapy head and neck cancer survivors: a systematic review. J Cancer Surviv. (2018) 12:479–94. doi: 10.1007/s11764-018-0687-7
9. Jin S, Lu Q, Sun Y, Xiao S, Zheng B, Pang D, et al. Nutrition impact symptoms and weight loss in head and neck cancer during radiotherapy: a longitudinal study. BMJ Support Palliat Care. (2021) 11:17–24. doi: 10.1136/bmjspcare-2019-002077
10. Baijens LWJ, Walshe M, Aaltonen L-M, Arens C, Cordier R, Cras P, et al. European white paper: oropharyngeal dysphagia in head and neck cancer. Eur Arch Oto-Rhino-Laryngol Off J Eur Fed Oto-Rhino-Laryngol Soc EUFOS Affil Ger Soc Oto-Rhino-Laryngol - Head Neck Surg. (2021) 278:577–616. doi: 10.1007/s00405-020-06507-5
11. Attrill S, White S, Murray J, Hammond S, Doeltgen S. Impact of oropharyngeal dysphagia on healthcare cost and length of stay in hospital: a systematic review. BMC Health Serv Res. (2018) 18:594. doi: 10.1186/s12913-018-3376-3
12. Miller A, Wilson E, Diver C. Returning to work: a qualitative study of the experiences of head and neck cancer survivors. J Laryngol Otol. (2023) 137:691–6. doi: 10.1017/S0022215122002201
13. Wopken K, Bijl HP, Langendijk JA. Prognostic factors for tube feeding dependence after curative (chemo-) radiation in head and neck cancer: A systematic review of literature. Radiother Oncol. (2018) 126:56–67. doi: 10.1016/j.radonc.2017.08.022
14. Van Der Molen L, Heemsbergen WD, De Jong R, Van Rossum MA, Smeele LE, Rasch CRN, et al. Dysphagia and trismus after concomitant chemo-Intensity-Modulated Radiation Therapy (chemo-IMRT) in advanced head and neck cancer; dose-effect relationships for swallowing and mastication structures. Radiother Oncol. (2013) 106:364–9. doi: 10.1016/j.radonc.2013.03.005
15. Christopherson KM, Ghosh A, Mohamed ASR, Kamal M, Gunn GB, Dale T, et al. Chronic radiation-associated dysphagia in oropharyngeal cancer survivors: Towards age-adjusted dose constraints for deglutitive muscles. Clin Transl Radiat Oncol. (2019) 18:16–22. doi: 10.1016/j.ctro.2019.06.005
16. Alexidis P, Bangeas P, Efthymiadis K, Drevelegkas K, Kolias P. Investigating factors associated to dysphagia and need for percutaneous endoscopic gastrostomy in patients with head and neck cancer receiving radiation therapy. J Cancer. (2022) 13:1523–9. doi: 10.7150/jca.69130
17. Huynh TTM, Dale E, Falk RS, Hellebust TP, Astrup GL, Malinen E, et al. Radiation-induced long-term dysphagia in survivors of head and neck cancer and association with dose-volume parameters. Radiother Oncol. (2024) 190:110044. doi: 10.1016/j.radonc.2023.110044
18. Alexidis P, Kolias P, Mentesidou V, Topalidou M, Kamperis E, Giannouzakos V, et al. Investigating predictive factors of dysphagia and treatment prolongation in patients with oral cavity or oropharyngeal cancer receiving radiation therapy concurrently with chemotherapy. Curr Oncol. (2023) 30:5168–78. doi: 10.3390/curroncol30050391
19. Paetkau O. Pharyngeal constrictor dose-volume histogram metrics and patient-reported dysphagia in head and neck radiotherapy. Clin Oncol. (2024) 36(3):173–82. doi: 10.1016/j.clon.2024.01.002
20. Zeng Z, Yao L, Roy A, Li X, Espino S, Clare SE, et al. Identifying breast cancer distant recurrences from electronic health records using machine learning. J Healthc Inform Res. (2019) 3:283–99. doi: 10.1007/s41666-019-00046-3
21. Wang HH, Wang YH, Liang CW, Li YC. Assessment of deep learning using nonimaging information and sequential medical records to develop a prediction model for nonmelanoma skin cancer. JAMA Dermatol. (2019) 155:1277. doi: 10.1001/jamadermatol.2019.2335
22. Trotti A, Byhardt R, Stetz J, Gwede C, Corn B, Fu K, et al. Common toxicity criteria: version 2.0. an improved reference for grading the acute effects of cancer treatment: impact on radiotherapy. Int J Radiat Oncol. (2000) 47:13–47. doi: 10.1016/S0360-3016(99)00559-3
23. Moons KGM, de Groot JAH, Bouwmeester W, Vergouwe Y, Mallett S, Altman DG, et al. Critical appraisal and data extraction for systematic reviews of prediction modelling studies: the CHARMS checklist. PloS Med. (2014) 11:e1001744. doi: 10.1371/journal.pmed.1001744
24. Moons KGM, Wolff RF, Riley RD, Whiting PF, Westwood M, Collins GS, et al. PROBAST: A tool to assess risk of bias and applicability of prediction model studies: explanation and elaboration. Ann Intern Med. (2019) 170:W1. doi: 10.7326/M18-1377
25. Swets JA. Measuring the accuracy of diagnostic systems. Science. (1988) 240:1285–93. doi: 10.1126/science.3287615
26. Huedo-Medina TB, Sánchez-Meca J, Marín-Martínez F, Botella J. Assessing heterogeneity in meta-analysis: Q statistic or I2 index? Psychol Methods. (2006) 11:193–206. doi: 10.1037/1082-989X.11.2.193
27. Egger M, Smith GD, Schneider M, Minder C. Bias in meta-analysis detected by a simple, graphical test. BMJ. (1997) 315:629–34. doi: 10.1136/bmj.315.7109.629
28. Madhavan S, Gamez M, Garces YI, Lester SC, Ma DJ, Mundy DW, et al. Impact of radiation dose distribution on nutritional supplementation needs in head and neck cancer radiotherapy: a voxel-based machine learning approach. Front Oncol. (2024) 14:1346797. doi: 10.3389/fonc.2024.1346797
29. Spiero I, Schuit E, Wijers OB, Hoebers FJP, Langendijk JA, Leeuwenberg AM. Comparing supervised and semi-supervised machine learning approaches in NTCP modeling to predict complications in head and neck cancer patients. Clin Transl Radiat Oncol. (2023) 43:100677. doi: 10.1016/j.ctro.2023.100677
30. Beddok A, Maynadier X, Krhili S, Ala Eddine C, Champion L, Chilles A, et al. Predictors of toxicity after curative reirradiation with intensity modulated radiotherapy or proton therapy for recurrent head and neck carcinoma: new dose constraints for pharyngeal constrictors muscles and oral cavity. Strahlenther Onkol. (2023) 199:901–9. doi: 10.1007/s00066-023-02080-y
31. Deneuve S, Bastogne T, Duclos M, Mirjolet C, Bois P, Bachmann P, et al. Predicting acute severe toxicity for head and neck squamous cell carcinomas by combining dosimetry with a radiosensitivity biomarker: a pilot study. Tumori J. (2023) 109:173–85. doi: 10.1177/03008916221078061
32. Kalendralis P, Sloep M, Moni George N, Snel J, Veugen J, Hoebers F, et al. Independent validation of a dysphagia dose response model for the selection of head and neck cancer patients to proton therapy. Phys Imaging Radiat Oncol. (2022) 24:47–52. doi: 10.1016/j.phro.2022.09.005
33. Willemsen ACH, Kok A, Baijens LWJ, De Boer JP, De Bree R, Devriese LA, et al. Development and external validation of a prediction model for tube feeding dependency for at least four weeks during chemoradiotherapy for head and neck cancer. Clin Nutr. (2022) 41:177–85. doi: 10.1016/j.clnu.2021.11.019
34. Gaito S, France A, Foden P, Abravan A, Burnet N, Garcez K, et al. A predictive model for reactive tube feeding in head and neck cancer patients undergoing definitive (Chemo) radiotherapy. Clin Oncol. (2021) 33:e433–41. doi: 10.1016/j.clon.2021.05.002
35. Wentzel A, Hanula P, Van Dijk LV, Elgohari B, Mohamed ASR, Cardenas CE, et al. Precision toxicity correlates of tumor spatial proximity to organs at risk in cancer patients receiving intensity-modulated radiotherapy. Radiother Oncol. (2020) 148:245–51. doi: 10.1016/j.radonc.2020.05.023
36. Aylward A, Park J, Abdelaziz S, Hunt JP, Buchmann LO, Cannon RB, et al. Individualized prediction of late-onset dysphagia in head and neck cancer survivors. Head Neck. (2020) 42:708–18. doi: 10.1002/hed.26039
37. Karsten RT, Stuiver MM, van der Molen L, Navran A, De Boer JP, Hilgers FJM, et al. From reactive to proactive tube feeding during chemoradiotherapy for head and neck cancer: A clinical prediction model-based approach. Oral Oncol. (2019) 88:172–9. doi: 10.1016/j.oraloncology.2018.11.031
38. Jiang L, Huang C, Gan Y, Wu T, Tang X, Wang Y, et al. Radiation-induced late dysphagia after intensity-modulated radiotherapy in nasopharyngeal carcinoma patients: a dose-volume effect analysis. Sci Rep. (2018) 8:16396. doi: 10.1038/s41598-018-34803-y
39. Kanayama N, Kierkels RGJ, van der Schaaf A, Steenbakkers RJHM, Yoshioka Y, Nishiyama K, et al. External validation of a multifactorial normal tissue complication probability model for tube feeding dependence at 6 months after definitive radiotherapy for head and neck cancer. Radiother Oncol. (2018) 129:403–8. doi: 10.1016/j.radonc.2018.09.013
40. Kamal M, Mohamed ASR, Volpe S, Zaveri J, Barrow MP, Gunn GB, et al. Radiotherapy dose-volume parameters predict videofluoroscopy-detected dysphagia per DIGEST after IMRT for oropharyngeal cancer: Results of a prospective registry. Radiother Oncol. (2018) 128:442–51. doi: 10.1016/j.radonc.2018.06.013
41. Dean J, Wong K, Gay H, Welsh L, Jones A-B, Schick U, et al. Incorporating spatial dose metrics in machine learning-based normal tissue complication probability (NTCP) models of severe acute dysphagia resulting from head and neck radiotherapy. Clin Transl Radiat Oncol. (2018) 8:27–39. doi: 10.1016/j.ctro.2017.11.009
42. Alterio D, Gerardi MA, Cella L, Spoto R, Zurlo V, Sabbatini A, et al. Radiation-induced acute dysphagia : Prospective observational study on 42 head and neck cancer patients. Strahlenther Onkol. (2017) 193:971–81. doi: 10.1007/s00066-017-1206-x
43. Mavroidis P, Price A, Fried D, Kostich M, Amdur R, Mendenhall W, et al. Dose-volume toxicity modeling for de-intensified chemo-radiation therapy for HPV-positive oropharynx cancer. Radiother Oncol. (2017) 124:240–7. doi: 10.1016/j.radonc.2017.06.020
44. Blanchard P, Wong AJ, Gunn GB, Garden AS, Mohamed ASR, Rosenthal DI, et al. Toward a model-based patient selection strategy for proton therapy: External validation of photon-derived normal tissue complication probability models in a head and neck proton therapy cohort. Radiother Oncol. (2016) 121:381–6. doi: 10.1016/j.radonc.2016.08.022
45. Dale T, Hutcheson K, Mohamed ASR, Lewin JS, Gunn GB, Rao AUK, et al. Beyond mean pharyngeal constrictor dose for beam path toxicity in non-target swallowing muscles: Dose-volume correlates of chronic radiation-associated dysphagia (RAD) after oropharyngeal intensity modulated radiotherapy. Radiother Oncol. (2016) 118:304–14. doi: 10.1016/j.radonc.2016.01.019
46. Christianen MEMC, van der Schaaf A, van der Laan HP, Verdonck-de-Leeuw IM, Doornaert P, Chouvalova O, et al. Swallowing sparing intensity modulated radiotherapy (SW-IMRT) in head and neck cancer: Clinical validation according to the model-based approach. Radiother Oncol. (2016) 118:298–303. doi: 10.1016/j.radonc.2015.11.009
47. Van Der Laan HP, Bijl HP, Steenbakkers RJHM, van der Schaaf A, Chouvalova O, Vemer-van-Den-Hoek JGM, et al. Acute symptoms during the course of head and neck radiotherapy or chemoradiation are strong predictors of late dysphagia. Radiother Oncol. (2015) 115:56–62. doi: 10.1016/j.radonc.2015.01.019
48. Wopken K, Bijl HP, van der Schaaf A, van der Laan HP, Chouvalova O, Steenbakkers RJHM, et al. Development of a multivariable normal tissue complication probability (NTCP) model for tube feeding dependence after curative radiotherapy/chemo-radiotherapy in head and neck cancer. Radiother Oncol. (2014) 113:95–101. doi: 10.1016/j.radonc.2014.09.013
49. Teguh DN, Levendag PC, Ghidey W, Van Montfort K, Kwa SLS. Risk model and nomogram for dysphagia and xerostomia prediction in head and neck cancer patients treated by radiotherapy and/or chemotherapy. Dysphagia. (2013) 28:388–94. doi: 10.1007/s00455-012-9445-6
50. Ziegler A. Clinical prediction models: A practical approach to development, validation, and updating. Biom J. (2020) 62:1122–3. doi: 10.1002/bimj.202000088
51. Van Smeden M, Moons KG, De Groot JA, Collins GS, Altman DG, Eijkemans MJ, et al. Sample size for binary logistic prediction models: Beyond events per variable criteria. Stat Methods Med Res. (2019) 28:2455–74. doi: 10.1177/0962280218784726
52. McNeish DM. Using lasso for predictor selection and to assuage overfitting: A method long overlooked in behavioral sciences. Multivar Behav Res. (2015) 50(5):471–84. doi: 10.1080/00273171.2015.1036965
53. Churpek MM, Yuen TC, Winslow C, Meltzer DO, Kattan MW, Edelson DP. Multicenter comparison of machine learning methods and conventional regression for predicting clinical deterioration on the wards. Crit Care Med. (2016) 44:368–74. doi: 10.1097/CCM.0000000000001571
54. Steyerberg EW, Vergouwe Y. Towards better clinical prediction models: seven steps for development and an ABCD for validation. Eur Heart J. (2014) 35:1925–31. doi: 10.1093/eurheartj/ehu207
55. Mazzola R, Ricchetti F, Fiorentino A, Fersino S, Giaj Levra N, Naccarato S, et al. Dose-volume-related dysphagia after constrictor muscles definition in head and neck cancer intensity-modulated radiation treatment. Br J Radiol. (2014) 87:20140543. doi: 10.1259/bjr.20140543
56. Penniment MG, De Ieso PB, Harvey JA, Stephens S, Au H-J, O’Callaghan CJ, et al. Palliative chemoradiotherapy versus radiotherapy alone for dysphagia in advanced oesophageal cancer: a multicentre randomised controlled trial (TROG 03.01). Lancet Gastroenterol Hepatol. (2018) 3:114–24. doi: 10.1016/S2468-1253(17)30363-1
57. Mazzola R, Ricchetti F, Fersino S, Fiorentino A, Giaj Levra N, Di Paola G, et al. Predictors of mucositis in oropharyngeal and oral cavity cancer in patients treated with volumetric modulated radiation treatment: A dose-volume analysis. Head Neck. (2016) 38 Suppl 1:E815–819. doi: 10.1002/hed.24106
58. Sanguineti G, Rao N, Gunn B, Ricchetti F, Fiorino C. Predictors of PEG dependence after IMRT ± chemotherapy for oropharyngeal cancer. Radiother Oncol J Eur Soc Ther Radiol Oncol. (2013) 107:300–4. doi: 10.1016/j.radonc.2013.05.021
59. Okuni I, Otsubo Y, Ebihara S. Molecular and neural mechanism of dysphagia due to cancer. Int J Mol Sci. (2021) 22:7033. doi: 10.3390/ijms22137033
60. Charters E, Bogaardt H, Clark J, Milross C, Freeman-Sanderson A, Ballard K, et al. Functional swallowing outcomes related to radiation exposure to dysphagia and aspiration-related structures in patients with head and neck cancer undergoing definitive and postoperative intensity-modulated radiotherapy. Head Neck. (2022) 44:399–411. doi: 10.1002/hed.26936
61. O’Donovan A, Morris L. Palliative radiation therapy in older adults with cancer: age-related considerations. Clin Oncol. (2020) 32:766–74. doi: 10.1016/j.clon.2020.06.011
62. Horvat N, Carlos Tavares Rocha C, Clemente Oliveira B, Petkovska I, Gollub MJ. MRI of rectal cancer: tumor staging, imaging techniques, and management. RadioGraphics. (2019) 39:367–87. doi: 10.1148/rg.2019180114
63. Hutchison AR, Wishart LR, Brown B, Ward EC, Hargrave C, Brown E, et al. Exploring the interplay between radiotherapy dose and physiological changes in the swallowing mechanism in patients undergoing (Chemo)radiotherapy for oropharynx cancer. Dysphagia. (2022) 37:567–77. doi: 10.1007/s00455-021-10307-2
Keywords: dysphagia, head and neck cancer, radiotherapy, predictive models, meta-analysis
Citation: Pu Y, Yang J, Shui L, Tang Q, Zhang X and Liu G (2025) Risk prediction models for dysphagia after radiotherapy among patients with head and neck cancer: a systematic review and meta-analysis. Front. Oncol. 15:1502404. doi: 10.3389/fonc.2025.1502404
Received: 26 September 2024; Accepted: 20 January 2025;
Published: 07 February 2025.
Edited by:
Giuseppe Carlo Iorio, University of Turin, ItalyReviewed by:
Ciprian Camil Mirestean, University of Medicine and Pharmacy of Craiova, RomaniaFrancesco Ricchetti, Sacro Cuore Don Calabria Hospital (IRCCS), Italy
Copyright © 2025 Pu, Yang, Shui, Tang, Zhang and Liu. This is an open-access article distributed under the terms of the Creative Commons Attribution License (CC BY). The use, distribution or reproduction in other forums is permitted, provided the original author(s) and the copyright owner(s) are credited and that the original publication in this journal is cited, in accordance with accepted academic practice. No use, distribution or reproduction is permitted which does not comply with these terms.
*Correspondence: Xianqin Zhang, c2Nsenp4cUBob3RtYWlsLmNvbQ==; Guangguo Liu, NDUwMjQ0ODE0QHFxLmNvbQ==
†These authors have contributed equally to this work
‡ORCID: You Pu, orcid.org/0000-0001-7207-5632