 Weili Ma
 Chuanling Hou2
 Minxia Yang
 Yuguo Wei
 Jiwei Mao
 Zhenhua Zhao
- 1Department of Radiology, Shaoxing People’s Hospital, Key Laboratory of Functional Molecular Imaging of Tumor and Interventional Diagnosis and Treatment of Shaoxing City, Shaoxing, China
- 2Department of Pathology, Shaoxing People’s Hospital, Shaoxing, China
- 3Advanced Analytics, Global Medical Service, GE Healthcare, Hangzhou, China
- 4Department of Radiotherapy, Shaoxing People’s Hospital, Shaoxing, China
Objectives: This study aimed to develop and evaluate multiple machine learning models utilizing contrast-enhanced T1-weighted imaging (T1-CE) to differentiate between low-/high-infiltration of total T lymphocytes (CD3) in patients with rectal cancer.
Methods: We retrospectively selected 157 patients (103 men, 54 women) with pathologically confirmed rectal cancer diagnosed between March 2015 and October 2019. The cohort was randomly divided into a training dataset (n=109) and a test dataset (n=48) for subsequent analysis. Seven radiomic features were selected to generate three models: logistic regression (LR), random forest (RF), and support vector machine (SVM). The diagnostic performance of the three models was compared using the DeLong test. Additionally, Kaplan–Meier analysis was employed to assess disease-free survival (DFS) in patients with high and low CD3+ tumor-infiltrating lymphocyte (TIL) density.
Results: The three radiomics models performed well in predicting the infiltration of CD3+ TILS, with area under the curve (AUC) values of 0.871, 0.982, and 0.913, respectively, in the training set for the LR, RF, and SVM models. In the validation set, the corresponding AUC values were 0.869, 0.794, and 0.837, respectively. Among the radiomics models, the LR model exhibited superior diagnostic performance and robustness. The merged model, which integrated radiomics features from the SVM model and clinical features from the clinical model, outperformed the individual radiomics models, with AUCs of 0.8932 and 0.8829 in the training and test cohorts, respectively. Additionally, a lower expression level of CD3+ TILs in the cohort was independently correlated with DFS (P = 0.0041).
Conclusion: The combined model demonstrated a better discriminatory ability in assessing the abundance of CD3+ TILs in rectal cancer. Furthermore, the expression of CD3+ TILs was significantly correlated with DFS, highlighting its potential prognostic value.
Advances in knowledge: This study is the first attempt to compare the predictive TILs performance of three machine learning models, LR, RF, and SVM, based on the combination of radiomics and immunohistochemistry. The MRI-based combined model, composed of radiomics features from the SVM model and clinical features from the clinical model, exhibited better discriminatory capability for the expression of CD3+ TILs in rectal cancer.
Introduction
Colorectal cancer remains one of the most common causes of cancer-related mortality worldwide (1, 2). The prognosis of the disease is largely determined by the stage at which it is diagnosed (3). Early detection and appropriate treatment are critical in improving patient outcomes. In recent years, the increasing adoption of immunotherapy, particularly immune checkpoint inhibitors (ICIs), has shown promise in clinical practice, with several landmark trials demonstrating significant therapeutic efficacy, This has opened the possibility of innovative treatment strategies that can modulate immune responses to better target cancer cells (4, 5). Among these, tumor-infiltrating lymphocytes (TILs) have emerged as a potential predictive biomarker for treatment response, including neoadjuvant therapy in locally advanced rectal cancer (6–9).
High levels of TILs, which are located in the tumor microenvironment, have been associated with improved immune responses and better treatment outcomes in various cancers (10). For example, studies have demonstrated that higher levels of TILs correlate with better responses to neoadjuvant chemotherapy in breast cancer, particularly in HER2-positive cases (5, 11). However, despite advances in treatment, up to 30% of patients with rectal cancer still experience poor prognosis, including distant metastasis or local recurrence, often occurring within a few years of treatment. These findings highlight the need for more effective patient assessment methods to identify individuals who are most likely to benefit from immunotherapy and to optimize treatment outcomes.
Recent research has increasingly focused on the relationship between radiomics and tumor TIL levels, especially CD8, with studies exploring this association in breast cancer (12), rectal cancer after chemoradiation (13), and pancreatic cancer (14). In particular, Huang et al. demonstrated that texture features extracted from dynamic contrast-enhanced magnetic resonance imaging (DCE-MRI) are correlated with CD8+ and CD4+ T lymphocytes, providing insights into the immune microenvironment’s histopathological features in advanced gastric cancer (15). Despite the progress in immunotherapy, the potential correlation between imaging data and the immune microenvironment in cancer remains an area that is only partially understood (16).
Given the importance of TILs in predicting treatment response and prognosis, we hypothesized that radiomics could be used to predict the abundance of CD3+ TILs in rectal cancer. The primary objective of our research was to develop accurate risk stratification models to differentiate between a low- and high-abundance of CD3+ TILs in rectal cancer, which could ultimately aid in better treatment decision-making and personalized therapeutic strategies.
Materials and methods
Patient selection
Our research has been approved by the ethics committee. The data of patients diagnosed with rectal cancer, who underwent surgical resection between March 2015 to October 2019, were retrospectively collected for the construction of the radiomics model. We included patients who met the following criteria: (a) underwent surgical resection and (b) preoperative T1-weighted imaging (T1-CE) performed within 3 weeks. Exclusion criteria were (a) incomplete clinical data; (b) incomplete pathology report; and (c) tumor-related treatment before MRI examination. The final cohort consisted of 157 patients, who were randomly divided into a training set of 109 patients and a test set of 48 patients.
MRI examination
The rectal MRI imaging was performed using a 3T unit (Verio, Siemens, Germany) equipped with a 12-channel body coil. The examinations included T1-CE, high-resolution axial T2-weighted imaging, and diffusion-weighted imaging (DWI). Detailed information on the standardized imaging protocols is provided in Supplementary Material.
Pathology
All wax block samples were sectioned into 2 μm thick slices by professional technicians. The slices were then placed in an oven at 56°C overnight. CD3 antibody (ZM-0417, Zhongshan Jinqiao, Beijing, China) was reserved at 1:200. Bond ™ Polymer Refine Detection immunoassay kit (DS9800, Leica Biosystems, United Kingdom). The entire immunohistochemistry (IHC) process was carried out using the BOND-MAX Fully Automated IHC and ISH Staining System. Finally, all sections were dehydrated, coverslipped, and embedded in neutral resin. Two senior pathologists independently reviewed all IHC slides and randomly selected five High Power Field (HPFs) to evaluate the expression of CD3+ TILs, based on the percentage of positive lymphocytes in the stroma. Patients were stratified into high or low CD3+ TIL expression groups using the lower quartile as the threshold. The assessment of TILs in rectal cancer is shown in Figure 1.
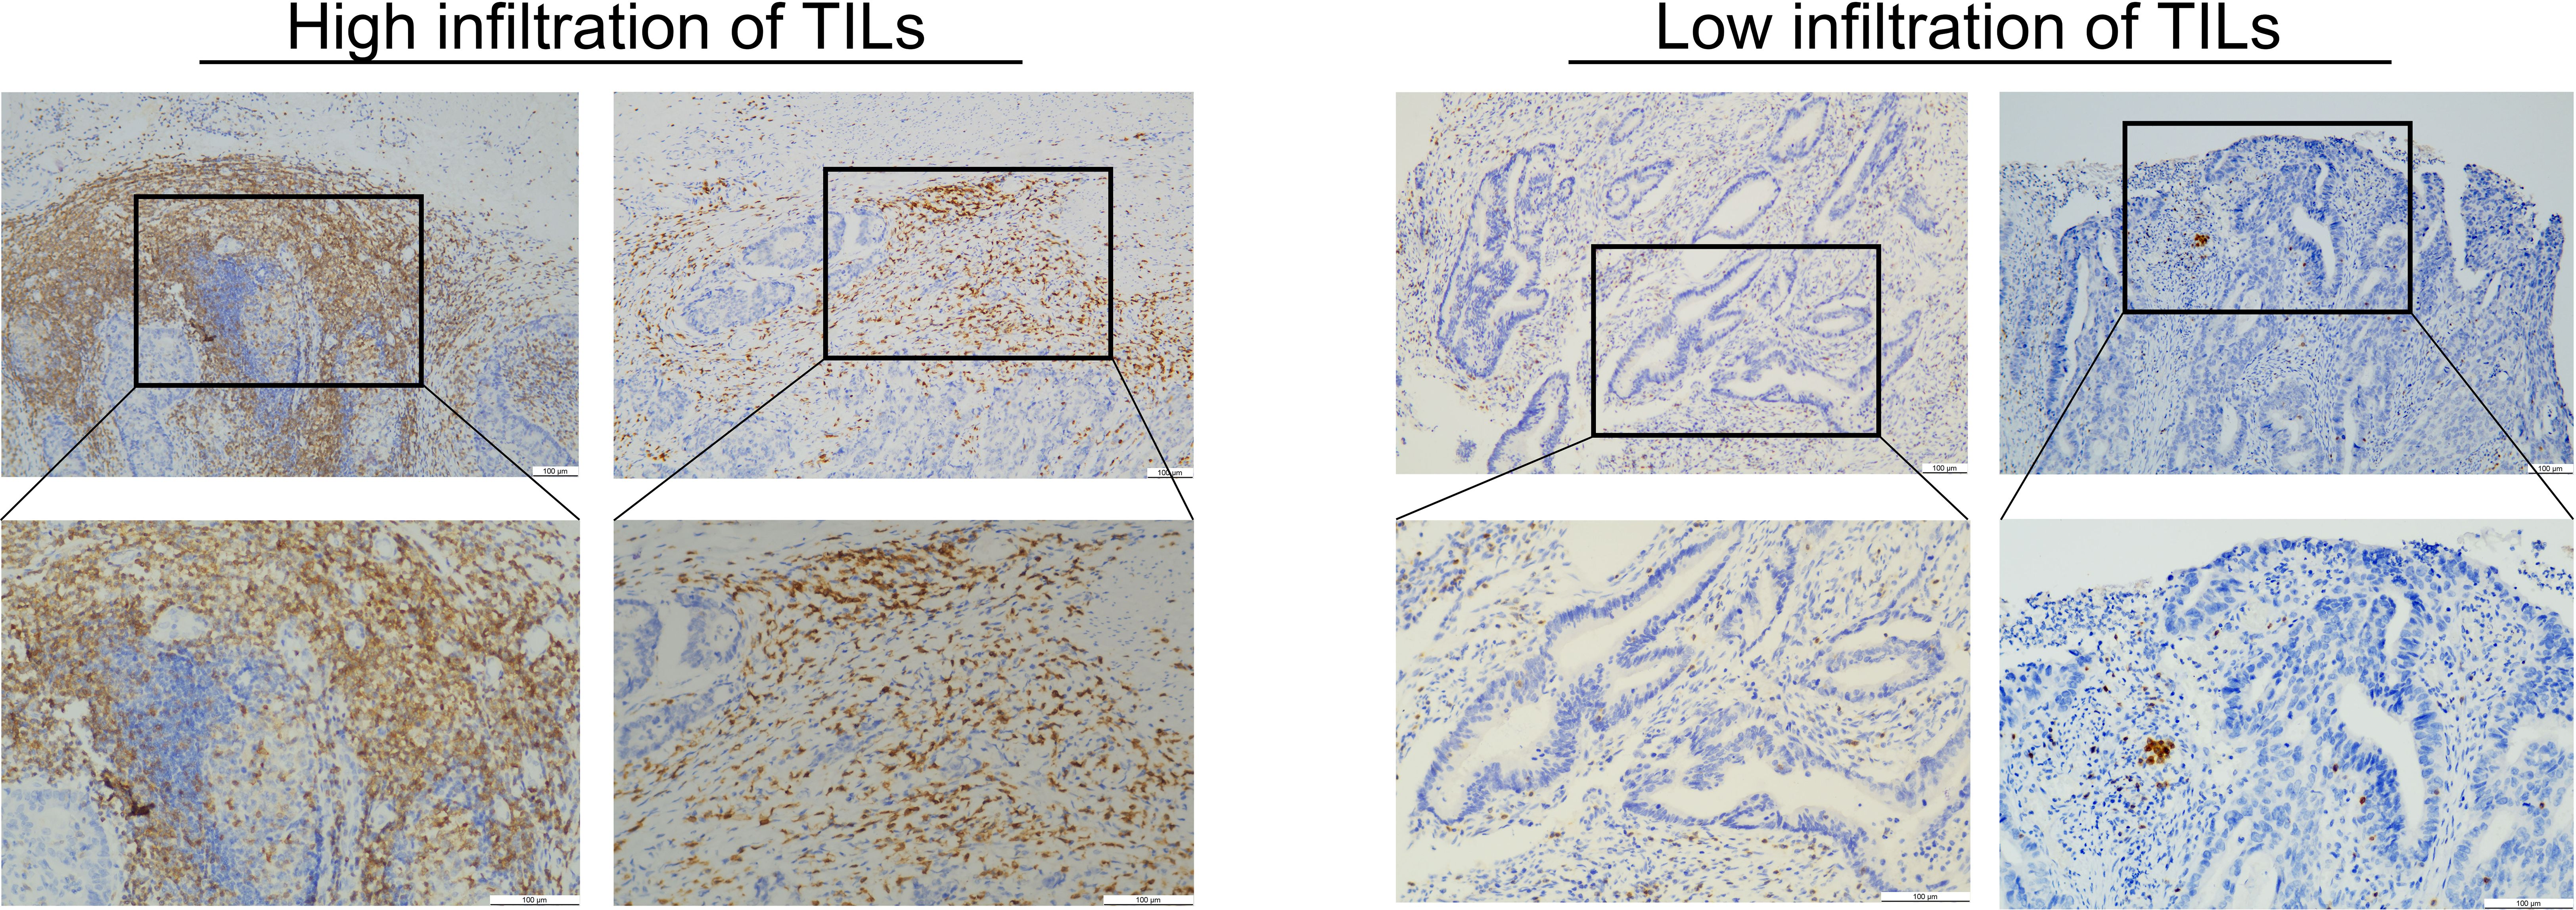
Figure 1. This image shows the evaluation of the TILs for rectal cancer. The left image shows high TIL infiltration. The right image shows low TIL infiltration.
Tumor segmentation and feature extraction
The regions of interest (ROIs) of 157 lesions were segmented using ITK-SNAP (www.itksnap.org), an open-source software, on each CE-T1WI slice. Two radiologists, each with 3 years of experience in MRI, manually delineated the entire area within the rectal wall, covering the entire tumor and excluding necrotic tissue and bleeding (Figure 2). Clinical and histopathological data were collected by radiologists in a blinded manner, with the exception of information regarding the diagnosis of rectal cancer.
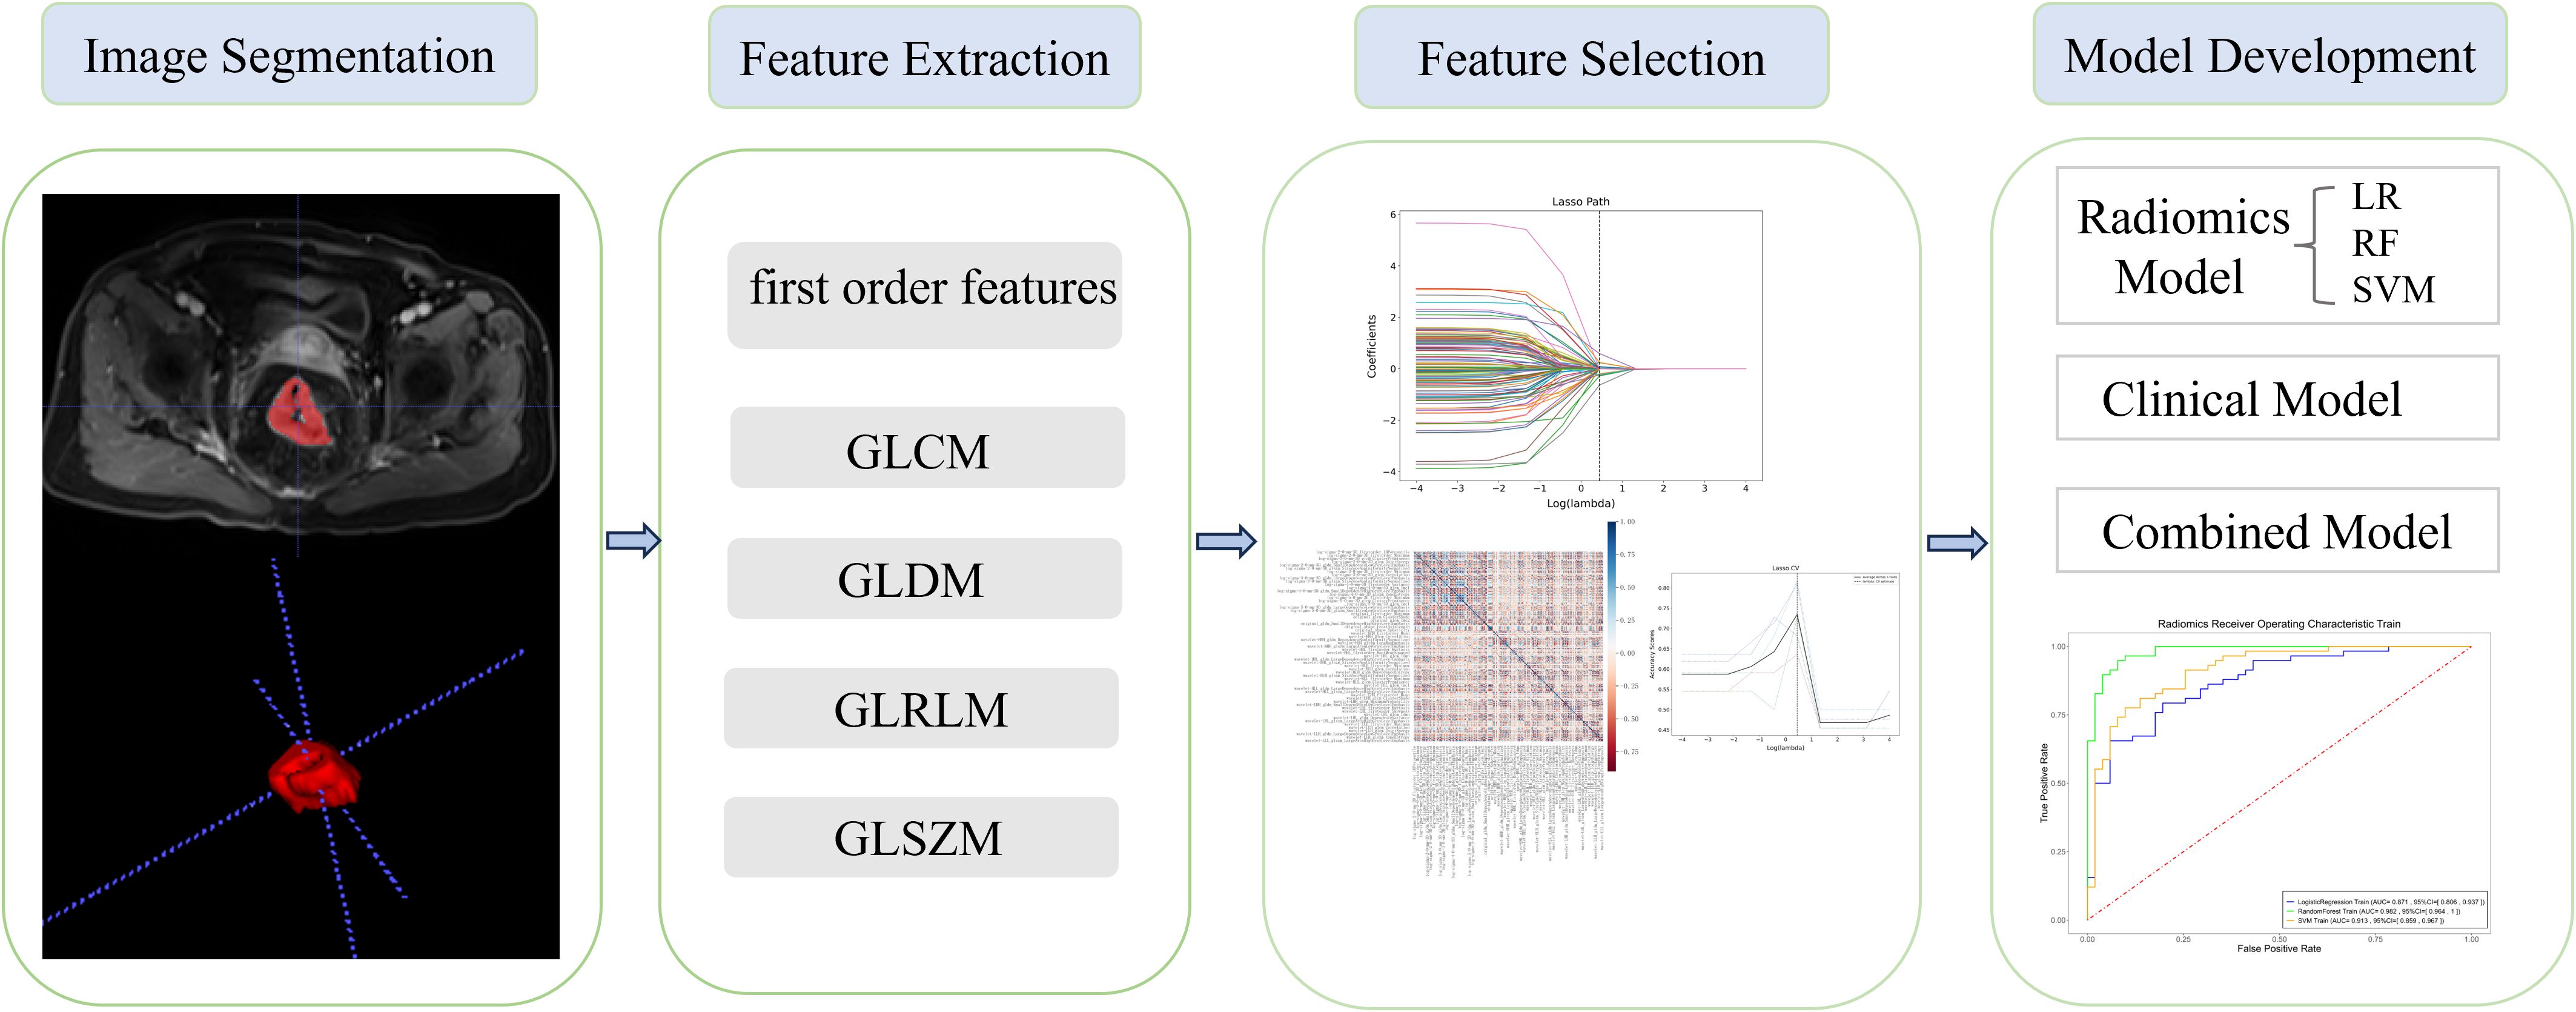
Figure 2. Outline of interest and workflow of the present study.
All radiomics features were extracted using the Pyradiomics package (http://www.PyRadiomics.readthedocs.io/en/latest/) in Python (3.8.0). A total of 1,132 radiomics features, including 234 first-order features, 286 gray level co-occurrence matrix (GLCM) features, 182 gray level dependence matrix (GLDM) features, 208 gray level run length matrix (GLRLM) features, 208 gray level size zone matrix (GLSZM) features, and 14 shape features were extracted from the original images. Before feature extraction, the MRI images were standardized using the z-score normalization method to ensure a consistent distribution of image intensities.
Radiomic feature selection and radiomics signature building
Only features with high interobserver reproducibility (intraclass correlation coefficient >0.75) were retained for subsequent analysis. Radiomics feature clusters with a correlation coefficient less than 0.9 (Spearman’s r<0.9) were kept to eliminate redundancy between features.
The least absolute shrinkage and selection operator (LASSO) method with fivefold cross-validation was then employed to identify the most predictive features from the training set. A radiomics score for each patient was calculated based on the linear combination of the selected imaging features.
Three radiomics models [logistic regression (LR), random forest (RF), and support vector machine (SVM)] and one clinical model were developed for predicting CD3+ TILs. Consequently, four integrated models were generated by combining the clinical model and the radiomics models.
Statistical analyses
Statistical analyses were performed using R (version 3.5.3; http://www.r-project.org). Datasets with a normal distribution were summarized using the mean and standard deviation, while categorical variables were presented using medians and ranges. Spearman’s correlation was used to assess the degree of correlation between features. Model discrimination was evaluated using the area under the curve (AUC). Additionally, sensitivity, specificity, positive predictive value (PPV), and negative predictive value (NPV) were calculated. The prediction performance of four radiomics models was assessed and compared using the DeLong method (17, 18). The improvement in the integrated models was evaluated by assessing the integrated differentiation improvement (19). Kaplan–Meier survival analysis was performed to evaluate disease -free survival (DFS) probabilities and differences between the high and low CD3 expression groups were compared using the log-rank test.
Results
Patient characteristics
The patients were stratified into a high-density group and a low-density group based on the lower quartile of CD3 expression (Figure 1). Of the 157 patients, 73 were classified into the low-expression group and 84 into the high-expression group. No statistically significance differences were observed between the training group and the validation groups, except for gender (P=0.045). The characteristics of the included for analysis patients are detailed in Table 1.
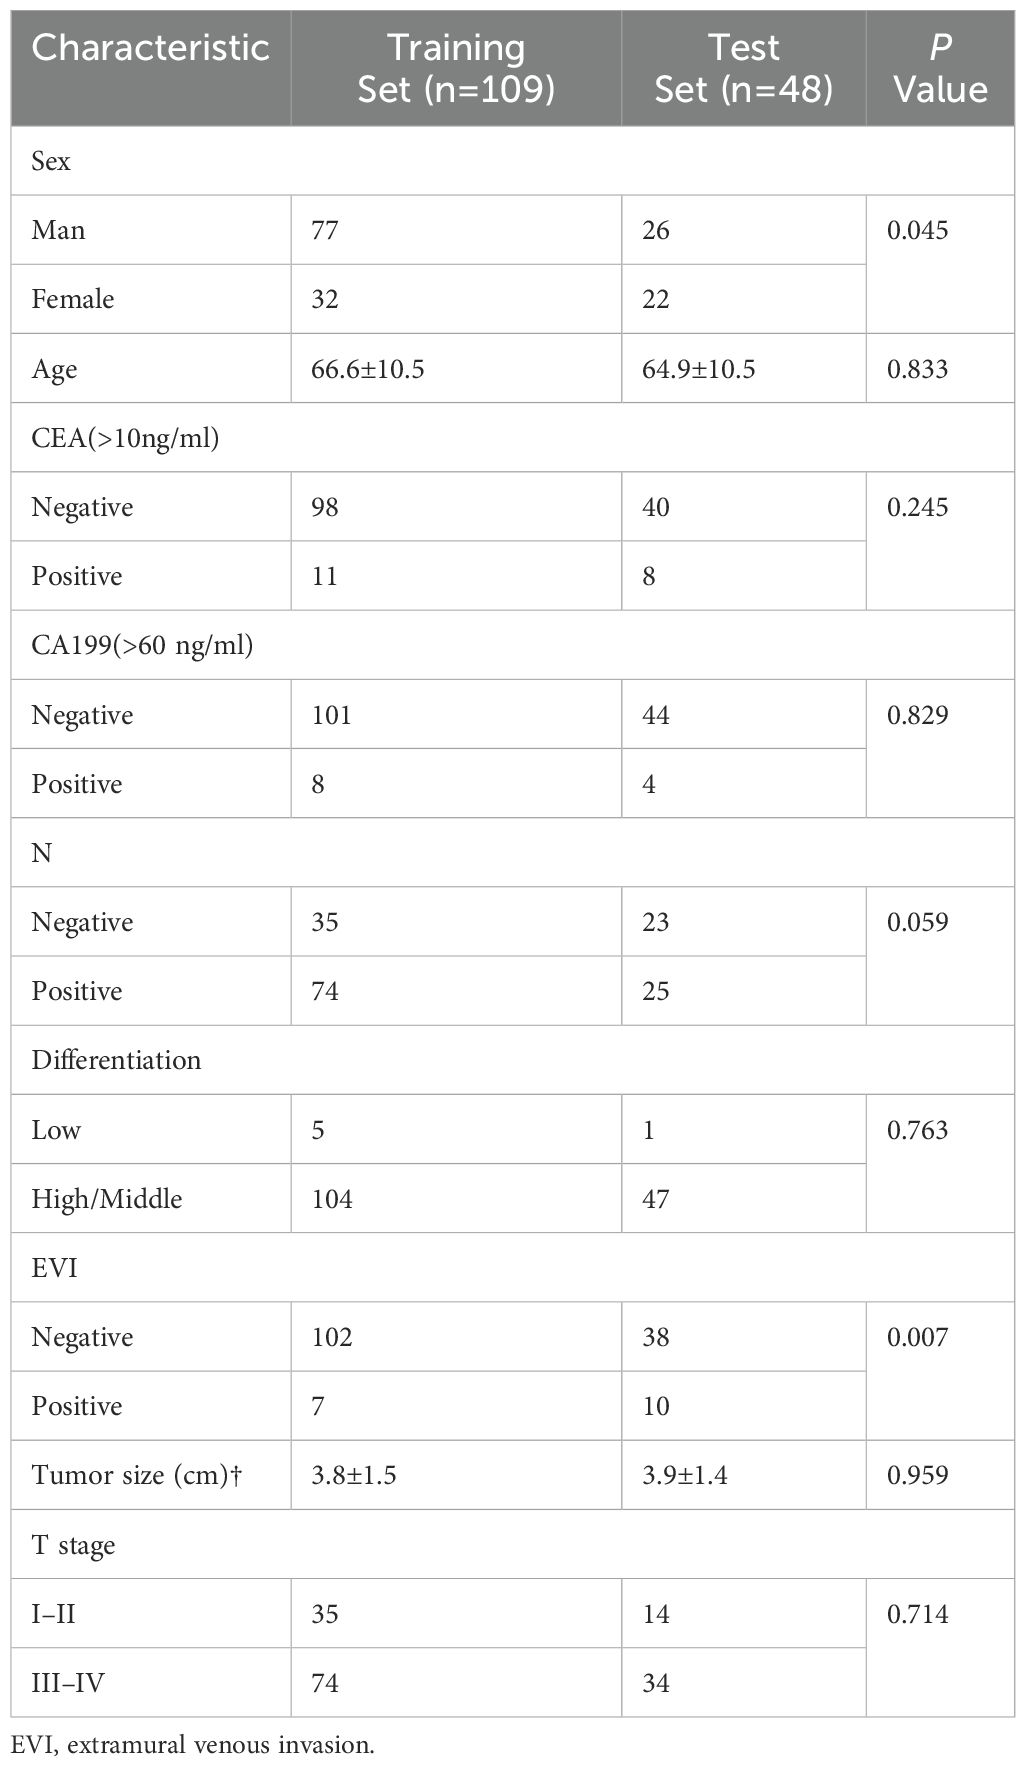
Table 1. Clinical characteristics in the training and test cohorts.
Feature selection
A total of 1,132 radiomics features were extracted from the ROIs following tumor segmentation (Figure 2). To ensure high stability and reproducibility, 292 features with an ICC >0.75 were retained from all radiomics features. Furthermore, 107 features exhibiting low correlations with the voxel value of each lesion were subjected to LASSO models to select the optimal features. Ultimately, seven radiomics features were selected to construct radiomics prediction models. Selected radiomics features and their corresponding coefficients are described in Figure 3. Among the clinical features, only the N stage feature was retained. The combined model was developed using the seven radiomics features and one clinical feature. The retained features of the screening process are shown in the Supplementary Material.
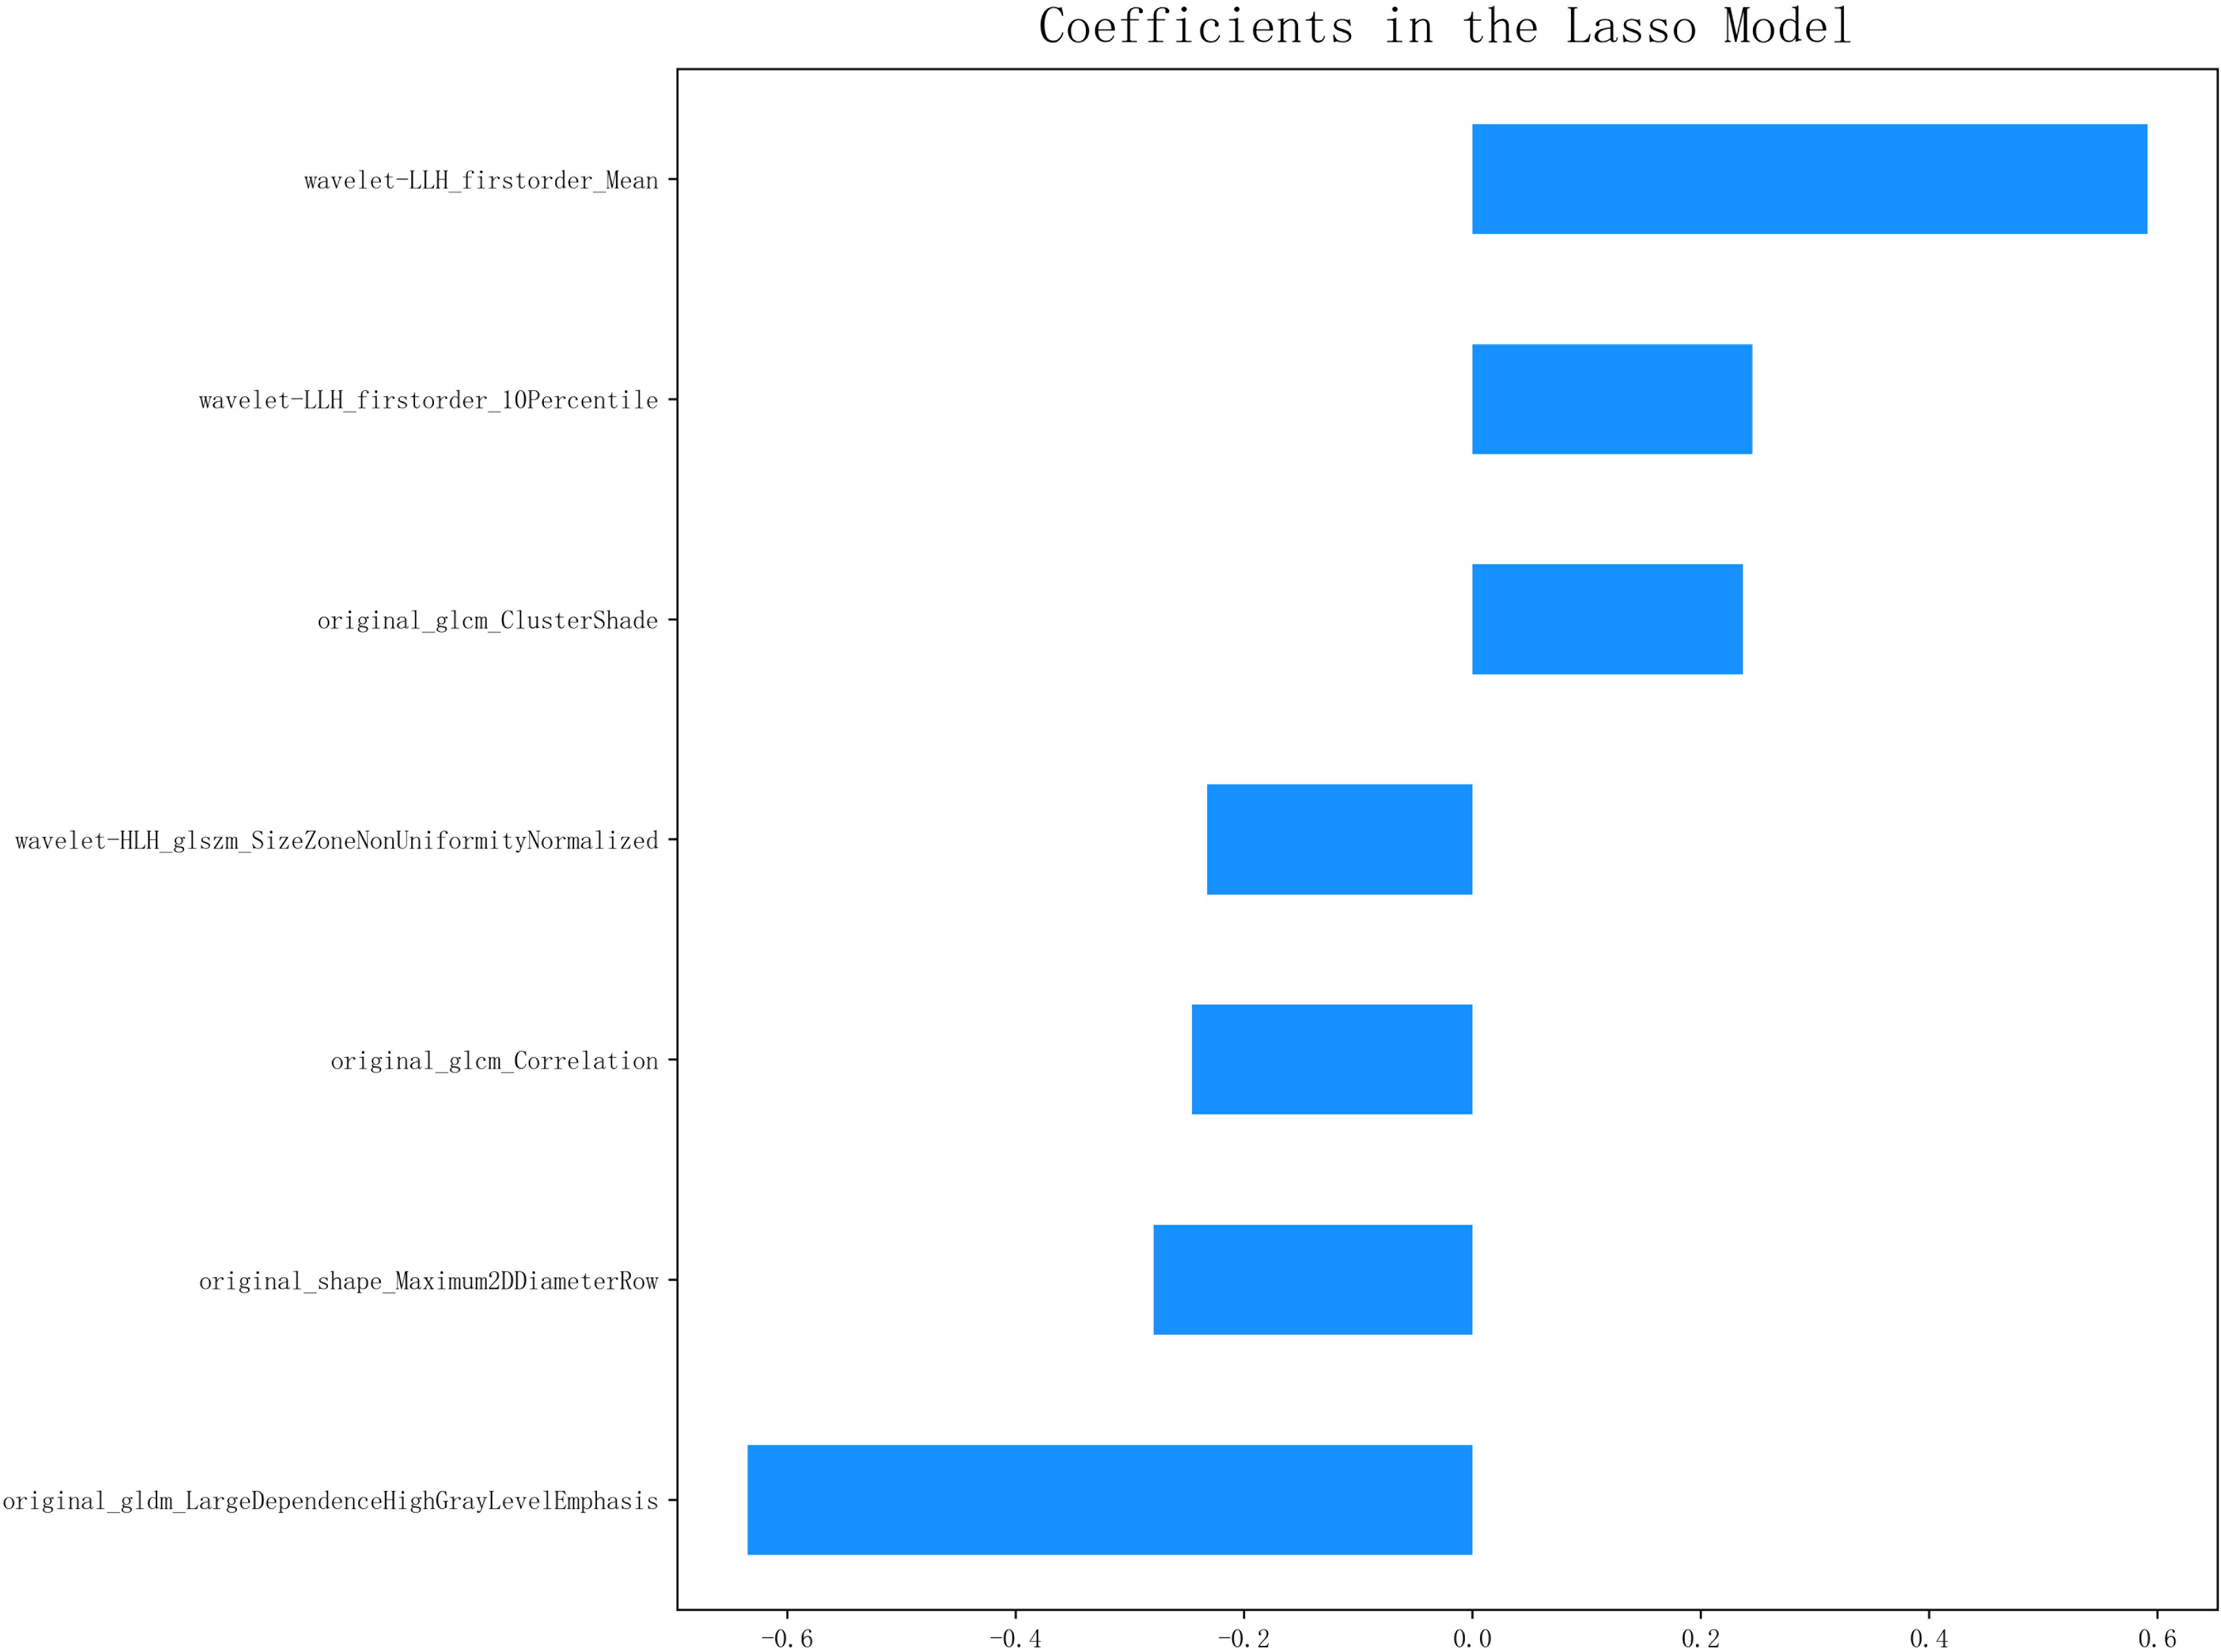
Figure 3. The selected radiomics features and their corresponding coefficients.
Performance of the clinical and radiomics models
Among the radiomics models, the RF radiomics model achieved the highest AUC value of 0.982 [95% confidence interval (CI): 0.964, 1] in the training set, and the LR radiomics model achieved the highest AUC value of 0.869 (95% CI:0.768, 0.97) in the validation set (Figure 4). Table 2 shows the detailed prediction performance of various radiomics models. For the clinical model, the AUC, sensitivity, and specificity in the training set were 0.7679 (95% CI: 0.688, 0.848), 0.8103 and 0.7255, respectively. In the test set, these values were 0.6486 (95% CI:0.511, 0.786), 0.6154, and 0.6818, respectively. The combined model, which integrated the SVM model and clinical model, achieved the highest discriminatory ability (AUC, training cohort: 0.8932; test cohort: 0.8829) and robustness for expression of CD3+ TILs in rectal cancer (Figure 5).
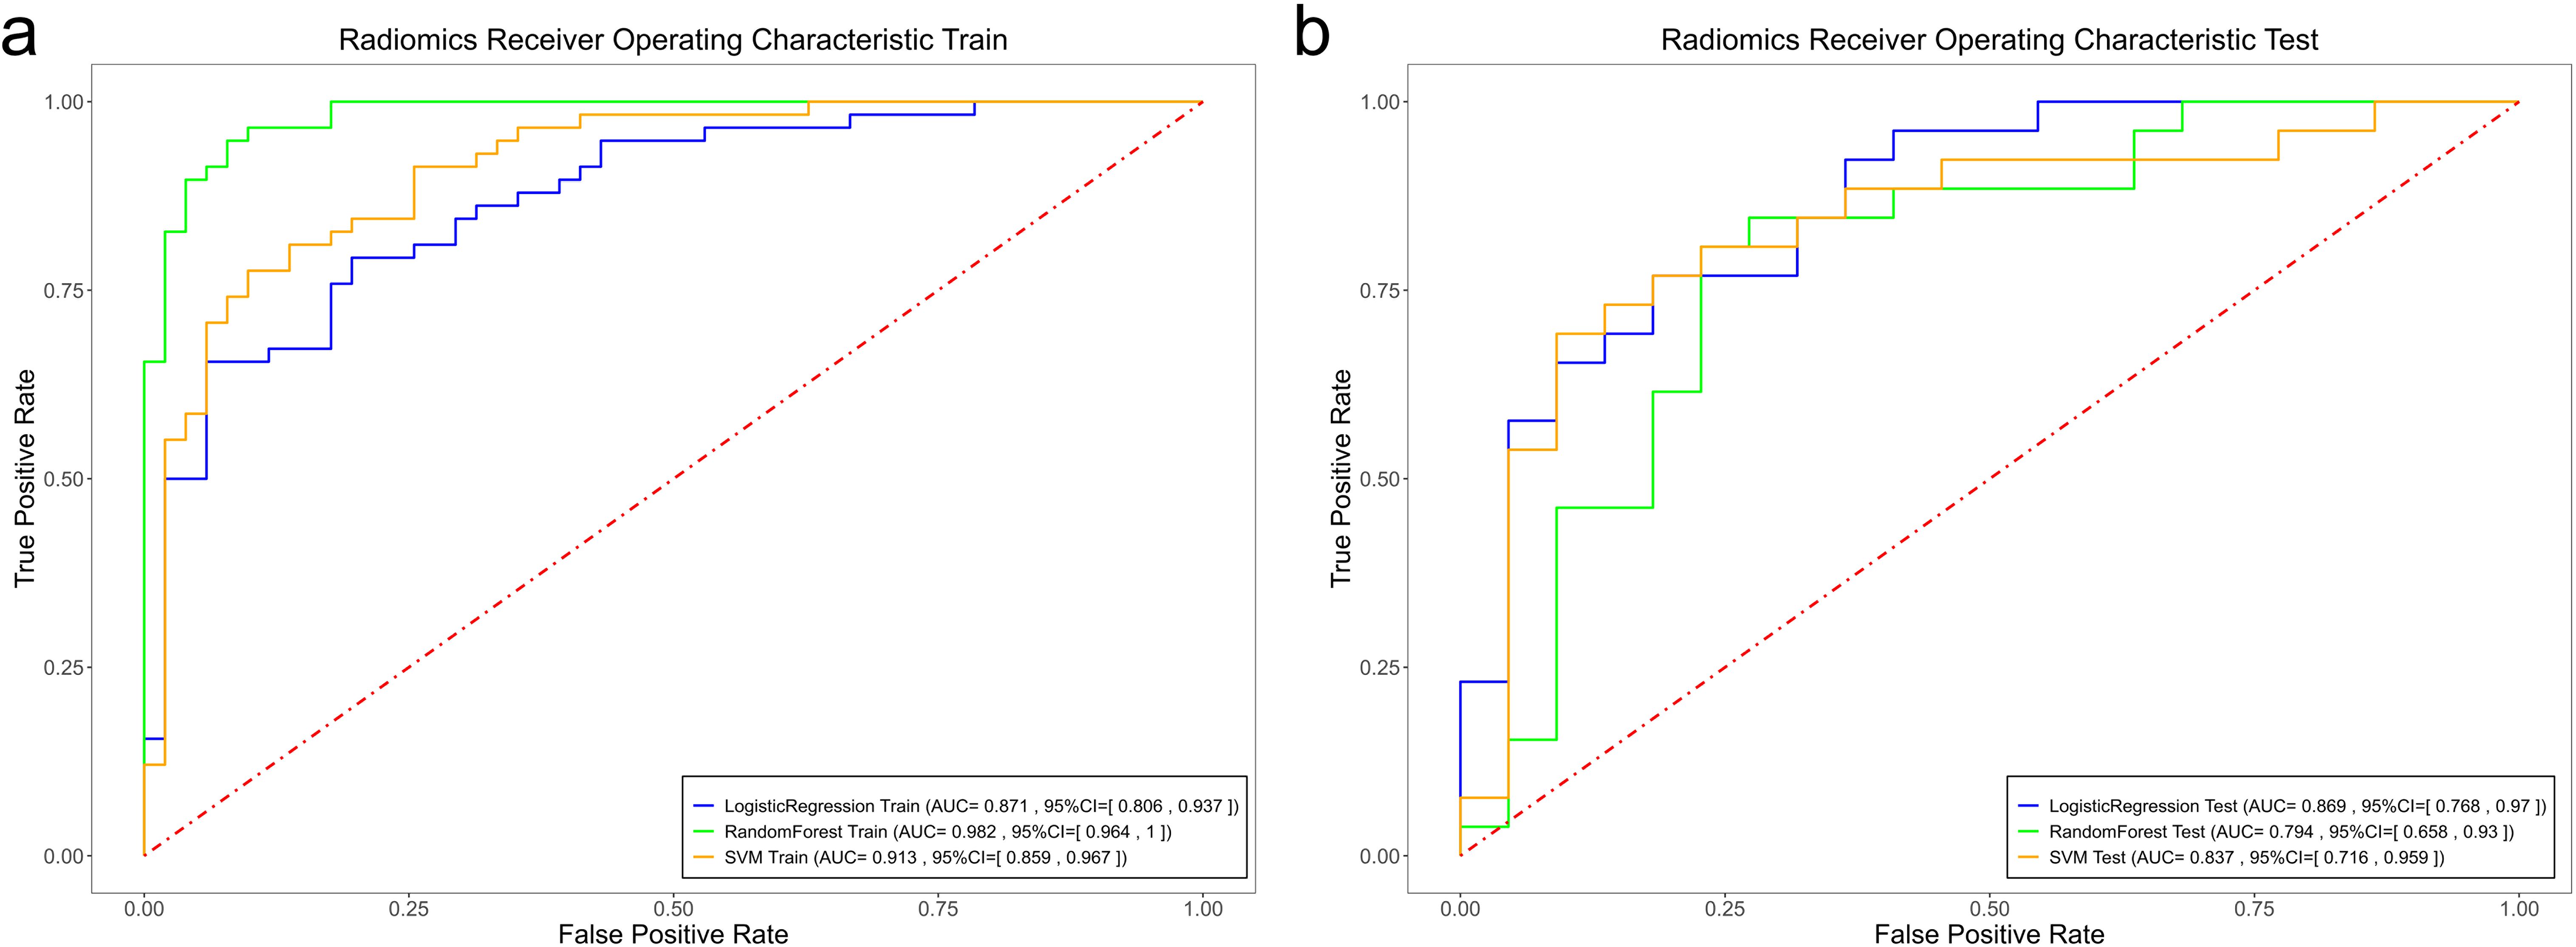
Figure 4. Comparison of the ROC curves of the support vector machine (SVM), random forest (RF), and logistic regression (LR) models in the training set (a) and the validation set (b).
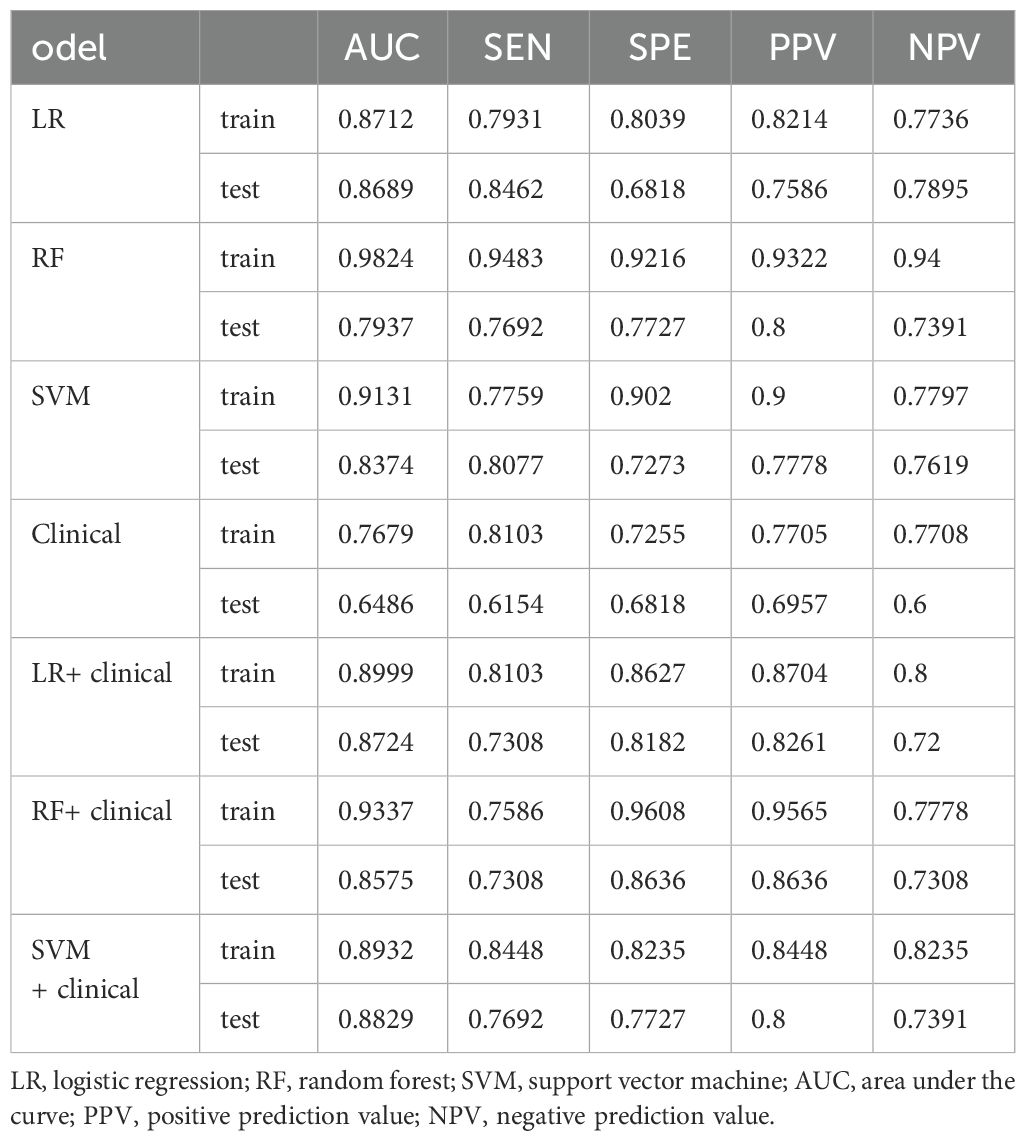
Table 2. Performance models for predicting CD3+ TILs in rectal cancer.
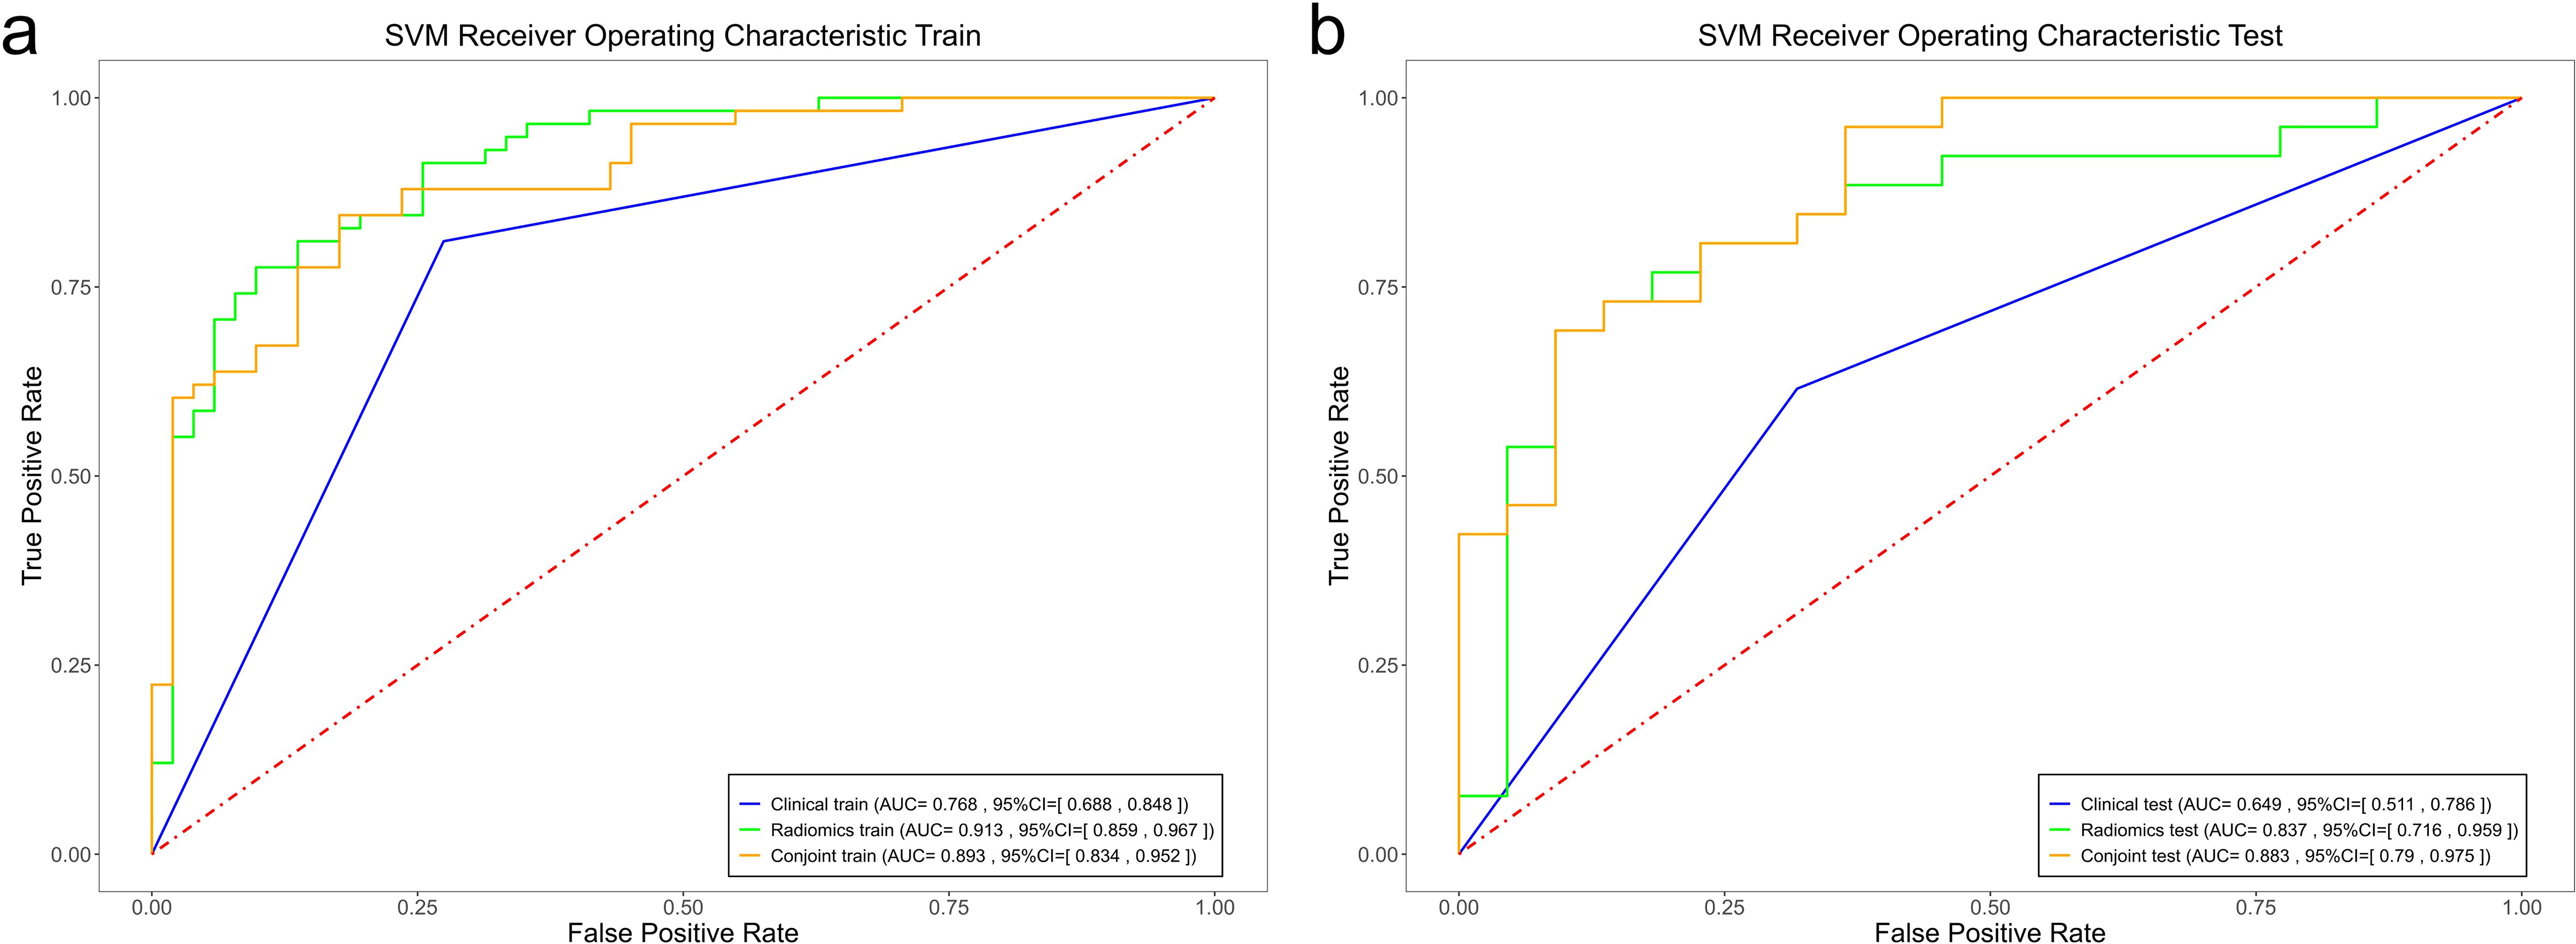
Figure 5. Comparison of the ROC curves of the support vector machine (SVM), random forest (RF), and logistic regression (LR) models in the training set (a) and the validation set (b).
Performance comparison
However, no significant differences (P >0.05) in AUC were observed among the four radiomics models. For the f LR and clinical combination model, both the training and validation groups showed a slight improvement in AUC (0.0287, 0.0035) (Table 2). In the combinations of SVM and RF with the clinical model, the validation group demonstrated an improvement in AUC (0.9824 vs. 0.9337 and 0.9131 vs. 0.8932), whereas the training group did not show similar improvements (0.8557 vs. 0.7937 and 0.8374 vs. 0.8829).
Predictive value of CD3 for individual DFS
Significant differences in DFS were observed between the high and low CD3 expression groups (P=0.0041). The Kaplan–Meier survival analysis of DFS according to CD3 expression is shown in Figure 6.
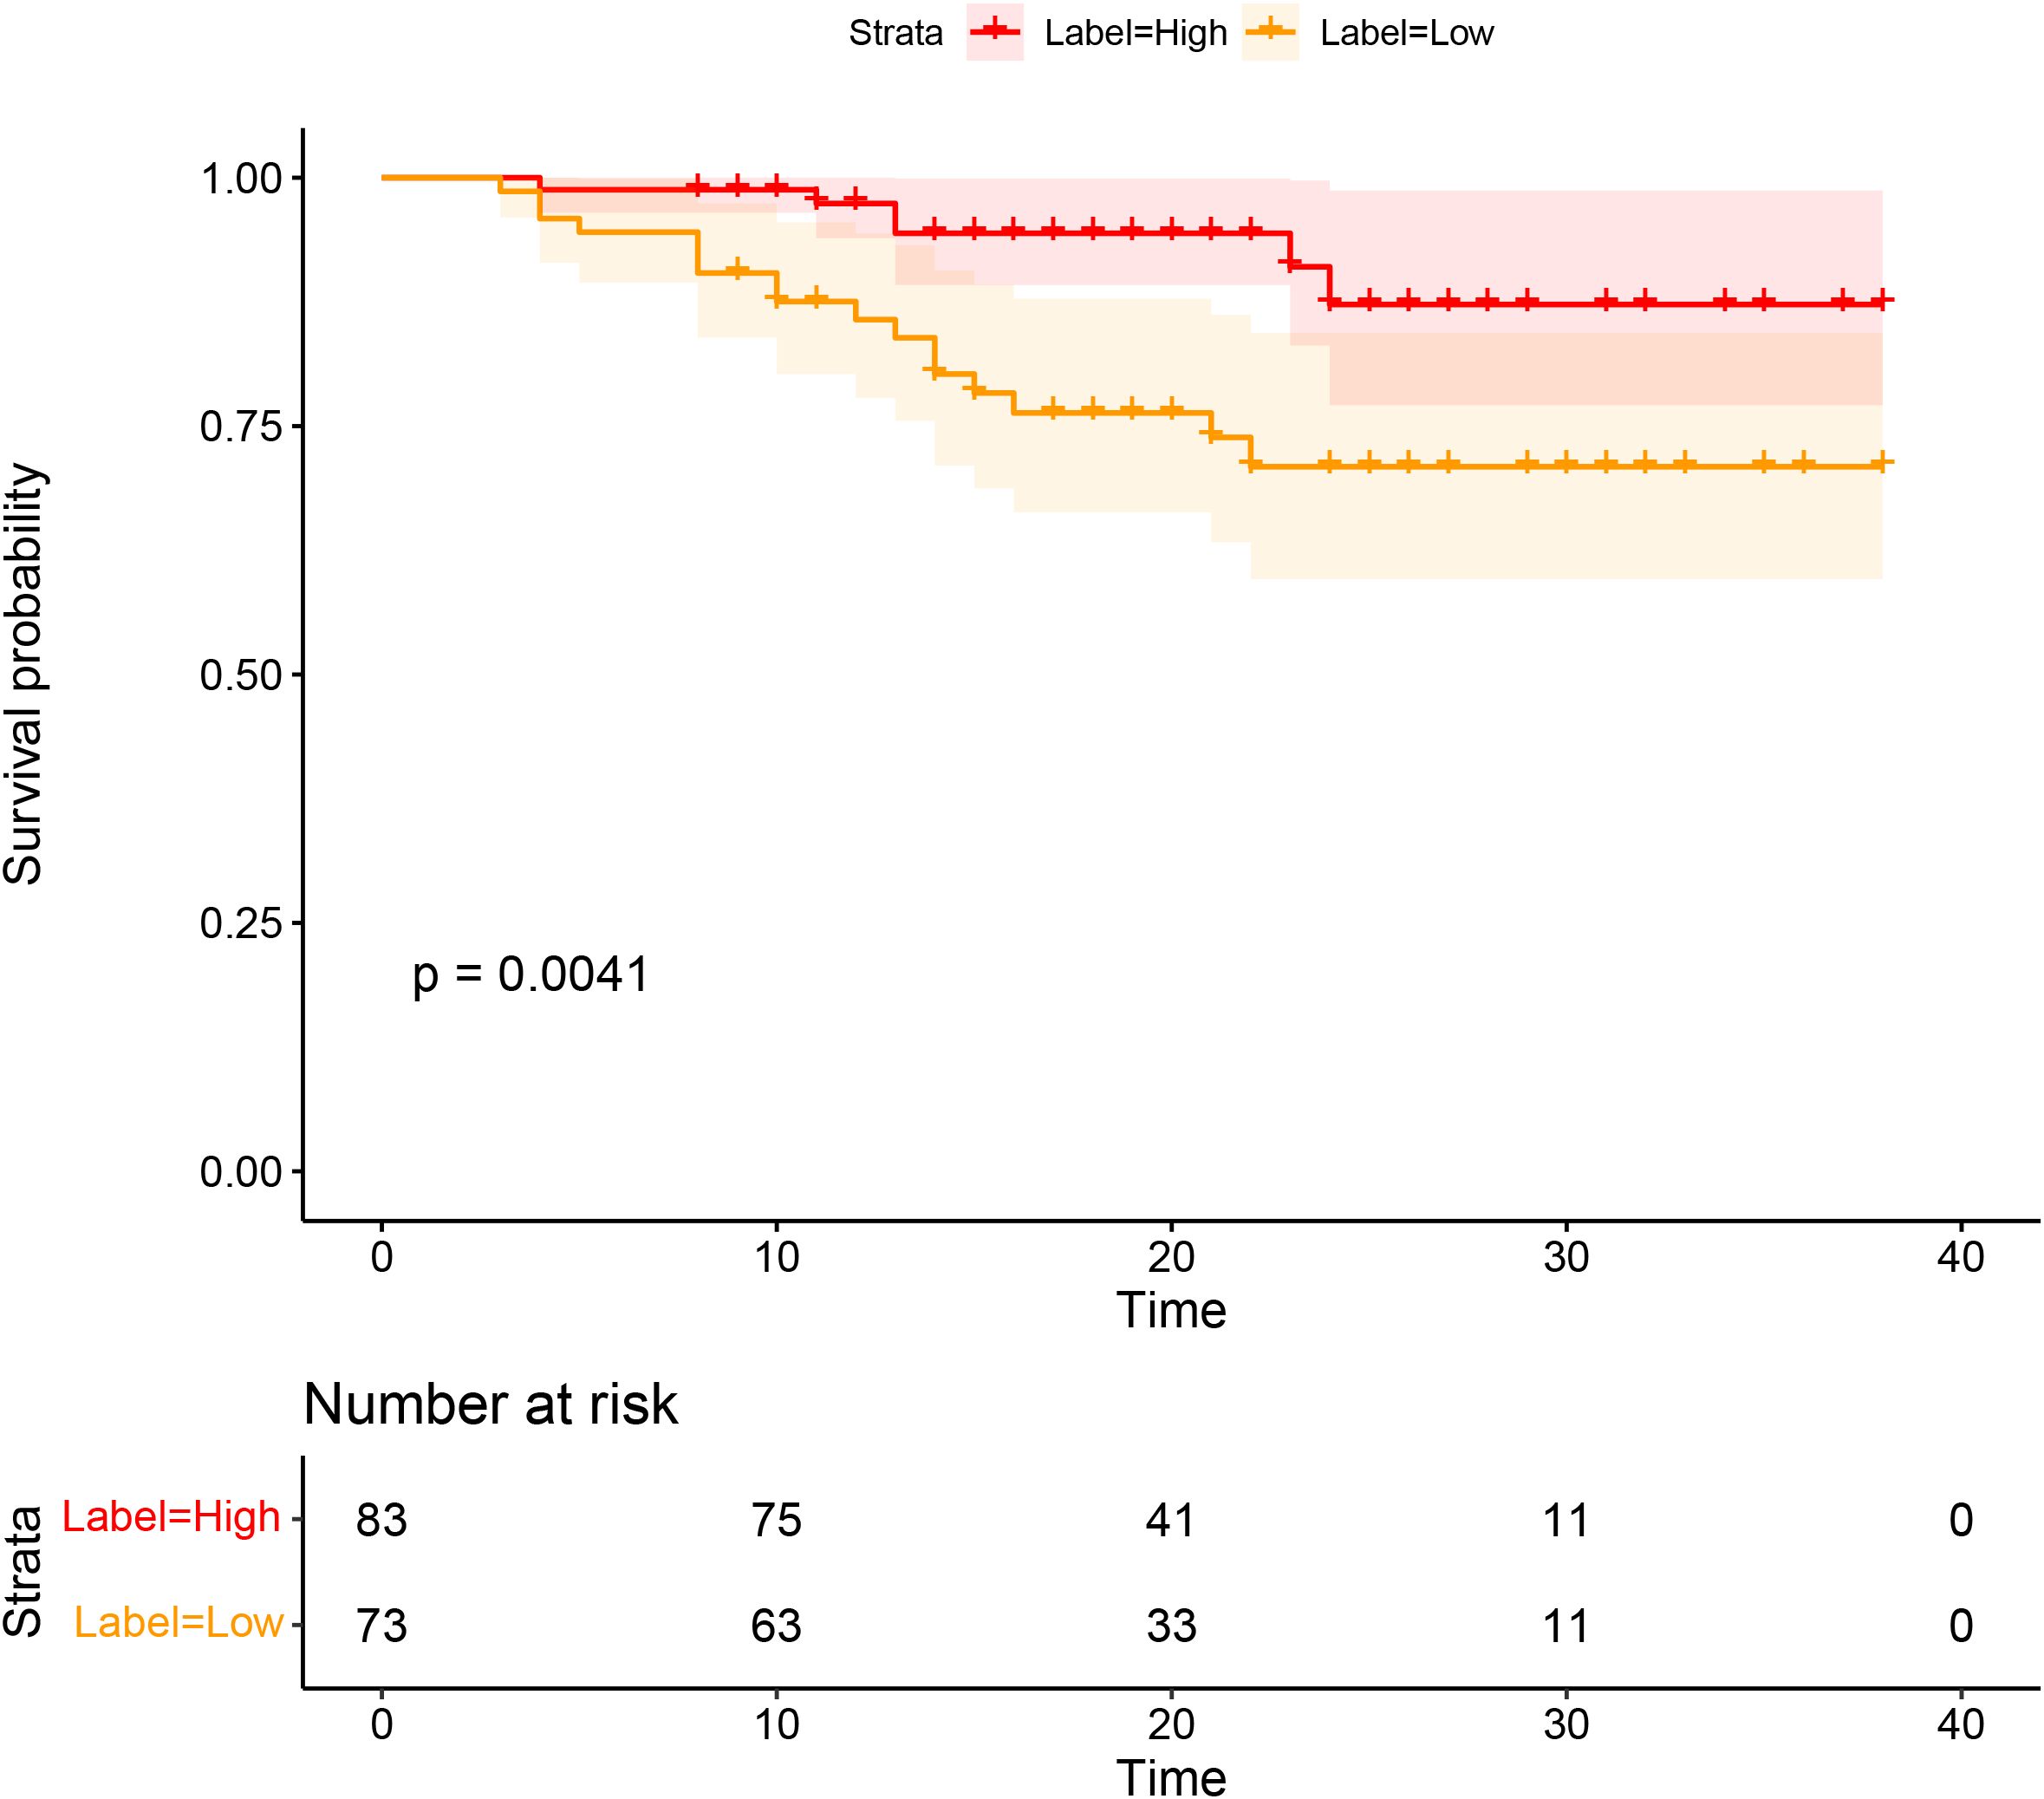
Figure 6. Survival analyses based on rectal cancer disease-free survival (DFS) according to CD3 infiltration.
Discussion
In this primary study, we developed and validated radiomics prediction models and integrated models that combined clinical factors with radiomics features to predict CD3+ TILs in rectal cancer using preoperative T1-CE. Although several efforts have been made in various cancers to associate radiomics features with immunohistochemical features to predict TIL levels, to the best of our knowledge, this study is the first to integrate both immunohistochemical and radiomics features for TIL prediction in rectal cancer. This primary research demonstrates that radiomics models, especially the LR model, exhibited the highest predictive performance. However, no significant statistical differences were observed between the three radiomics model. Notably, the combined model composed of SVM and the clinical model showed the highest discriminative capability (AUC, training cohort: 0.8932; test cohort: 0.8829) and robustness for the expression of CD3+ TILs in rectal cancer. In line with our results, Zheng et al. (20) reported that a combined model using SVM and a clinical model exhibited the highest differentiating value (with AUC 0.904 in the training cohort and 0.854 in the validation cohort) compared to the clinical and other radiomics models. Additionally, only the LR model combined with the clinical model improved the AUC value in both the training and validation groups. This analysis suggests that the clinical feature was of limited value in improving the model.
In recent years, immunotherapy and immune checkpoint blockade (ICB) for the treatment of breast cancer patients have raised concerns in clinical practice (21). Tumor-infiltrating immune cells play a crucial role in this response, and TILs make up the majority of these immune cells (22). It is now known that the success of immunotherapy requires pre-existing anti-tumor immunity, which can reflect an individual’s immune tumor response and has strong prognostic and predictive significance. The number of TILs may be a significant predictor of the response to cytotoxic treatments such as chemotherapy and radiotherapy and is assumed to be associated with the mechanisms regulating cancer growth, progression, and metastasis (23, 24). Lujiao et al. (25) used computed tomography (CT) to predict non-small cell lung cancer CD3+ and CD8+ TIL levels and developed a classifier with AUCs of 0.94 and 0.87 in the validation sets, respectively. Huang et al. (15) discovered that texture features extracted from DCE-MRI are correlated with CD8+ and CD4+ T lymphocytes in advanced gastric cancer, with diagnostic efficiencies of 0.863 and 0.856, respectively. The above results are generally consistent with our findings. Yun et al. (26) reported that an XGBoost-based radiomics model can effectively predict TILs in pancreatic ductal adenocarcinoma, with AUCs of 0.93 and 0.79 in the training and validation sets, respectively. Regarding the prediction performance of CD3, the three models showed efficacy rates of 0.869, 0.794, and 0.837, respectively, in the validation group.
Another key focus of our investigation was the role of stromal TILs, with a particular emphasis on their spatial distribution at the invasive margin. TILs in the stromal region play a critical role in tumor growth, progression, invasion, and metastasis (27, 28). Importantly, the density of intratumoral TILs is generally much lower than that of stromal TILs, making stromal TILs a more reliable biomarker for immunotherapy prediction (5). Recent studies have also classified cancers as “hot” tumors (rich infiltration of T lymphocytes) and “cold” tumors (poor infiltration of T lymphocytes) (29), which can help predict survival and treatment response (26, 30). Our findings support this discovery, as we observed that DFS was significantly associated with the expression of CD3+ TILs. Specifically, the high CD3 expression group had significantly better DFS than the low CD3 expression group. Previous studies have reported that the radiomics data from various tumor types may predict TIL density and correlate with patients’ responses to immunotherapy (31, 32). Changhee et al. (33) found that patients predicted to have a lower expression of TILs (median 4.0 months vs. 2.1 months, P=0.002) had significantly longer progression-free survival compared to those with higher predicted TIL expression (≥ median). Compared to patients with progressive disease, those who experienced an ICI response or stable disease had higher predicted TIL expression, which was the best response (P=0.001 and P=0.036, respectively). Another study (34) found that a predictive model that combines pre-treatment MRI radiological features with TIL levels can improve the accuracy of predicting pCR to NAST in patients with TNBC (P<. 001, 90.9% PPV, 81.4% NPV, and AUC 0.752). These studies found that tumor homogeneity was associated with high TIL infiltration, supporting the potential for radiomics to guide immunotherapy stratification and identify patients who may benefit from such treatments (35, 36).
Our study had several limitations. First, it was a retrospective and single-center study with a relatively small sample size. To improve the robustness of the model, further studies with a large sample size from multiple institutions are needed to ensure better robustness of the model. Second, there may be some controversy regarding the limits of manual delineation. Third, our conclusion that the radiomics model can predict the immune cells was based on circumstantial evidence, so additional validation and exploration are needed to confirm these findings.
Conclusion
In summary, a combined model that integrated SVM and a clinical feature exhibited better discriminative capability for the expression of CD3+ TILs in rectal cancer. This predictive model has the potential to provide an approach to precision medicine and may assist in the selection of candidates for immunotherapy.
Data availability statement
The original contributions presented in the study are included in the article/Supplementary Material. Further inquiries can be directed to the corresponding author.
Ethics statement
The studies involving humans were approved by Ethics Committee of Shaoxing People’s Hospital. The studies were conducted in accordance with the local legislation and institutional requirements. The human samples used in this study were acquired from a by-product of routine care or industry. Written informed consent for participation was not required from the participants or the participants’ legal guardians/next of kin in accordance with the national legislation and institutional requirements. Written informed consent was obtained from the individual(s) for the publication of any potentially identifiable images or data included in this article.
Author contributions
WM: Writing – original draft. CH: Data curation, Writing – original draft. MY: Data curation, Software, Writing – original draft. YW: Investigation, Software, Writing – original draft. JM: Investigation, Writing – original draft. LG: Validation, Writing – original draft. ZZ: Writing – review & editing.
Funding
The author(s) declare that financial support was received for the research and/or publication of this article. This work was supported by Medical and Health Science and Technology Plan Project of Zhejiang Province (Grant Number: 2022KY1296, 2022KY1287). The funding departments had no role in the collection, analysis, or interpretation of the data, or in the decision to submit the manuscript for publication.
Conflict of interest
Author YW was employed by the company GE Healthcare.
The remaining authors declare that the research was conducted in the absence of any commercial or financial relationships that could be construed as a potential conflict of interest.
Generative AI statement
The author(s) declare that no Generative AI was used in the creation of this manuscript.
Publisher’s note
All claims expressed in this article are solely those of the authors and do not necessarily represent those of their affiliated organizations, or those of the publisher, the editors and the reviewers. Any product that may be evaluated in this article, or claim that may be made by its manufacturer, is not guaranteed or endorsed by the publisher.
Supplementary material
The Supplementary Material for this article can be found online at: https://www.frontiersin.org/articles/10.3389/fonc.2025.1509207/full#supplementary-material.
Abbreviations
TILs, tumor-infiltrating lymphocytes; T1-CE, T1-weighted imaging; LR, logistic regression; RF, random forest; SVM, support vector machine; ICIs, immune checkpoint inhibitors; IHC, immunohistochemistry; DWI, diffusion-weighted imaging; GLCM, gray level co-occurrence matrix features; GLDM, gray level dependence matrix features; GLRLM, gray level run length matrix features; GLSZM, gray level size zone matrix features.
References
1. Siegel RL, Wagle NS, Cercek A, Smith RA, Jemal A. Colorectal cancer statistics, 2023. CA Cancer J Clin. (2023) 73:233–54. doi: 10.3322/caac.21772
2. Ferlay J, Soerjomataram I, Dikshit R, Eser S, Mathers C, Rebelo M, et al. Cancer incidence and mortality worldwide: sources, methods and major patterns in GLOBOCAN 2012. Int J Cancer. (2015) 136:E359–86. doi: 10.1002/ijc.v136.5
3. Kitsou M, Ayiomamitis GD, Zaravinos A. High expression of immune checkpoints is associated with the TIL load, mutation rate and patient survival in colorectal cancer. Int J Oncol. (2020) 57:237–48. doi: 10.3892/ijo.2020.5062
4. Marei HE, Hasan A, Pozzoli G, Cenciarelli C. Cancer immunotherapy with immune checkpoint inhibitors (ICIs): potential, mechanisms of resistance, and strategies for reinvigorating T cell responsiveness when resistance is acquired. Cancer Cell Int. (2023) 23:64. doi: 10.1186/s12935-023-02902-0
5. Denkert C, von Minckwitz G, Darb-Esfahani S, Lederer B, Heppner BI, Weber KE, et al. Tumour-infiltrating lymphocytes and prognosis in different subtypes of breast cancer: a pooled analysis of 3771 patients treated with neoadjuvant therapy. Lancet Oncol. (2018) 19:40–50. doi: 10.1016/S1470-2045(17)30904-X
6. Ren J, He Q, Yin H, Zheng L, Li L, Wu X, et al. Prognostic role and clinical significance of tumor-infiltrating lymphocyte (TIL) and programmed death ligand 1 (PD-L1) expression in gastric cancer: a systematic review and meta-analysis. Clin Transl Oncol. (2023) 25:1436–45. doi: 10.1007/s12094-022-03040-1
7. Gao G, Wang Z, Qu X, Zhang Z. Prognostic value of tumor-infiltrating lymphocytes in patients with triple-negative breast cancer: a systematic review and meta-analysis. BMC Cancer. (2020) 20:179. doi: 10.1186/s12885-020-6668-z
8. Anitei MG, Zeitoun G, Mlecnik B, Marliot F, Haicheur N, Todosi AM, et al. Prognostic and predictive values of the immunoscore in patients with rectal cancer. Clin Cancer Res. (2014) 20:1891–9. doi: 10.1158/1078-0432.CCR-13-2830
9. Yasuda K, Nirei T, Sunami E, Nagawa H, Kitayama J. Density of CD4(+) and CD8(+) T lymphocytes in biopsy samples can be a predictor of pathological response to chemoradiotherapy (CRT) for rectal cancer. Radiat Oncol. (2011) 6:49. doi: 10.1186/1748-717X-6-49
10. Orhan A, Khesrawi F, Tvilling Madsen M, Peuliche Vogelsang R, Dohrn N, Kanstrup Fiehn AM, et al. Tumor-infiltrating lymphocytes as biomarkers of treatment response and long-term survival in patients with rectal cancer: A systematic review and meta-analysis. Cancers (Basel). (2022) 14. doi: 10.3390/cancers14030636
11. Leon-Ferre RA, Jonas SF, Salgado R, Loi S, de Jong V, Carter JM, et al. Tumor-infiltrating lymphocytes in triple-negative breast cancer. Jama. (2024) 331:1135–44. doi: 10.1001/jama.2024.3056
12. Tang WJ, Kong QC, Cheng ZX, Liang YS, Jin Z, Chen LX, et al. Performance of radiomics models for tumour-infiltrating lymphocyte (TIL) prediction in breast cancer: the role of the dynamic contrast-enhanced (DCE) MRI phase. Eur Radiol. (2022) 32:864–75. doi: 10.1007/s00330-021-08173-5
13. Jeon SH, Lim YJ, Koh J, Chang WI, Kim S, Kim K, et al. A radiomic signature model to predict the chemoradiation-induced alteration in tumor-infiltrating CD8(+) cells in locally advanced rectal cancer. Radiother Oncol. (2021) 162:124–31. doi: 10.1016/j.radonc.2021.07.004
14. Li J, Shi Z, Liu F, Fang X, Cao K, Meng Y, et al. XGBoost classifier based on computed tomography radiomics for prediction of tumor-infiltrating CD8(+) T-cells in patients with pancreatic ductal adenocarcinoma. Front Oncol. (2021) 11:671333. doi: 10.3389/fonc.2021.671333
15. Huang H, Li Z, Xia Y, Zhao Z, Wang D, Jin H, et al. Association between radiomics features of DCE-MRI and CD8(+) and CD4(+) TILs in advanced gastric cancer. Pathol Oncol Res. (2023) 29:1611001. doi: 10.3389/pore.2023.1611001
16. Aerts HJ, Velazquez ER, Leijenaar RT, Parmar C, Grossmann P, Carvalho S, et al. Decoding tumour phenotype by noninvasive imaging using a quantitative radiomics approach. Nat Commun. (2014) 5:4006. doi: 10.1038/ncomms5006
17. Zhuo X, Zhao H, Chen M, Mu Y, Li Y, Cai J, et al. A radiomics model for predicting the response to methylprednisolone in brain necrosis after radiotherapy for nasopharyngeal carcinoma. Radiat Oncol. (2023) 18:43. doi: 10.1186/s13014-023-02235-2
18. DeLong ER, DeLong DM, Clarke-Pearson DL. Comparing the areas under two or more correlated receiver operating characteristic curves: a nonparametric approach. Biometrics. (1988) 44:837–45. doi: 10.2307/2531595
19. Pencina MJ, D’Agostino RB, Demler OV. Novel metrics for evaluating improvement in discrimination: net reclassification and integrated discrimination improvement for normal variables and nested models. Stat Med. (2012) 31:101–13. doi: 10.1002/sim.v31.2
20. Zheng Y, Zhou D, Liu H, Wen M. CT-based radiomics analysis of different machine learning models for differentiating benign and Malignant parotid tumors. Eur Radiol. (2022) 32:6953–64. doi: 10.1007/s00330-022-08830-3
21. Ruffin AT, Li H, Vujanovic L, Zandberg DP, Ferris RL, Bruno TC, et al. Improving head and neck cancer therapies by immunomodulation of the tumour microenvironment. Nat Rev Cancer. (2023) 23:173–88. doi: 10.1038/s41568-022-00531-9
22. Liang Y, Tan Y, Guan B, Guo B, Xia M, Li J, et al. Single-cell atlases link macrophages and CD8(+) T-cell subpopulations to disease progression and immunotherapy response in urothelial carcinoma. Theranostics. (2022) 12:7745–59. doi: 10.7150/thno.77281
23. Jiménez-Reinoso A, Nehme-Álvarez D, Domínguez-Alonso C, Álvarez-Vallina L. Synthetic TILs: engineered tumor-infiltrating lymphocytes with improved therapeutic potential. Front Oncol. (2020) 10:593848. doi: 10.3389/fonc.2020.593848
24. Okcu O, Öztürk SD, Öztürk Ç, Şen B, Yasin AI, Bedir R, et al. Tumor-infiltrating lymphocytes (TILs)/volume and prognosis: The value of TILs for survival in HER2 and TN breast cancer patients treated with chemotherapy. Ann Diagn Pathol. (2022) 58:151930. doi: 10.1016/j.anndiagpath.2022.151930
25. Chen L, Chen L, Ni H, Shen L, Wei J, Xia Y, et al. Prediction of CD3 T cells and CD8 T cells expression levels in non-small cell lung cancer based on radiomic features of CT images. Front Oncol. (2023) 13:1104316. doi: 10.3389/fonc.2023.1104316
26. Liu Z, Luo C, Chen X, Feng Y, Feng J, Zhang R, et al. Machine learning for computed tomography radiomics: prediction of tumor-infiltrating lymphocytes in patients with pancreatic ductal adenocarcinoma. Pancreas. (2022) 51:549–58. doi: 10.1097/MPA.0000000000002069
27. Tahkola K, Mecklin JP, Wirta EV, Ahtiainen M, Helminen O, Böhm J, et al. High immune cell score predicts improved survival in pancreatic cancer. Virchows Arch. (2018) 472:653–65. doi: 10.1007/s00428-018-2297-1
28. Mei Z, Liu Y, Liu C, Cui A, Liang Z, Wang G, et al. Tumour-infiltrating inflammation and prognosis in colorectal cancer: systematic review and meta-analysis. Br J Cancer. (2014) 110:1595–605. doi: 10.1038/bjc.2014.46
29. Bonaventura P, Shekarian T, Alcazer V, Valladeau-Guilemond J, Valsesia-Wittmann S, Amigorena S, et al. Cold tumors: A therapeutic challenge for immunotherapy. Front Immunol. (2019) 10:168. doi: 10.3389/fimmu.2019.00168
30. Maibach F, Sadozai H, Seyed Jafari SM, Hunger RE, Schenk M. Significance of tumor-infiltrating lymphocytes before and after neoadjuvant therapy for rectal cancer. Cancer Sci. (2018) 109:966–79. doi: 10.1111/cas.2018.109.issue-4
31. Sun R, Limkin EJ, Vakalopoulou M, Dercle L, Champiat S, Han SR, et al. A radiomics approach to assess tumour-infiltrating CD8 cells and response to anti-PD-1 or anti-PD-L1 immunotherapy: an imaging biomarker, retrospective multicohort study. Lancet Oncol. (2018) 19:1180–91. doi: 10.1016/S1470-2045(18)30413-3
32. Ligero M, Garcia-Ruiz A, Viaplana C, Villacampa G, Raciti MV, Landa J, et al. A CT-based radiomics signature is associated with response to immune checkpoint inhibitors in advanced solid tumors. Radiology. (2021) 299:109–19. doi: 10.1148/radiol.2021200928
33. Park C, Jeong DY, Choi Y, Oh YJ, Kim J, Ryu J, et al. Tumor-infiltrating lymphocyte enrichment predicted by CT radiomics analysis is associated with clinical outcomes of non-small cell lung cancer patients receiving immune checkpoint inhibitors. Front Immunol. (2022) 13:1038089. doi: 10.3389/fimmu.2022.1038089
34. Jimenez JE, Abdelhafez A, Mittendorf EA, Elshafeey N, Yung JP, Litton JK, et al. A model combining pretreatment MRI radiomic features and tumor-infiltrating lymphocytes to predict response to neoadjuvant systemic therapy in triple-negative breast cancer. Eur J Radiol. (2022) 149:110220. doi: 10.1016/j.ejrad.2022.110220
35. Teng MW, Ngiow SF, Ribas A, Smyth MJ. Classifying cancers based on T-cell infiltration and PD-L1. Cancer Res. (2015) 75:2139–45. doi: 10.1158/0008-5472.CAN-15-0255
Keywords: CD3, tumor-infiltrating lymphocytes, radiomics, rectal cancer, machine learning
Citation: Ma W, Hou C, Yang M, Wei Y, Mao J, Guan L and Zhao Z (2025) Different MRI-based radiomics machine learning models to predict CD3+ tumor-infiltrating lymphocytes in rectal cancer. Front. Oncol. 15:1509207. doi: 10.3389/fonc.2025.1509207
Received: 10 October 2024; Accepted: 26 March 2025;
Published: 28 April 2025.
Edited by:
Wei Chen, Shandong First Medical University, ChinaReviewed by:
Zhongxiang Ding, Zhejiang University, ChinaMichał Zarobkiewicz, Medical University of Lublin, Poland
Copyright © 2025 Ma, Hou, Yang, Wei, Mao, Guan and Zhao. This is an open-access article distributed under the terms of the Creative Commons Attribution License (CC BY). The use, distribution or reproduction in other forums is permitted, provided the original author(s) and the copyright owner(s) are credited and that the original publication in this journal is cited, in accordance with accepted academic practice. No use, distribution or reproduction is permitted which does not comply with these terms.
*Correspondence: Zhenhua Zhao, emhhbzIwNzVAMTYzLmNvbQ==