 Peisi Kou
 Liangjie Lin
 Ying Li
 Hui Qin3
 Yong Zhang
 Jingliang Cheng
- 1Department of Magnetic Resonance Imaging (MRI), The First Affiliated Hospital of Zhengzhou University, Zhengzhou, China
- 2Clinical and Technical Support, Philips Healthcare, Beijing, China
- 3Department of Pathology, The First Affiliated Hospital of Zhengzhou University, Zhengzhou, China
Objectives: To explore the value of cellular microstructural mapping by IMPULSED (imaging microstructural parameters using limited spectrally edited diffusion) method in evaluating the histological type and prognostic factors of rectal lesions.
Materials and methods: Sixty-six patients with rectal lesions were enrolled in this study. All subjects underwent MRI scans including conventional diffusion weighted imaging (DWI) and the IMPULSED MRI scans of oscillating gradient spin-echo (OGSE) and pulse gradient spin-echo (PGSE) sequences. Parameters including mean cell diameter (dmean), intracellular fraction (vin), extracellular diffusivity (dex), cellularity, and apparent diffusion coefficient (ADC) values (ADCPGSE, ADC17Hz, ADC33Hz, and ADC of conventional DWI) were measured in different histopathologic types, grades, stages, and structure invasion statuses. The receiver operating characteristic (ROC) curve analysis was used to evaluate diagnostic power. The sensitivity, specificity, and the corresponding area under the curves (AUCs) were calculated.
Results: Our preliminary results illustrated that malignant lesion showed higher vin and cellularity ([0.2867 ± 0.0697] vs. [0.1856 ± 0.1011], [2.3508 ± 0.6055] vs. [1.2716 ± 0.4574], all P<0.05), lower dex and ADC values (ADCPGSE, ADC17Hz, and ADC of conventional DWI) compared to benign lesion ([2.1637 ± 0.3303 μm2/ms] vs. [2.5595 ± 0.5085 μm2/ms], [0.9238 (0.7959, 1.0741) ×10-3 mm2/s] vs. [1.3373 ± 0.3902×10⁻³ mm2/s], [1.3204 ± 0.2342×10⁻³ mm2/s] vs. [1.8029 ± 0.3119×10⁻³ mm2/s], [0.7400 (0.6750, 0.8375) ×10-3 mm2/s] vs. [1.0550 ± 1.1191×10⁻³ mm2/s], all P<0.05), while no significant difference was seen for dmean. Vin and cellularity of rectal common adenocarcinoma (AC) were significantly higher than those of rectal mucinous adenocarcinoma (MC) ([0.2994 ± 0.0626] vs. [0.2028 ± 0.0571], [2.4579 ± 0.5553] vs. [1.6412 ± 0.4347], all P<0.05), while dex and ADC values (ADCPGSE, ADC17Hz, ADC33Hz, and ADC of conventional DWI) were lower in AC ([2.1189 ± 0.3187 μm2/ms] vs. [2.4609 ± 0.2534 μm2/ms], [0.8996 ± 0.1583×10⁻³ mm2/s] vs. [1.2072 ± 0.2326×10⁻³ mm2/s], [1.2714 ± 0.1916×10⁻³ mm2/s] vs. [1.6451 ± 0.2420×10⁻³ mm2/s], [1.8963 (1.6481, 2.1138) ×10-3 mm2/s] vs. [2.3104 ± 0.3851×10⁻³ mm2/s], [0.7341 ± 0.8872×10⁻³ mm2/s] vs. [1.1410 ± 0.1840×10⁻³ mm2/s], all P<0.05). In AC group, the dmean had significant difference between negative and positive tumor budding (TB) ([13.2590 ± 1.3255 μm] vs. [14.3014 ± 1.1830 μm], P<0.05). No significant difference of dmean, vin, dex, cellularity or ADC values was observed in AC with different grade, T stage, N stage, perineural and lymphovascular invasion (all P>0.05). The ROC curves showed that the area under the curves (AUCs) of vin, dex, cellularity, and ADC values (ADCPGSE, ADC17Hz, and ADC of conventional DWI) for distinguishing malignant and benign lesion were 0.803, 0.757, 0.948, 0.807, 0.908 and 0.905, respectively. The AUCs of vin, dex, cellularity, and ADC values (ADCPGSE, ADC17Hz, ADC33Hz, and ADC of conventional DWI) in distinguishing AC from MC were 0.887, 0.802, 0.906, 0.896, 0.896, 0.781 and 0.991, respectively. The AUC of the dmean for evaluating TB status was 0.726. The AUC of ADC from conventional DWI for evaluating WHO grade was 0.739.
Conclusion: Cellular microstructural mapping by the IMPULSED method has great potential in preoperative evaluation of rectal lesions. It could be helpful in differentiating malignant and benign lesions, distinguishing AC from MC, and in predicting the TB status.
1 Introduction
Colorectal cancer (CRC) is a common malignant tumor in the digestive system, which is the third most common cancer and the second most common cause of cancer-related death in global (1). About 30% occur in the rectum (2), and 90% are classified as adenocarcinoma (AC). Many factors affect the choice of treatment methods and prognosis of patients, such as pathological types, tumor grade, T stage, and N stage. For example, rectal mucinous adenocarcinoma (MC) is a common subtype of rectal adenocarcinomas, which is not sensitive to neoadjuvant chemoradiotherapy and has a poor prognosis. In addition to malignant tumors, benign lesions could also occur in the rectum, such as rectal adenomas, inflammatory lesions, etc. However, preoperative classification of rectal lesions remains challenging. Magnetic resonance imaging (MRI) has become the preferred imaging method for diagnosis of rectal lesions due to its excellent soft tissue resolution. However, few evidences are available about the application of MRI in preoperative evaluation of rectal benign lesions.
The conventional diffusion-weighted magnetic resonance imaging (dMRI) along with the derived apparent diffusion coefficient (ADC) has shown important diagnostic value in rectal lesions (3–6). Nevertheless, its performance in rectal cancer subtype analyses and the evaluation of prognostic factors is limited. One of the key reasons may lie in that ADC is a general measurement of restricted diffusion rate that cannot pinpoint the underlying pathology. Micro cellular structures including cell size, cell density, and intra- or extra-cellular volume fractions could change ADC. Recent advances in diffusion MRI for microstructural modeling provide the opportunity to characterize cancer pathology in vivo (7). Among them, the IMPULSED (imaging microstructural parameters using limited spectrally edited diffusion) method developed by Jiang etc. has been used in the study of multiple systemic diseases in patients with breast, prostate cancer, and brain tumor (8–11). However, the application value of IMPULSED MRI in evaluating pathological features of rectal lesions remains unclear.
The current study aims to explore the efficacy of the IMPULSED MRI for microstructural mapping in rectal lesions, and further to evaluate whether the obtained tumor microstructural properties could be used to distinguish prognostic factors in rectal cancer.
2 Materials and methods
2.1 Study participants
This preoperative study included 118 patients who were diagnosed with rectal lesions between April 2023 and September 2023 at our hospital. The inclusion criteria were as follows: (1) patients suspected of rectal lesions; (2) patients without surgery, chemoradiotherapy or other related treatments before the MRI examination; (3) pathological diagnosis could be obtained within two weeks after the MRI examination; The exclusion criteria were as follows: (1) patients without pathological diagnosis (n=11); (2) patients received neoadjuvant therapy (n=34); (3) poor image quality (n=5); (4) patients with rectal lymphomas, neuroendocrine tumor and other rare tumors (n=1); and (5) patients with a history of other malignant tumors (n=1). Finally, 66 patients were enrolled in this study cohort (Figure 1).
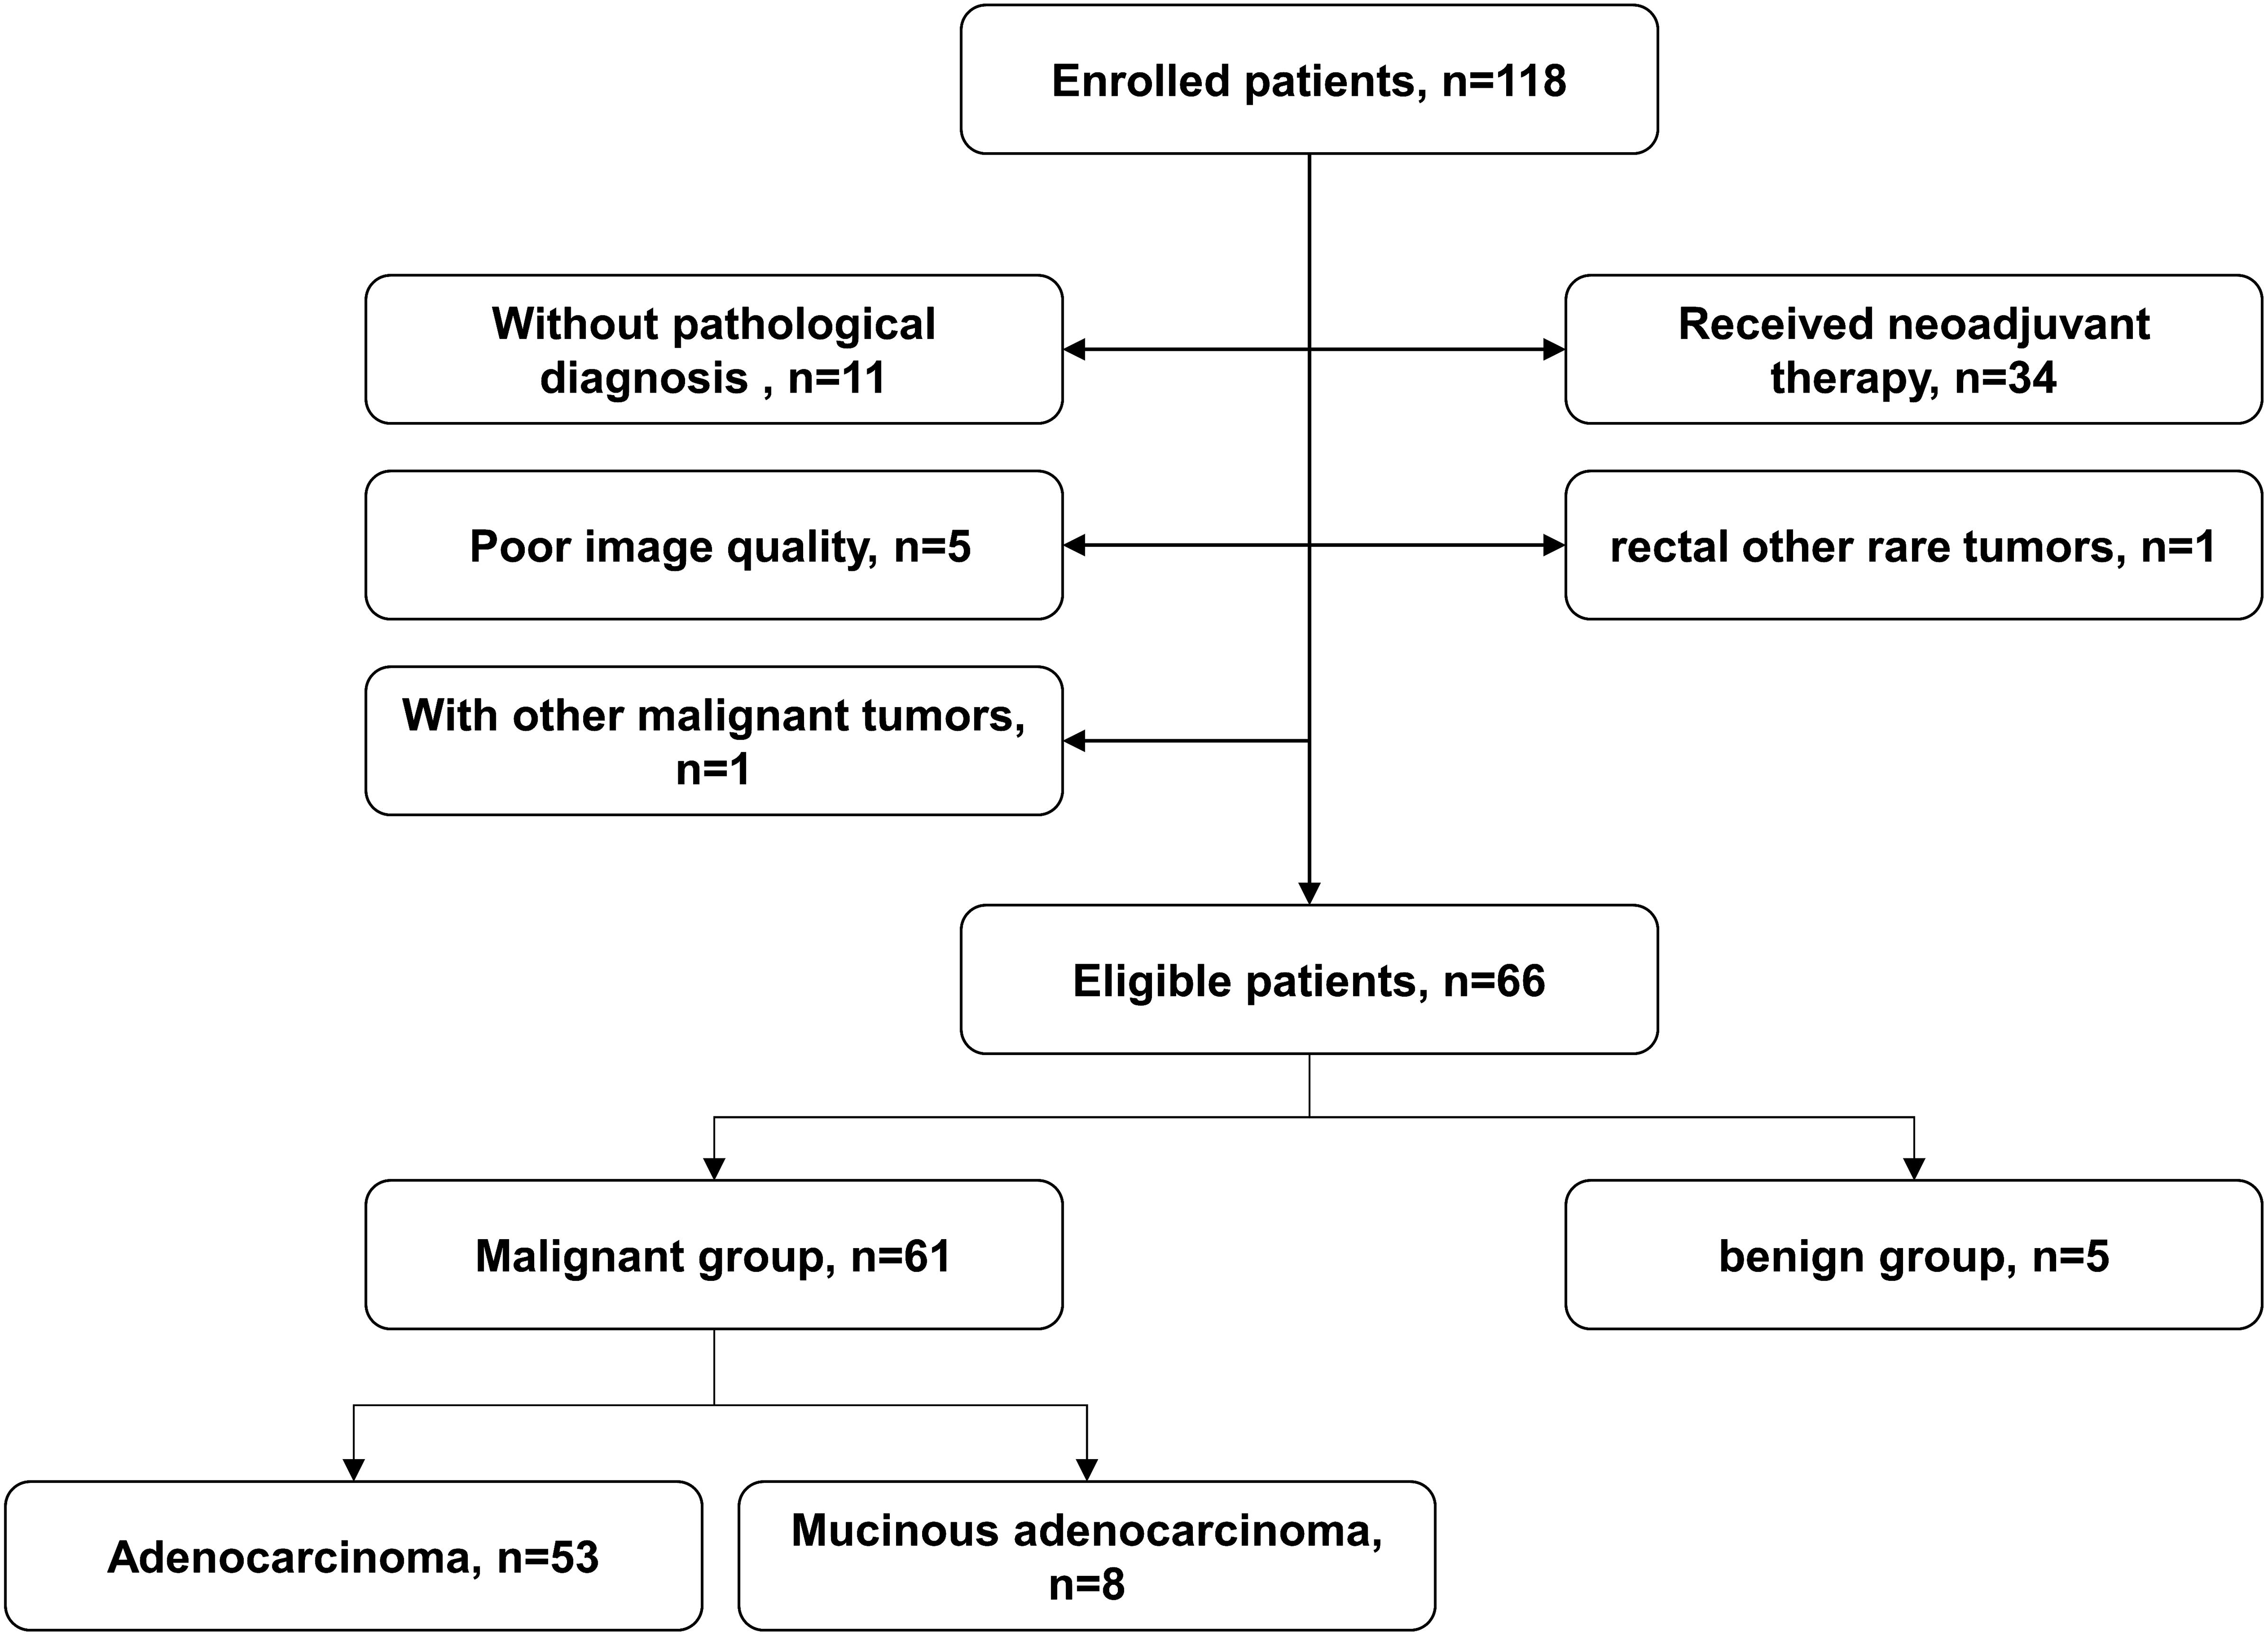
Figure 1. Flowchart of patient enrolment.
2.2 Magnetic resonance imaging protocols
MRI was performed on a 3T scanner (Ingenia Elition, Philips Healthcare, Best, the Netherlands) with a high-performance gradient system (maximum gradient = 45 mT/m per axis, maximum slew rate = 220 mT/m) and a 24-channel abdominal coil. Patients need to empty the rectum before MRI examination. The oscillating gradient spin-echo (OGSE) sequence with trapezoid-cosine gradients and the pulse gradient spin-echo (PGSE) diffusion weighted sequence were implemented with 2D echo-planar imaging acquisition. Table 1 shows detailed diffusion encoding parameters for PGSE and OGSE scans. Routine pre-contrast MRI scans included T1-weighted imaging, fat-suppressed T2-weighted imaging, and conventional diffusion-weighted imaging (DWI). The post-contrast T1-weighted images were acquired for anatomical reference. The patients did not require too much special preparations, and the whole scan took less than half an hour.
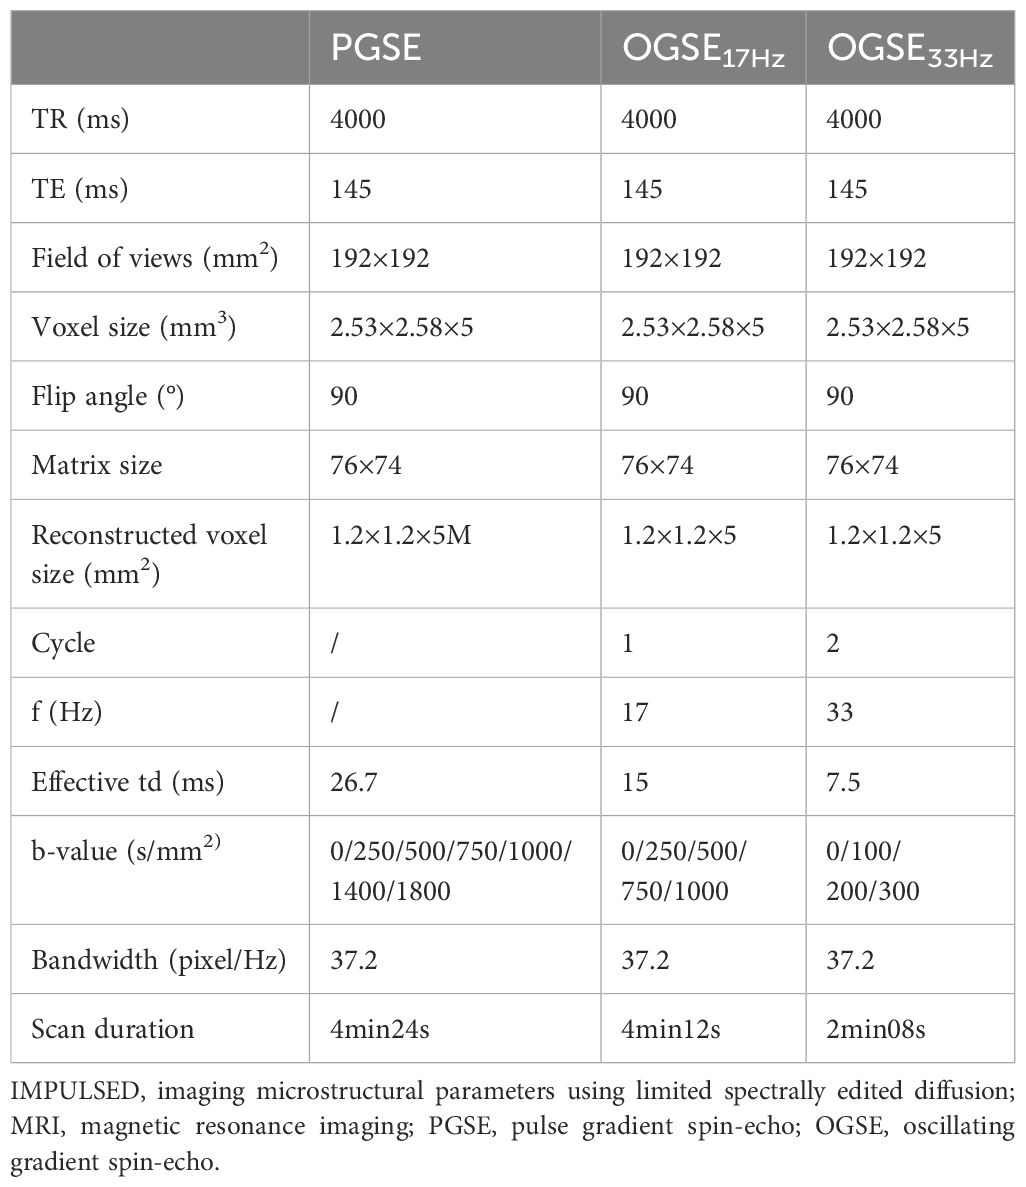
Table 1. Scan parameters for the IMPULSED MRI of PGSE and OGSE sequences.
2.3 Image analysis and data acquisition
High-resolution T2WI was used to evaluate tumor location, tumor size, and bowel circumferential involvement. The estimation of IMPULSED parameters included mean cell diameter (dmean), intracellular fraction (vin), extracellular diffusivity (dex), and cellularity, while intracellular diffusivity (Din) was fixed at 1.58 μm2/ms to ensure fitting stability. The parameters were constrained to 4 < dmean <30 μm, 0 < vin < 1, and 0 < dex <3.5 μm2/ms based on physiologically relevant values. The fitting was performed using the least square curve fitting toolbox in MATLAB (Mathworks, Inc.). Additionally, the apparent diffusion coefficient (ADC) values were fitted according to S/S0 = exp(−b×ADC) using a log-linear fitting with all b values for PGSE/OGSE.
In patients with rectal lesion, the regions-of-interest (ROIs) were manually delineated on the slice with the largest scale of the lesion based on diffusion-weighted images by two experienced radiologists independently, and necrotic area or surrounding tissue was carefully excluded from the segmentation. The fitted microstructural parameters, including dmean, vin, dex, cellularity, and ADC (ADCPGSE, ADC17Hz, ADC33Hz), were calculated in a voxel-wise manner and averaged within the tumor ROIs. And the image quality was evaluated by two radiologists independently according to the artifact and noise (1 score, both strongly obvious; 2 score, both obvious; 3 score, slight artifacts and noise, but acceptable; 4 score, no artifact and slight noise; 5 score, no artifact and noise).
2.4 Pathologic evaluation
The pathological diagnosis was evaluated by a pathologist with >5 years of experience, who was blinded to the MRI diagnosis. The pathological reports included the diagnosis of benign and malignant lesions. For malignant lesions, pathological reports should contain histological types, tumor grade, pathological stage, perineural invasion (PNI), and lymphovascular invasion (LVI), and tumor budding (TB). Tumor grades were classified as low-grade and high-grade, the former included grade 1 (G1, well- differentiated, >95% gland forming) and grade 2 (G2, moderately differentiated, 50–95% gland forming), and the latter referred to grade 3 (G3, poorly differentiated, 0-49% gland forming). Pathological stage included T staging and N staging. Pathological T staging was divided into early and late stages according to the American Joint Committee on Cancer (AJCC) 8th edition. Early-stage rectal cancer included stages pT1 and pT2, which was defined as tumor confined to the muscularis propria. Late-stage rectal cancer included stages pT3 and pT4, which referred to tumor extending beyond the muscularis propria. According to the status of regional lymph node, pathological N staging was divided into two categories, including lack of regional lymph node metastases (pN0) and regional lymph node metastasis (pN1-2). PNI, LVI and TB statuses were classified into positive and negative groups.
2.5 Statistical analysis
SPSS 27.0 software (IBM Corp., Armonk, NY, USA) and MedCalc (MedCalc Software, Mariakerke, Belgium) were used for the statistical analyses. GraphPad Prism software (version 10.1.2, GraphPad Software, San Diego, CA, USA) was used to make diagrams. The Shapiro–Wilk test (n ≤ 50) and Kolmogorov-Smirnov test (n>50) were used to determine normal or skewed data distribution for all continuous variables. The normally distributed data were expressed as mean ± standard deviation (SD). The non-normally distributed data were expressed as median (1st quartile, 3rd quartile). The two-independent samples t-test or the Mann–Whitney U test were used to compare dmean, vin, dex, cellularity and ADC parameters between histological types (malignant lesion vs. benign lesion; AC vs. MC), tumor grades (low grade vs. high grade), pT stages (pT1-2 vs. pT3-4), pN stages (pN0 vs. pN1-2), PNI (negative vs. positive), LVI (negative vs. positive), and TB (negative vs. positive). For parameters with significant differences, the receiver operating characteristic (ROC) curve analysis was used to evaluate diagnostic power. The sensitivity, specificity, and area under the curve (AUC) were calculated, and the cut-off value was also obtained using the Youden index (Youden’s index = sensitivity + specificity - 1). The intraclass correlation coefficient (ICC) and Kappa test were used to evaluate the agreement of measured parameters between the two radiologists. ICC values of greater than 0.75 and Kappa coefficient of greater than 0.80 were considered to good agreement. A probability of P values <0.05 was considered statistically significant.
3 Results
3.1 Patient characteristics
A total of 66 patients (61 in the malignant group and 5 in the benign group) were enrolled in this study. In the malignant group, 53 were classified as AC and 8 were classified as MC according to the results of postoperative pathology. Basic demographic and clinical information of the patients were summarized in Table 2.
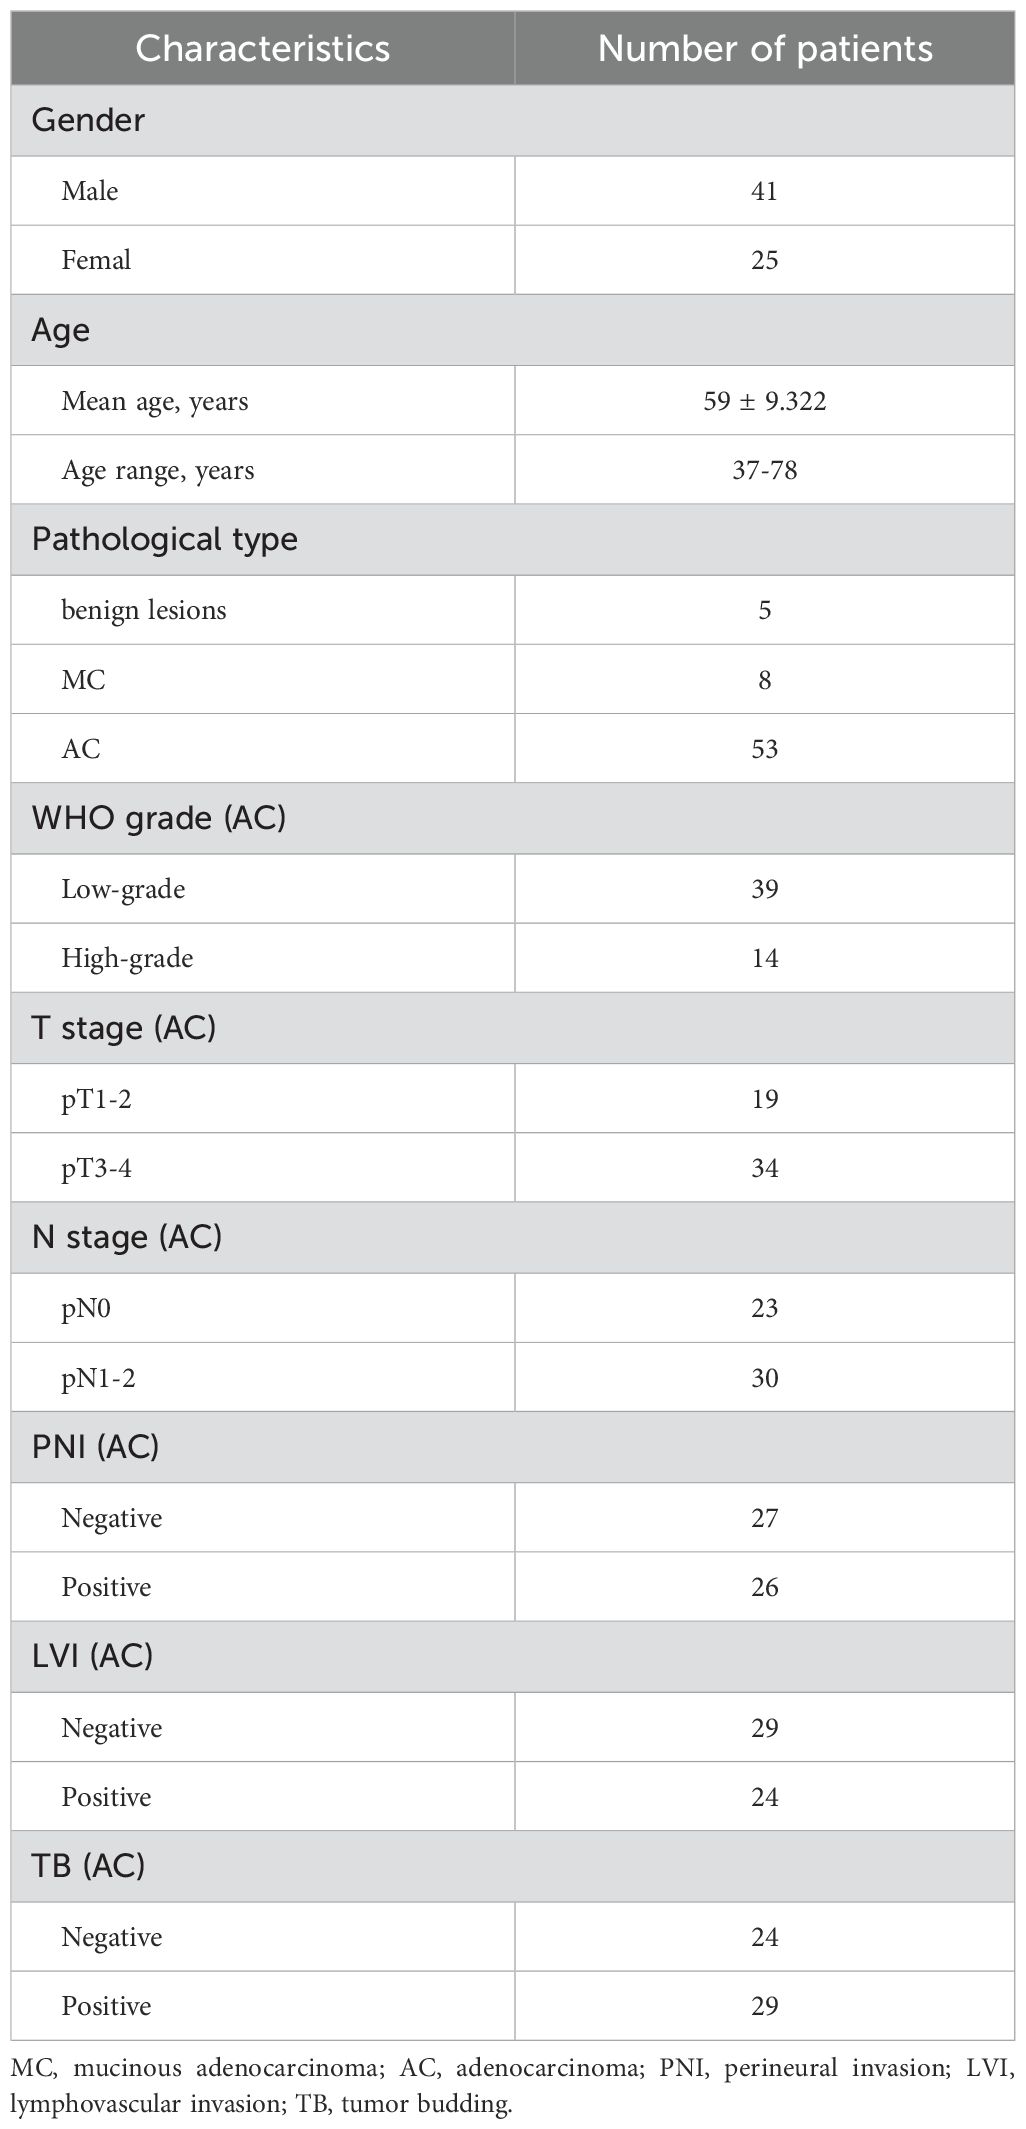
Table 2. Clinical and pathologic characteristics of the study patients.
3.2 Agreement of measured parameters between the two radiologists
There were good agreements between two observers. The ICC were 0.879 (95% CI 0.810–0.924) for dmean; 0.909 (95% CI, 0.849–0.945) for vin; 0.889 (95%CI, 0.812–0.933) for dex; 0.863 (95% CI,0.785–0.914) for cellularity; 0.914 (95% CI, 0.863–0.947) for ADCPGSE, 0.929 (95% CI, 0.887–0.956) for ADC17Hz, 0.924 (95% CI, 0.879–0.953) for ADC33Hz, and 0.974 (95% CI, 0.958-0.984) for ADC of conventional DWI, respectively. In addition, it showed high consistency in the evaluation of image quality (κ = 0.813).
3.3 Microstructural features and ADCs of different pathological types in rectal lesion
Compared to benign lesion, the vin and cellularity were significantly higher, the dex and ADC values (ADCPGSE, ADC17Hz, and ADC of conventional DWI) were significantly lower in malignant lesion (all P<0.05) (Table 3, Figure 2). There was no significant difference about dmean between the two groups. Vin and cellularity of rectal common adenocarcinoma (AC) were significantly higher than those of rectal mucinous adenocarcinoma (MC), while dex and ADC values (ADCPGSE, ADC17Hz, ADC33Hz, and ADC of conventional DWI) were lower in AC (all P<0.05) (Table 4, Figure 3).
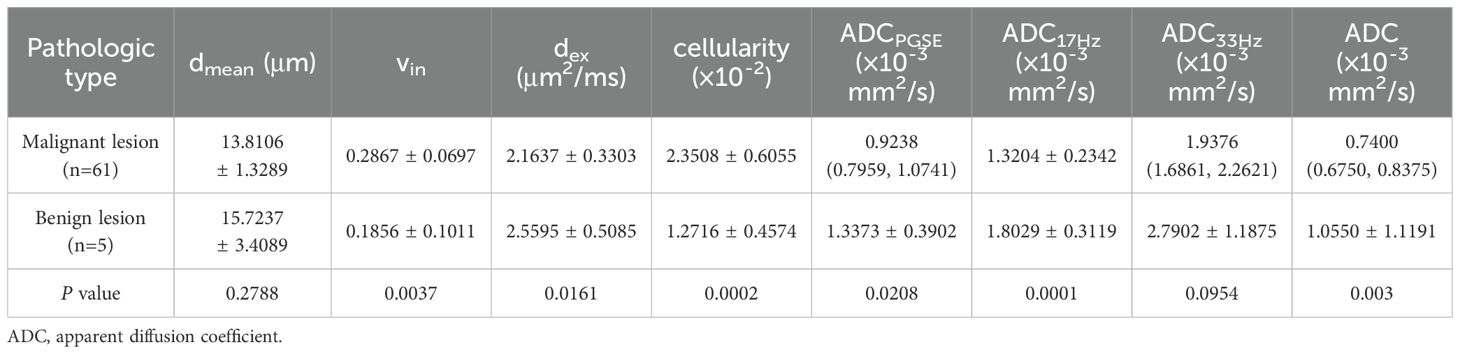
Table 3. Comparison of dmean, vin, dex, cellularity and ADC values (ADCPGSE, ADC17Hz, ADC33Hz, and ADC of conventional DWI) between malignant and benign lesions.
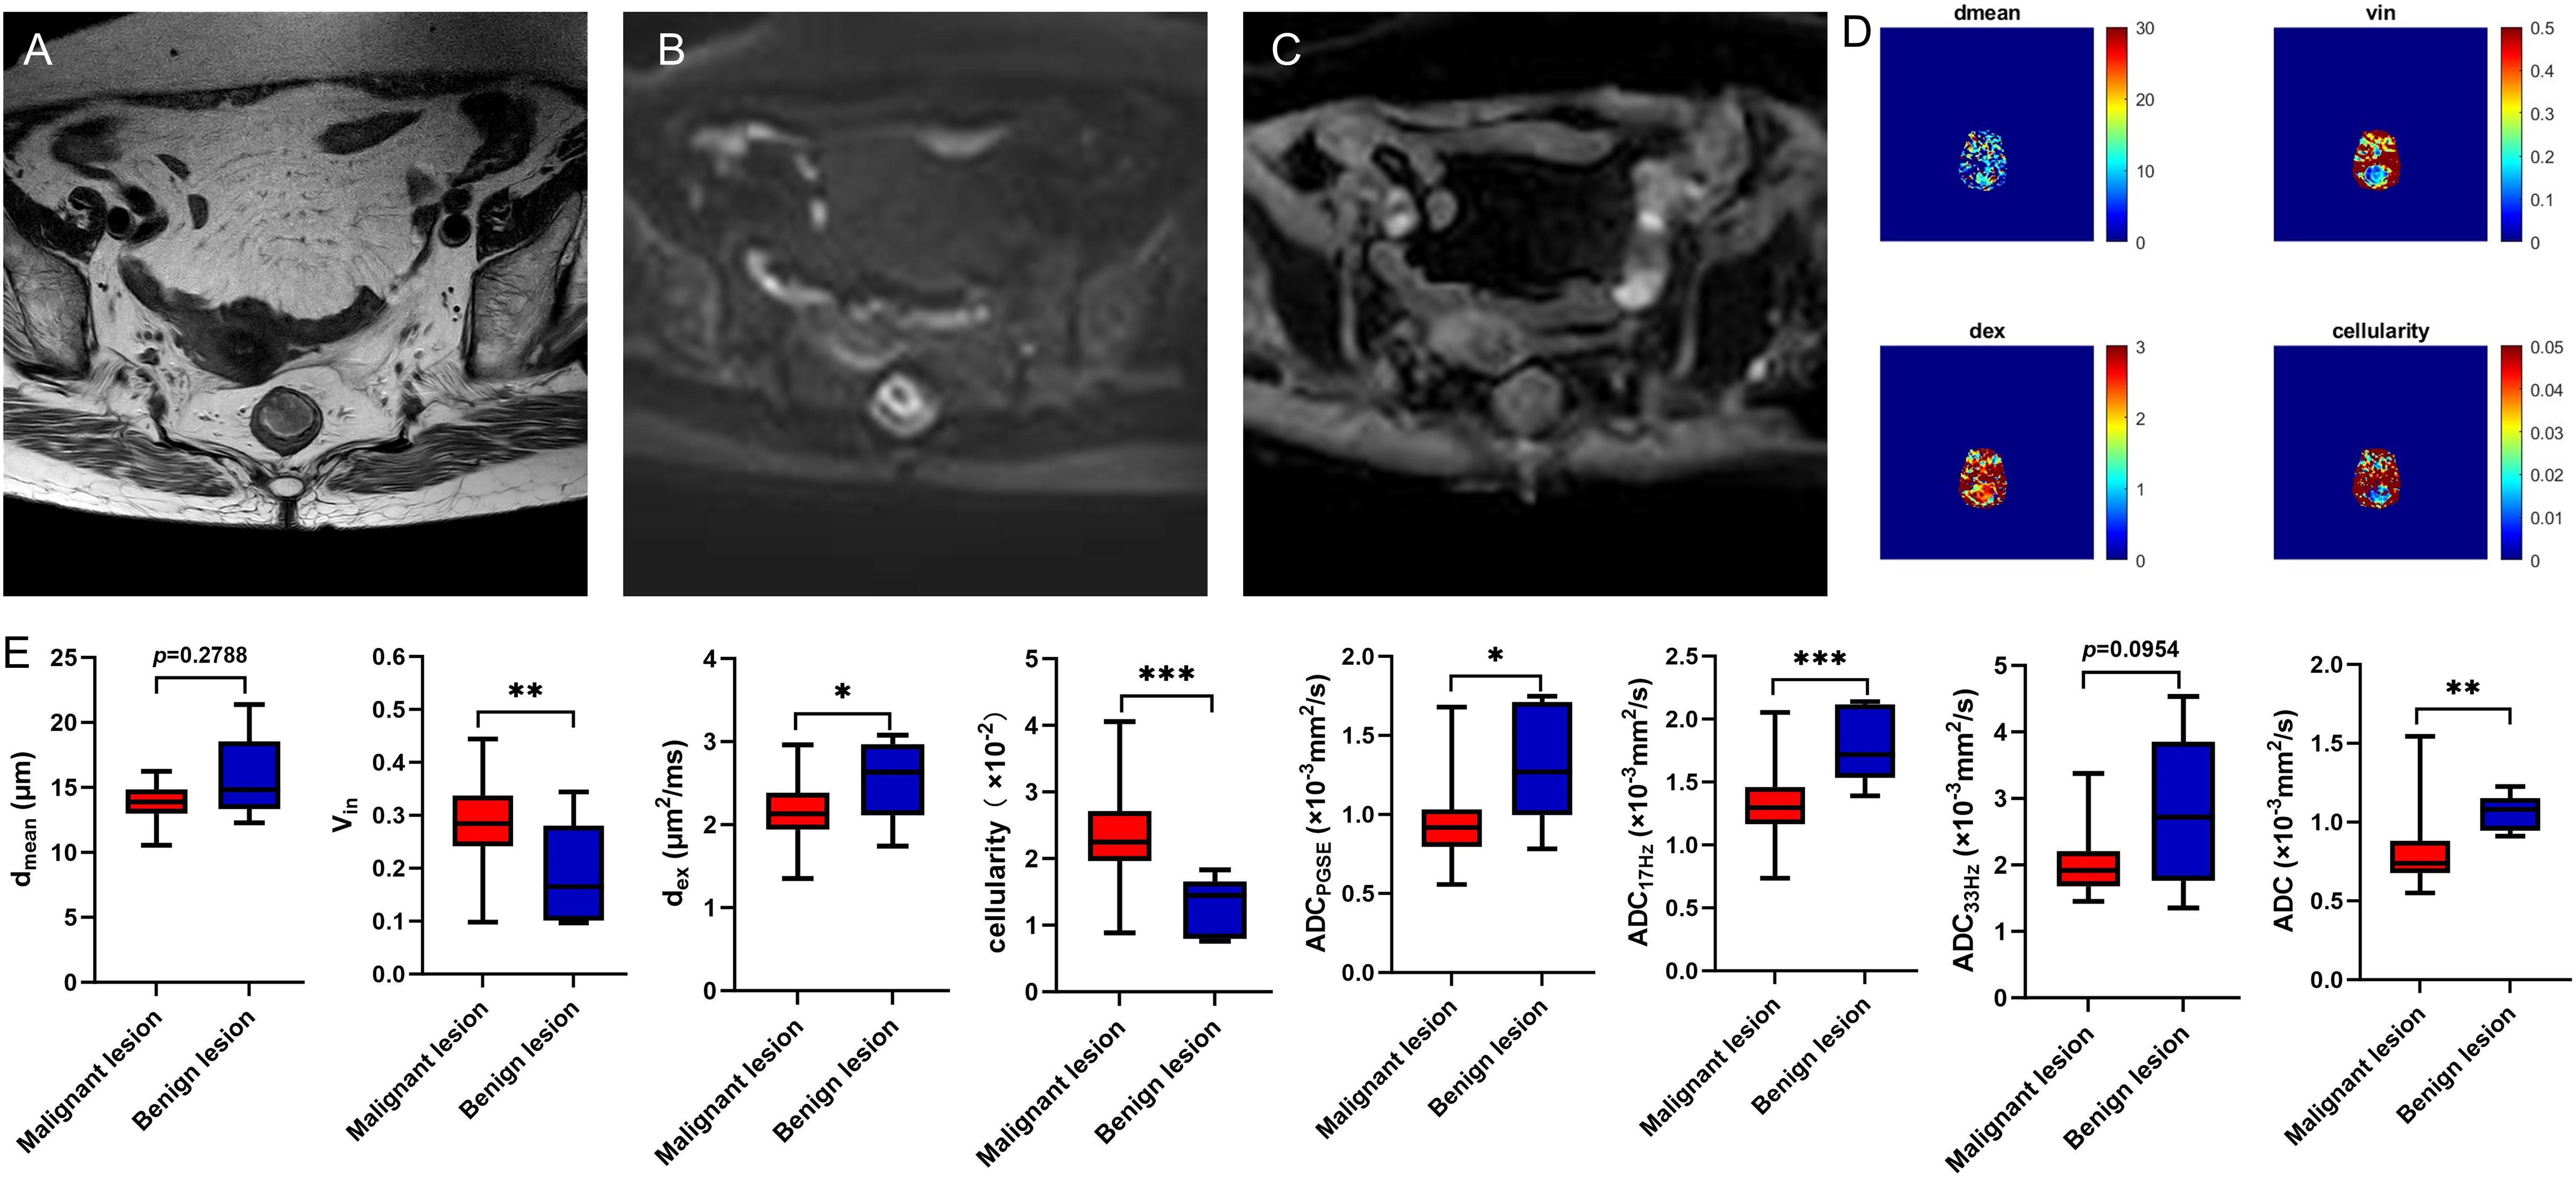
Figure 2. A 78-year-old female with rectal adenoma. Oblique axial T2WI shows a mass with a slight high-intensity signal in the rectum (A); The mass showed high signal on DWI (B) and slightly low-intensity signal on ADC map (C); The dmean, vin, dex, cellularity and ADC values (ADCPGSE, ADC17Hz, and ADC33Hz) were 12.2847 μm, 0.1650, 2.4879 μm2/ms, 1.4459×10⁻², 1.2696×10⁻³ mm2/s, 1.7180×10⁻³ mm2/s, and 2.1767×10⁻³ mm2/s, respectively (D). Box plots of dmean, vin, dex, cellularity and ADC values (ADCPGSE, ADC17Hz, ADC33Hz, and ADC of conventional DWI) between malignant and benign lesions (E). T2WI, T2 weighted imaging; DWI, diffusion weighted imaging; ADC, apparent diffusion coefficient; *P < 0.05; **P < 0.01; ***P < 0.001.
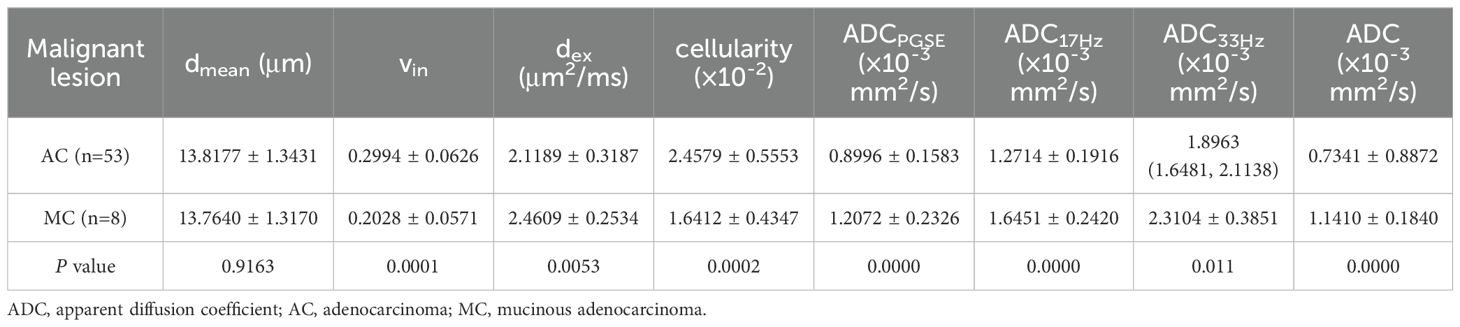
Table 4. Comparison of dmean, vin, dex, cellularity and ADC values (ADCPGSE, ADC17Hz, ADC33Hz, and ADC of conventional DWI) between AC and MC.
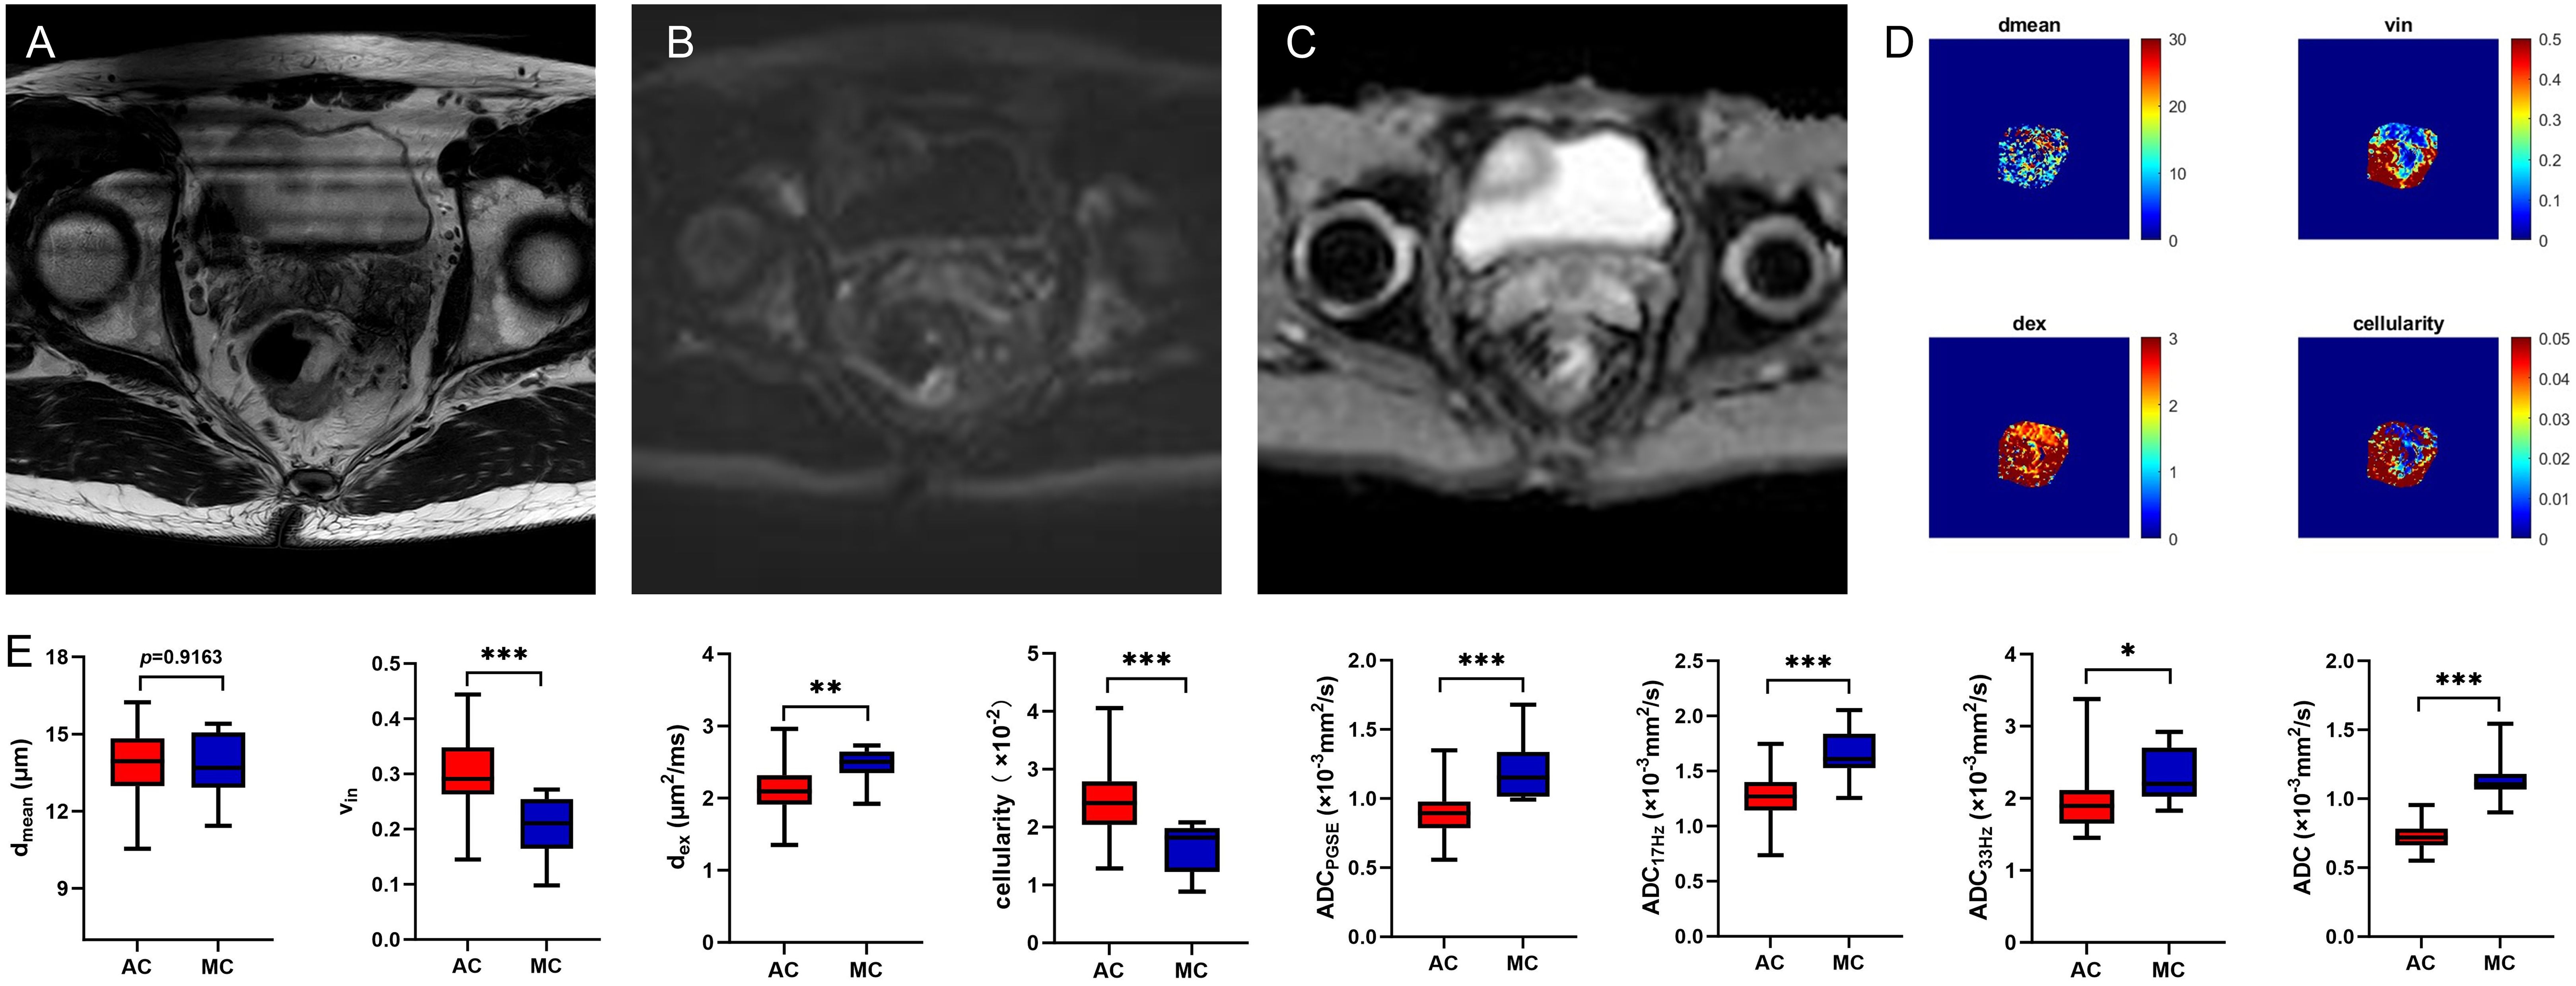
Figure 3. A 59-year-old male with MC. Oblique axial T2WI shows a mass with a high-intensity signal in the rectum (A); The mass showed isointensity signals on DWI (B) and high signal on ADC map (C); The dmean, vin, dex, cellularity and ADC values (ADCPGSE, ADC17Hz, and ADC33Hz) were 14.5828 μm, 0.2628, 2.5125 μm2/ms, 2.0014×10⁻², 1.0622×10⁻³ mm2/s, 1.5864×10⁻³ mm2/s, and 2.1282×10⁻³ mm2/s, respectively (D). Box plots of dmean, vin, dex, cellularity and ADC values (ADCPGSE, ADC17Hz, ADC33Hz, and ADC of conventional DWI) between AC and MC (E). AC, adenocarcinoma; MC, mucinous adenocarcinoma; T2WI, T2 weighted imaging; DWI, diffusion weighted imaging; ADC, apparent diffusion coefficient; *P < 0.05; **P < 0.01; ***P < 0.001.
3.4 Comparison of microstructural features and ADCs in different subtype groups of rectal adenocarcinomas
In AC group, the dmean was higher in positive tumor budding (TB) group (P<0.05), and ADC of conventional DWI was higher in low-grade group (P<0.05) (Table 5, Figure 4). No significant difference of dmean, vin, dex, cellularity or other ADC values (ADCPGSE, ADC17Hz, ADC33Hz, and ADC of conventional DWI) was observed in other groups (all P>0.05).
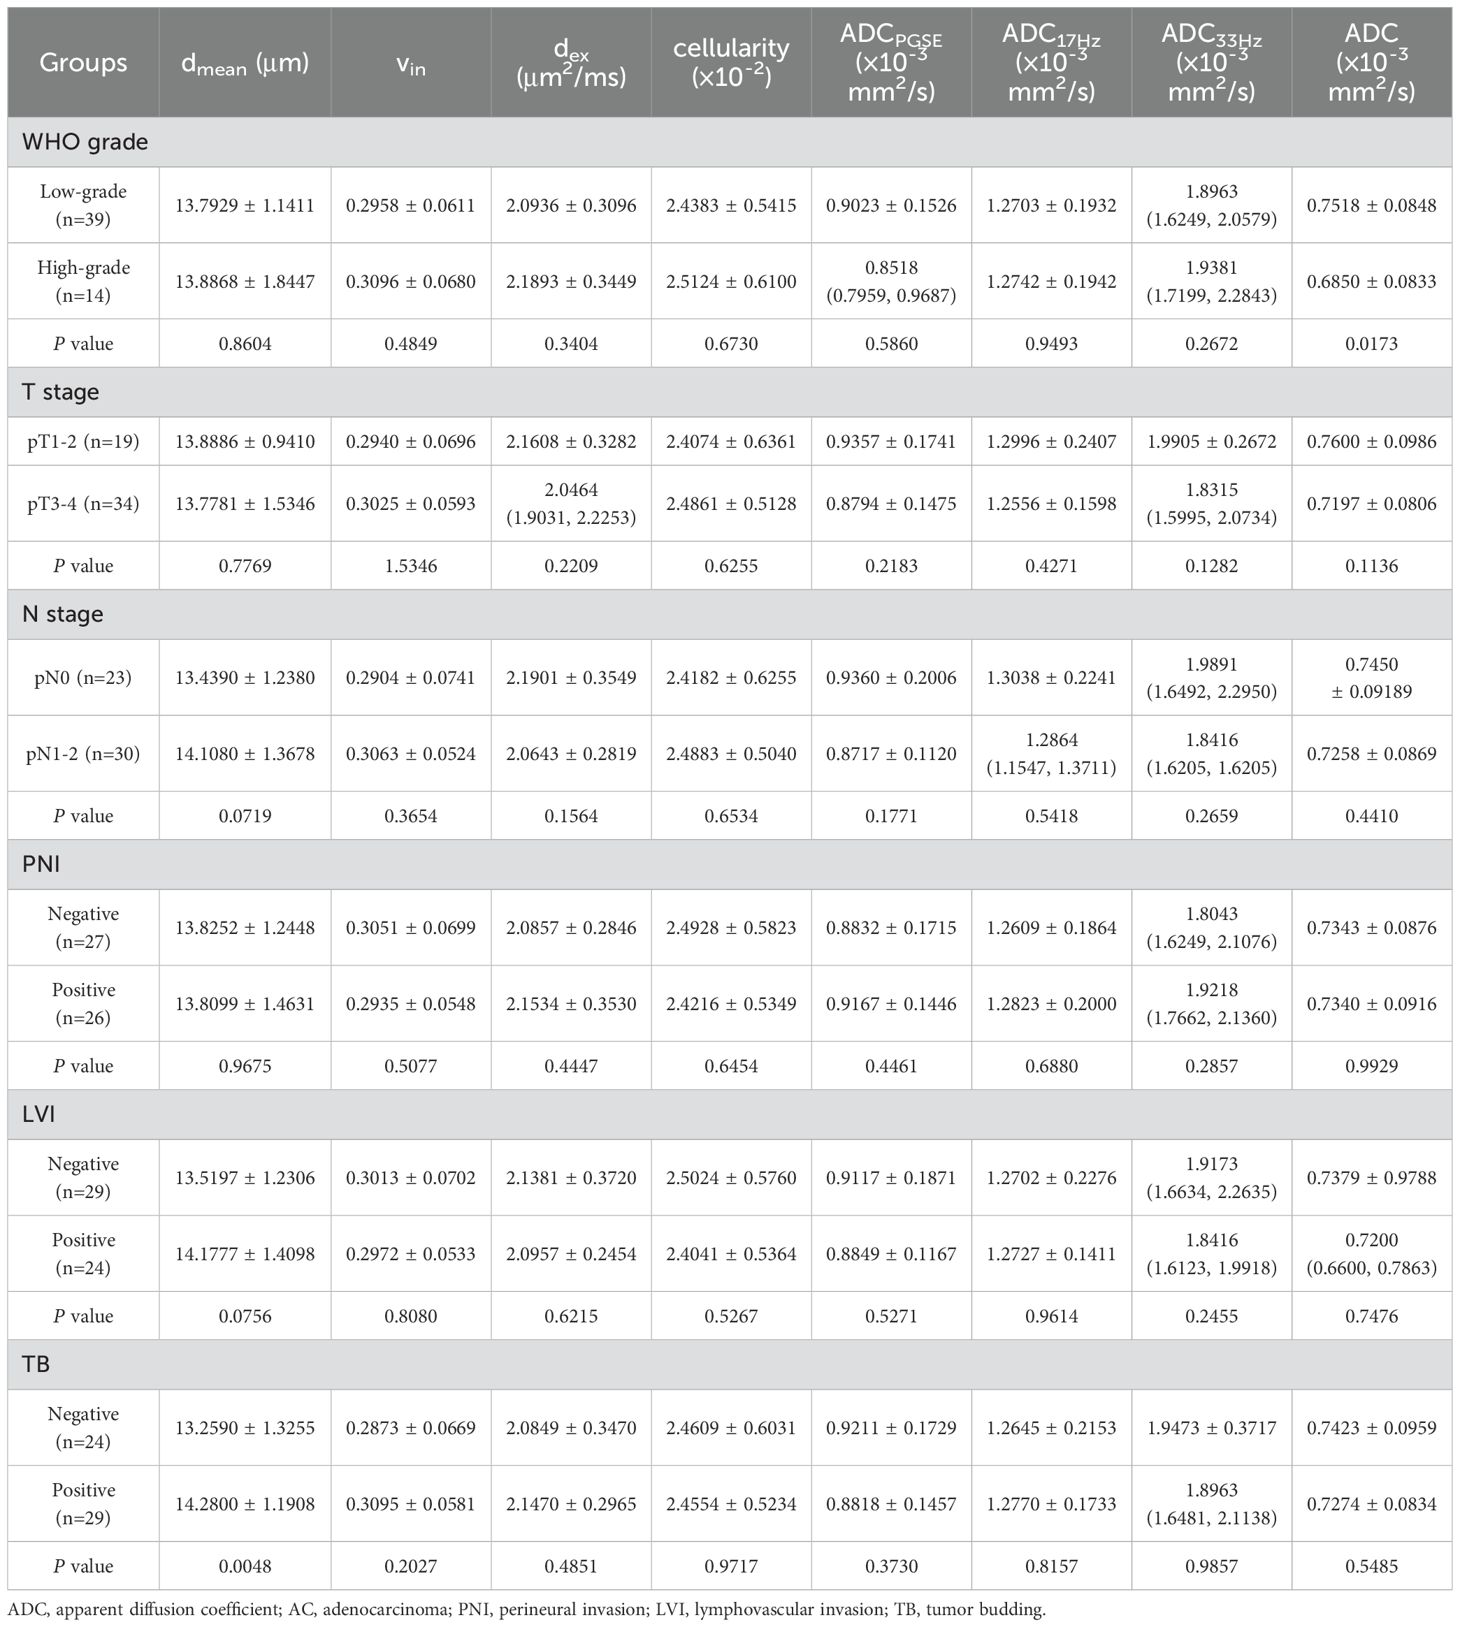
Table 5. The comparison of dmean, vin, dex, cellularity and ADC values (ADCPGSE, ADC17Hz, ADC33Hz, and ADC of conventional DWI) in different groups of AC.
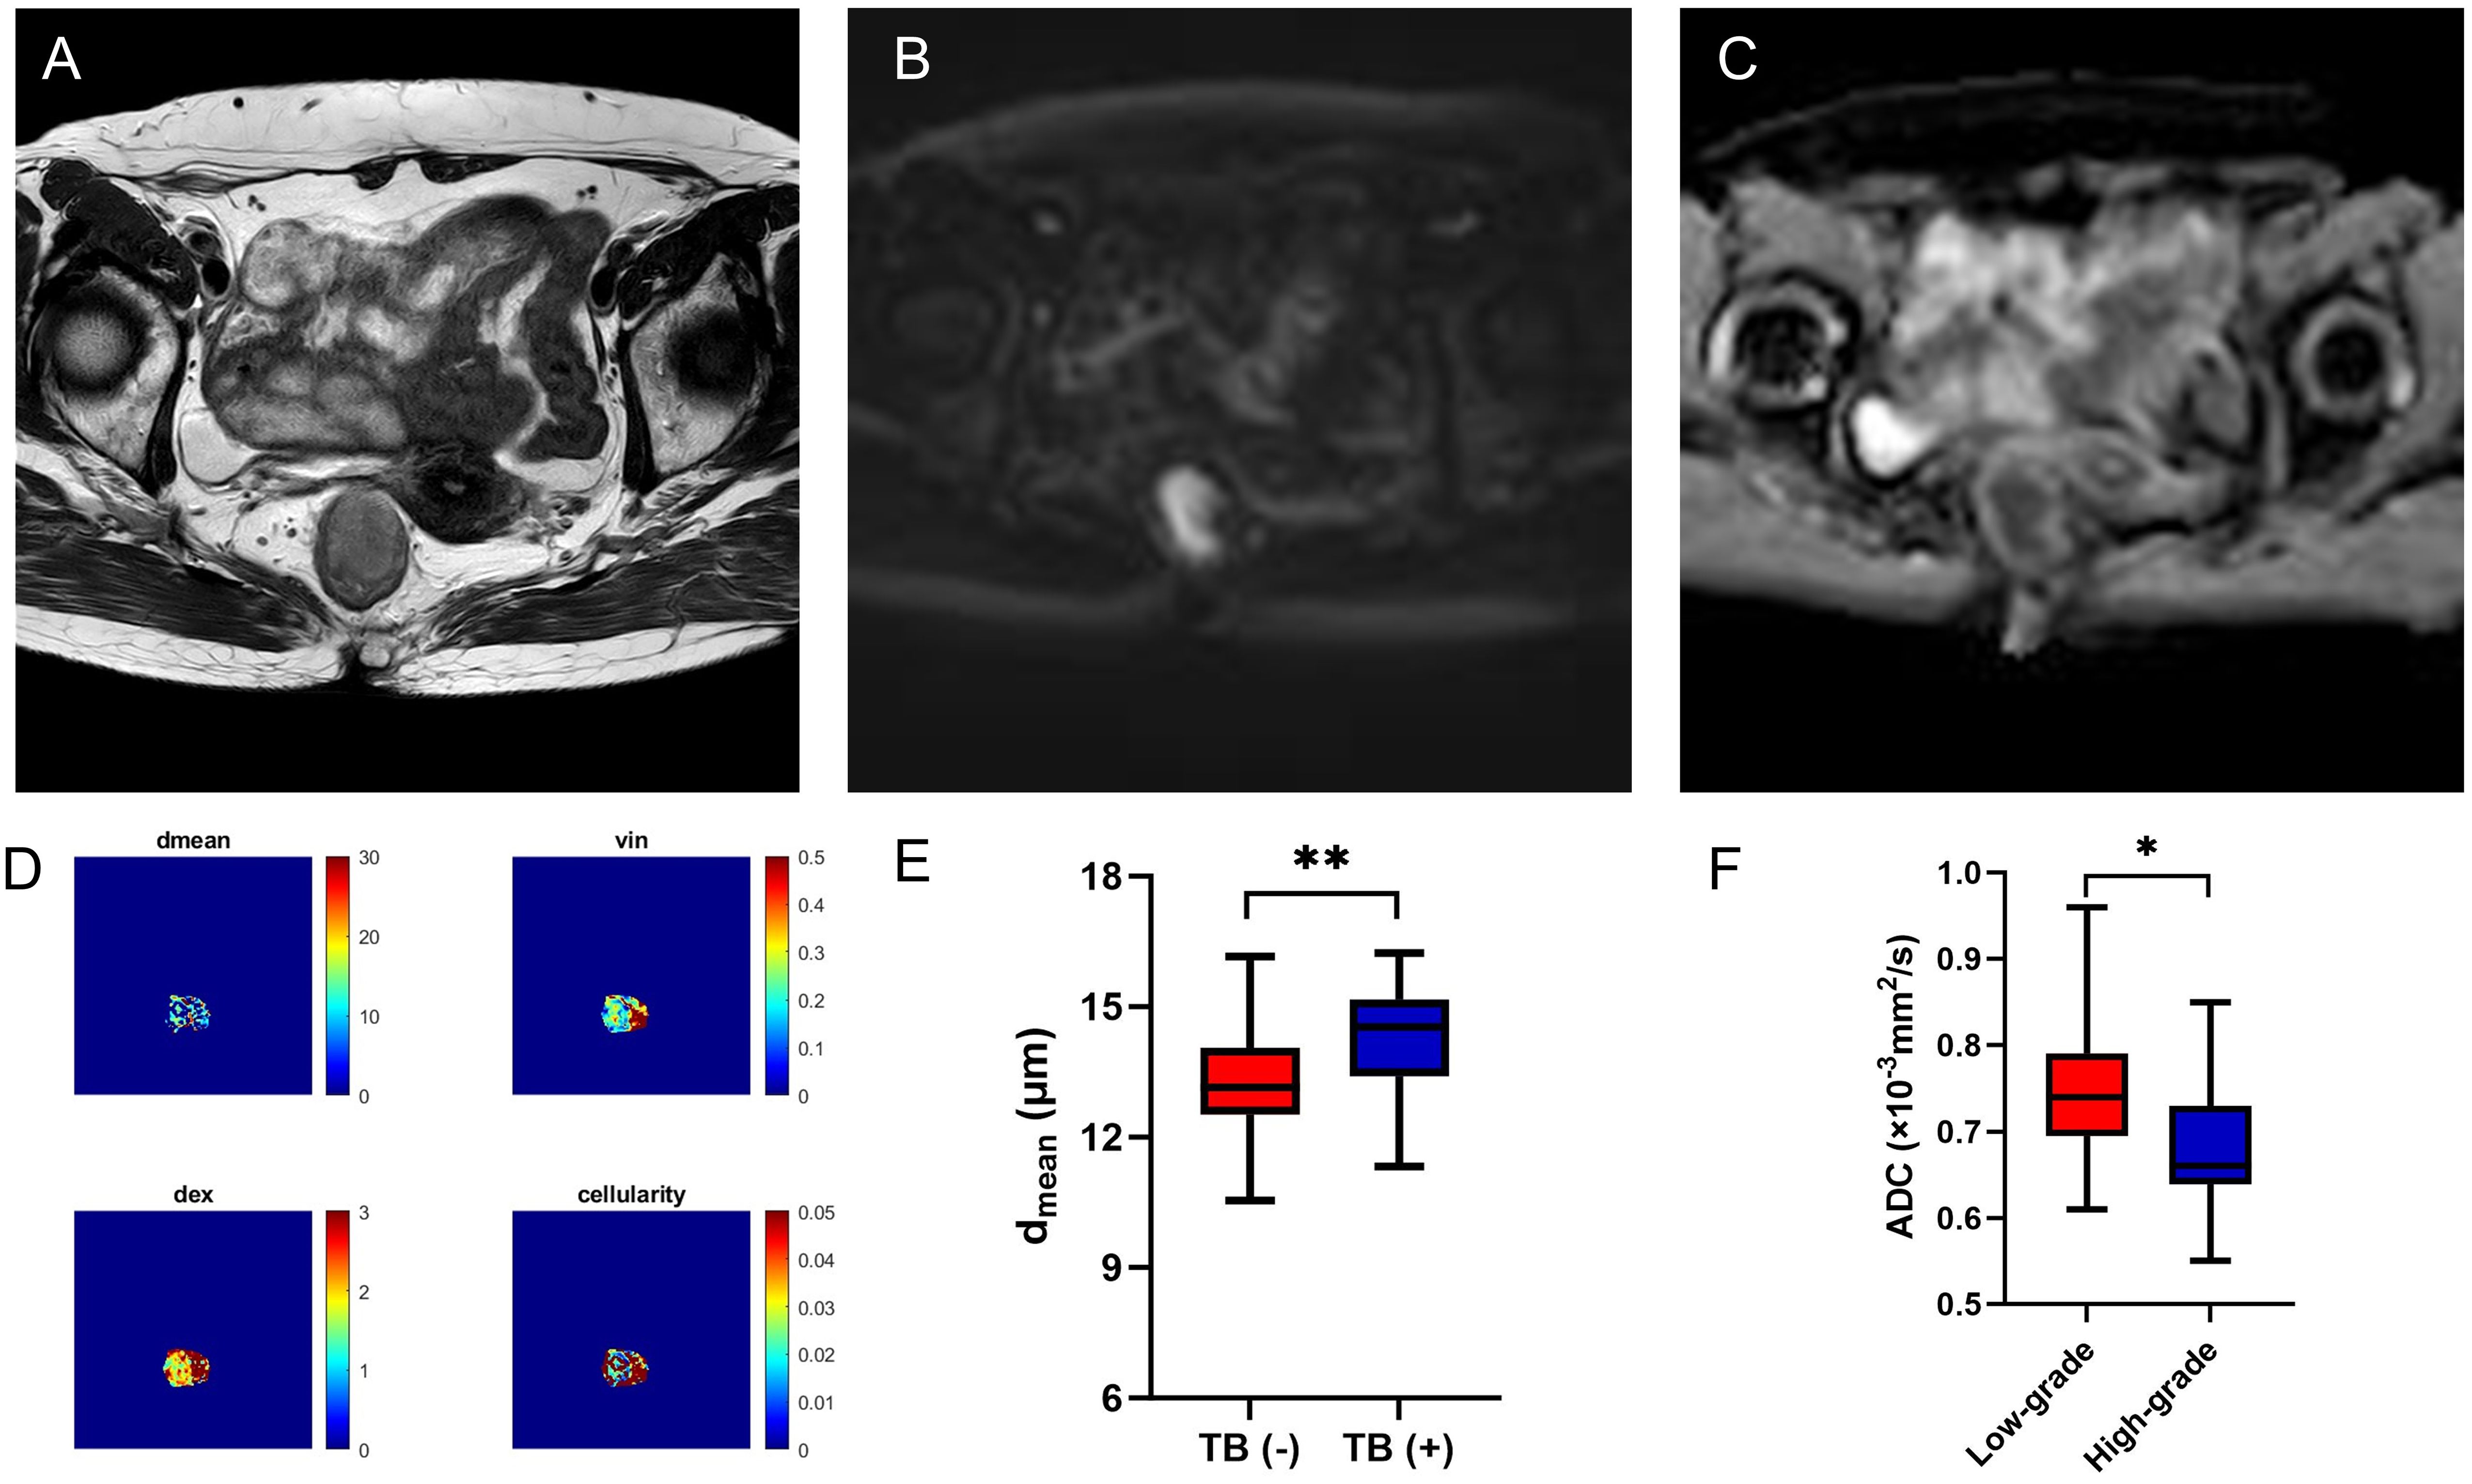
Figure 4. A 56-year-old female with AC. Oblique axial T2WI shows a mass with a slight high-intensity signal in the rectum (A); The mass showed high signal on DWI (B) and obviously low-intensity signal on ADC map (C); The dmean, vin, dex, cellularity and ADC values (ADCPGSE, ADC17Hz, and ADC33Hz) were 14.0769 μm, 0.2781, 1.8814 μm2/ms, 2.1481×10⁻², 0.8677×10⁻³ mm2/s, 1.2180×10⁻³ mm2/s, and 1.7120×10⁻³ mm2/s, respectively (D). Box plots of dmean between negative and positive TB of AC (E). Box plots of ADC of conventional DWI between low-grade and high-grade of AC (F). AC, adenocarcinoma; T2WI, T2 weighted imaging; DWI, diffusion weighted imaging; ADC, apparent diffusion coefficient; TB, tumor budding; *P < 0.05; **P < 0.01
3.5 Comparison of ROC curves
The area under the curves (AUCs) for distinguishing malignant from benign lesions using the vin, dex, cellularity, and ADC values (ADCPGSE, ADC17Hz, and ADC of conventional DWI) were 0.803, 0.757, 0.948, 0.807, 0.908 and 0.905,respectively (Figures 5A, D). The AUCs of vin, dex, cellularity, and ADC values (ADCPGSE, ADC17Hz, ADC33Hz, and ADC of conventional DWI) for distinguishing AC from MC were 0.887, 0.802, 0.906, 0.896, 0.896, 0.781 and 0.991, respectively (Figures 5B, E). The AUC of the dmean for evaluating TB status was 0.726 (Figure 5C). The AUC of ADC from conventional DWI for evaluating WHO grade was 0.739 (Figure 5F). The diagnostic performance and optimal diagnostic cut-off values were shown in Table 6.
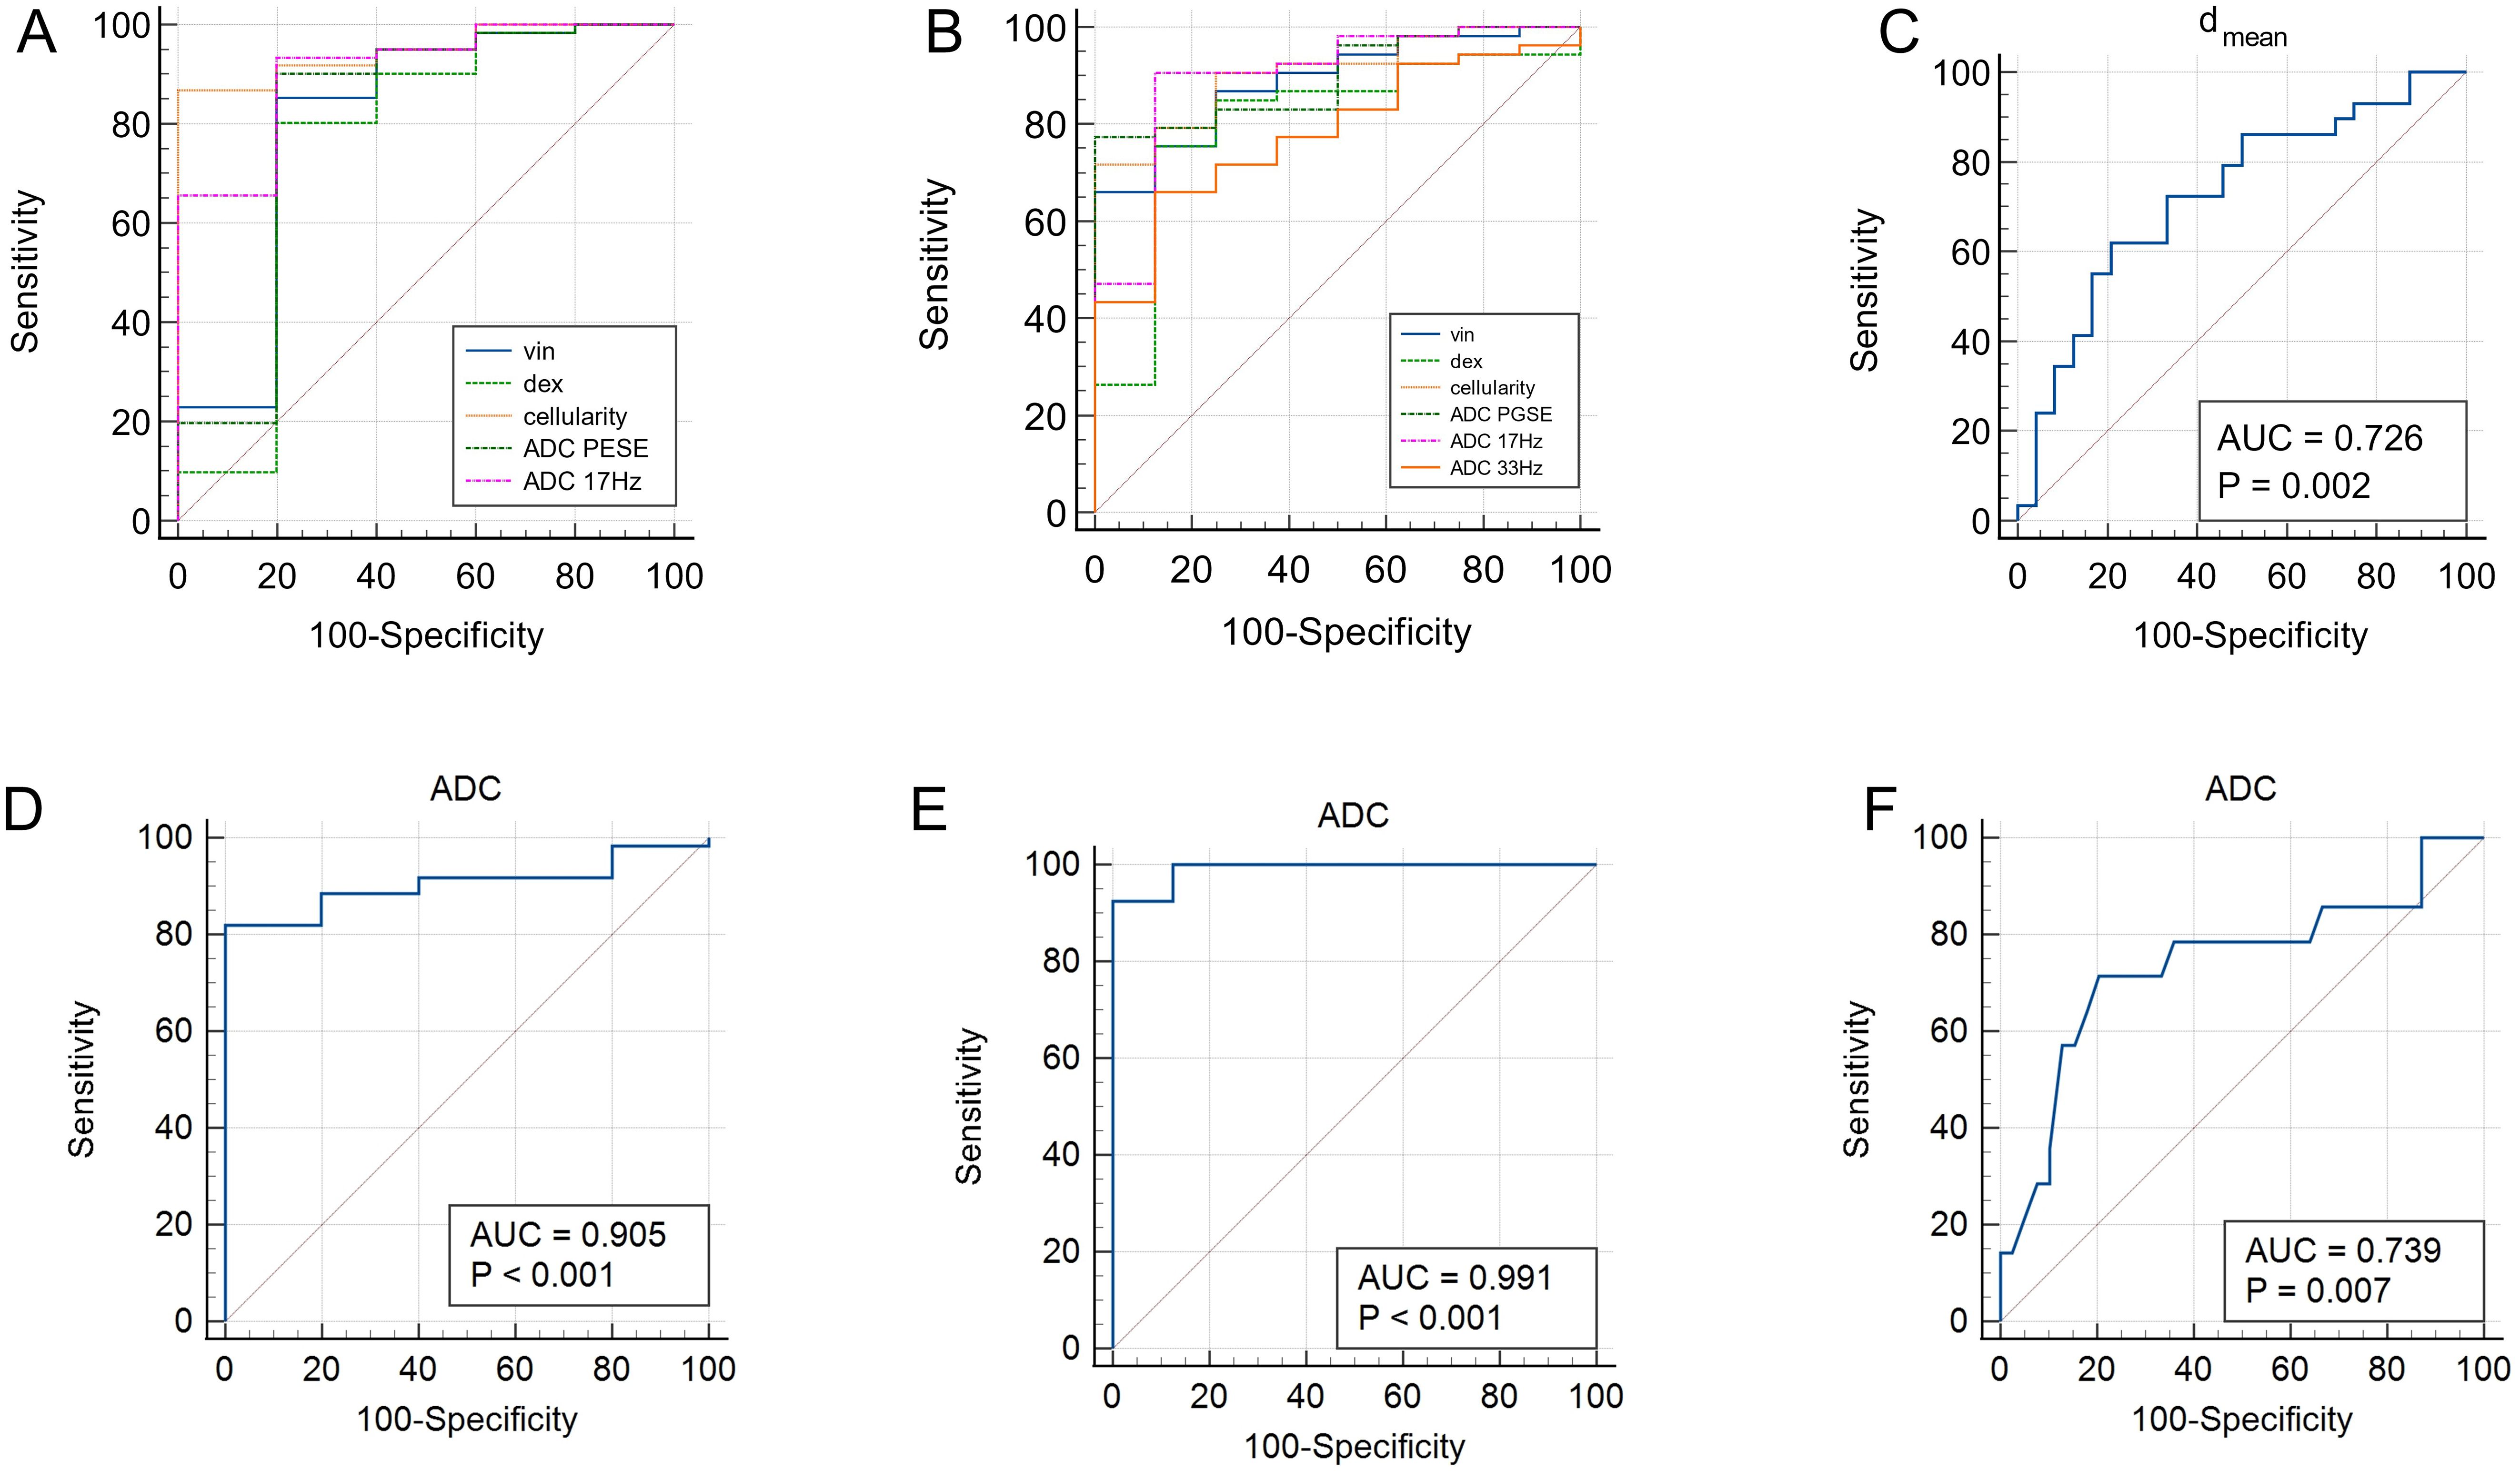
Figure 5. ROC curves of vin, dex, cellularity and ADC values (ADCPGSE and ADC17Hz) for discrimination between malignant and benign lesions (A); ROC curves of vin, dex, cellularity and ADC values (ADCPGSE, ADC17Hz, and ADC33Hz) for discrimination between AC and MC (B); ROC curve of dmean for discrimination between positive and negative TB (C). ROC curves of ADC values (conventional DWI) for distinguishing malignant and benign lesions (D), AC and MC (E), low-grade and high-grade of AC (F). ADC, apparent diffusion coefficient; AC, adenocarcinoma; MC, mucinous adenocarcinoma; TB, tumor budding.
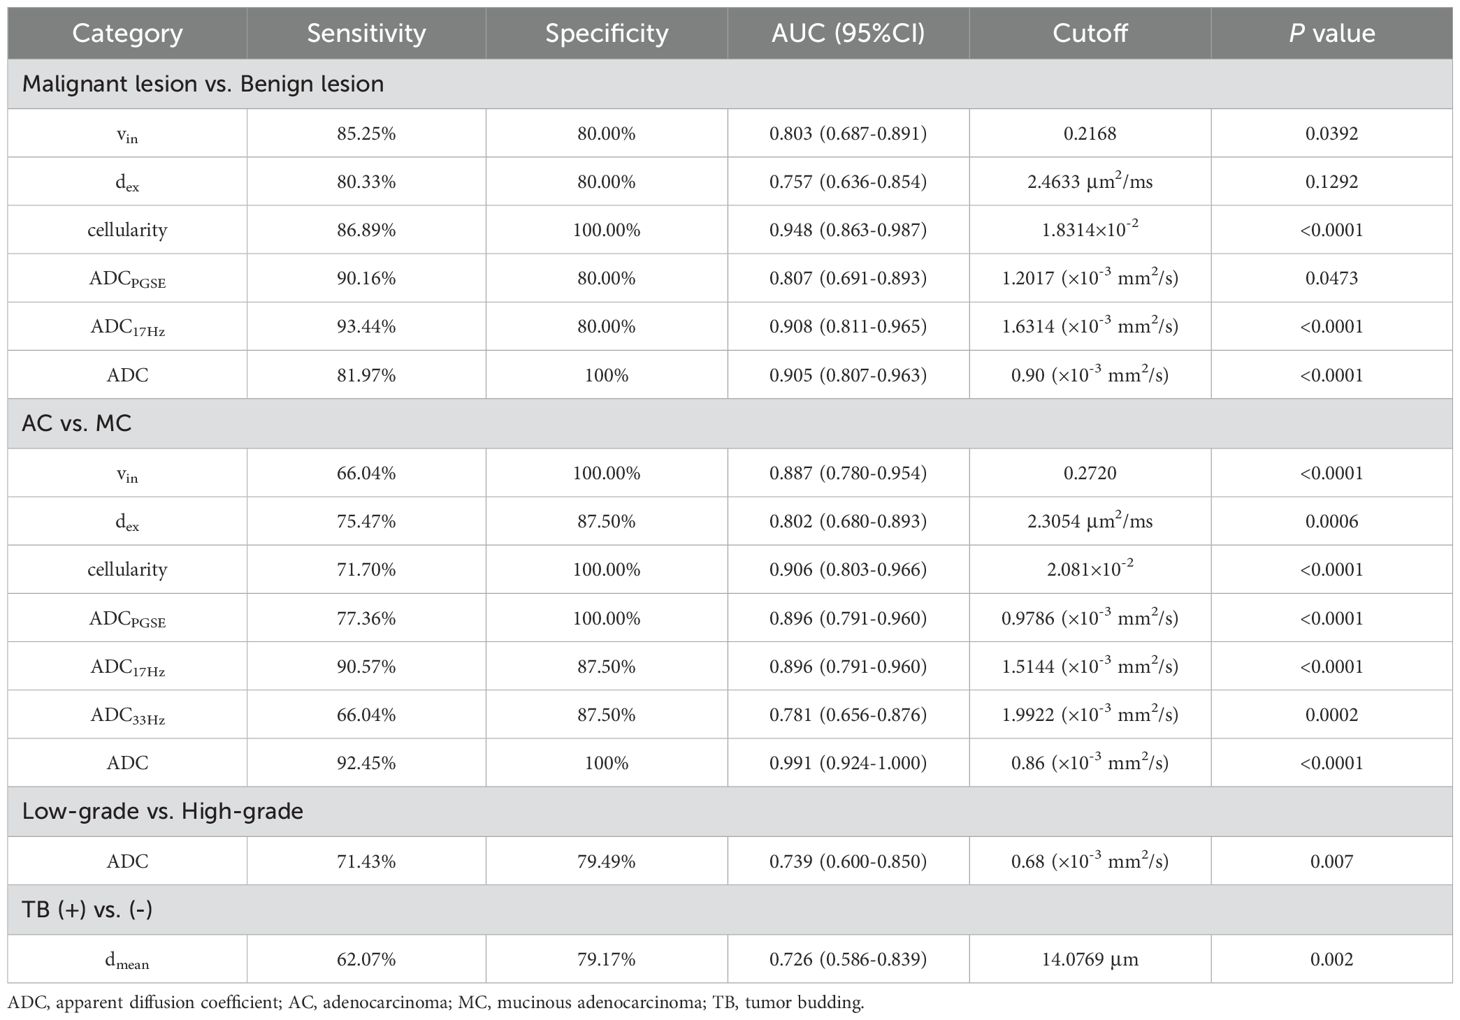
Table 6. Diagnostic performance of dmean, vin, dex, cellularity and ADC values (ADCPGSE, ADC17Hz, ADC33Hz, and ADC of conventional DWI) between different groups.
4 Discussion
CRC showed an upward trend and have been one of the leading cancer types in China (12). Preoperative diagnosis of rectal cancer is extremely important for the prognosis of patients, especially the early diagnosis of benign and malignant rectal lesions. However, conventional MRI was unable to differentiate adenomas from adenocarcinomas demonstrated a potential risk for overstaging and consequently overtreatment (13). Jia et al. found that IVIM-DWI could predict rectal adenomas with canceration in a previous study (4), and the ADC value was significantly lower in the cancerous group than in the adenoma group. The recently developed td-dMRI technique has shown unique advantages in various diseases. A study by Lima et al. demonstrated that significantly lower ADC values were observed in malignant compared with benign head and neck tumors scanned using both OGSE and PGSE sequences (14). Ejima F et al. found that ADCOGSE/ADCPGSE was significantly and strongly correlated with histological grade, FIGO stage, and prognostic risk classification in uterine endometrial cancer (15). In the present study, we investigated whether the ADC values derived from OGSE and PGSE sequences and the microstructural features quantified by the IMPULSED method could be helpful for the diagnosis of rectal lesion. The scan process went smoothly for all patients, and had no additional burden on patients. Our preliminary results illustrated that the vin, dex, cellularity and ADC values can be used to differentiate malignant and benign lesions. In our study, the vin and cellularity in malignant lesion were significantly higher, the dex and ADC values were significantly lower. The changes of ADC were in accordance with the reported literature. This may be related to the increase in the volume and nuclear cytoplasmic ratio of cancer cells, resulting the limitation of dispersion of intracellular and extracellular water molecules.
MC is a specific rectal cancer subtype, and it is defined by the World Health Organization (WHO) as an adenocarcinoma in which at least 50% of the extracellular space is occupied by mucin. In large population-based studies, the MC accounts for 10–15% of rectal cancer (16). MC is more prone to local recurrence (17) and metastasizes to lymph nodes (18). Therefore, it is important to differentiate MC from AC. However, distinguishing MC from AC by the subjective judgment of radiologists is difficult. Several new MRI techniques have been used to evaluate the pathological features of rectal cancer. Some studies found that the APT SI, T1 relaxation time, and ADC value of MC were significantly higher than those of AC (19, 20). Zhang et al. explored the value of T2 mapping and DWI in MC, and the results showed that patients with MC had higher T2 and ADC values than non-MC (3). Diffusion kurtosis imaging (DKI) was considered as a more valuable imaging biomarker than conventional DWI for differentiating MC from AC, and the AUCs of MK, MD and ADC for distinguishing MC from AC were 0.97, 0.95 and 0.88 (21). In our study cohort, the microstructural index of vin and cellularity of rectal AC were significantly higher than MC, while dex and ADC values were lower in AC. We considered that these results were consistent with the component of MC, owing to its low cellular density and high amounts of water molecules, especially extracellular water. The AUCs for distinguishing AC from MC using vin, dex, cellularity, ADCPESE, ADC17Hz, ADC33Hz and ADC of conventional DWI were 0.887, 0.802, 0.906, 0.896, 0.896, 0.781 and 0.905, indicating high sensitivity and specificity.
The histological grade, tumor stage and lymph node metastasis are important factors in the selection of treatment plans and prognostic predictions for patients with rectal cancer. Some studies found that the ADC value by conventional DWI was not effective in determining T stages, N stages, or WHO grades of rectal cancer (5, 22). However, Ge et al. found that the mean T2 and ADC values for metastatic lymph nodes were significantly lower than for benign lymph nodes in patients with non-mucinous rectal adenocarcinoma (23). Chen et al. found that the APT SI was significantly higher in rectal tumors with high grade, T3 stage, and lymph node involvement (24). In our study, ADC value of conventional DWI was higher in low-grade group, and the AUC for evaluating WHO grade was 0.739. No significant differences in dmean, vin, dex, cellularity, and other ADC values was observed in the subgroups of different histological grade, T and N stages, which may because the differences in tumor microenvironments were insufficient to cause significant changes or due to the limited sample size. In addition, metastatic lymph nodes were not evaluated separately in the present study, whether parameters from td-MRI can predict lymph node status needs more relevant research.
Recently, there is an increasing interest in PNI and LVI as a potential route of tumor spread, in addition to the well-known routes of direct extension, lymphatic metastasis, and hematogenous metastasis (25, 26). PNI is defined as the biological process characterized by cancer cells invading the nerves and spreading along the nerve sheaths. Recent advances in radiomics have been used to predict PNI status in rectal cancer (27–30), which demonstrating a good predictive effect, but the results lacked generalizability. Zhang et al. investigated the value of the pre-operative amide proton transfer-weighted (APTw) MRI to assess the prognostic factors in rectal adenocarcinoma, and they found PNI positive APTw signal intensities were higher than non-PNI group (31). LVI refers to tumor cells distributed in the endothelial lumen or destroying the corresponding lymphatic or vascular walls, which is considered a gateway to local spread or distant metastasis of cancer cells. Several studies using IVIM have been shown to be useful for in detecting LVI, but the diagnostic efficiency was limited (32, 33). We attempt to explore the value of IMPULSED MRI in predicting the status of PNI and LVI. However, there was no significant differences in positive and negative groups. The preoperative prediction of PNI and LVI status is still challenging and needs further study.
TB, as a process of epithelial-mesenchymal transition in tumors, refers to the presence of scattered tumor cells or small clusters of tumor cells with poor differentiation at the invasive front of the tumor, observed under high-power microscopy. TB was a strong negative prognostic predictor of survival in rectal cancer patients after neoadjuvant therapy (34). Qu et al. found that radiomics model based on MR T2WI could provide an effective and noninvasive method for preoperative TB grading assessment in patients with rectal cancer (35). Peng et al. assessed TB in rectal cancer using multiparameter MRI radiomics, and the AUC of the combined model was 0.961 and 0.891 in the training and validation cohorts, respectively (36). In our research, the dmean showed high discriminative power in separating TB status in AC. The AUC of the dmean for evaluating TB status was 0.726, indicating the potential value of the IMPULSED method for the noninvasive microstructural feature in rectal tumor.
However, the current study has some limitations. Firstly, this study was conducted at a single center and used a single MRI system. Secondly, our sample size was not large enough, which limited the diagnostic accuracy. Thirdly, we manually drew the region of interest (ROI), which may have a certain selection bias and cannot guarantee that necrotic and cystic tissues were completely free from ROI. Larger sample sizes and multicenter study are needed in the future to confirm the clinical value.
5 Conclusion
In summary, our study demonstrated that cellular microstructural mapping by the IMPULSED method were helpful in differentiating malignant and benign rectal lesions, and distinguishing AC from MC. The dmean showed high discriminative power in predicting TB status of AC.
Data availability statement
The original contributions presented in the study are included in the article/supplementary material. Further inquiries can be directed to the corresponding author.
Ethics statement
The studies involving humans were approved by Ethics Committee of the First Affiliated Hospital of Zhengzhou University. The studies were conducted in accordance with the local legislation and institutional requirements. The participants provided their written informed consent to participate in this study.
Author contributions
PK: Data curation, Formal analysis, Funding acquisition, Investigation, Writing – original draft, Writing – review & editing. LL: Data curation, Software, Writing – review & editing. YL: Writing – review & editing. HQ: Writing – review & editing. KZ: Data curation, Writing – review & editing. WZ: Data curation, Writing – review & editing. JL: Writing – review & editing. YZ: Supervision, Writing – review & editing. JC: Supervision, Writing – review & editing.
Funding
The author(s) declare that financial support was received for the research, authorship, and/or publication of this article. This study has received funding by science and technology research plan of Henan Provincial Health Commission (Joint construction project, LHGJ20220407).
Conflict of interest
Author LL is employed by Philips Healthcare.
The remaining authors declare that the research was conducted in the absence of any commercial or financial relationships that could be construed as a potential conflict of interest.
Generative AI statement
The author(s) declare that no Generative AI was used in the creation of this manuscript.
Publisher’s note
All claims expressed in this article are solely those of the authors and do not necessarily represent those of their affiliated organizations, or those of the publisher, the editors and the reviewers. Any product that may be evaluated in this article, or claim that may be made by its manufacturer, is not guaranteed or endorsed by the publisher.
References
1. Sung H, Ferlay J, Siegel RL, Laversanne M, Soerjomataram I, Jemal A, et al. Global cancer statistics 2020: GLOBOCAN estimates of incidence and mortality worldwide for 36 cancers in 185 countries. CA Cancer J Clin. (2021) 71:209–49. doi: 10.3322/caac.21660
2. Siegel RL, Wagle NS, Cercek A, Smith RA, Jemal A. Colorectal cancer statistics, 2023. CA Cancer J Clin. (2023) 73:233–54. doi: 10.3322/caac.21772
3. Zhang J, Ge Y, Zhang H, Wang Z, Dou W, Hu S. Quantitative T2 mapping to discriminate mucinous from nonmucinous adenocarcinoma in rectal cancer: comparison with diffusion-weighted imaging. Magn Reson Med Sci. (2022) 21:593–98. doi: 10.2463/mrms.mp.2021-0067
4. Jia Y, Song G, Wu R, Hong Y, Dou W, Li A. Intravoxel incoherent motion DWI with different mathematical models in predicting rectal adenoma with and without canceration. Eur J Radiol. (2022) 155:110496. doi: 10.1016/j.ejrad.2022.110496
5. Zhu L, Pan Z, Ma Q, Yang W, Shi H, Fu C, et al. Diffusion kurtosis imaging study of rectal adenocarcinoma associated with histopathologic prognostic factors: preliminary findings. Radiology. (2017) 284:66–76. doi: 10.1148/radiol.2016160094
6. Colakoglu Er H, Erden A. Mean ADC values discriminate rectal mucinous carcinomafrom rectal nonmucinous adenocarcinoma. Turk J Med Sci. (2017) 47:1520–25. doi: 10.3906/sag-1609-59
7. Jiang X, Li H, Devan SP, Gore JC, Xu J. MR cell size imaging with temporal diffusion spectroscopy. Magn Reson Imaging. (2021) 77:109–23. doi: 10.1016/j.mri.2020.12.010
8. Jiang X, Li H, Xie J, McKinley ET, Zhao P, Gore JC, et al. In vivo imaging of cancer cell size and cellularity using temporal diffusion spectroscopy. Magn Reson Med. (2017) 78:156–64. doi: 10.1002/mrm.26356
9. Xu J, Jiang X, Li H, Arlinghaus LR, McKinley ET, Devan SP, et al. Magnetic resonance imaging of mean cell size in human breast tumors. Magn Reson Med. (2020) 83:2002–14. doi: 10.1002/mrm.28056
10. Wu D, Jiang K, Li H, Zhang Z, Ba R, Zhang Y, et al. Time-dependent diffusion MRI for quantitative microstructural mapping of prostate cancer. Radiology. (2022) 303:578–87. doi: 10.1148/radiol.211180
11. Zhang H, Liu K, Ba R, Zhang Z, Zhang Y, Chen Y, et al. Histological and molecular classifications of pediatric glioma with time-dependent diffusion MRI-based microstructural mapping. Neuro Oncol. (2023) 25:1146–56. doi: 10.1093/neuonc/noad003
12. He S, Xia C, Li H, Cao M, Yang F, Yan X, et al. Cancer profiles in China and comparisons with the USA: a comprehensive analysis in the incidence, mortality, survival, staging, and attribution to risk factors. Sci China Life Sci. (2024) 67:122–31. doi: 10.1007/s11427-023-2423-1
13. Waage JE, Leh S, Rosler C, Pfeffer F, Bach SP, Havre RF, et al. Endorectal ultrasonography, strain elastography and MRI differentiation of rectal adenomas and adenocarcinomas. Colorectal Dis. (2015) 17:124–31. doi: 10.1111/codi.12845
14. Iima M, Yamamoto A, Kataoka M, Yamada Y, Omori K, Feiweier T, et al. Time-dependent diffusion MRI to distinguish Malignant from benign head and neck tumors. J Magn Reson Imaging. (2019) 50:88–95. doi: 10.1002/jmri.26578
15. Ejima F, Fukukura Y, Kamimura K, Nakajo M, Ayukawa T, Kanzaki F, et al. Oscillating gradient diffusion-weighted MRI for risk stratification of uterine endometrial cancer. J Magn Reson Imaging. (2024) 60:67–77. doi: 10.1002/jmri.29106
16. Kang H, O’Connell JB, Maggard MA, Sack J, Ko CY. A 10-year outcomes evaluation of mucinous and signet-ring cell carcinoma of the colon and rectum. Dis Colon Rectum. (2005) 48:1161–8. doi: 10.1007/s10350-004-0932-1
17. Hugen N, van de Velde CJ, Bosch SL, Futterer JJ, Elferink MA, Marijnen CA, et al. Modern treatment of rectal cancer closes the gap between common adenocarcinoma and mucinous carcinoma. Ann Surg Oncol. (2015) 22:2669–76. doi: 10.1245/s10434-014-4339-5
18. Nozoe T, Anai H, Nasu S, Sugimachi K. Clinicopathological characteristics of mucinous carcinoma of the colon and rectum. J Surg Oncol. (2000) 75:103–7. doi: 10.1002/1096-9098(200010)75:2<103::aid-jso6>3.0.co;2-c
19. Li J, Gao X, Dominik Nickel M, Cheng J, Zhu J. Native T1 mapping for differentiating the histopathologic type, grade, and stage of rectal adenocarcinoma: a pilot study. Cancer Imaging. (2022) 22:30. doi: 10.1186/s40644-022-00461-7
20. Li J, Lin L, Gao X, Li S, Cheng J. Amide proton transfer weighted and intravoxel incoherent motion imaging in evaluation of prognostic factors for rectal adenocarcinoma. Front Oncol. (2021) 11:783544. doi: 10.3389/fonc.2021.783544
21. Wen Z, Chen Y, Yang X, Lu B, Liu Y, Shen B, et al. Application of magnetic resonance diffusion kurtosis imaging for distinguishing histopathologic subtypes and grades of rectal carcinoma. Cancer Imaging. (2019) 19:8. doi: 10.1186/s40644-019-0192-x
22. Yuan Y, Pu H, Chen GW, Chen XL, Liu YS, Liu H, et al. Diffusion-weighted MR volume and apparent diffusion coefficient for discriminating lymph node metastases and good response after chemoradiation therapy in locally advanced rectal cancer. Eur Radiol. (2021) 31:200–11. doi: 10.1007/s00330-020-07101-3
23. Ge YX, Hu SD, Wang Z, Guan RP, Zhou XY, Gao QZ, et al. Feasibility and reproducibility of T2 mapping and DWI for identifying Malignant lymph nodes in rectal cancer. Eur Radiol. (2021) 31:3347–54. doi: 10.1007/s00330-020-07359-7
24. Chen W, Li L, Yan Z, Hu S, Feng J, Liu G, et al. Three-dimension amide proton transfer MRI of rectal adenocarcinoma: correlation with pathologic prognostic factors and comparison with diffusion kurtosis imaging. Eur Radiol. (2021) 31:3286–96. doi: 10.1007/s00330-020-07397-1
25. Kim YI, Kim CW, Kim JH, Kim J, Ro JS, Lee JL, et al. Clinical implication of perineural and lymphovascular invasion in rectal cancer patients who underwent surgery after preoperative chemoradiotherapy. Dis Colon Rectum. (2022) 65:1325–34. doi: 10.1097/DCR.0000000000002219
26. Song JH, Yu M, Kang KM, Lee JH, Kim SH, Nam TK, et al. Significance of perineural and lymphovascular invasion in locally advanced rectal cancer treated by preoperative chemoradiotherapy and radical surgery: Can perineural invasion be an indication of adjuvant chemotherapy? Radiother Oncol. (2019) 133:125–31. doi: 10.1016/j.radonc.2019.01.002
27. Yang YS, Qiu YJ, Zheng GH, Gong HP, Ge YQ, Zhang YF, et al. High resolution MRI-based radiomic nomogram in predicting perineural invasion in rectal cancer. Cancer Imaging. (2021) 21:40. doi: 10.1186/s40644-021-00408-4
28. Guo Y, Wang Q, Guo Y, Zhang Y, Fu Y, Zhang H. Preoperative prediction of perineural invasion with multi-modality radiomics in rectal cancer. Sci Rep. (2021) 11:9429. doi: 10.1038/s41598-021-88831-2
29. Liu Y, Sun BJ, Zhang C, Li B, Yu XX, Du Y. Preoperative prediction of perineural invasion of rectal cancer based on a magnetic resonance imaging radiomics model: A dual-center study. World J Gastroenterol. (2024) 30:2233–48. doi: 10.3748/wjg.v30.i16.2233
30. Zhang Y, Peng J, Liu J, Ma Y, Shu Z. Preoperative prediction of perineural invasion status of rectal cancer based on radiomics nomogram of multiparametric magnetic resonance imaging. Front Oncol. (2022) 12:828904. doi: 10.3389/fonc.2022.828904
31. Zhang C, Chen J, Liu Y, Yang Y, Xu Y, You R, et al. Amide proton transfer-weighted MRI for assessing rectal adenocarcinoma T-staging and perineural invasion: a prospective study. Eur Radiol. (2024). doi: 10.1007/s00330-024-11000-2
32. Wong C, Liu T, Zhang C, Li M, Zhang H, Wang Q, et al. Preoperative detection of lymphovascular invasion in rectal cancer using intravoxel incoherent motion imaging based on radiomics. Med Phys. (2024) 51:179–91. doi: 10.1002/mp.16821
33. Li H, Chen GW, Liu YS, Pu H, Yin LL, Hou NY, et al. Assessment of histologic prognostic factors of resectable rectal cancer: comparison of diagnostic performance using various apparent diffusion coefficient parameters. Sci Rep. (2020) 10:11554. doi: 10.1038/s41598-020-68328-0
34. Trotsyuk I, Sparschuh H, Muller AJ, Neumann K, Kruschewski M, Horst D, et al. Tumor budding outperforms ypT and ypN classification in predicting outcome of rectal cancer after neoadjuvant chemoradiotherapy. BMC Cancer. (2019) 19:1033. doi: 10.1186/s12885-019-6261-5
35. Qu X, Zhang L, Ji W, Lin J, Wang G. Preoperative prediction of tumor budding in rectal cancer using multiple machine learning algorithms based on MRI T2WI radiomics. Front Oncol. (2023) 13:1267838. doi: 10.3389/fonc.2023.1267838
Keywords: rectal lesion, adenocarcinoma, magnetic resonance imaging, diffusion, microstructure
Citation: Kou P, Lin L, Li Y, Qin H, Zhang K, Zhang W, Li J, Zhang Y and Cheng J (2025) Application of cellular microstructural diffusion MRI (cell size imaging) in rectal lesions: a preliminary study. Front. Oncol. 15:1535271. doi: 10.3389/fonc.2025.1535271
Received: 27 November 2024; Accepted: 15 January 2025;
Published: 03 February 2025.
Edited by:
Zexian Liu, Sun Yat-sen University Cancer Center (SYSUCC), ChinaReviewed by:
Xianchun Zeng, Guizhou Provincial People’s Hospital, ChinaFubi Hu, First Affiliated Hospital of Chengdu Medical College, China
Copyright © 2025 Kou, Lin, Li, Qin, Zhang, Zhang, Li, Zhang and Cheng. This is an open-access article distributed under the terms of the Creative Commons Attribution License (CC BY). The use, distribution or reproduction in other forums is permitted, provided the original author(s) and the copyright owner(s) are credited and that the original publication in this journal is cited, in accordance with accepted academic practice. No use, distribution or reproduction is permitted which does not comply with these terms.
*Correspondence: Jingliang Cheng, ZmNjY2hlbmdqbEB6enUuZWR1LmNu