 Xiaoli Xiao1†
 Guo-Qing Li
 Yanping Liu
- 1Hunan Provincial Key Laboratory of Basic and Clinical Pharmacological Research of Gastrointestinal Cancer, Department of Gastroenterology, the Second Affiliated Hospital, Hengyang Medical School, University of South China, Hengyang, Hunan, China
- 2Department of Gastroenterology, the First Affiliated Hospital of Shaoyang University, Shaoyang, Hunan, China
- 3Department of Hepatobiliary and Pancreatic Surgery, Second Affiliated Hospital, University of South China, Hengyang, Hunan, China
Background: Hepatocellular carcinoma (HCC) is a leading cause of cancer-related deaths with limited treatment options. Tumor metabolic disorder is elevated in HCC and activates the aryl hydrocarbon receptor (AHR), a transcription factor implicated in cancer progression. However, the role of AHR in regulating long non-coding RNAs (lncRNAs) and their impact on glycolipid metabolism remains underexplored.
Materials and methods: We investigated AHR’s influence on several HCC cell lines treated with the AHR ligand. RNA sequencing was performed to identify the differentially expressed (DE) lncRNAs and mRNAs. We analyzed the differences and then conducted functional pathway enrichment of the identified DE lncRNAs and mRNAs. Furthermore, we constructed co-expression networks of lncRNAs and mRNAs and performed survival analysis using The Cancer Genome Atlas (TCGA) data.
Results: RNA sequencing identified a substantial number of lncRNAs and mRNAs. DEG analysis identified the significant differences between them related to cancer progression, with pathways such as PI3K-Akt, VEGF, and PPAR signaling highlighted. A co-expression network was utilized to elucidate the lncRNA–mRNA interactions and their regulation of glycolipid metabolism.Survival analysis identified the AHR-regulated lncRNAs associated with poor prognosis, like ASAP1-IT1 and RMDN2-AS1.
Conclusion: This study clarifies AHR’s role in regulating gene expression and metabolism in HCC, revealing novel lncRNA biomarkers and potential therapeutic targets that could aid HCC. Further research is needed to explore AHR’s effects on the regulation of glucose-lipid metabolism in HCC.
Introduction
Hepatocellular carcinoma (HCC) is the most prevalent form of primary liver cancer and a leading cause of cancer-related mortality worldwide (1). It often arises from chronic liver diseases, such as hepatitis B or hepatitis C infections, alcohol abuse, metabolic syndrome, or exposure to aflatoxins. One pathway connecting chronic inflammation to cancer development is via activation of the aryl hydrocarbon receptor (AHR), a transcription factor that can be stimulated by both endogenous and exogenous ligands produced during inflammatory processes (2). Inflammation induces changes in cellular metabolism, and AHR contributes to the metabolic alterations in cancer cells by regulating glycolysis and lipid metabolism through its interactions with various ligands (3).
AHR, initially recognized for its role in mediating the toxic effects of environmental pollutants like dioxins, functions as a ligand-activated transcription factor. Upon ligand binding, AHR translocates to the nucleus, where it partners with the AHR nuclear translocator to regulate gene expression by binding to dioxin or aryl hydrocarbon response elements (4, 5). While AHR’s activation has been classically associated with responses to environmental toxins, recent reports have suggested that it also plays a significant role in cancer biology (6, 7). Specifically, AHR activation in HCC has been linked to key oncogenic processes, including cellular proliferation, migration, epithelial-to-mesenchymal transition, and resistance to apoptosis (8–11).
Despite the increasing knowledge about AHR’s impact on protein-coding genes in cancer, its regulation of long non-coding RNAs (lncRNAs) in HCC remains largely unexplored. LncRNAs are critical regulators of gene expression and are now being recognized for their roles in cancer, particularly in controlling pathways involved in tumor initiation, progression, and metastasis (12, 13). However, the specific gene signatures and pathways through which AHR modulates lncRNAs in HCC have yet to be fully elucidated.
To address this gap, our study investigated how AHR activation influences the expression of both lncRNAs and mRNAs in HCC cells. Using 6-formylindolo(3, 2-b)carbazole (FICZ), a potent AHR ligand, we activated AHR in three HCC cell lines and a human fetal hepatocyte line. By combining RNA sequencing with bioinformatics analysis, we were able to identify the AHR-regulated lncRNAs and mRNAs and then explored their involvement in the glucose-lipid metabolism related pathways of HCC. This study provides new insights into the role of AHR in HCC progression and highlights lncRNAs as potential therapeutic targets and biomarkers for HCC.
Materials and methods
Cell culture
The human hepatocellular carcinoma (HCC) cell lines Huh7, HepG2, and SMMC-7721, and human fetal hepatocyte line LO2 were cultured in DMEM (HCC lines) or RPMI-1640 (LO2). The HCC cell lines Huh7, HepG2, and SMMC-7721 were chosen because they originate from the liver cancer tissues of patients of different ages and with different etiologies, therefore potentially representing distinct histological subtypes of HCC. This diversity allows for a broader investigation of lipid metabolic abnormalities across varying HCC contexts and enhances the generalizability of the findings.
We conducted preliminary experiments with varying the concentration of FICZ (50, 100, 200, and 400 nM) and the treatment duration (12, 24, and 48 h). We found that the cells treated with 200 nM FICZ for 24 h showed the strongest expression of the AHR target genes TIPARP and CYP1A1 based on the qPCR results, justifying the choice of this condition for further study. Cells were grown to 70%–80% confluency and treated with various concentrations of FICZ (50, 100, 200, 400 nM; n=3) for 12 or 24 h. Based on the IC50 value, treatment with 200 nM FICZ for 24 h was chosen for the further experiments. Meanwhile the control groups were treated with DMSO.
Immunofluorescence assay
HCC or LO2 cells were cultured in 24-well dishes containing poly-L-lysine-treated coverslips. The cells were treated with either FICZ or DMSO for 24 h and then fixed with 4% paraformaldehyde (in phosphate-buffered saline, PBS) at room temperature for 15 min. After fixation, the cells were washed three times with PBS, for 5 minutes each wash. The coverslips were then permeabilized with 0.1% Triton X-100 in PBS for 15 min and subsequently blocked with 5% fetal bovine serum (FBS) to reduce non-specific binding. The cells were then incubated with a rabbit anti-AHR primary antibody (Abcam, 1:300 dilution) at 4°C overnight. Following the primary antibody incubation, the coverslips were washed three times with PBS containing 0.5% Tween 20 (PBST), for 5 min each wash. Next, cross-absorbed Alexa Fluor 488-conjugated goat anti-rabbit secondary antibody (ThermoFisher, 4 µg/mL) was then applied and the samples were incubated at room temperature for 1 h in the dark. After this secondary antibody incubation, the samples were washed three times with PBST, for 5 min each wash. Finally, the coverslips were mounted onto microscope slides using 20 μl ProLong Gold Antifade Mountant with DAPI (ThermoFisher) to stain the cell nuclei. After air drying, the samples were visualized under a fluorescence microscope.
RNA extraction and quantification
Total RNA was extracted from the treated cells and control cells using Trizol. After lysing the cells with Trizol, chloroform was added, and the aqueous phase was collected and precipitated with isopropanol. The obtained RNA was washed with ethanol, dissolved in DEPC water, and then stored at -80°C. The RNA purity and concentration were assessed using a NanoPhotometer® system and by gel electrophoresis.
RNA sequencing library preparation and sequencing
Total RNA samples were processed for preparation of the cDNA library, with sequencing performed by BGI Group using the Illumina HiSeq platform. Eight samples (three replicates each) were sequenced, generating an average of 10.17 Gb of data per sample with an average alignment rate of 88.77%. A total of 124,841 transcripts were identified, including 12,597 novel lncRNAs, 7,264 novel mRNAs, 69,206 known lncRNAs, and 35,774 known mRNAs.
RNA-seq alignment, annotation, and gene counting
Clean reads were aligned to the human reference genome (hg38, GRCh38) using HISAT2 (14). Transcripts were assembled with StringTie (15), and their coding potential was evaluated using CPC (16), txCdsPredict, and CNCI (17). Transcripts with coding potential and alignments with protein through Pfam-scan (18) were regarded as mRNAs; while the other transcripts were regarded as lncRNAs. The gene expression levels were quantified with RSEM. Functional annotation of the genes was performed using the GEO, Ensembl, NONCODE, and UCSC databases.
lncRNA-mRNA co-expression network construction
Potential lncRNA targets were predicted by constructing a co-expression network of lncRNAs and mRNAs. By calculating the Pearson correlation coefficient between known annotated lncRNAs and mRNAs, lncRNA–mRNA pairs were selected based on an absolute value of the correlation ≥ 0.9, and a significance threshold of p < 0.05. These selected pairs were used to construct the lncRNA–mRNA co-expression network. Data visualization was performed using Cytoscape.
Differentially expressed gene analysis
DEGs were identified using the limma package in R (19). Genes with significant expression changes (|fold change| ≥ 2, FDR ≤ 0.05) were selected. The DEG analysis included comparisons between the DMSO- and FICZ-treated groups across different cell lines. We applied a threshold fold change ≥ 2 and FDR ≤ 0.05 to maintain strong, reliable signals, as we found a lower fold-change cutoff would result in an overwhelming number of DEGs.
Functional pathway enrichment
Gene Ontology (GO) and Kyoto Encyclopedia of Genes and Genomes (KEGG) pathway enrichment analyses were performed using the R package clusterProfiler (20).
Quantitative reverse transcription PCR
For the reverse transcription, the RNA and primers were added to a PCR tube with a total volume of 10 µL. The mixture was incubated at 70°C for 10 min, and then quickly cooled on ice for 2 min. Subsequently, to the reaction mixture containing the RNA/primer denaturation solution, a 10 mM dNTP mixture and other reagents were added to obtain a total volume of 20 µL. The mixture was incubated at 42°C for 60 min, followed by 15 min at 72°C. The resulting cDNA was stored at -20°C for later use.
Next, the cDNA was diluted fivefold and mixed with forward and reverse primers, SYBR® Premix Ex Taq™ (Tli RNaseH Plus) (2×), in a total volume of 20 µL. The PCR reaction conditions were as follows: 95°C for 5 min; 95°C for 10 s, followed by 60°C for 34 s (when the fluorescence signal was collected), for 39 cycles. Melt curve analysis was performed by heating the mixture from 60°C to 95°C, with fluorescence measurements taken every minute.
The reaction mixture was loaded into a 96-well PCR plate and centrifuged to ensure the contents were well-settled at the bottom. The reactions were conducted using a Bio-Rad CFX96 real-time PCR system under the following conditions: 95°C for 2 min; 43 cycles at 95°C for 15 s; 58°C for 5 s; and 72°C for 20 s. Fluorescence data were collected at the 72°C step for each cycle.
The primers were designed using PRIMER5 software or the NCBI online tool and are listed in Table 1.
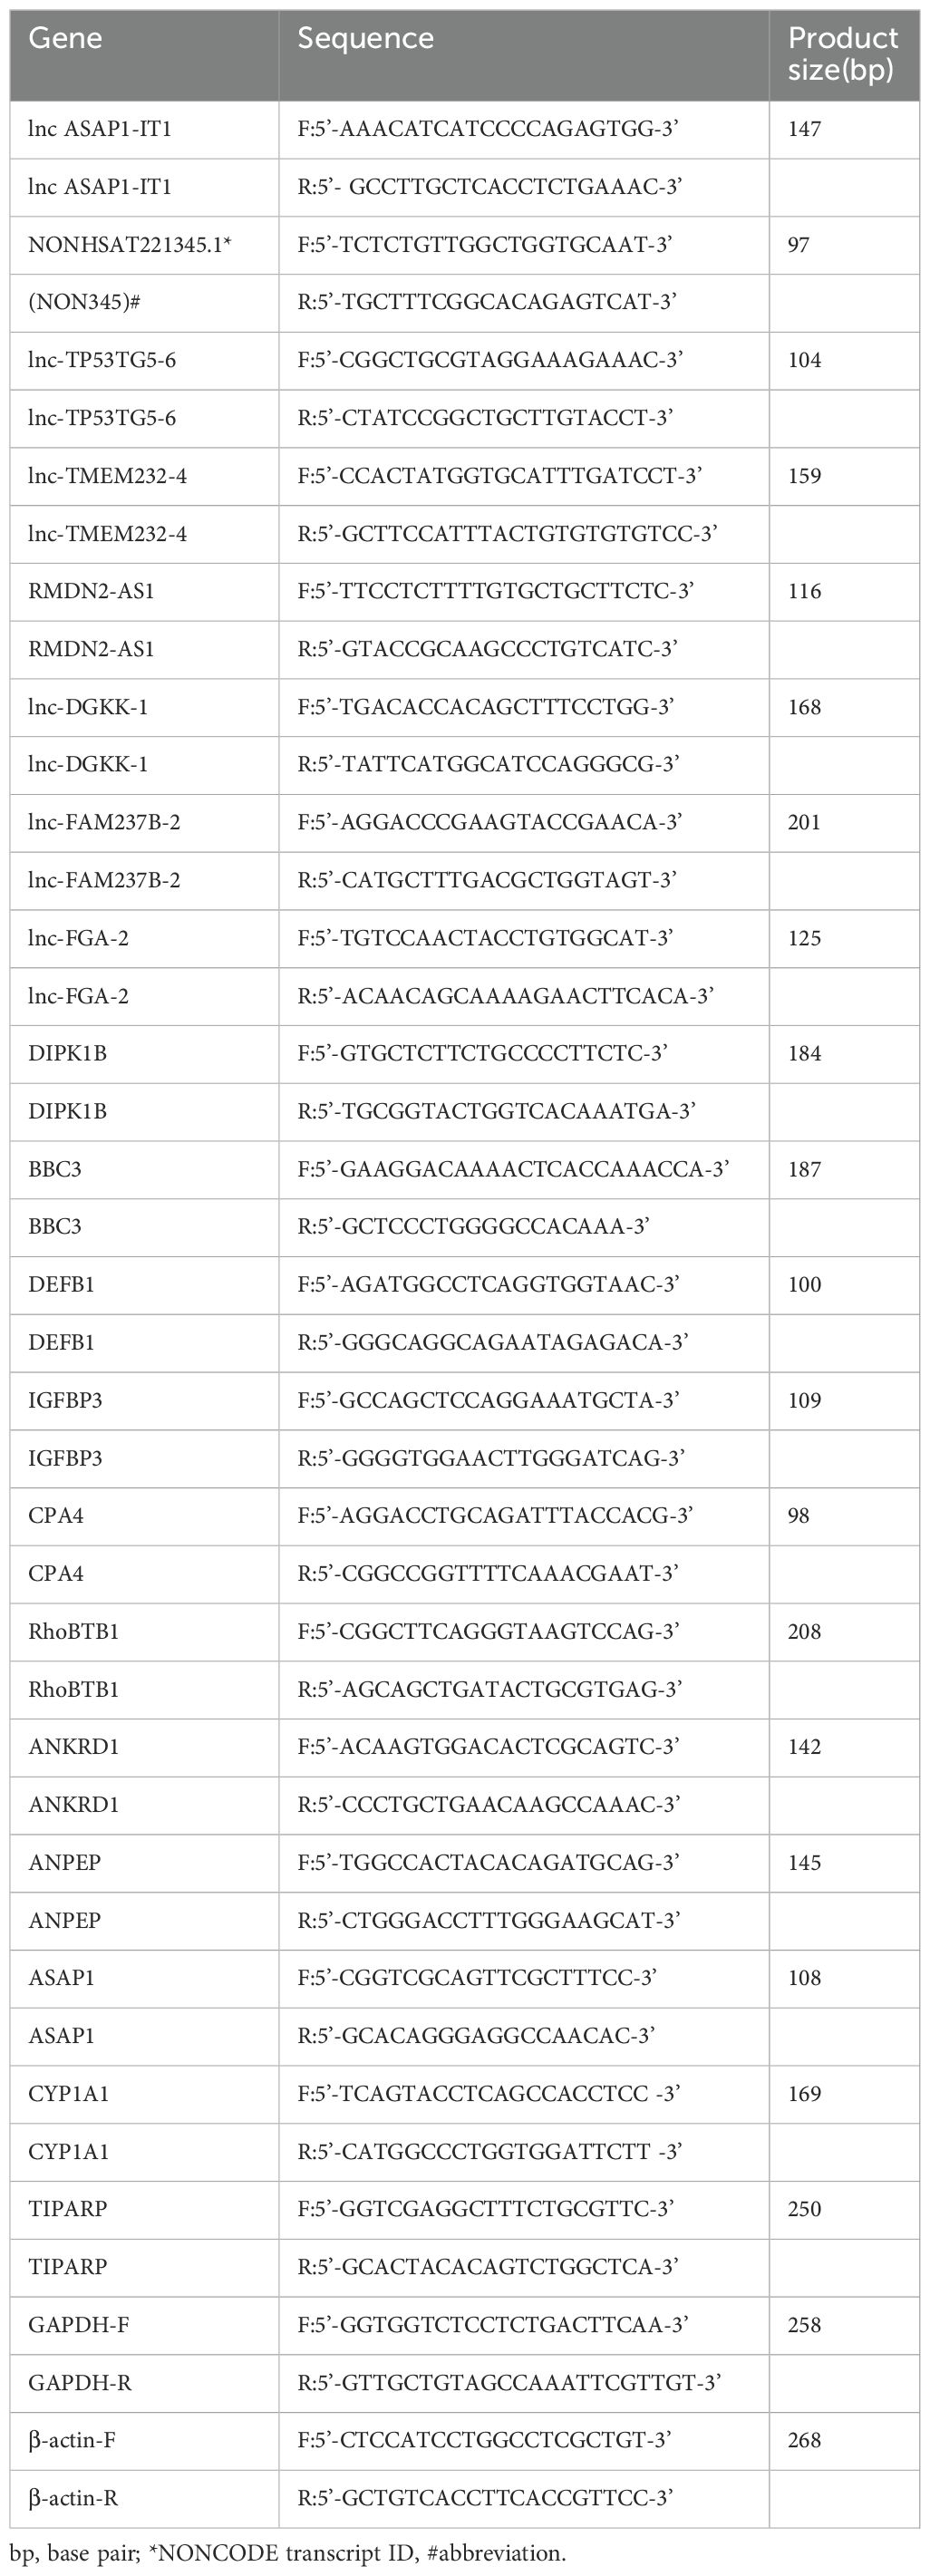
Table 1. PCR primer sequences.
Survival analysis
Survival analysis was conducted using data from The Cancer Genome Atlas (TCGA). The expression levels of the selected lncRNAs were correlated with the patient survival outcomes. Statistical analysis was used to determine the prognostic significance of these lncRNAs, for identifying potential biomarkers for liver cancer prognosis.
Statistical analysis
All the data were statistically analyzed using SPSS software (version 13.0, SPSS Inc., Chicago, IL, USA), GraphPad Prism 8.0, or R. One-way analysis of variance (ANOVA) was performed, followed by unpaired t-tests where appropriate. A p-value < 0.05 was considered statistically significant. Using the survival package in R, we performed a proportional hazards assumption test and Cox regression analysis on Overall Survival (OS) using liver cancer data from the TCGA database (GDC Portal).
Results
Transcriptome profiling of the mRNAs and lncRNAs after AHR activation in HCC cells
To study the role of AHR in liver cancer, we induced AHR activation in HCC cells using 200 nM FICZ. We selected three hepatocellular carcinoma cell lines (HepG2, Huh7, and SMMC-7721) that have enriched plasma unactivated AHR, as well as the human fetal hepatocyte line LO2. We treated these cells with FICZ, creating four FICZ-treatment groups, as well as four DMSO control groups for comparison.
We assessed AHR activation and nuclear translocation in the liver cancer cell lines after FICZ treatment using immunofluorescence assays. The results showed a significant increase in AHR fluorescence within the nuclei of the FICZ-treated cells. In contrast, the DMSO-treated controls displayed no such nuclear fluorescence, confirming that FICZ treatment successfully activated AHR, as indicated by the strong fluorescence burst seen in both the nucleus and cytoplasm, while the control DMSO group showed only weak AHR fluorescence, primarily localized in the cytoplasm (Figure 1).
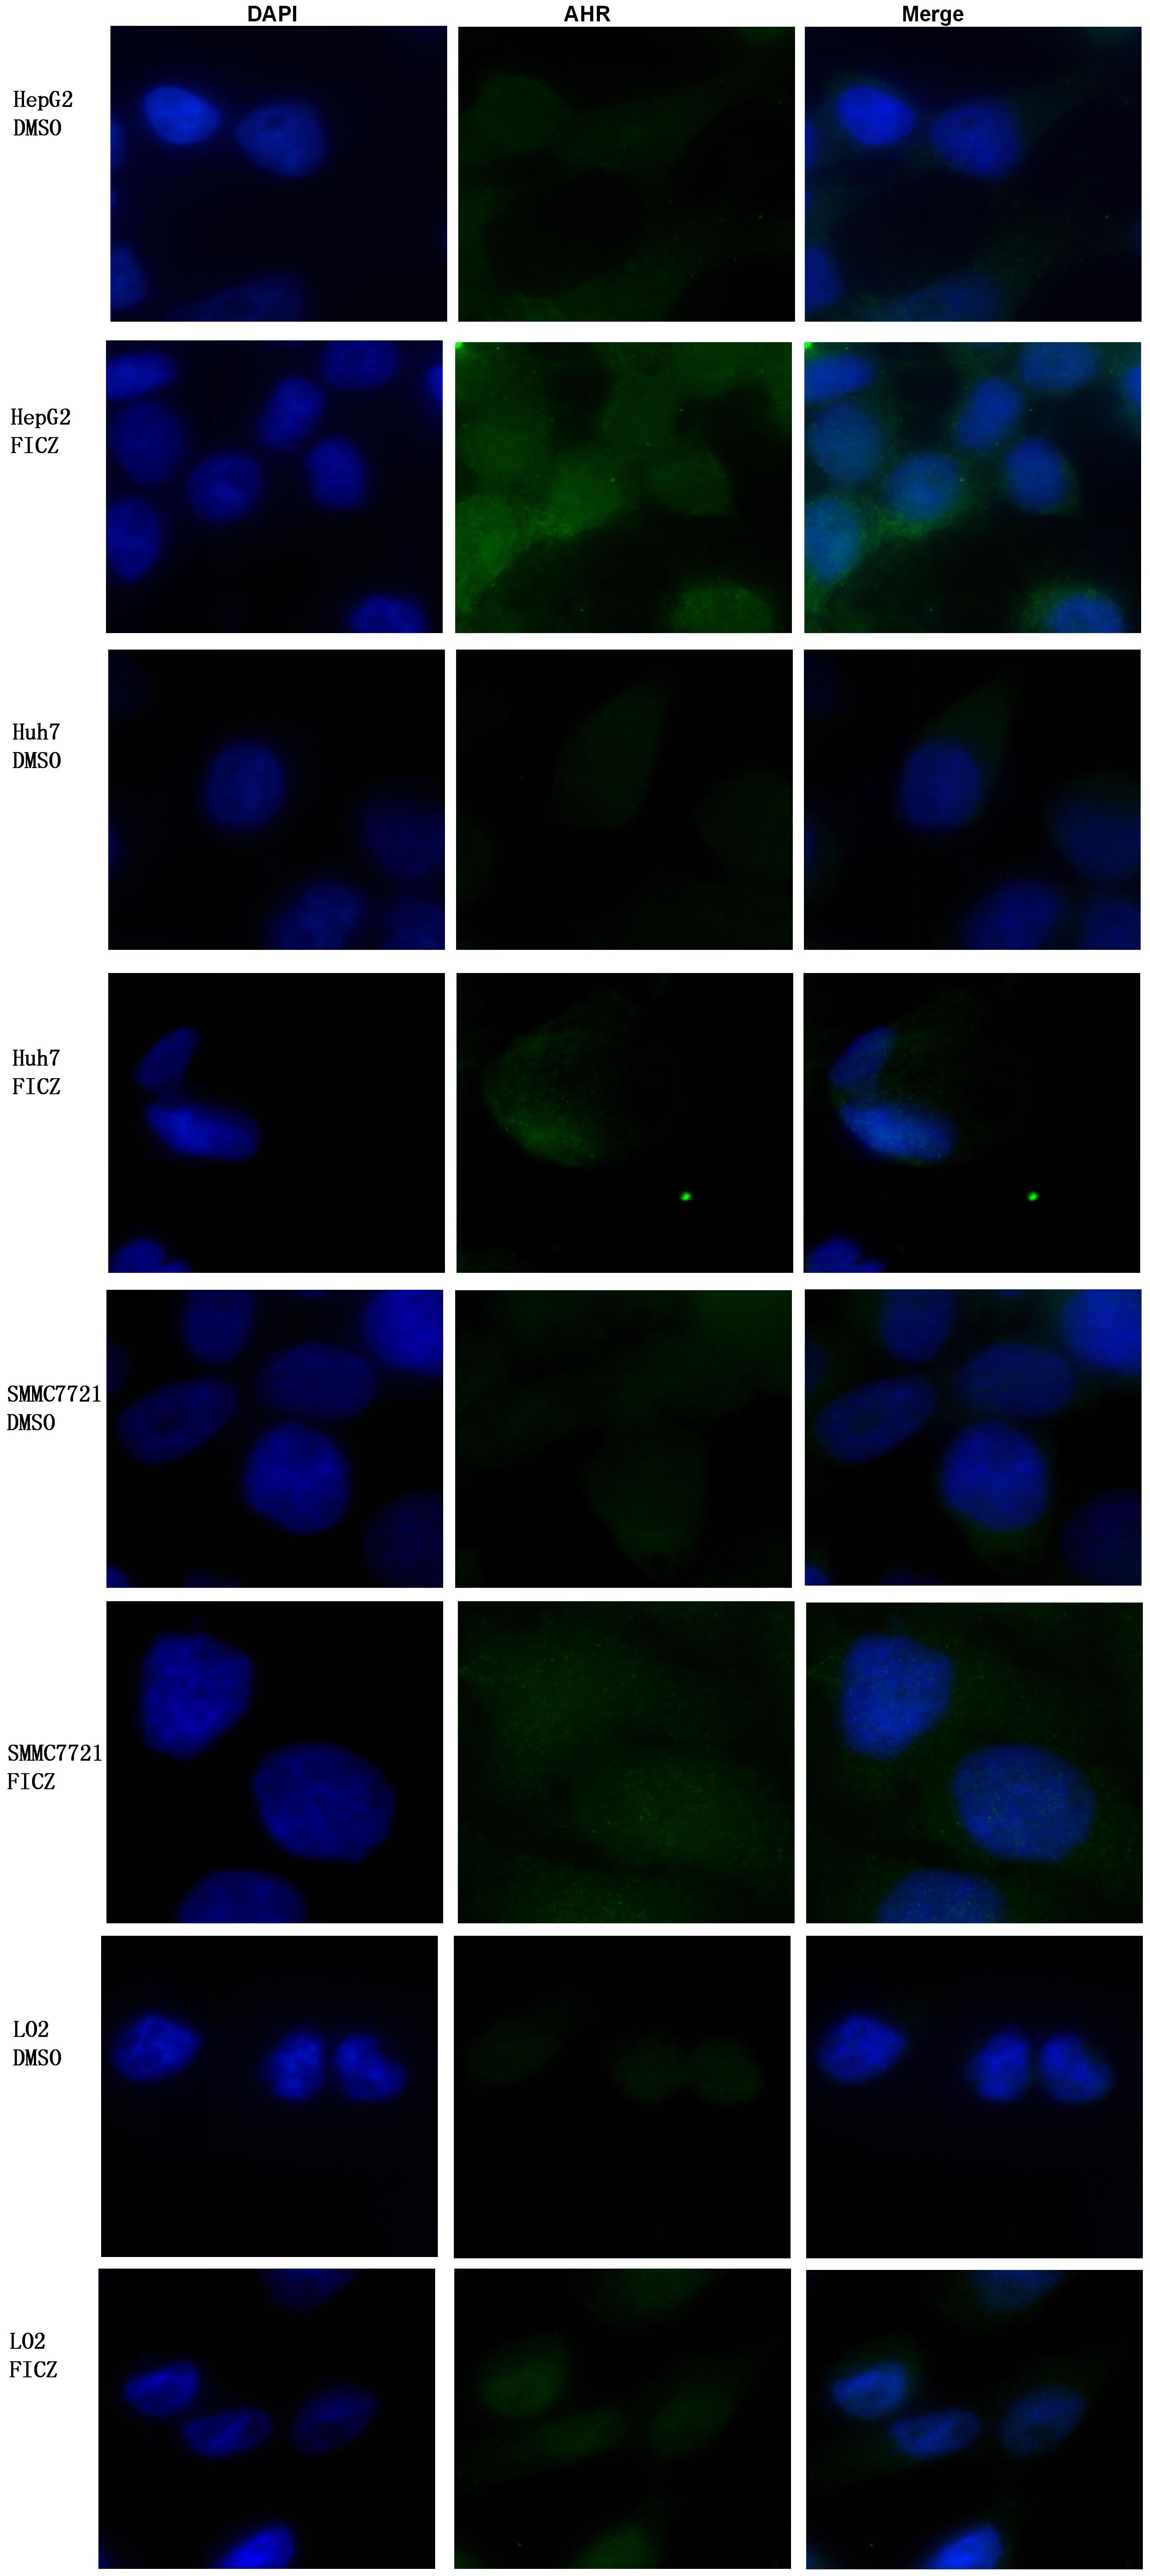
Figure 1. Comparison of AHR nuclear translocation between three liver cancer cell lines and LO2 before and after FICZ treatment: HepG2-FICZ vs. HepG2-DMSO, Huh7-FICZ vs. Huh7-DMSO, SMMC7721-FICZ vs. SMMC7721-DMSO, and LO2-FICZ vs. LO2-DMSO.
Next, we performed RNA-seq to analyze the transcriptomic changes induced by AHR activation, with the workflow customized to analyze both mRNAs and lncRNAs. Given our interest in both mRNAs and long non-coding RNAs (lncRNAs), we used StringTie for de novo transcript assembly, achieving an average genome alignment rate of 88.77%. We classified the transcripts as mRNAs if they were predicted to have coding potential by at least three of the following four methods: txCdsPredict, CNCI, Pfam-scan, and CPC (Figure 2A). Conversely, transcripts that were identified as non-coding by at least three of these methods were classified as lncRNAs (Figure 2B).
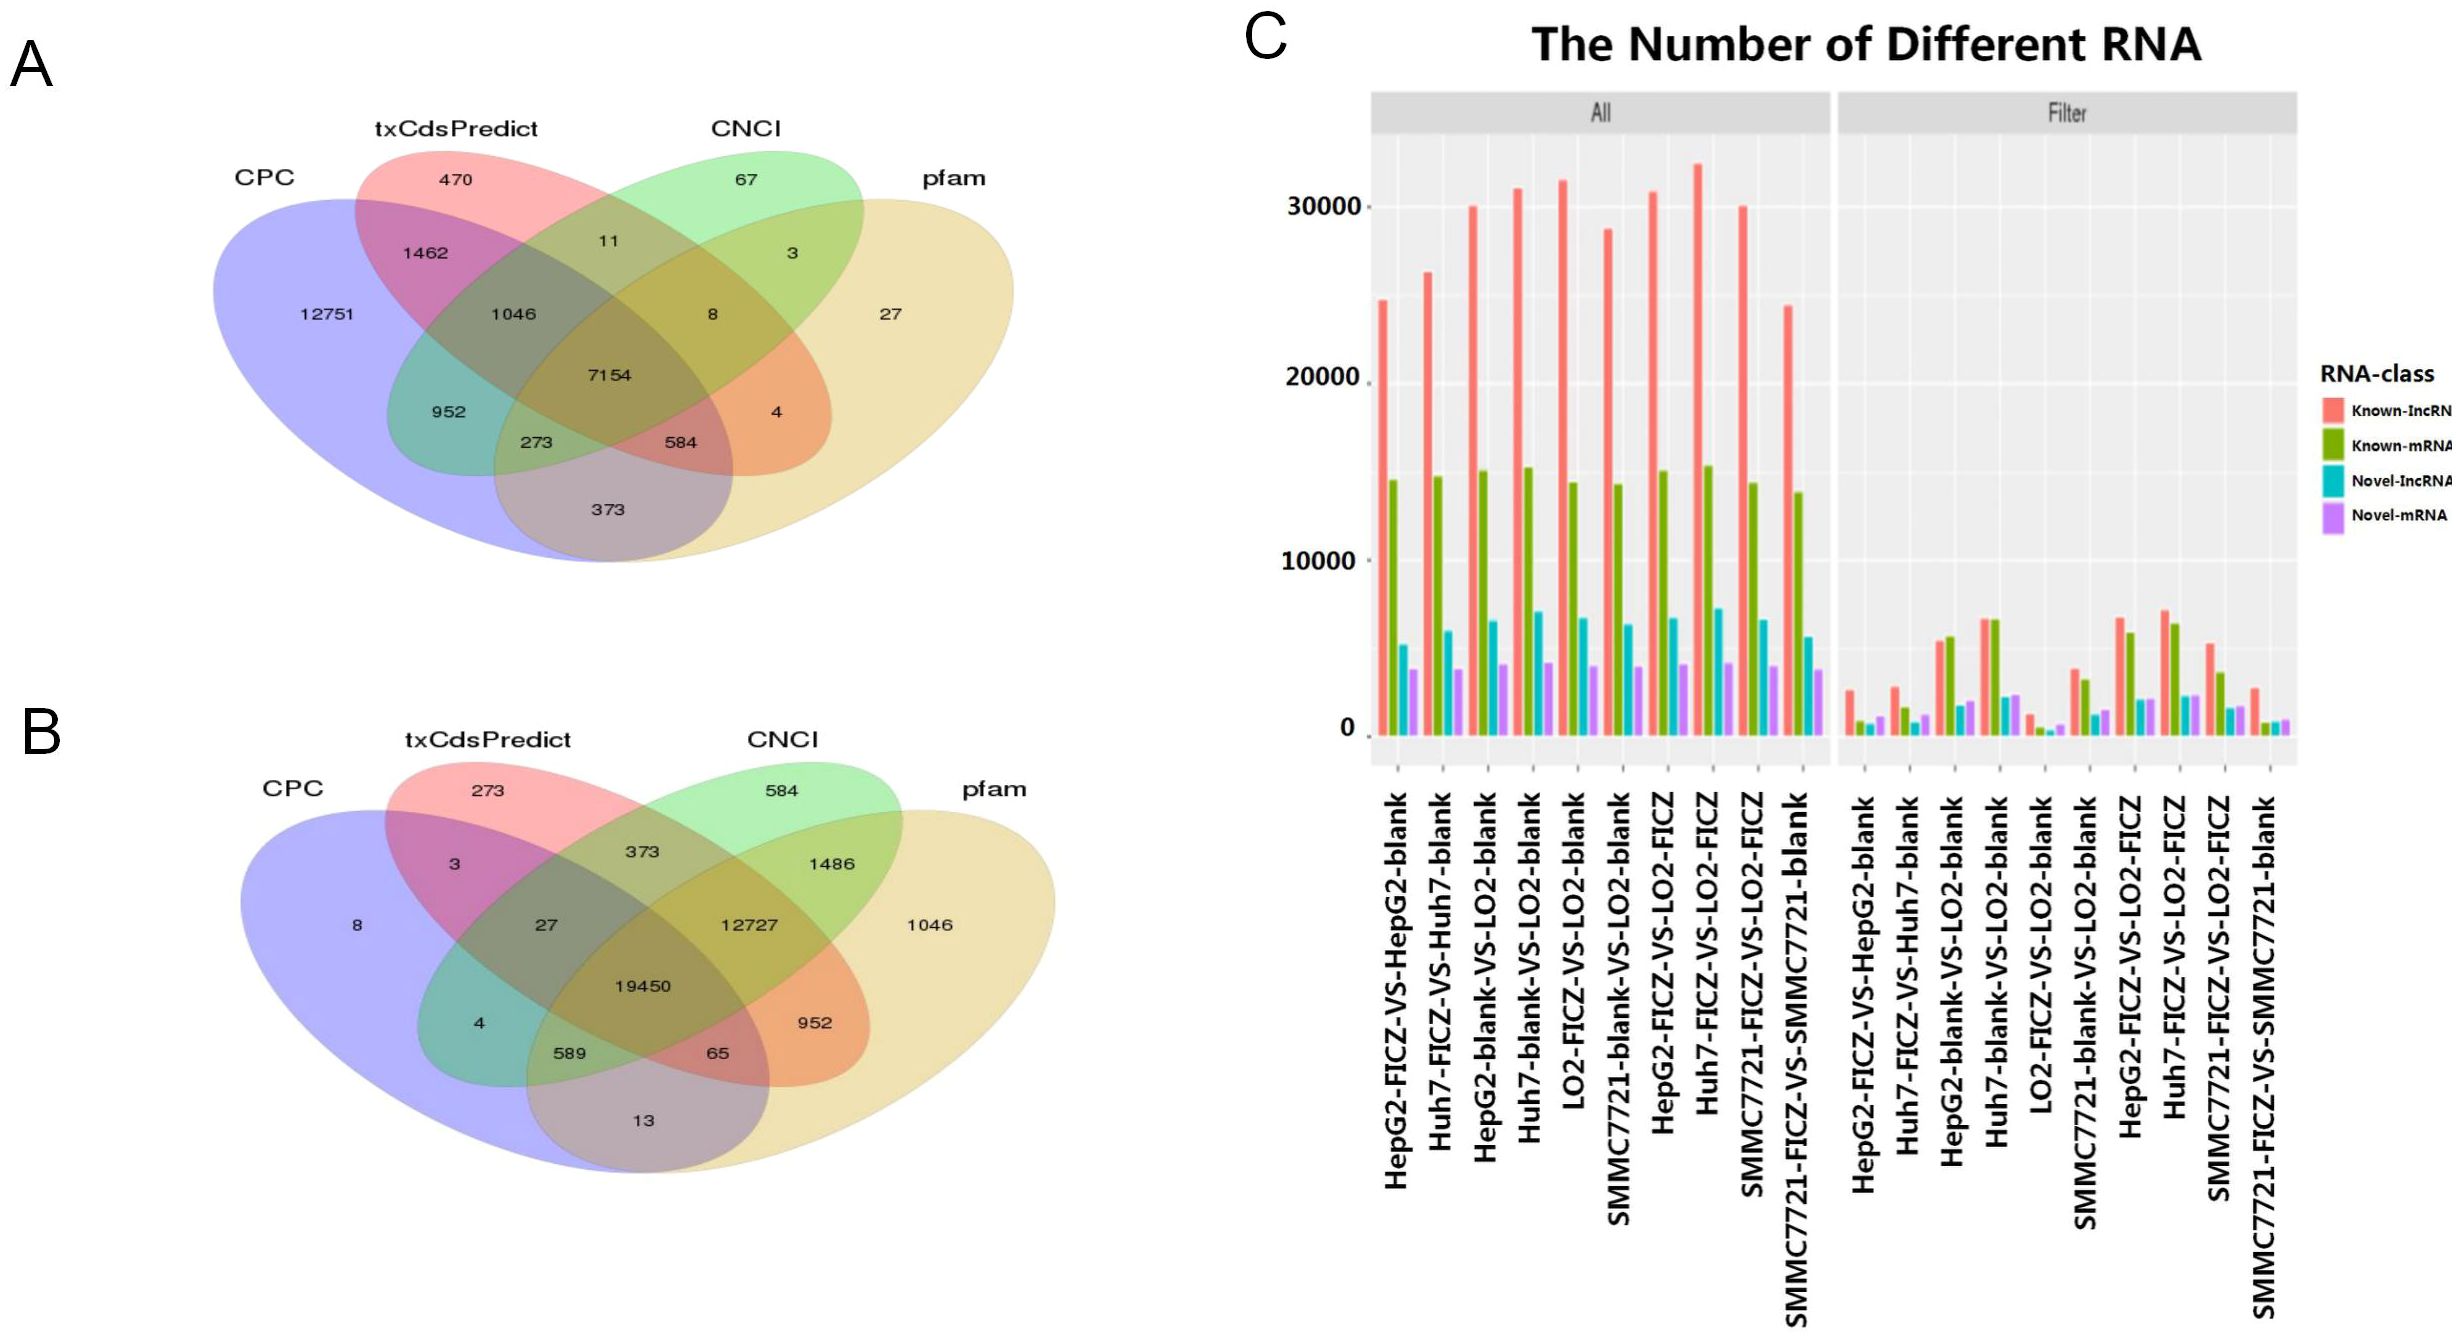
Figure 2. Annotation of the mRNA and lncRNA transcripts. (A, B) Venn diagram showing the transcript coding potential predictions by various methods. (C) Differences in the captured transcripts of the tumor cell line FICZ-treated groups compared to the DMSO control groups, as well as the normal cell line LO2 groups.
We then cross-referenced these transcripts with annotated databases to distinguish between annotated and novel mRNAs and lncRNAs. In total, we identified 124,841 transcripts, comprising 69,206 annotated lncRNAs, 12,597 novel lncRNAs, 35,774 annotated mRNAs, and 7,264 novel mRNAs. The distribution of these transcript categories was consistent across the different cell lines (Figure 2C).
AHR activation alters both coding and non-coding gene expressions in HCC cells
To further investigate the common AHR target genes in the tested HCC cells, we conducted differential gene expression (DEG) analysis by comparing tumor cell lines with or without AHR activation. Additionally, we included a control group based on a human fetal hepatocyte line to filter out genes that were altered upon AHR activation in non-cancerous conditions. This approach allowed us to focus specifically on AHR-related changes in cancer cells. Our analysis identified 427 significantly differentially expressed lncRNA transcripts with known gene annotations, of which 167 (39.1%) were upregulated and 260 (60.9%) were downregulated (Table 2, Figures 3A, B). We also found 413 significantly differentially expressed mRNA transcripts, with 321 (77.7%) upregulated and 92 (22.3%) downregulated (Table 3, Figures 4A, B). This analysis revealed that AHR exerts broad regulatory effects on both non-coding and coding genes, with a common gene expression signature associated with liver cancer.
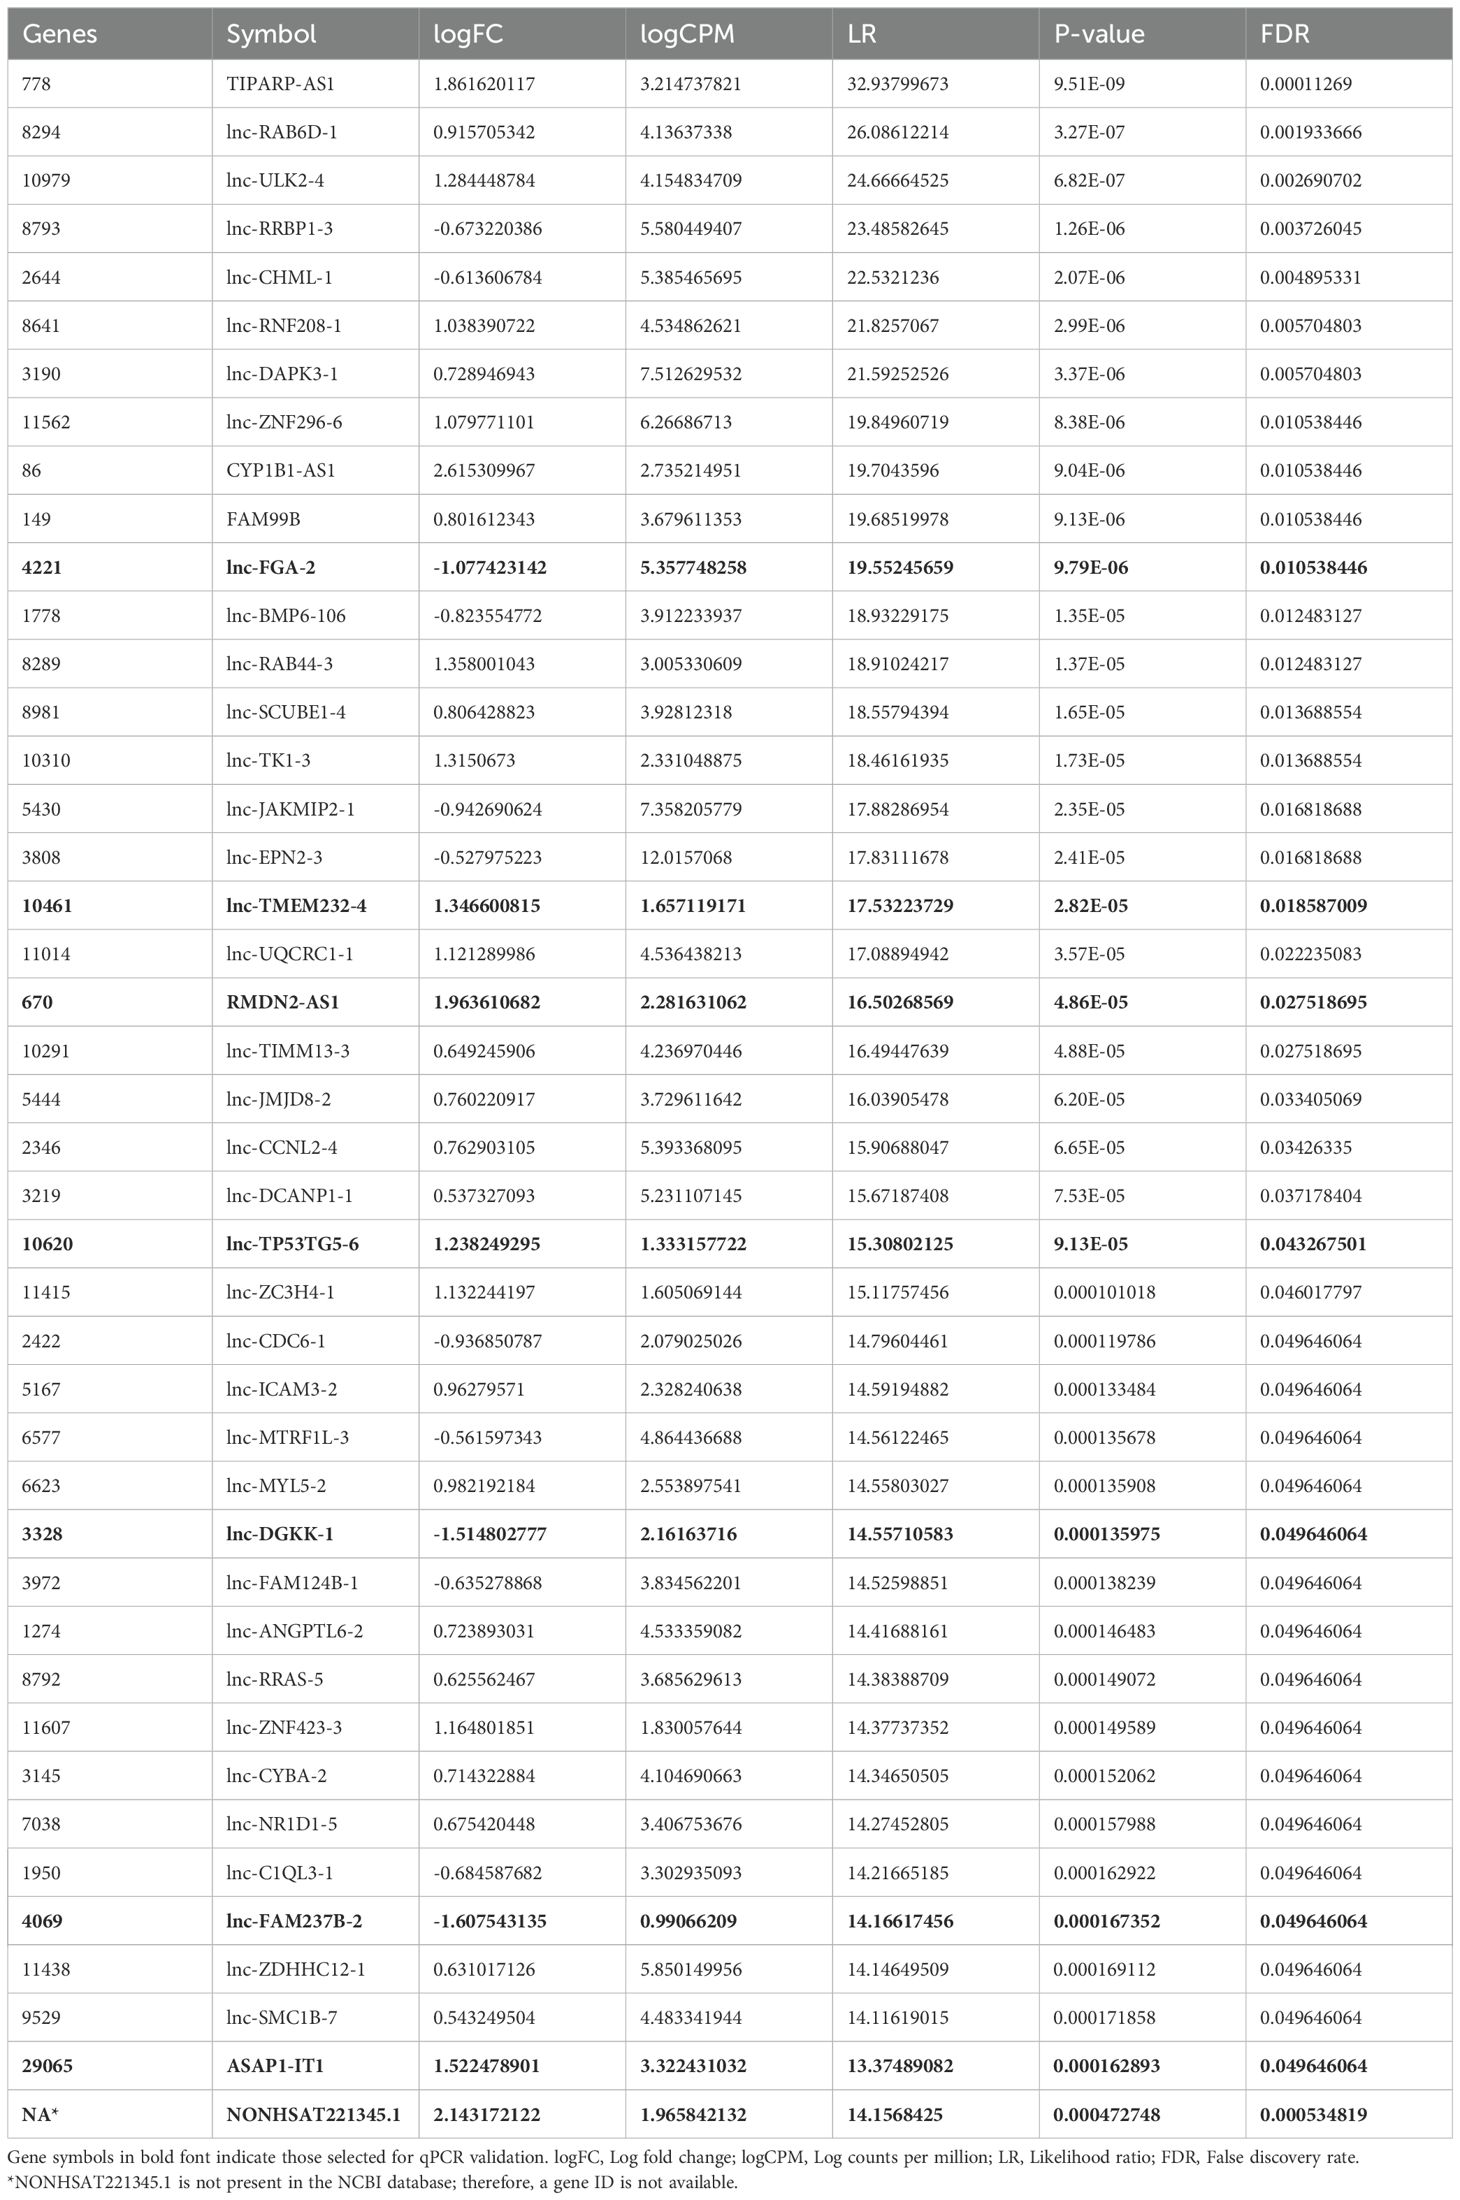
Table 2. Significantly up- and downregulated lncRNAs in hepatocellular carcinoma cells.
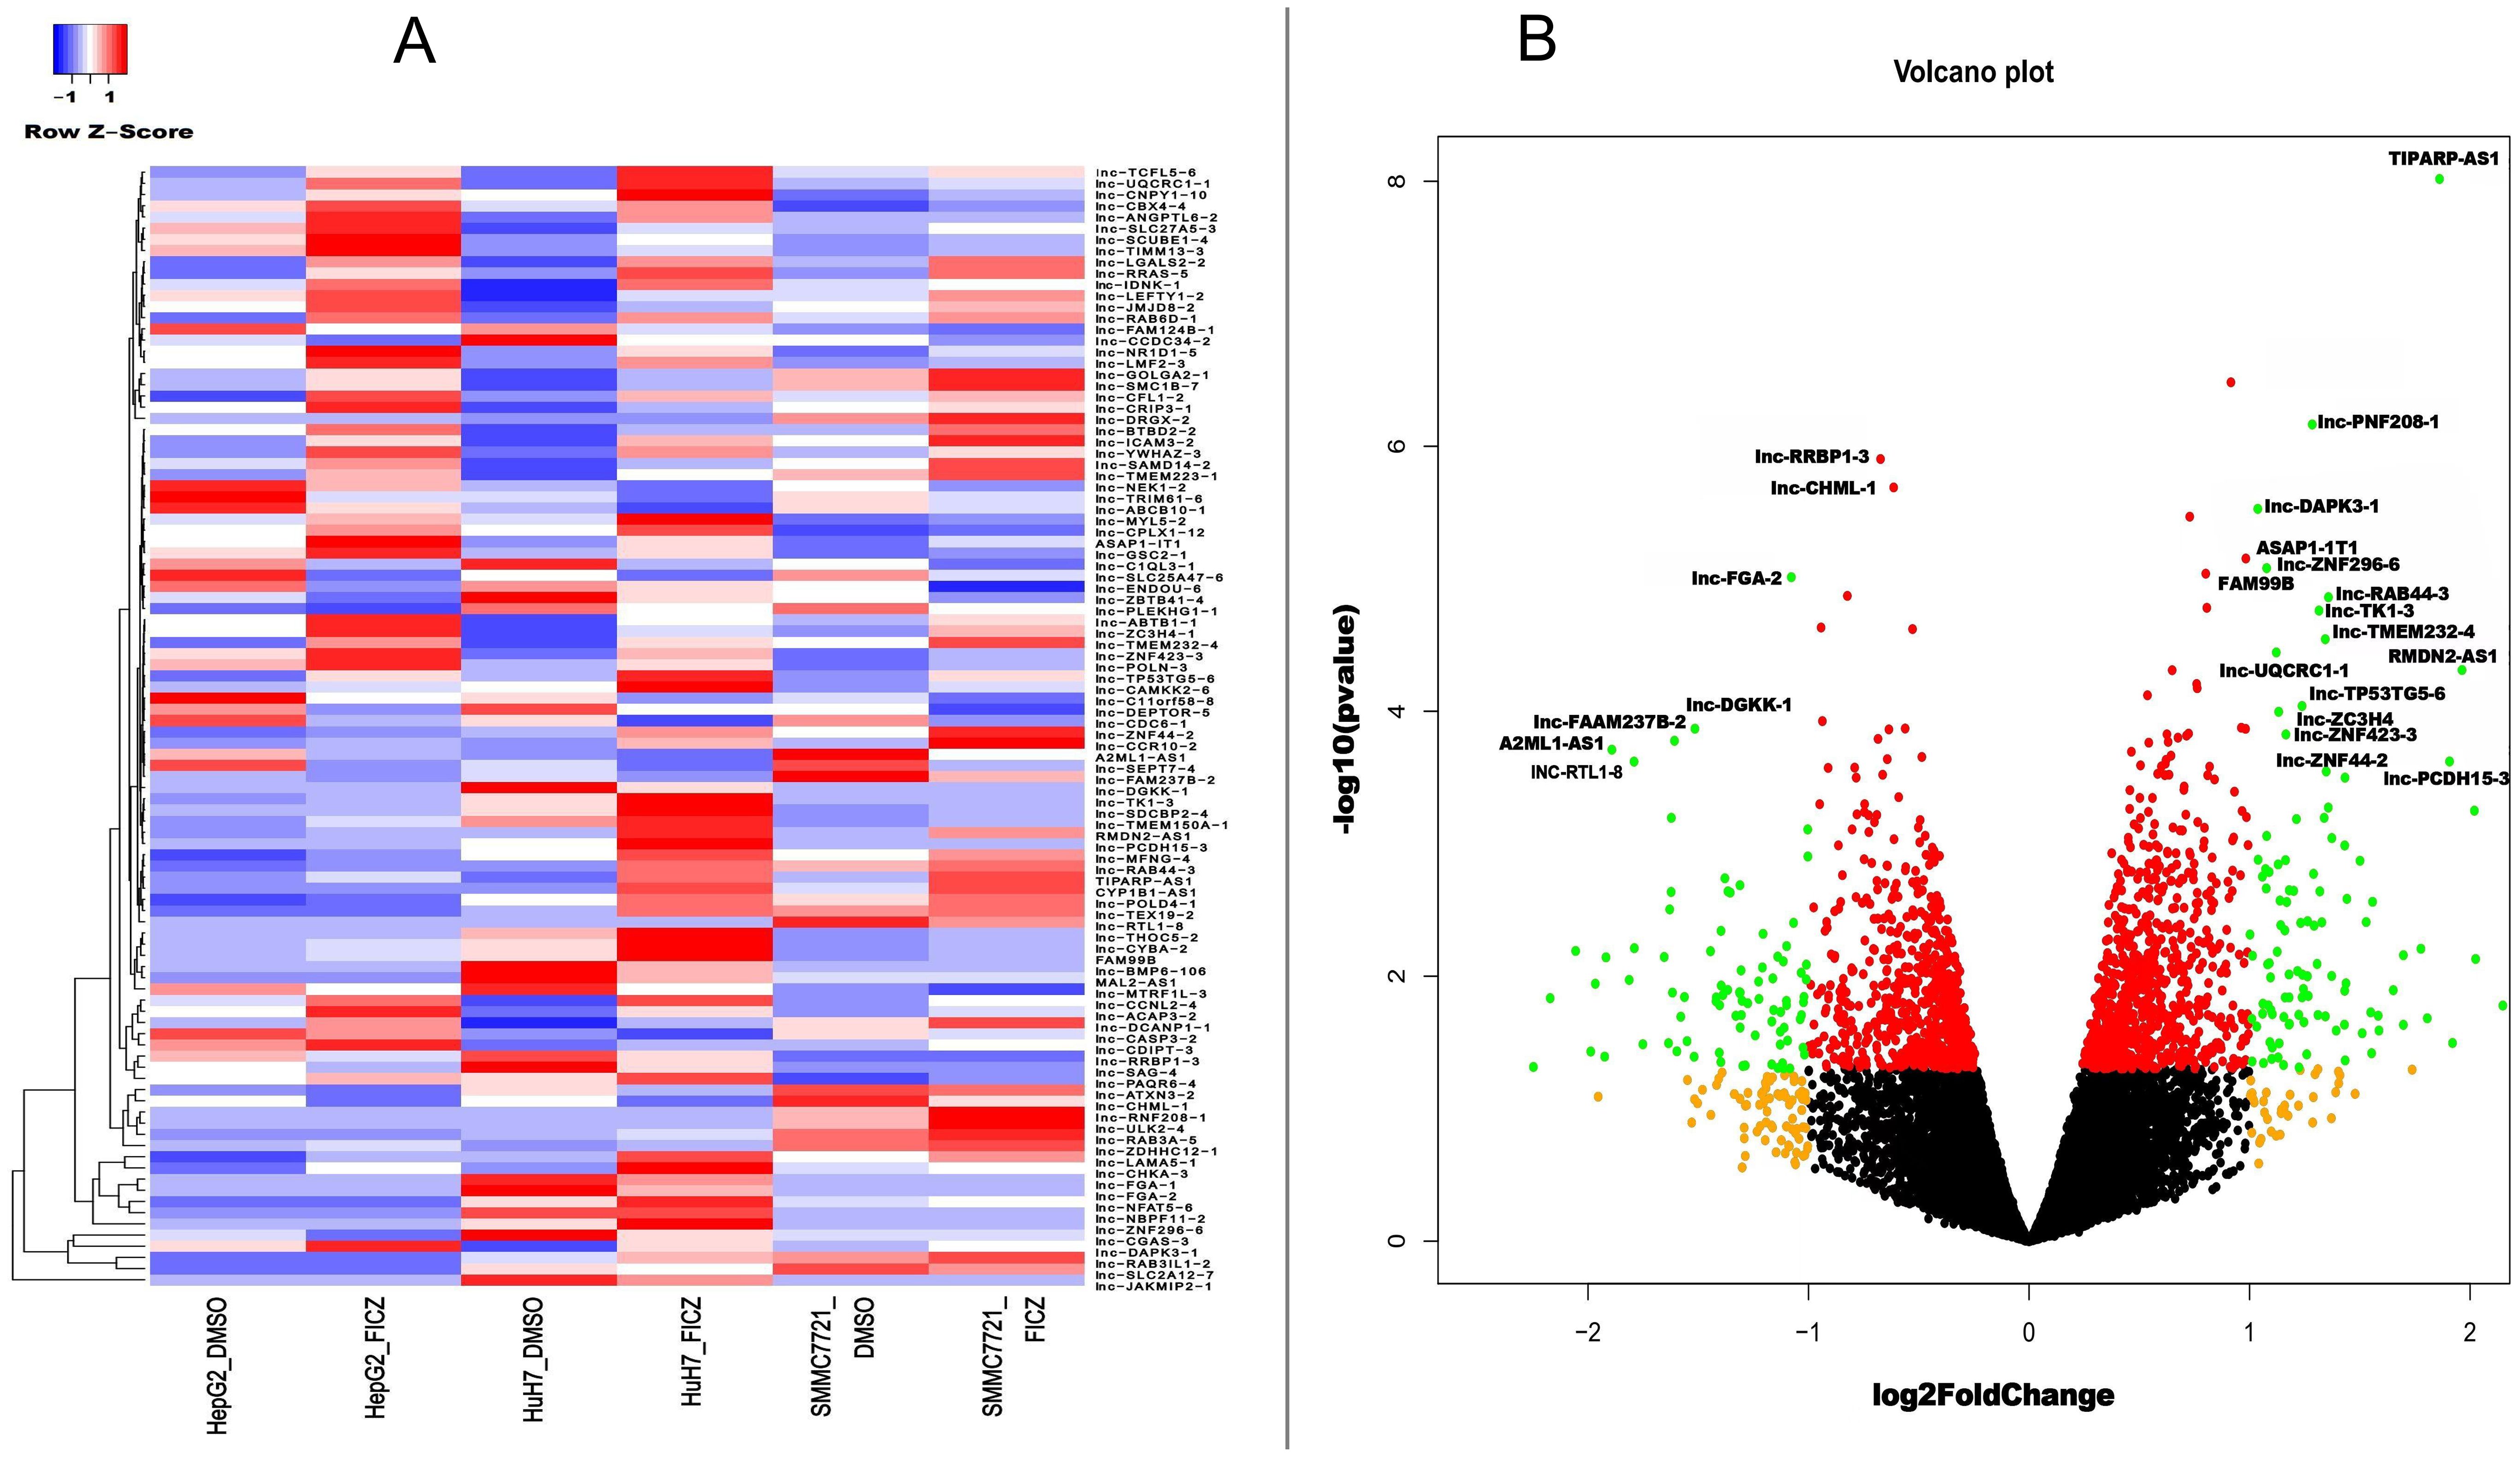
Figure 3. DE lncRNAs after AHR activation. (A) Heatmaps showing the average expressions of the DE lncRNAs. (B) Volcano plot indicating the up- and downregulated lncRNAs after AHR activation.|log2Fold Change|≥ 1, FDR < 0.05.
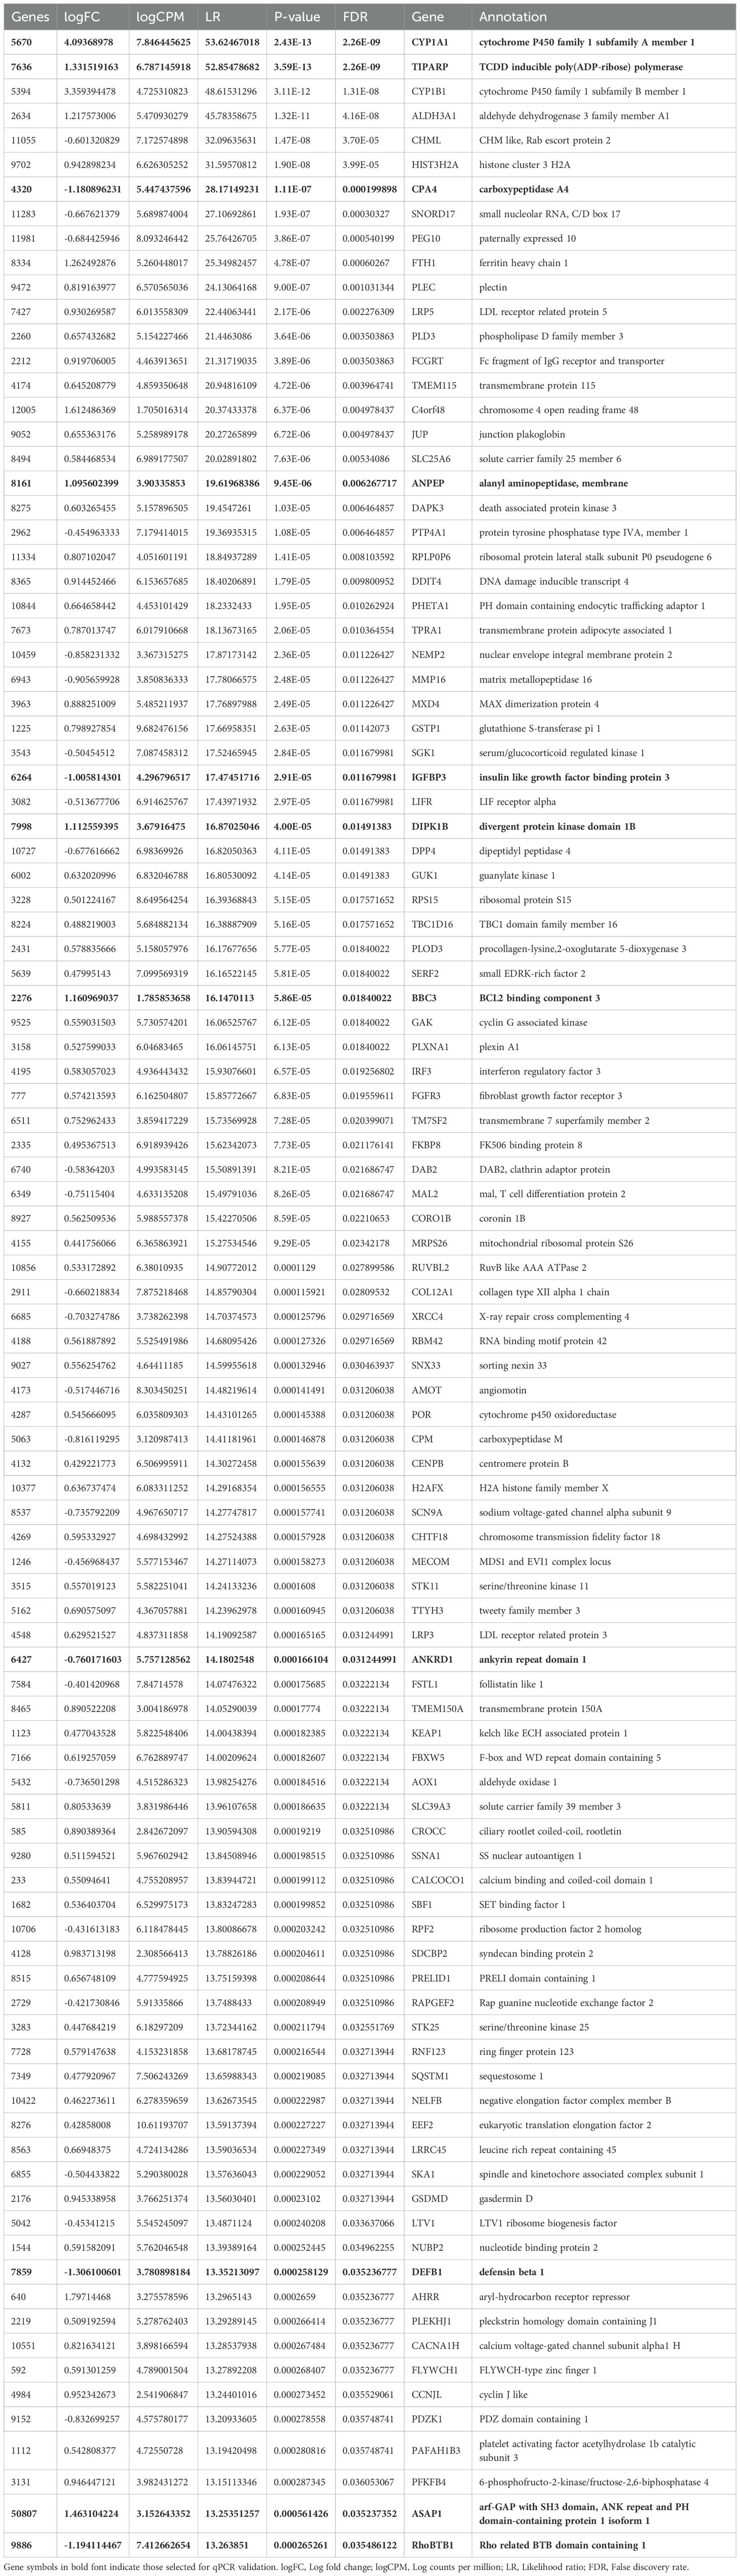
Table 3. Significantly up- and downregulated mRNAs in hepatocellular carcinoma cells.
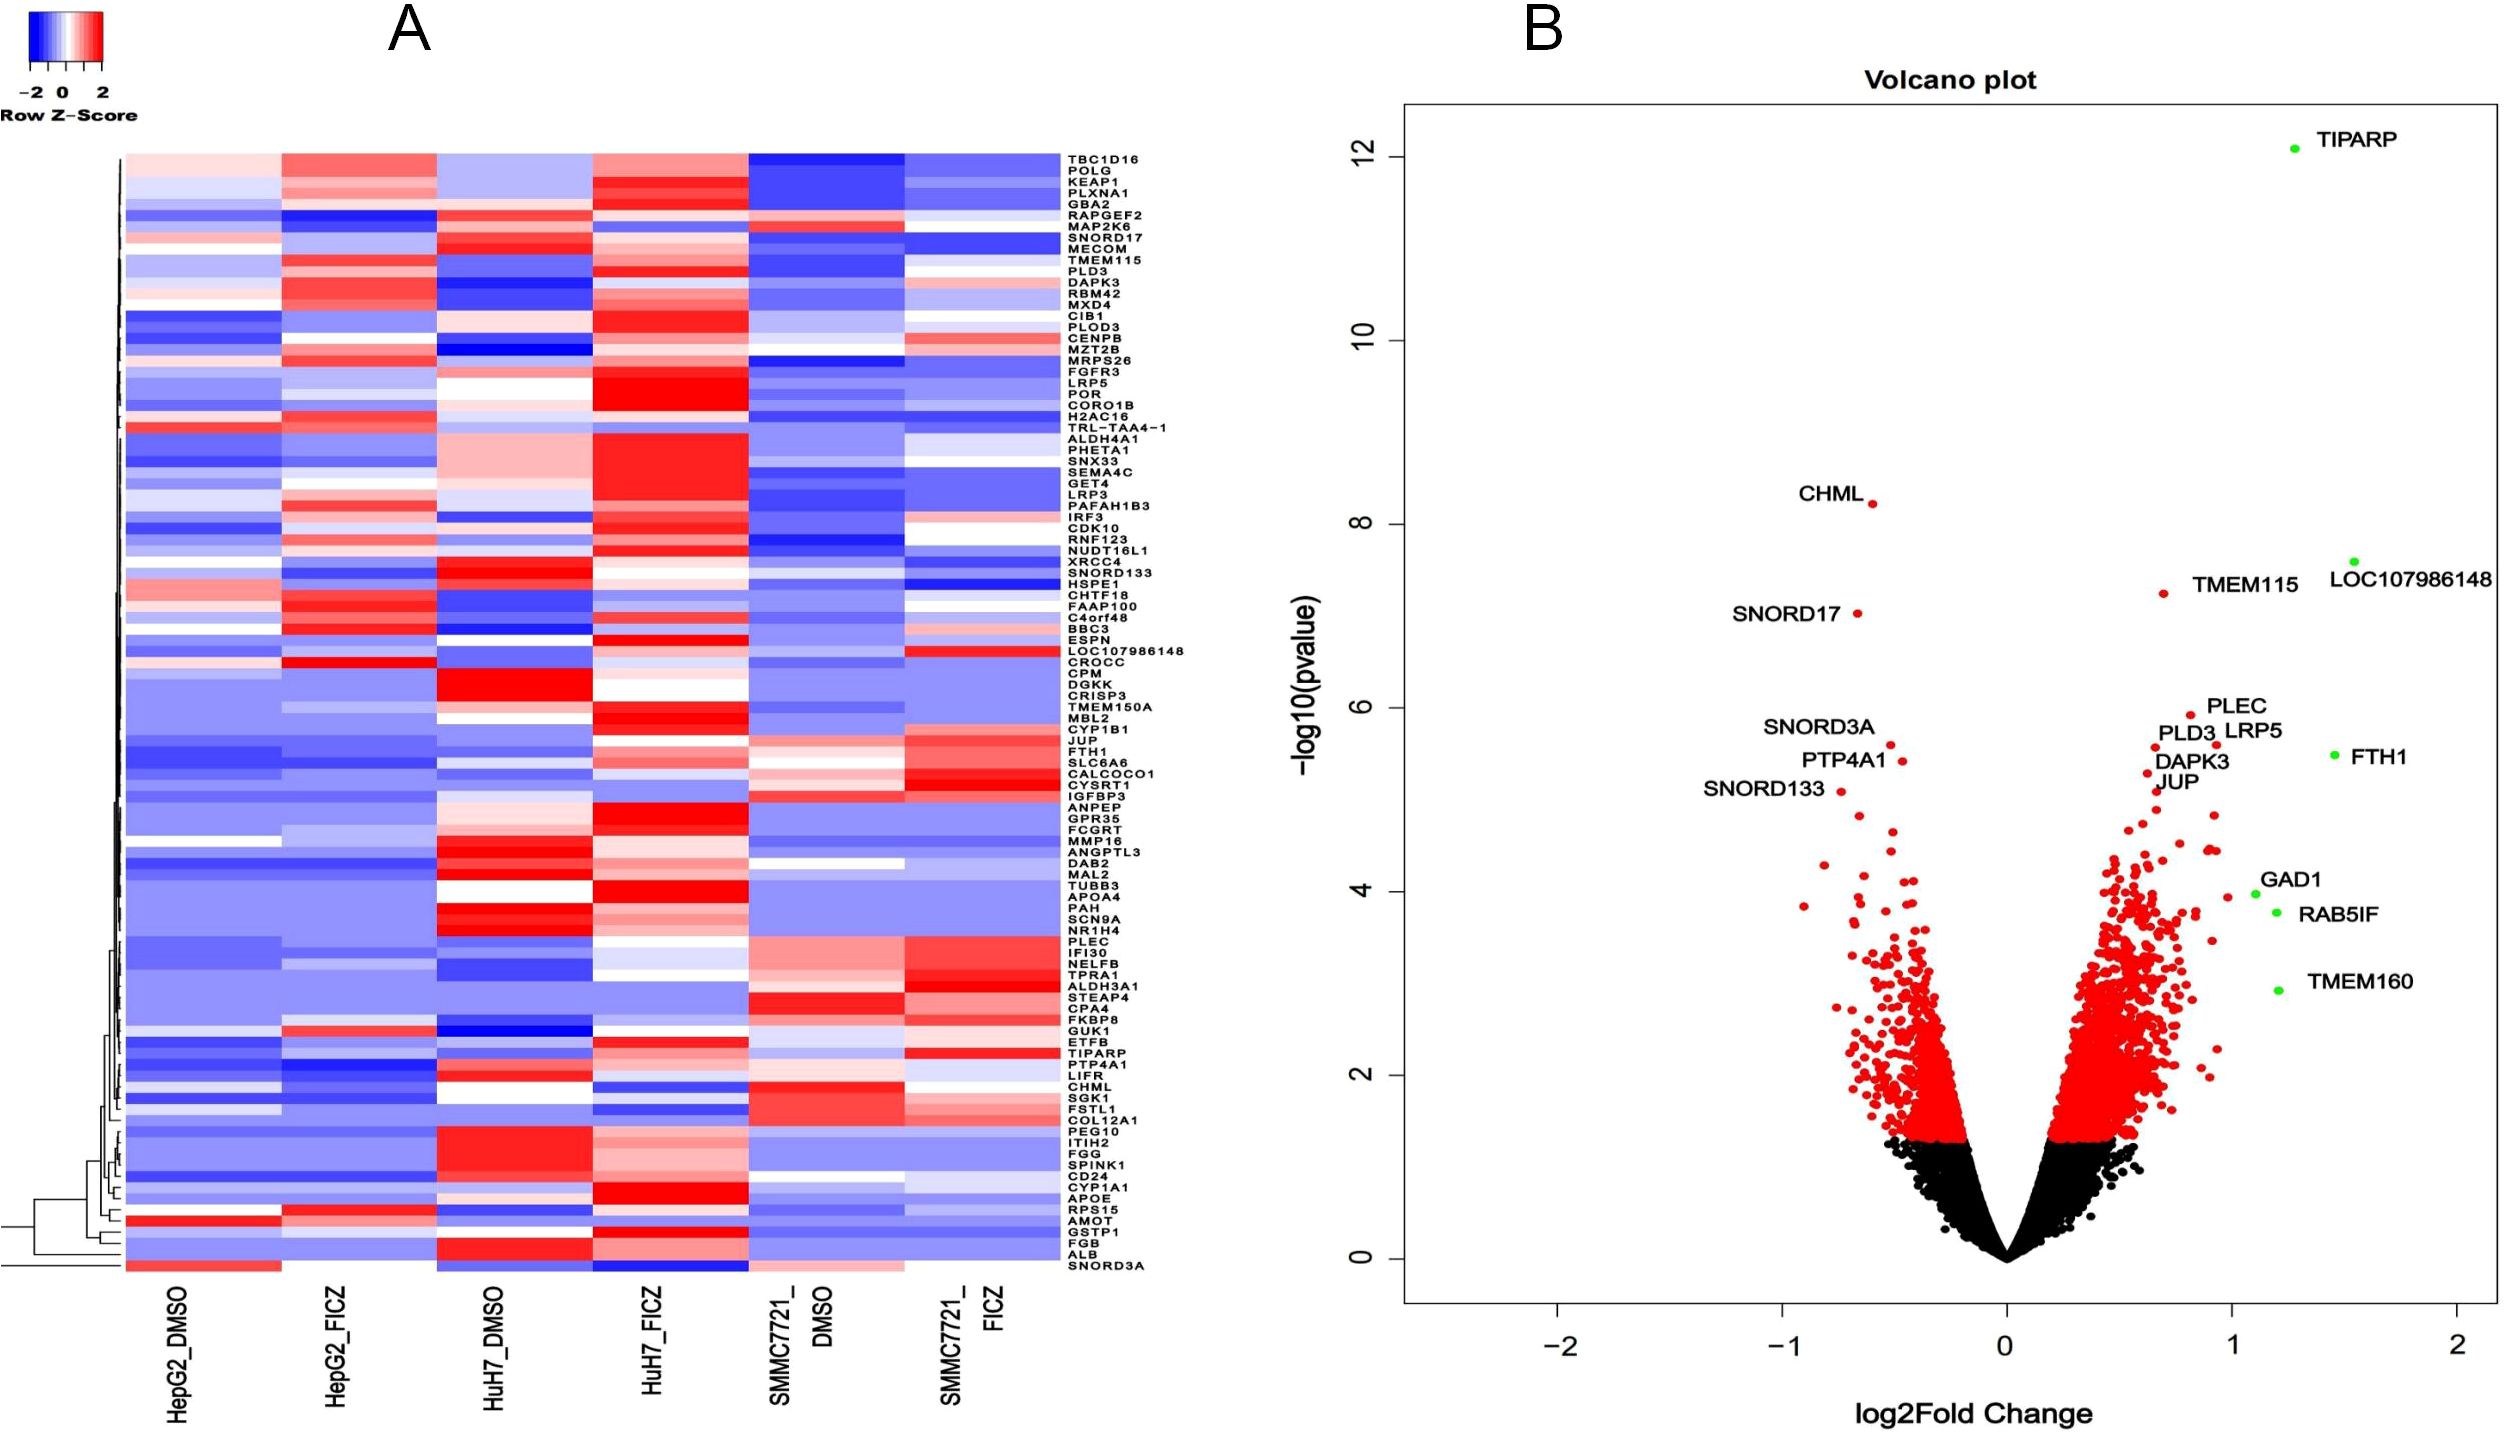
Figure 4. DE mRNAs after AHR activation. (A) Heatmaps showing the average expression of the DE RNAs (B) Volcano plot indicating the up- and downregulated mRNAs after AHR activation.|log2Fold Change|≥ 1, FDR < 0.05.
Validation of the differentially expressed lncRNAs and mRNAs in Huh7 cells
Next, we validated the RNA-seq findings by performing qRT-PCR on selected differentially expressed genes. We also included two well-characterized AHR target genes (TIPARP and CYP1A1) as positive controls. We selected the top 10 differentially expressed mRNAs and lncRNAs based on their absolute log fold change values and proceeded with those for which high-fidelity primers could be reliably designed. Consequently, 8 lncRNAs (ASAP1-IT1, NONHSAT221345.1, RMDN2-AS1, lnc-TMEM232-4, lnc-TP53TG5-6, lnc-FGA-2, lnc-DGKK-1, and lnc-FAM237B-2), and 9 mRNAs (BBC3, ANPEP, DIPK1B, ASAP1, RhoBTB1, CPA4, ANKRD1, IGFBP3, and DEFB1) were selected for validation.
We conducted qRT-PCR on Huh7 cells treated with either FICZ or DMSO. The qRT-PCR results demonstrated that, except for lnc-TP53TG5-6, the expression trends for both the lncRNAs and mRNAs in the FICZ-treated cells were consistent with those identified in the RNA-seq analysis (Figure 5). This confirmation supported the reliability of our high-throughput sequencing data and verified the accuracy of the observed gene expression changes.
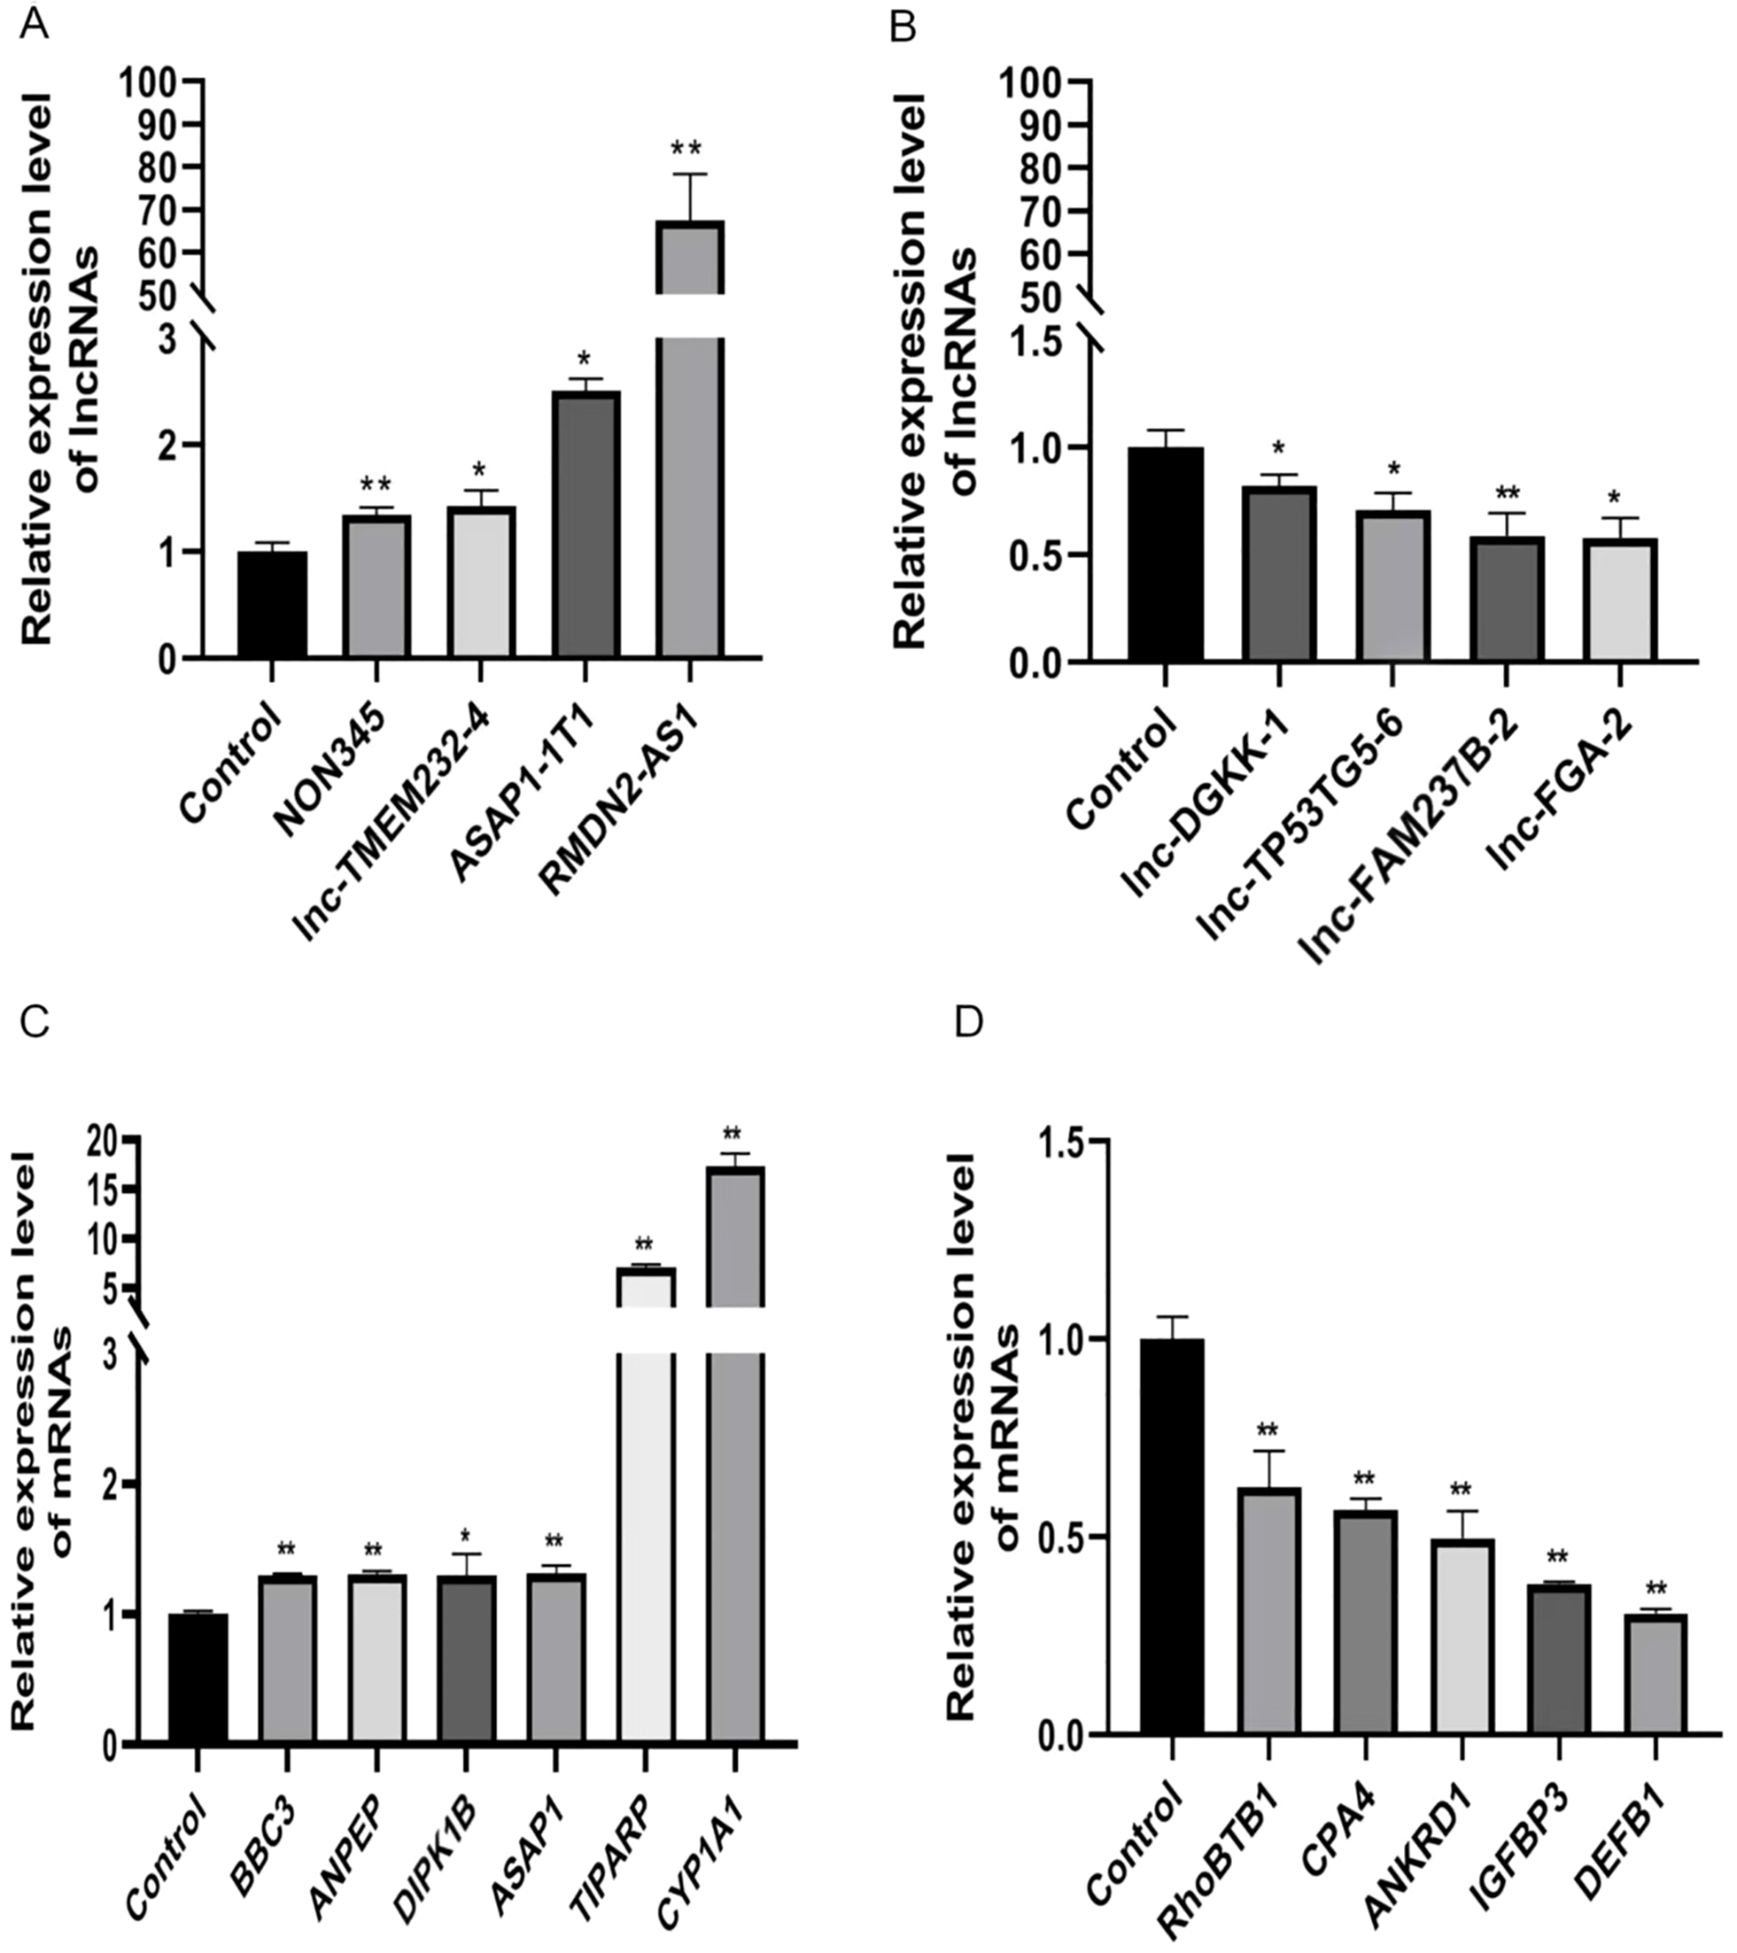
Figure 5. qRT-PCR validations of four dysregulated lncRNAs and mRNAs. (A) ASAP1-IT1, NONHSAT221345.1, RMDN2-AS1, and lnc-TMEM232-4 are four upregulated lncRNAs, (B) lnc-TP53TG5-6, lnc-FGA-2, lnc-DGKK-1, and lnc-FAM237B-2 are four downregulated lncRNAs. *p < 0.05, **p < 0.01. (C) BBC3, ANPEP, DIPK1B, ASAP1, TIPARP, and CYP1A1 are six upregulated mRNAs, (D) RhoBTB1, CPA4, ANKRD1, IGFBP3 and DEFB1 are five downregulated mRNAs. *p < 0.05, **p < 0.01.
Functional pathways of the AHR-activation-responsive genes in HCC cells
Next, we analyzed the functional pathways of the differentially expressed RNAs following AHR activation in HCC cells. Gene Ontology (GO) analysis identified significant enrichment in 19 cellular component (CC) terms, 14 molecular function (MF) terms, and 30 biological process (BP) terms (Figure 6A). The analysis highlighted the prominence of genes involved in membrane components, developmental and immune processes, signal transduction, biological regulation, and metabolic pathways (Figure 6B).
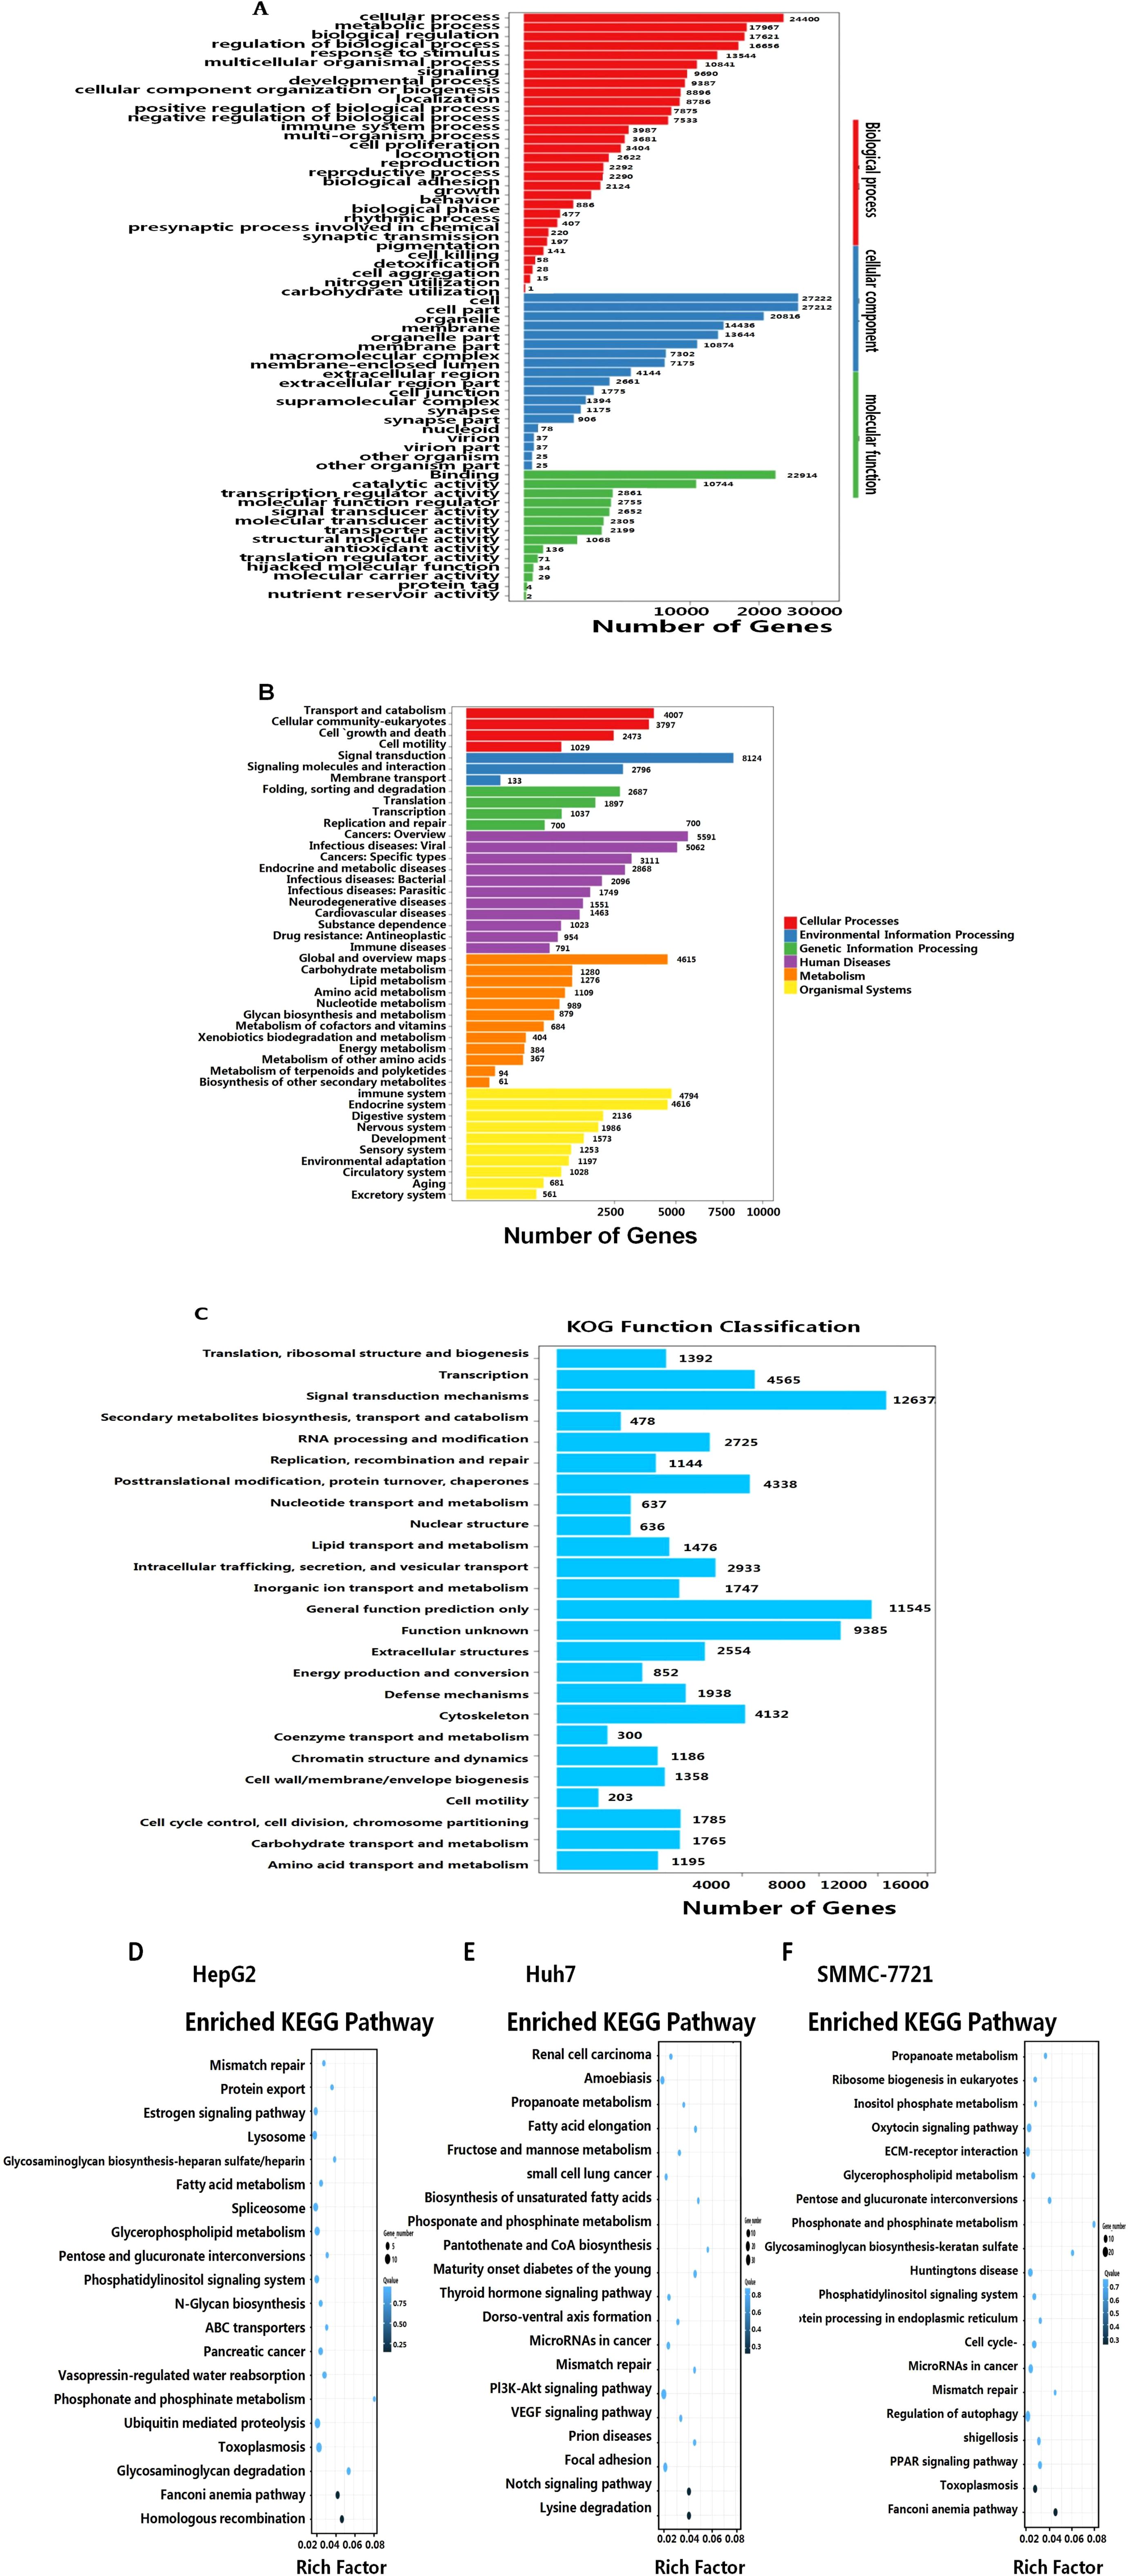
Figure 6. GO enrichment analysis of the target genes of the DE lncRNAs. (A) GO enrichments in the categories of biological process, cellular component, and molecular function. (B) LncRNA networks mainly associated with cellular processes, environmental information processing and genetic information processing, cancers, infectious diseases, and metabolism. (C) KOG functional classification. KEGG signaling pathway analyses of the differentially expressed lncRNAs-targeted mRNAs for: HepG2-FICZ vs. HepG2-blank (D), Huh7-FICZ vs. Huh7-blank (E), and SMMC7721-FICZ vs. SMMC7721-DMSO (F).
The further classification of 72,686 transcripts using the EuKaryotic Orthologous Groups (KOG) database revealed 25 functional groups. The major categories included signaling mechanisms (12,637 transcripts) and general function prediction (11,545 transcripts), with additional representation in transcription (4,565 transcripts), post-translational modification, protein turnover, and molecular chaperones (4,338 transcripts), cytoskeleton (4,132 transcripts), and intracellular transport/secretion (2,933 transcripts). Less represented categories included cell motility (203 transcripts) and coenzyme transport/metabolism (300 transcripts) (Figure 6C).
In parallel, KEGG pathway analysis further elucidated the involvement of the AHR target genes in various cancer-related pathways. Specifically, these genes were prominently linked to PI3K-Akt, VEGF, Notch, and PPAR signaling pathways, as well as cancer-related microRNAs (Figures 6D–F). Additionally, AHR activation was associated with pathways related to fatty acid synthesis and metabolism, immune responses, and hormonal signaling, including estrogen, thyroid hormone, and oxytocin pathways. These results indicate that AHR activation significantly influences metabolic and signaling pathways pertinent to cancer progression, although the detailed mechanisms and downstream targets remain to be elucidated. This comprehensive classification underscores the broad impact of AHR activation on a diverse array of cellular functions and processes.
Interaction analysis of lncRNA-mediated regulation in HCC
To explore the regulatory roles of the candidate lncRNAs, we constructed a functional network centered around the differentially expressed (DE) lncRNAs and mRNAs. We screened the regulatory relationships between the DE lncRNAs and mRNAs in the TCGA and TargetScan databases and then visualized their co-expression network with Cytoscape (Figure 7).
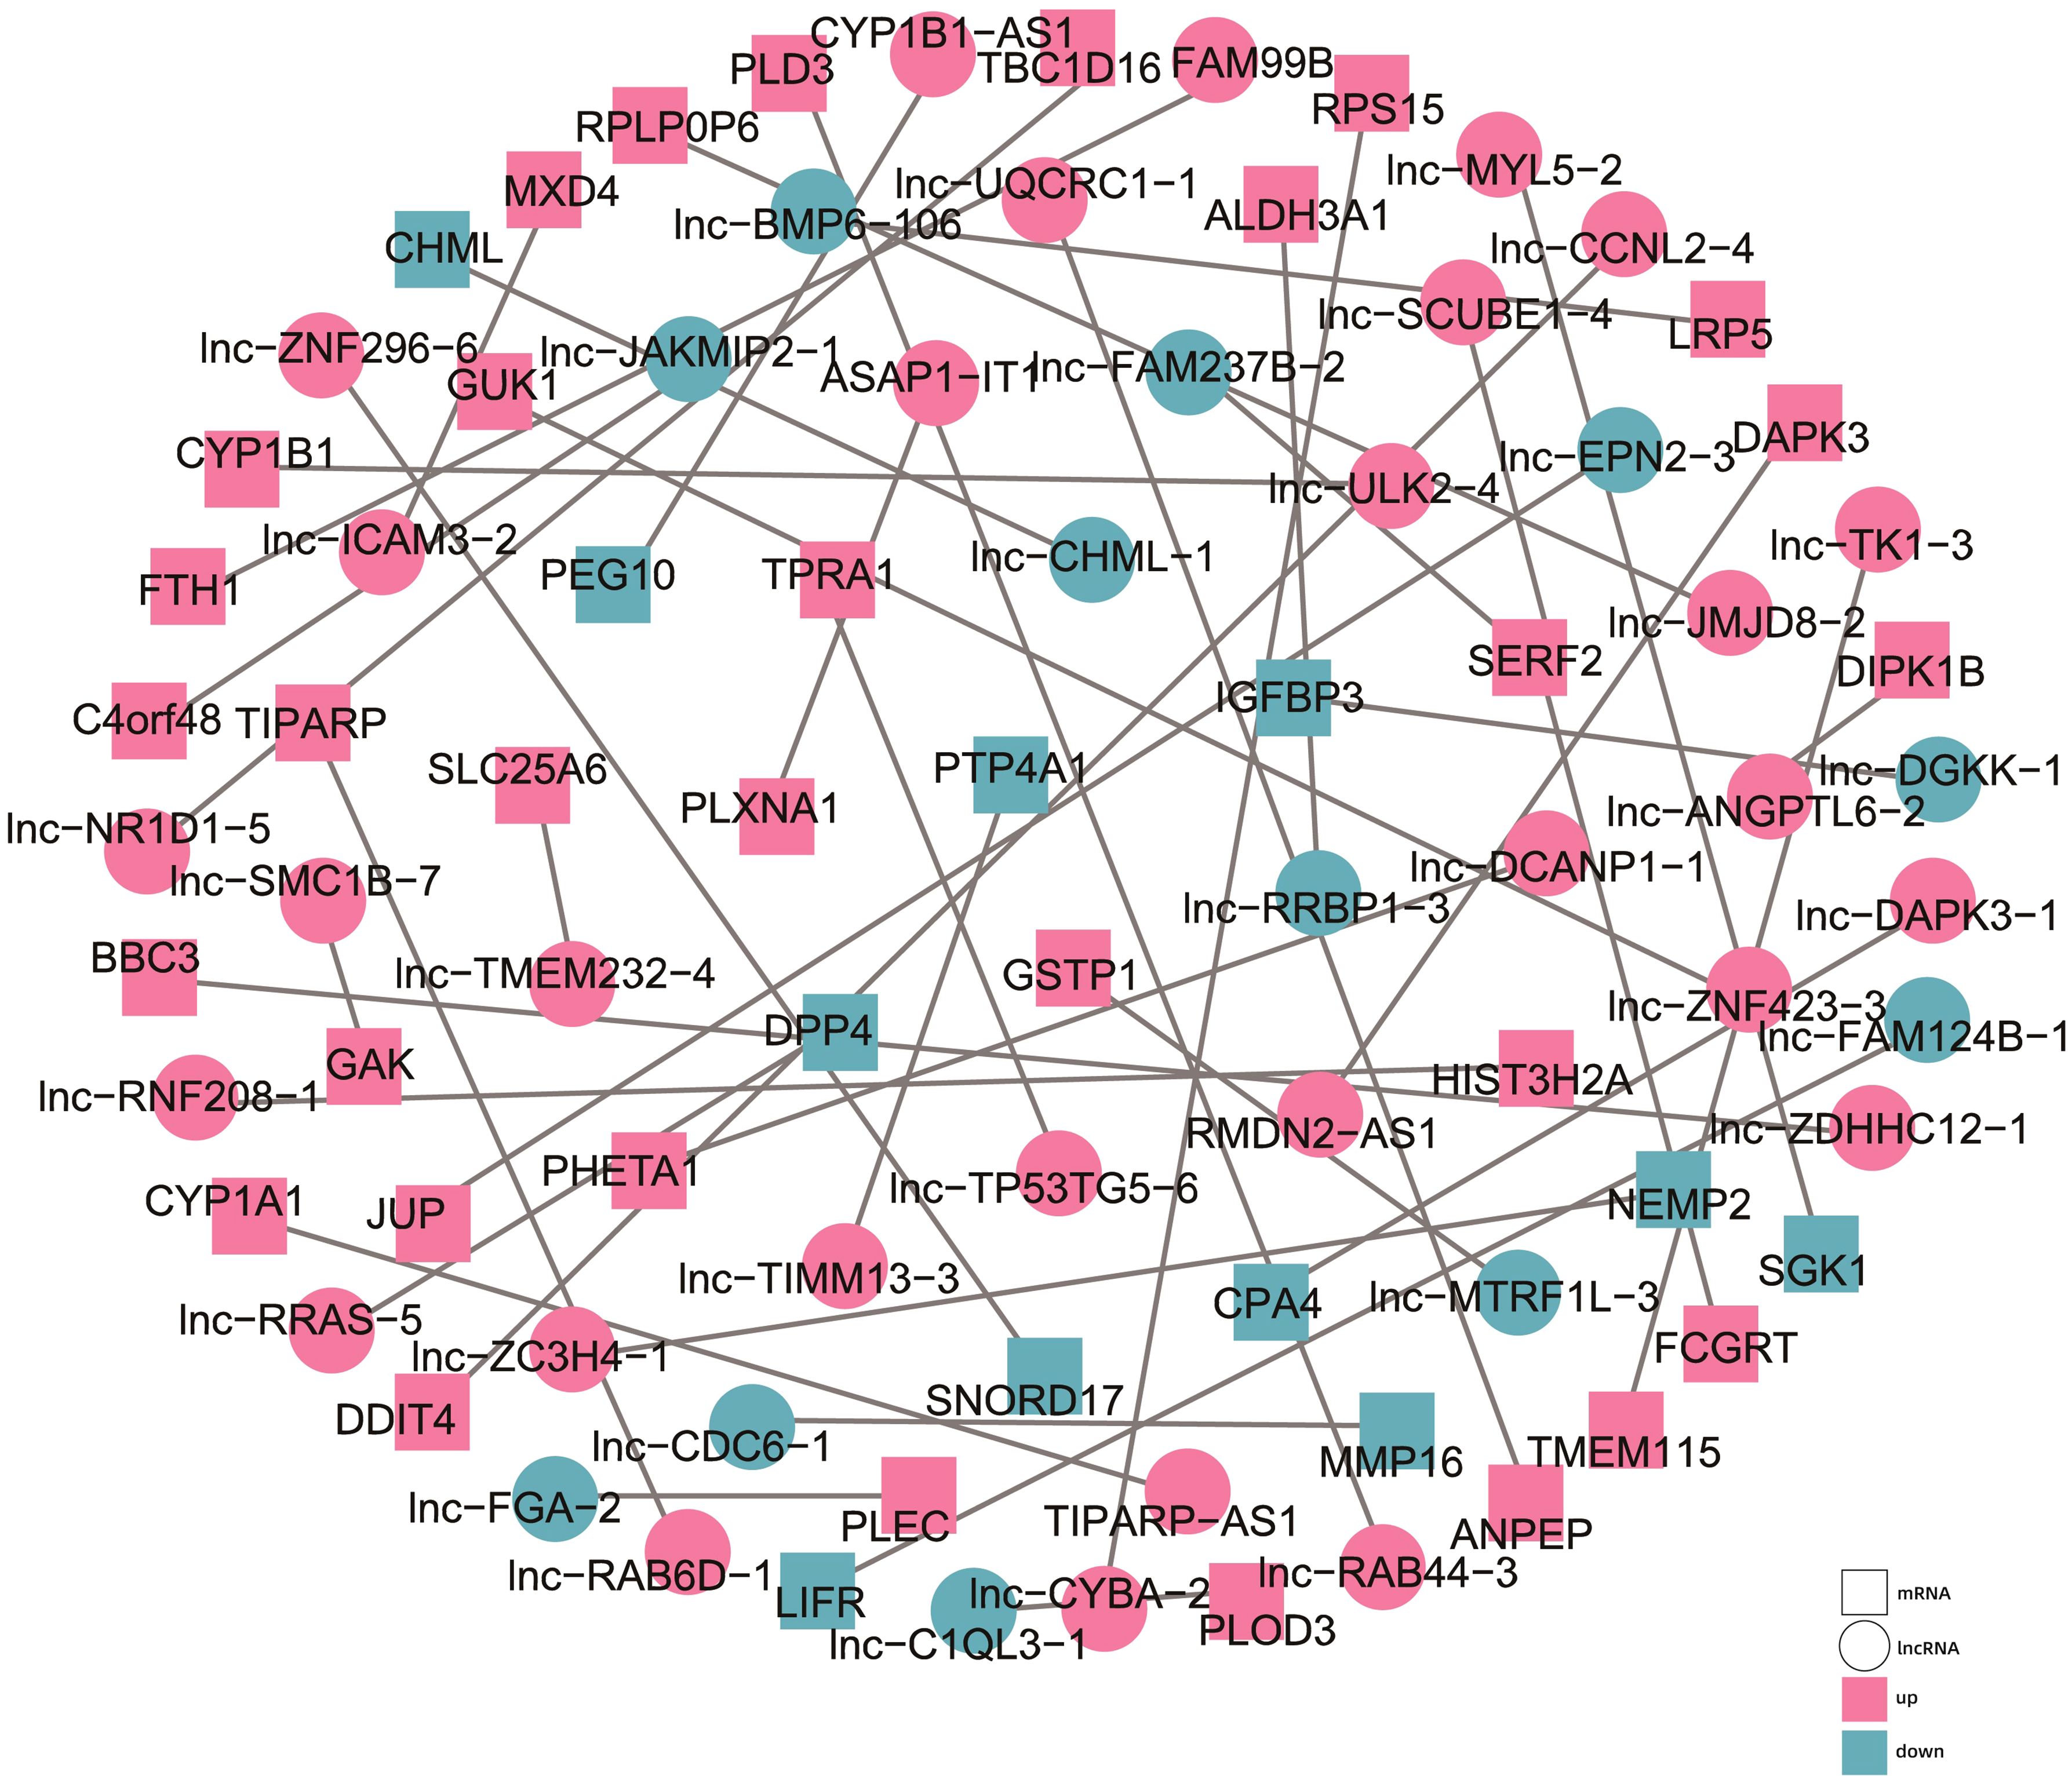
Figure 7. Diagram of the co-expression network between the differentially expressed lncRNAs and mRNAs. The circles represent the lncRNAs, while the squares represent the mRNAs. Purple represents upregulated, and blue represents downregulated.
We identified several significant co-expression pairs. For instance, RMDN2-AS1 was found to be co-expressed with death-associated protein kinase 3 (DAPK3), FAM99B with ferritin heavy chain (FTH1), and ASAP1-IT1 with plexin A1 (PLXNA1), a plasma membrane protein regulated by low-density lipoprotein receptor-related protein 1 (LRP1). Other notable associations included TP53TG5-6 with transmembrane protein adipocyte-related 1 (TPRA1), lnc-BMP6-106 with LDL receptor-related protein 5 (LRP5), and DGKK-1 with insulin-like growth factor binding protein 3 (IGFBP3). Notably, these genes, and consequently their interacting lncRNAs, are involved in the regulation of lipid metabolism, and hence may potentially contribute to the lipid metabolic abnormalities observed in HCC cells. These findings aligned with our KEGG pathway analysis, which highlighted the impact of AHR activation on metabolic pathways, particularly those related to glucose and lipid metabolism.
Overall, our co-expression network analysis suggested that AHR activation modulates glucose and lipid metabolism in HCC at the transcriptional level. This network provides insights into the potential mechanisms underlying hepatocarcinogenesis and suggests directions for future functional studies aimed at understanding the role of lncRNAs in cancer metabolism.
Prognostic relevance of the key AHR-related lncRNAs in HCC
To investigate the prognostic significance of the AHR-dysregulated lncRNAs in HCC, we conducted survival analysis using data from The Cancer Genome Atlas (TCGA). We analyzed the expression profiles of all the differentially expressed lncRNAs following AHR activation in 424 TCGA HCC samples and integrated the associated clinical data. Through this analysis, we identified 10 lncRNAs with significant survival implications and evaluated their potential impact on patient outcomes.
Our analysis revealed that several of these lncRNAs were significantly associated with the prognosis in HCC patients (Figure 8). Specifically, higher expression levels of ASAP1-IT1, RMDN2-AS1, RNF208, and TP53TG5-6 were correlated with a poorer overall survival, while elevated FAM99B expression was linked to improved outcomes. In contrast, among the downregulated lncRNAs, CDC6-1, DGKK-1, NIFK-AS1, and ASH1L-AS1 were associated with an unfavorable prognosis, whereas a higher expression of ADORA2A-AS1 was related to better patient survival.
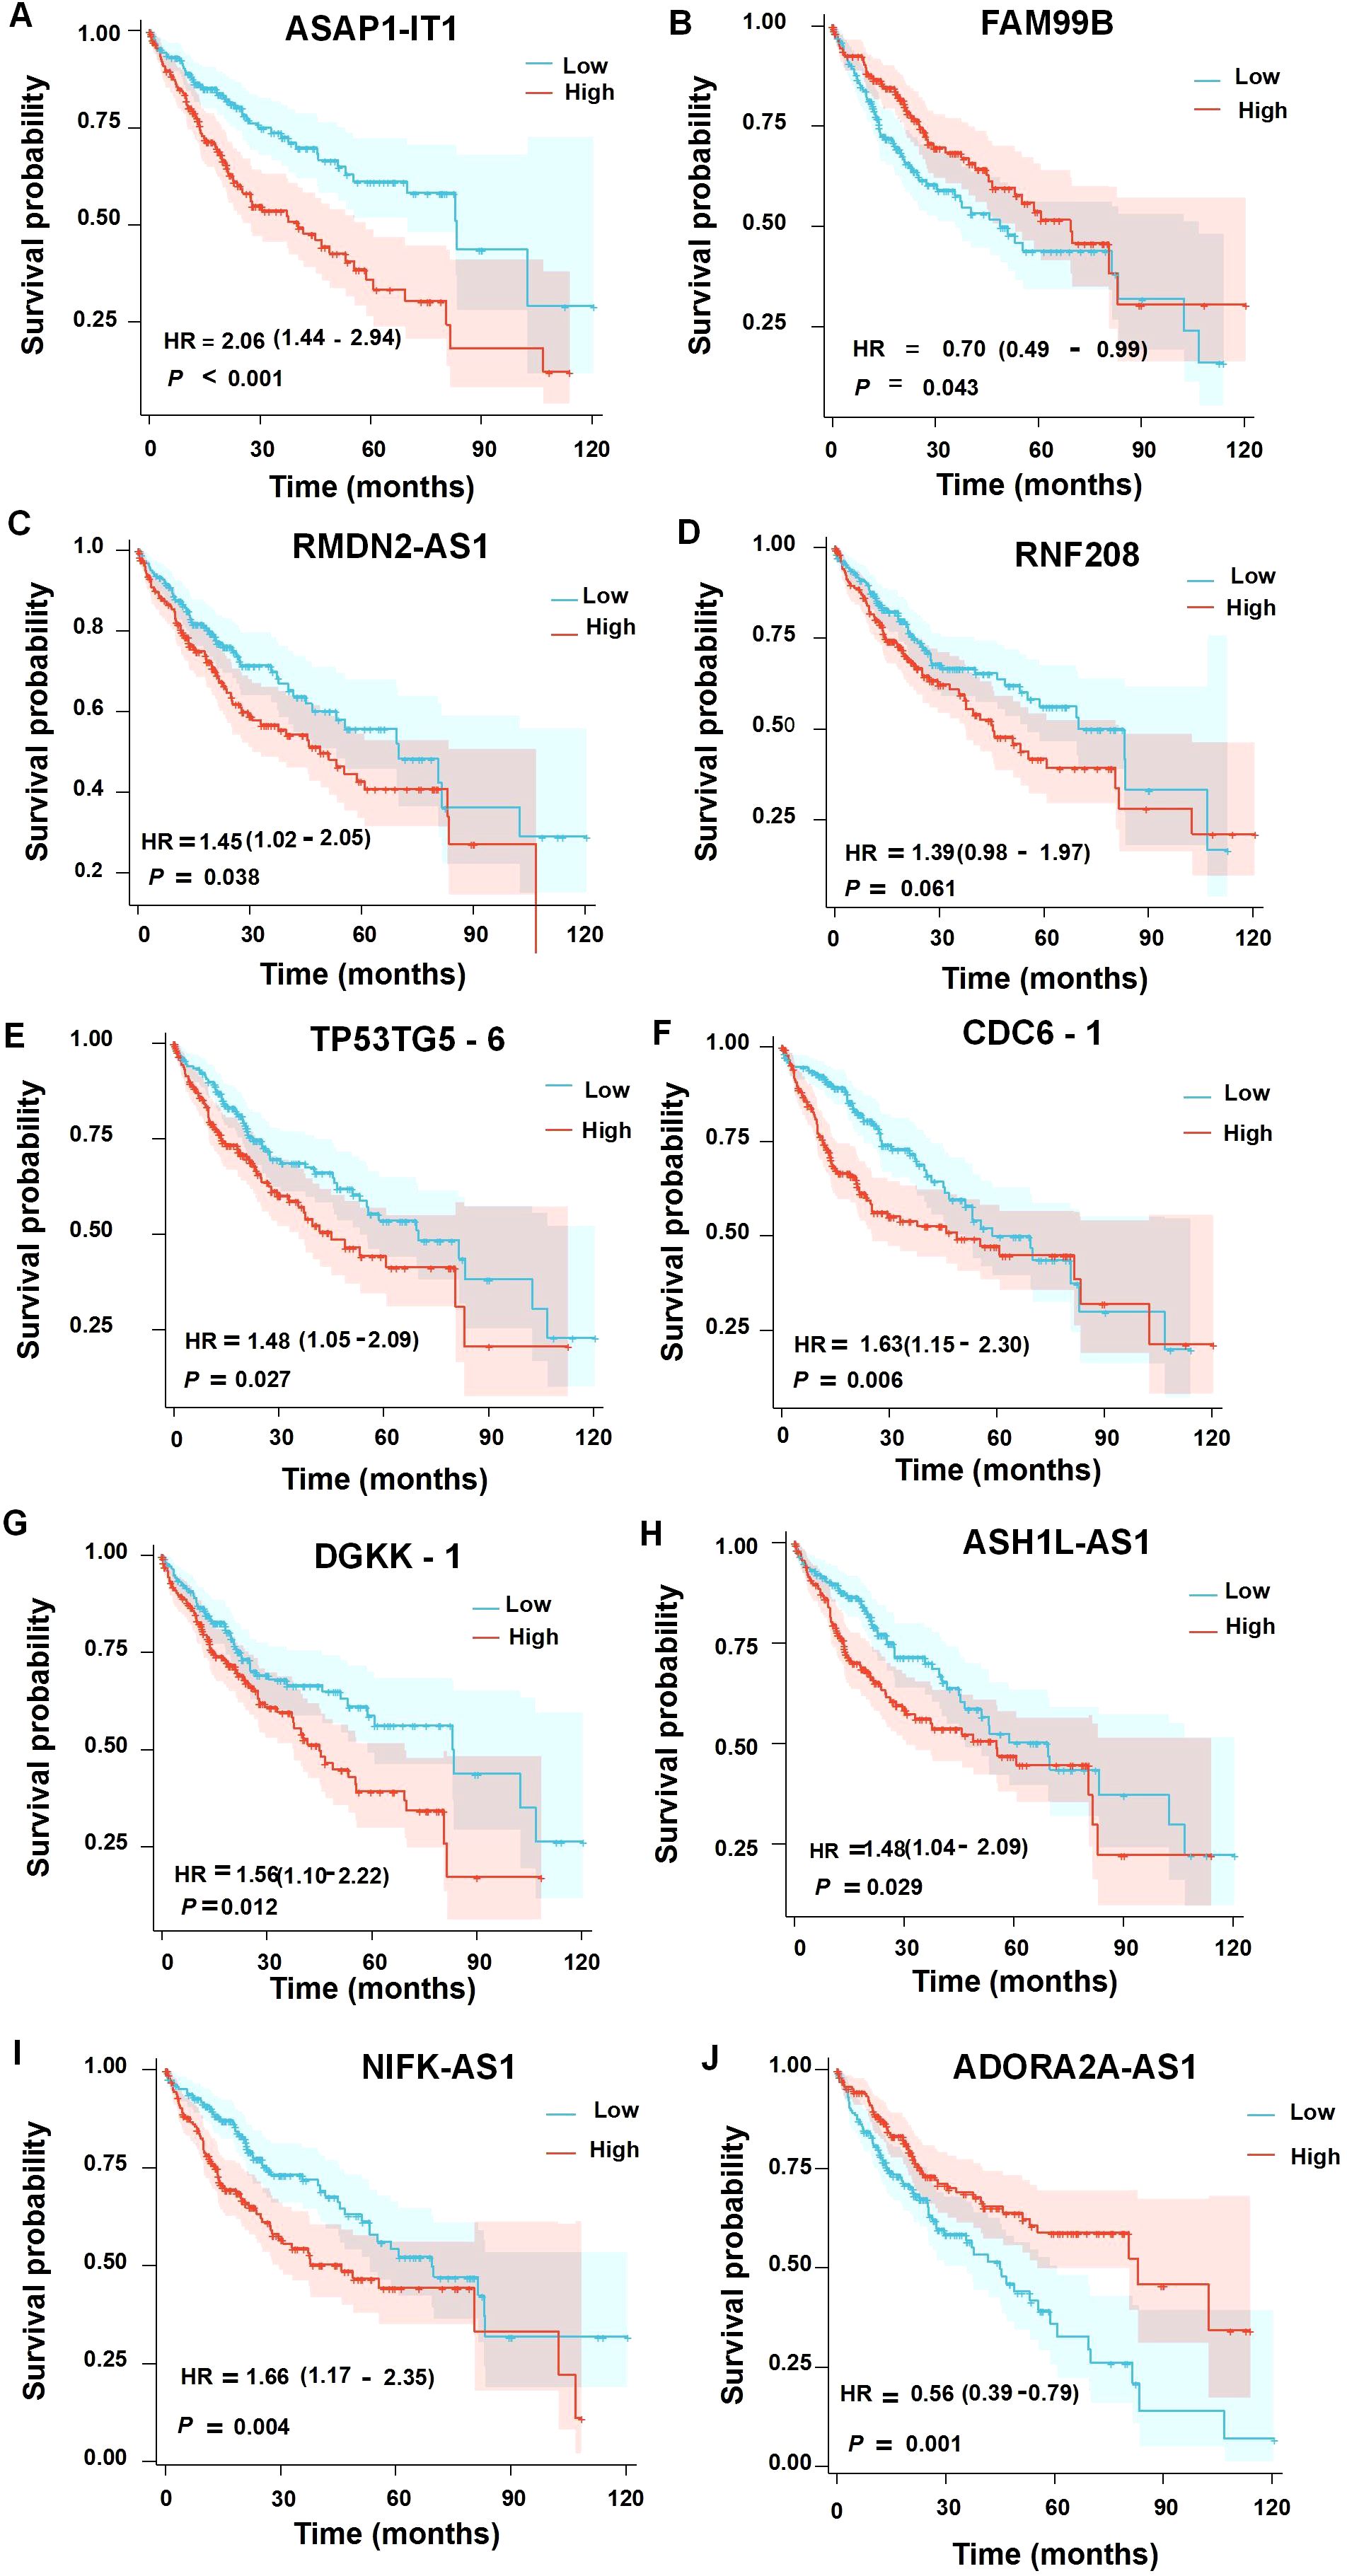
Figure 8. Survival analysis of the upregulated (A–E) or downregulated (F–J) differentially expressed lncRNAs in the prognosis of HCC patients.
Notably, ASAP1-IT1, RMDN2-AS1, and TP53TG5-6 showed a particularly strong correlation with reduced overall survival in primary liver cancer patients, emphasizing their potential role as biomarkers for prognosis. These findings complement our earlier results, which implicated these lncRNAs in AHR-mediated regulatory networks, highlighting their dual importance in both disease progression and prognosis.
In summary, these AHR-dysregulated lncRNAs offer valuable insights into the molecular mechanisms of hepatocellular carcinoma and present potential targets for future therapeutic strategies.
Discussion
In the present study, we investigated the role of AHR activation in HCC, particularly its regulatory effects on long non-coding RNAs (lncRNAs) and mRNAs, using the high-affinity ligand FICZ. Our results demonstrate that AHR activation leads to widespread changes in gene expression, particularly in pathways linked to glucose and lipid metabolism. These findings offer new insights into AHR’s involvement in metabolic reprogramming and its potential implications in HCC progression.
A central observation of our study was the significant dysregulation of metabolic pathways, which underscores AHR’s role in cellular metabolism. Metabolic reprogramming, particularly changes in lipid and glucose metabolism, is a hallmark of cancer progression, and is vital for supporting the energy demands of tumor cells (21, 22). Several of the differentially expressed lncRNAs and mRNAs identified in our analysis were associated with these metabolic processes. For instance, the co-expression of lnc-ASAP1-IT1 with PLXNA1, a protein involved in membrane signaling, suggested the existence of potential regulatory interactions that contribute to metabolic shifts within the tumor microenvironment (23). Similarly, lnc-DGKK-1 co-expression with IGFBP3 highlighted the interplay between AHR activation and lipid metabolism, as IGFBP3 has been implicated in promoting lipogenesis in hepatocytes (24). These metabolic alterations, including enhanced lipogenesis and glucose uptake, are crucial for tumor cell proliferation and survival, suggesting that AHR activation may facilitate tumor growth by promoting metabolic flexibility (25).
The lncRNA–mRNA co-expression network constructed in our study further illustrated the intricate regulatory landscape modulated by AHR activation. Key lncRNAs, such as lnc-RMDN2-AS1, co-expressed with DAPK3, suggest a role in apoptosis regulation—a critical pathway that is often disrupted in cancer (26). Another important co-expression pair comprised FAM99B and FTH1, pointing to a potential involvement in iron homeostasis and oxidative stress response, both of which are altered in cancer cells (27). These co-expression relationships not only deepen our understanding of how AHR modulates gene networks but also suggest that these lncRNAs could serve as regulatory nodes in tumorigenic processes, including metabolic adaptation, apoptosis evasion, and immune modulation.
Our findings also underscore the prognostic potential of several AHR-related lncRNAs. Survival analysis revealed that higher expression levels of ASAP1-IT1, RMDN2-AS1, and TP53TG5-6 were associated with a poor prognosis in HCC patients, suggesting their utility as prognostic biomarkers. Conversely, a higher expression of FAM99B was correlated with better patient outcomes, illustrating the diverse roles that lncRNAs may play in tumor progression. These observations align with the growing evidence that lncRNAs can serve as key regulators of oncogenic pathways, influencing processes such as cell proliferation, migration, and immune evasion. The identification of AHR-related lncRNAs with prognostic significance reinforces the idea that they could be valuable targets for therapeutic intervention in HCC.
AHR is a ligand-activated transcription factor and environmental sensor (28). The AHR–CYP1–FICZ axis was demonstrated to be involved in CYP1A1 overexpression (29). It has also been reported that dietary flavonoids and tryptophan are metabolized into the potent AHR ligand FICZ, triggering AHR nuclear-cytoplasmic activation (30). Immunofluorescence and RNA-seq confirmed that AHR activation in liver cancer cells leads to nuclear translocation and gene regulation. GO clustering and KEGG pathway analyses revealed that FICZ-activated AHR promotes the expression of glucose and lipid metabolism-related genes. Although we did not directly study the AHR–lncRNA–metabolic axis, our findings suggest that modulating lncRNA expression through beneficial AHR ligands could provide a strategy to improve patient outcomes.
One limitation of this study to note is the selected treatment duration of 24 h, which, while effective for capturing early AHR activation and lncRNA responses, may not fully reflect the long-term AHR–lncRNA dynamics. Extending the treatment duration could provide additional insights into sustained or delayed regulatory effects and reveal further downstream interactions. Future studies could explore longer treatment periods to better understand the temporal dynamics of AHR-regulated lncRNAs. Moreover, the variations in AHR activation levels among the different HCC cell lines used in this study may reflect underlying differences in the HCC subtypes or stages. This variability could have influenced the observed AHR–lncRNA interactions and lipid metabolic effects, potentially acting as a confounding factor. Future studies should explore a broader range of cell lines and patient samples to account for this heterogeneity.
Conclusions
Our study provides novel insights into the regulatory role of AHR in HCC, particularly its influence on lncRNAs and mRNAs involved in metabolic processes. The dysregulation of the glucose and lipid metabolism pathways highlights how AHR activation promotes tumor metabolic reprogramming, a crucial factor in tumor progression. Additionally, the identification of key AHR-related lncRNAs with prognostic significance suggests their potential as biomarkers and therapeutic targets in HCC. The interplay between AHR and lncRNAs may have important clinical implications in HCC treatment, particularly through its influence on tumor progression and metabolic reprogramming. Given that AHR regulates key oncogenic pathways and lncRNAs serve as crucial modulators of gene expression, targeting AHR–lncRNA interactions could provide novel therapeutic strategies. Such an approach may help modulate tumor metabolism and drug resistance, offering new avenues for HCC intervention.
Data availability statement
The sequencing data presented in the study are deposited in the national center for biotechnology information (NCBI), BioProject accession number PRJNA550009.
Author contributions
XX: Project administration, Software, Visualization, Writing – original draft. YL: Conceptualization, Project administration, Visualization, Writing – original draft. XQ: Data curation, Resources, Writing – original draft. LL: Data curation, Resources, Software, Writing – original draft. GQL: Methodology, Software, Visualization, Writing – original draft. HC: Investigation, Project administration, Writing – original draft. LZ: Resources, Software, Writing – original draft. YPL: Conceptualization, Methodology, Validation, Writing – original draft, Writing – review & editing.
Funding
The author(s) declare that financial support was received for the research and/or publication of this article. This study was supported by the Foundation of Hunan Provincial Key Laboratory (NO.2023TP1014); the Natural Sciences Funding Project of Hunan Provincial (NO.2024JJ9386, 2021JJ70110); Health Research Project of Hunan Provincial Health Commission (NO.B20180661). The funding agencies had no role in study design, data collection and analysis, preparation of the manuscript, or decision to publish.
Conflict of interest
The authors declare that the research was conducted in the absence of any commercial or financial relationships that could be construed as a potential conflict of interest.
Generative AI statement
The author(s) declare that no Generative AI was used in the creation of this manuscript.
Publisher’s note
All claims expressed in this article are solely those of the authors and do not necessarily represent those of their affiliated organizations, or those of the publisher, the editors and the reviewers. Any product that may be evaluated in this article, or claim that may be made by its manufacturer, is not guaranteed or endorsed by the publisher.
References
1. Sung H, Ferlay J, Siegel RL, Laversanne M, Soerjomataram I, Jemal A, et al. Global cancer statistics 2020: globocan estimates of incidence and mortality worldwide for 36 cancers in 185 countries. CA Cancer J Clin. (2021) 71:209–49. doi: 10.3322/caac.21660
2. Vogel CFA, Haarmann-Stemmann T. The aryl hydrocarbon receptor repressor - more than a simple feedback inhibitor of ahr signaling: clues for its role in inflammation and cancer. Curr Opin Toxicol. (2017) 2:109–19. doi: 10.1016/j.cotox.2017.02.004
3. Wang Z, Zhang Y, Liao Z, Huang M, Shui X. The potential of aryl hydrocarbon receptor as receptors for metabolic changes in tumors. Front Oncol. (2024) 14:1328606. doi: 10.3389/fonc.2024.1328606
4. Klinge CM, Bowers JL, Kulakosky PC, Kamboj KK, Swanson HI. The aryl hydrocarbon receptor (Ahr)/ahr nuclear translocator (Arnt) heterodimer interacts with naturally occurring estrogen response elements. Mol Cell Endocrinol. (1999) 157:105–19. doi: 10.1016/s0303-7207(99)00165-3
5. Endler A, Chen L, Shibasaki F. Coactivator recruitment of ahr/arnt1. Int J Mol Sci. (2014) 15:11100–10. doi: 10.3390/ijms150611100
6. Vuerich M, Harshe R, Frank LA, Mukherjee S, Gromova B, Csizmadia E, et al. Altered aryl-hydrocarbon-receptor signalling affects regulatory and effector cell immunity in autoimmune hepatitis. J Hepatol. (2021) 74:48–57. doi: 10.1016/j.jhep.2020.06.044
7. Hu CY, Mohtat D, Yu Y, Ko YA, Shenoy N, Bhattacharya S, et al. Kidney cancer is characterized by aberrant methylation of tissue-specific enhancers that are prognostic for overall survival. Clin Cancer Res. (2014) 20:4349–60. doi: 10.1158/1078-0432.ccr-14-0494
8. Liu Z, Wu X, Zhang F, Han L, Bao G, He X, et al. Ahr expression is increased in hepatocellular carcinoma. J Mol Histol. (2013) 44:455–61. doi: 10.1007/s10735-013-9495-6
9. Hsu SH, Wang LT, Chai CY, Wu CC, Hsi E, Chiou SS, et al. Aryl hydrocarbon receptor promotes hepatocellular carcinoma tumorigenesis by targeting intestine-specific homeobox expression. Mol Carcinog. (2017) 56:2167–77. doi: 10.1002/mc.22658
10. Chen CT, Wu PH, Hu CC, Nien HC, Wang JT, Sheu JC, et al. Aberrant upregulation of indoleamine 2,3-dioxygenase 1 promotes proliferation and metastasis of hepatocellular carcinoma cells via coordinated activation of ahr and B-catenin signaling. Int J Mol Sci. (2021) 22:11661. doi: 10.3390/ijms222111661
11. Li L, Wang T, Li S, Chen Z, Wu J, Cao W, et al. Tdo2 promotes the emt of hepatocellular carcinoma through kyn-ahr pathway. Front Oncol. (2020) 10:562823. doi: 10.3389/fonc.2020.562823
12. Nie L, Wu HJ, Hsu JM, Chang SS, Labaff AM, Li CW, et al. Long non-coding rnas: versatile master regulators of gene expression and crucial players in cancer. Am J Transl Res. (2012) 4:127–50.
13. Statello L, Guo CJ, Chen LL, Huarte M. Gene regulation by long non-coding rnas and its biological functions. Nat Rev Mol Cell Biol. (2021) 22:96–118. doi: 10.1038/s41580-020-00315-9
14. Kim D, Paggi JM, Park C, Bennett C, Salzberg SL. Graph-based genome alignment and genotyping with hisat2 and hisat-genotype. Nat Biotechnol. (2019) 37:907–15. doi: 10.1038/s41587-019-0201-4
15. Pertea M, Pertea GM, Antonescu CM, Chang TC, Mendell JT, Salzberg SL. Stringtie enables improved reconstruction of a transcriptome from rna-seq reads. Nat Biotechnol. (2015) 33:290–5. doi: 10.1038/nbt.3122
16. Kong L, Zhang Y, Ye ZQ, Liu XQ, Zhao SQ, Wei L, et al. Cpc: assess the protein-coding potential of transcripts using sequence features and support vector machine. Nucleic Acids Res. (2007) 35:W345–9. doi: 10.1093/nar/gkm391
17. Sun L, Luo H, Bu D, Zhao G, Yu K, Zhang C, et al. Utilizing sequence intrinsic composition to classify protein-coding and long non-coding transcripts. Nucleic Acids Res. (2013) 41:e166. doi: 10.1093/nar/gkt646
18. Mistry J, Chuguransky S, Williams L, Qureshi M, Salazar GA, Sonnhammer ELL, et al. Pfam: the protein families database in 2021. Nucleic Acids Res. (2021) 49:D412–d9. doi: 10.1093/nar/gkaa913
19. Ritchie ME, Phipson B, Wu D, Hu Y, Law CW, Shi W, et al. Limma powers differential expression analyses for rna-sequencing and microarray studies. Nucleic Acids Res. (2015) 43:e47. doi: 10.1093/nar/gkv007
20. Yu G, Wang LG, Han Y, He QY. Clusterprofiler: an R package for comparing biological themes among gene clusters. Omics. (2012) 16:284–7. doi: 10.1089/omi.2011.0118
21. Pavlova NN, Thompson CB. The emerging hallmarks of cancer metabolism. Cell Metab. (2016) 23:27–47. doi: 10.1016/j.cmet.2015.12.006
22. Pavlova NN, Zhu J, Thompson CB. The hallmarks of cancer metabolism: still emerging. Cell Metab. (2022) 34:355–77. doi: 10.1016/j.cmet.2022.01.007
23. Yamada D, Watanabe S, Kawahara K, Maeda T. Plexin A1 signaling confers Malignant phenotypes in lung cancer cells. Biochem Biophys Res Commun. (2016) 480:75–80. doi: 10.1016/j.bbrc.2016.10.006
24. Arab JP, Cabrera D, Sehrawat TS, Jalan-Sakrikar N, Verma VK, Simonetto D, et al. Hepatic stellate cell activation promotes alcohol-induced steatohepatitis through igfbp3 and serpina12. J Hepatol. (2020) 73:149–60. doi: 10.1016/j.jhep.2020.02.005
25. Fu Y, Zou T, Shen X, Nelson PJ, Li J, Wu C, et al. Lipid metabolism in cancer progression and therapeutic strategies. MedComm (2020). (2021) 2:27–59. doi: 10.1002/mco2.27
26. Li GM, Li L, Li MQ, Chen X, Su Q, Deng ZJ, et al. Dapk3 inhibits gastric cancer progression via activation of ulk1-dependent autophagy. Cell Death Differ. (2021) 28:952–67. doi: 10.1038/s41418-020-00627-5
27. Cui J, Chen Y, Yang Q, Zhao P, Yang M, Wang X, et al. Protosappanin a protects dox-induced myocardial injury and cardiac dysfunction by targeting acsl4/fth1 axis-dependent ferroptosis. Adv Sci (Weinh). (2024) 11:e2310227. doi: 10.1002/advs.202310227
28. Avilla MN, Malecki KMC, Hahn ME, Wilson RH, Bradfield CA. The ah receptor: adaptive metabolism, ligand diversity, and the xenokine model. Chem Res Toxicol. (2020) 33:860–79. doi: 10.1021/acs.chemrestox.9b00476
29. Schiering C, Wincent E, Metidji A, Iseppon A, Li Y, Potocnik AJ, et al. Feedback control of ahr signalling regulates intestinal immunity. Nature. (2017) 542:242–5. doi: 10.1038/nature21080
30. Ikuta Y, Hayashida Y, Hirata S, Irie A, Senju S, Kubo T, et al. Identification of the H2-kd-restricted cytotoxic T lymphocyte epitopes of a tumor-associated antigen, sparc, which can stimulate antitumor immunity without causing autoimmune disease in mice. Cancer Sci. (2009) 100:132–7. doi: 10.1111/j.1349-7006.2008.01016.x
Keywords: hepatocellular carcinoma, RNA-sequencing, aryl hydrocarbon receptors, glucose and lipid metabolism, mRNAs
Citation: Xiao X, Liu Y, Qu X, Liu L, Li G-Q, Chen H, Zhou L and Liu Y (2025) Aryl hydrocarbon receptor-regulated long non-coding RNAs: implications for glycolipid metabolism and prognosis in hepatocellular carcinoma. Front. Oncol. 15:1537481. doi: 10.3389/fonc.2025.1537481
Received: 30 November 2024; Accepted: 21 February 2025;
Published: 03 April 2025.
Edited by:
Matthew J. Marton, MSD, United StatesReviewed by:
Md Sadique Hussain, Uttaranchal University, IndiaJian Xie, Zunyi Medical University, China
Copyright © 2025 Xiao, Liu, Qu, Liu, Li, Chen, Zhou and Liu. This is an open-access article distributed under the terms of the Creative Commons Attribution License (CC BY). The use, distribution or reproduction in other forums is permitted, provided the original author(s) and the copyright owner(s) are credited and that the original publication in this journal is cited, in accordance with accepted academic practice. No use, distribution or reproduction is permitted which does not comply with these terms.
*Correspondence: Yanping Liu, bml1Y3VvemlAMTYzLmNvbQ==
†These authors have contributed equally to this work and share first authorship