 Alessandro Costa1
 Federica Pilo2*
 Martina Pettinau2Eugenia Piras2Clara Targhetta2Rodrigo Rojas2Paola Deias2
 Olga Mulas1,2
 Giovanni Caocci1,2
- 1Hematology, Department of Medical Sciences and Public Health, University of Cagliari, Cagliari, Italy
- 2Hematology and HSCT Unit, “A. Businco” Hospital, ARNAS, Brotzu, Cagliari, Italy
Background: Therapy-related myeloid neoplasms (t-MN) are aggressive hematologic malignancies with poor prognosis and high-risk clinical features. Recent advances have highlighted the role of molecular data in refining prognostic models. This study aims to analyze a monocentric cohort of t-MN patients, focusing on the clinical and prognostic impact of prior malignancies and their associated molecular landscape.
Methods: A retrospective analysis was conducted on 61 patients diagnosed with t-MN from an Oncology Hospital and referred to a hematology Unit. Diagnoses were based on established criteria for therapy-related myelodysplastic syndrome (t-MDS) and therapy-related acute myeloid leukemia (t-AML), with a history of prior exposure to cytotoxic therapy. Cytogenetic and molecular analyses supported the diagnoses. Risk stratification was performed using the revised International Prognostic Scoring System (IPSS-R) and molecular IPSS (IPSS-M) for t-MDS and the 2022 European LeukemiaNet (ELN) classification for t-AML.
Results: Overall, 61 patients with t-MN were diagnosed: 38 (62.3%) with t-MDS, and 23 (37.7%) with t-AML. The median latency from primary cancer to t-MN diagnosis was 5.8 years (IQR: 2.6–12.5). Risk stratification identified 63.2% of t-MDS cases as IPSS-R very-low to intermediate risk, while 57.9% were reclassified as IPSS-M moderate-high to very high risk. Patients with prior hematologic cancer showed a greater tendency toward higher IPSS-R (p=0.021) and IPSS-M (p=0.015) risk compared to solid cancer. The IPSS-M, more accurately than R-IPSS, demonstrated predictive value for survival in both univariate and multivariate analyses and effectively predicted leukemic progression in t-MDS. TP53-mutated cases were more prevalent in patients with prior hematologic cancer (p=0.043) and associated with longer latency (8.2 years) compared to TP53 wild type (6.1 years, p=0.044). Allogeneic transplantation proved beneficial, significantly improving survival outcomes in eligible t-MDS and t-AML patients.
Conclusions: t-MN exhibits distinct clinical and molecular profiles according to prior malignancy type. Intriguingly, our analysis reveals a distinct latency pattern in TP53-mutated cases, suggesting unique leukemogenic dynamics. Moreover, IPSS-M proved highly accurate in predicting t-MDS survival. Integrating molecular data into prognostic models enhances risk stratification and informs therapeutic strategies, potentially improving outcomes for t-MN patients. Further studies are needed to validate these findings and refine tailored treatment approaches.
1 Introduction
Therapy-related myeloid neoplasms (t-MN), comprised of therapy-related myelodysplastic syndromes (t-MDS), acute myeloid leukemia (t-AML), and myelodysplastic/myeloproliferative neoplasms (t-MDS/MPN), represent a rare but severe complication of cytotoxic treatments used for both malignant and non-malignant diseases (1, 2). While these treatments have substantially improved survival rates in cancer patients, they are also associated with an increased risk of secondary hematologic malignancies (3).
Cytogenetic and molecular profiling have revealed significant differences between t-MN and de novo MN. Specifically, therapy-related cases are characterized by a higher prevalence of high-risk cytogenetic abnormalities, including complex karyotypes (4, 5). In addition, next-generation sequencing (NGS) has revealed a mutational profile that, while largely shared with de novo cases, demonstrates a higher prevalence of mutations in adverse prognostic genes such as TP53, SETBP1, and SRSF2, and a lower incidence of mutations in genes like NPM1, FLT3, and IDH1/2 (6).
Recent advancements have integrated molecular data into classification and prognostic models for both t-MDS and t-AML. In t-MDS, a major achievement has been the development of the molecular International Prognostic Scoring System (IPSS-M), which incorporates molecular information and the revised IPSS (IPSS-R). The original study included 8% of t-MDS cases, which were more frequently categorized as IPSS-M high/very high risk but exhibited comparable outcomes to de novo cases within each risk category (7). Similarly, t-AML has not consistently emerged as an independent risk factor for survival in some studies. In contrast, others report worse outcomes in intermediate-high risk categories, with no difference in favorable risk compared to de novo AML (5, 8).
Historically, the prognosis of t-MN has been poor, with a 5-year survival rate of approximately 10% (9). This outcome is primarily influenced by factors such as advanced age, a higher burden of comorbidities, and the cumulative toxicities of prior cytotoxic therapies (10). To date, molecular analysis has been evaluated, providing prognostic insights and highlighting significant differences based on the latency from the primary malignancy (4). However, limited data are available regarding the molecular profile in relation to the primary cancer.
This study investigates the clinical and molecular characteristics of a monocentric cohort of t-MN patients from an Oncology Hospital referred to the Hematology Unit, focusing on the prognostic implications of prior malignancy types and their associated molecular profiles. These findings may enhance current risk assessment models and guide the development of personalized therapeutic strategies, ultimately improving patient outcomes.
2 Materials and methods
2.1 Study population
We performed a retrospective analysis of 61 patients diagnosed with t-MN and treated at our institution between January 2009 and November 2024. Clinical data were retrieved from medical records. The diagnosis of t-MN was established based on the recognized criteria for MDS or AML, combined with a documented history of exposure to cytotoxic therapy for unrelated malignancies (2). Patients with MN and a history of prior malignancy were excluded if they had not received chemotherapy or radiotherapy, immunotherapy, hormone therapy, target therapy, or if they had undergone surgery alone. Bone marrow evaluations were conducted using cytology, histology, and flow cytometry. The general clinical condition of patients was assessed using the Eastern Cooperative Oncology Group (ECOG) performance status (PS) (11). For t-MDS, risk classification was based on both the IPSS-R (12) and IPSS-M (7). For t-AML, risk stratification followed the 2022 ELN guidelines (13). The SIE/SIES/GITMO criteria were retrospectively applied to categorize patients as fit or unfit for intensive chemotherapy (14).
2.2 Cytogenetic and genetic analysis
Chromosomal banding was performed using standard techniques, with karyotypes described according to the International System for Human Cytogenetic Nomenclature (ISCN). Mutational analysis of FLT3-ITD, RUNX1::RUNX1T1, CBF::MYH11, PML::RARA, WT1, NPM1, and BCR::ABL1 was conducted using real-time PCR (RT-PCR).
Targeted NGS was performed to analyze 40 genes frequently mutated in myeloid neoplasms. Genomic DNA extracted from peripheral blood or bone marrow was processed using the Oncomine Myeloid Research panel (Thermo Fisher Scientific) and sequenced on the Ion Torrent GeneStudio™ S5 system with a targeted coverage depth exceeding 300x. Data analysis was conducted using Torrent Suite and Ion Reporter™ Software, with reads aligned to the hg19 reference genome. Variants were reported if the variant allele frequency (VAF) was ≥5% with ≥300x coverage or ≥2% for hotspot mutations with ≥100x coverage. Only pathogenic, likely pathogenic, or variants of uncertain significance were reported, adhering to HGVS nomenclature guidelines (15). Polymorphisms and benign variants were excluded from the report.
2.3 Statistical analysis
Continuous variables were reported as medians with interquartile ranges (IQR), and categorical variables as frequencies and percentages. Comparisons between groups were conducted using Chi-squared tests for nominal variables, Fisher’s exact test, and the Wilcoxon-Mann-Whitney test for non-parametric data. Logistic regression was employed to calculate odds ratios (ORs) with 95% confidence intervals (95% CI). Overall survival (OS) was defined as the time from t-MN diagnosis to death or last follow-up, and progression-free survival (PFS) was defined as the time from t-MDS diagnosis to diagnosis of leukemic progression. Kaplan-Meier curves were used for survival analysis, with differences assessed via the Log-Rank test. Hazard ratios (HR) with 95% CI for survival-associated factors were calculated using univariate and multivariate Cox proportional hazards regression. A p-value < 0.05 was considered statistically significant. Statistical analyses were conducted using R software (R Core Team, 2021), version 4.1.2 (R Foundation for Statistical Computing, Vienna, Austria).
3 Results
3.1 Demographics and biological features of t-MN cohort
Patient clinical and biological characteristics are detailed in Table 1. Overall, the analysis included 61 patients with t-MN, comprising 38 patients (62.3%) diagnosed with t-MDS and 23 (37.7%) with t-AML. The median age at t-MN diagnosis was 69.9 years (IQR: 59.0–74.6). Notably, patients with t-MDS were significantly older than t-AML patients at t-MN diagnosis (p<0.001). The majority of patients exhibited PS ECOG of 0–1 (86.9%), with no significant difference between t-MDS and t-AML subgroups (p=0.784). At the time of t-MN diagnosis, 38 patients (48.2%) presented with at least one comorbidity, most frequently cardiovascular disease (46.4%). Comorbidity burden and blood count data were comparable between diagnostic subgroups, except for a significantly lower median platelet count observed in t-AML (p=0.033).
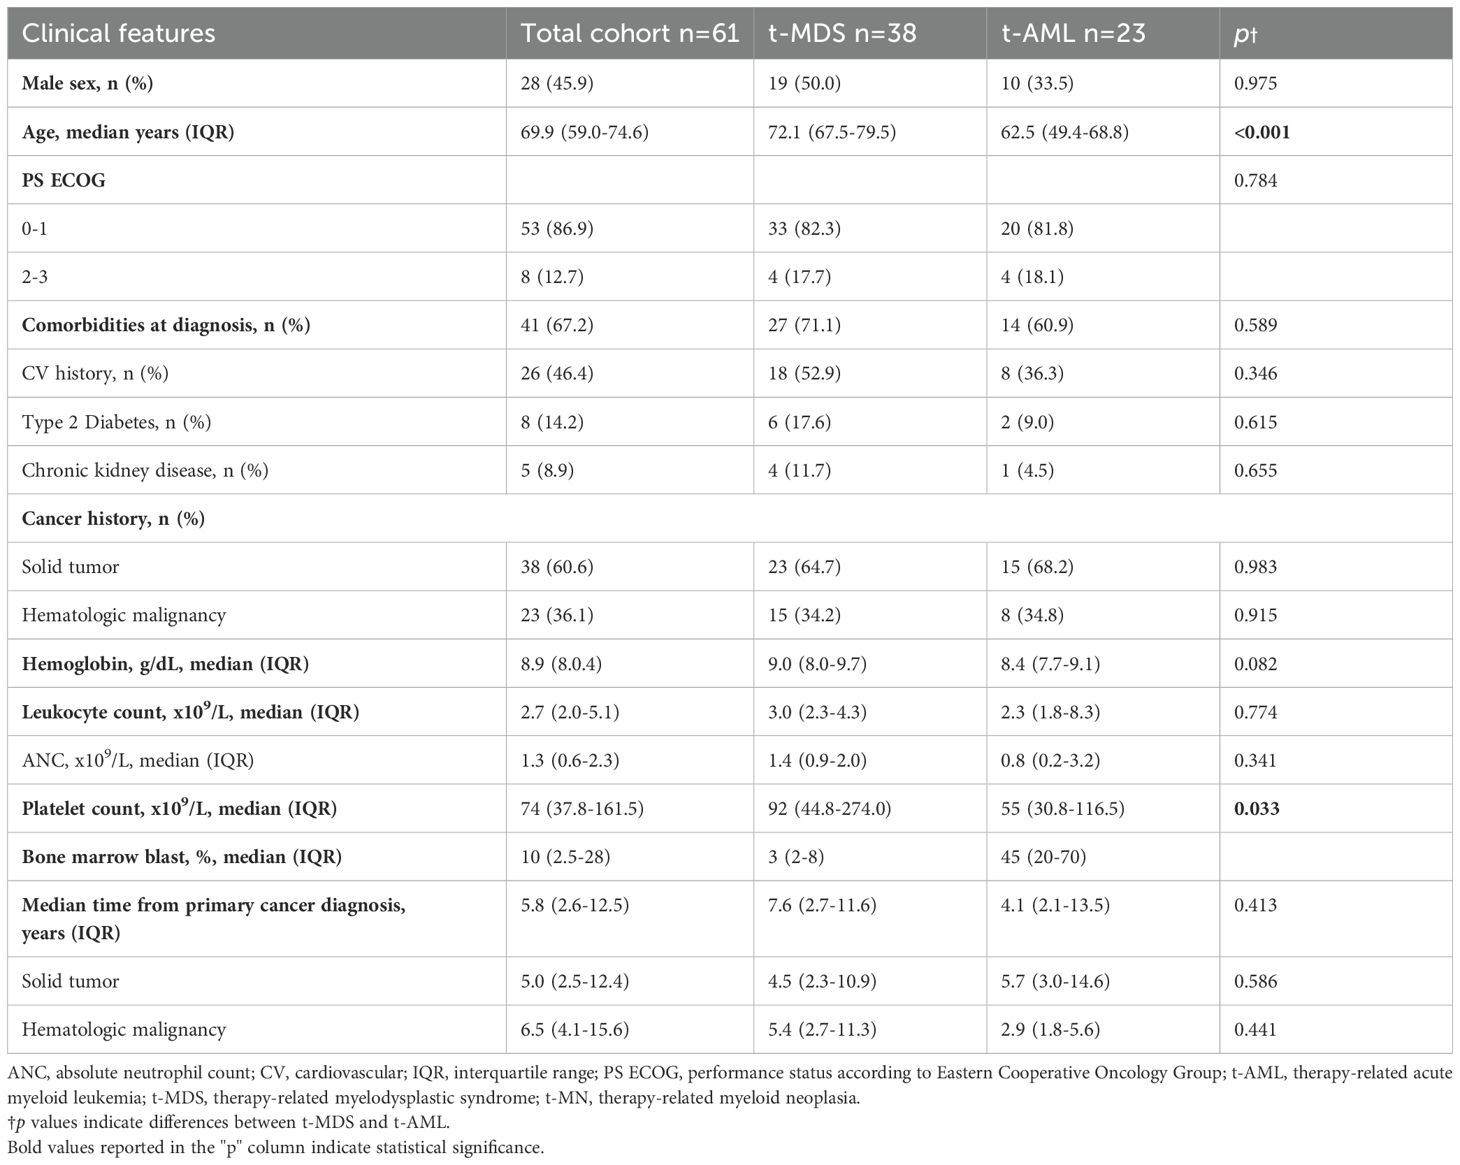
Table 1. Clinical features at diagnosis of t-MN, including differences between t-MDS and t-AML.
A prior history of solid and hematologic cancer was documented in 38 (62.3%) and in 23 (37.7%) patients, respectively. The spectrum of primary malignancies and previous cytotoxic therapies is detailed in Figure 1. Cytogenetic analysis was conducted in all enrolled patients (Supplementary Figure 1), revealing abnormalities in 37 cases (60.7%), including a complex karyotype in 11 (18%). Notably, complex karyotypes were more frequent in patients with prior hematologic malignancies than in those with solid tumors (p=0.049). No other significant cytogenetic differences were observed based on cancer history.
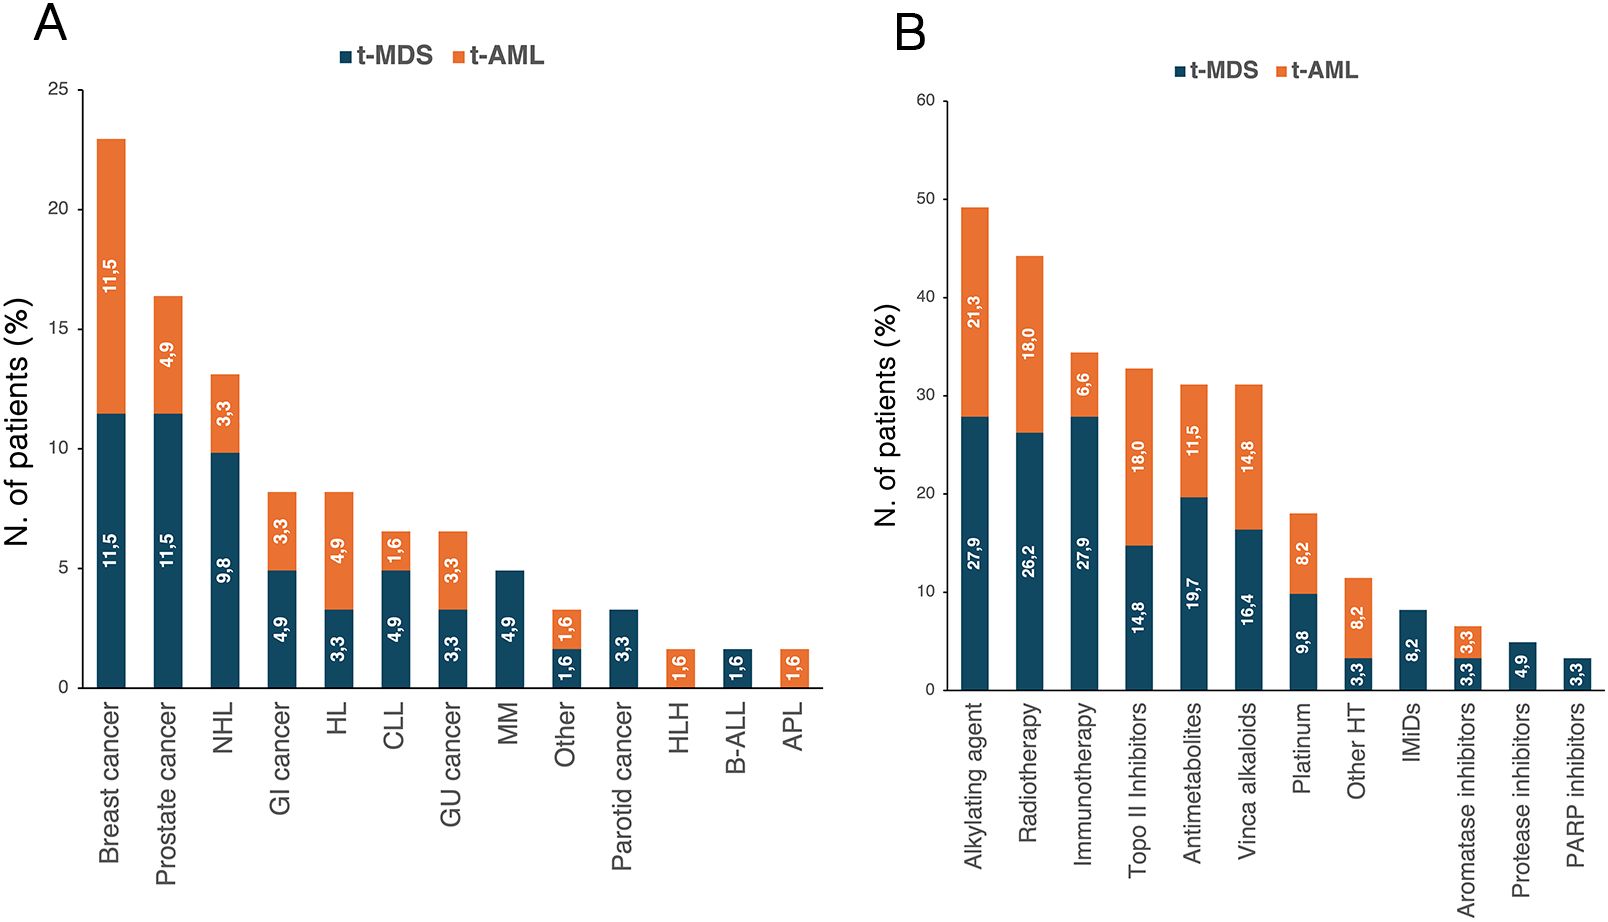
Figure 1. Distribution of primary cancer diagnoses (A) and prior cytotoxic therapies (B) according to diagnosis of t-MDS and t-AML. The percentages reported within the bars were calculated based on the total number of patients with t-MN (n=61). APL, acute promyelocytic leukemia; B-ALL, Acute lymphoblastic leukemia B; CLL, chronic lymphocytic leukemia; GI, gastrointestinal; GU, genitourinary; HL, Hodgkin lymphoma; HLH, hemophagocytic lymphohystiocytosis; HT, hormone therapy; IMiDs, immunomodulatory drugs; MM, multiple myeloma; NHL, non-Hodgkin lymphoma; t-AML, therapy-related acute myeloid leukemia; t-MDS, therapy-related myelodysplastic syndrome; t-MN, therapy-related myeloid neoplasms.
Overall, 31 (50.8%) also underwent NGS analysis (Supplementary Figure 1). Among the 23 patients with NGS-detected mutations, 12 (52.2%) harbored a single isolated variant, 7 (30.4%) exhibited two co-occurring mutations, and 4 (17.4%) carried three or more concurrent mutations. Subgroup analysis by primary cancer type showed no significant difference in the frequency of isolated versus co-occurring mutations (p=0.931). However, TP53 mutations were more prevalent in patients with hematologic malignancies (n=6) compared to those with solid tumors (n=1) (p=0.043). Notably, none of the TP53-mutated cases harbored DNMT3A, TET2, or ASXL1 (DTA) mutations. In contrast, DTA co-mutations with non-DTA genes were observed in 7 cases (30.4%), more commonly in patients with prior solid tumors than in those with hematologic malignancies, though this difference did not reach statistical significance (p=0.619).
The median latency from primary malignancy to t-MN was 5.8 years (IQR: 2.6–12.5), with no significant differences between t-MDS and t-AML subgroups (p=0.413). Similarly, latency did not differ significantly between patients with a prior history of solid tumors and those with hematologic malignancies (p=0.536). To further characterize latency patterns, we stratified patients into three groups based on previously published data (16): short latency (<1 year), intermediate latency (1–10 years), and long latency (>10 years) (Supplementary Figure 1). The majority of cases (n=38, 62.3%) exhibited intermediate latency, while 18 (29.5%) had long latency and 5 (8.2%) showed short latency. Patients with a prior hematologic malignancy were more likely to experience short latency compared to those with solid tumors (17.4% vs. 2.6%, p=0.0412). No significant differences emerged for intermediate (56.5% vs. 65.8%, p=0.556) or long latency (26.1% vs 31.6%, p=0.868). Notably, TP53 mutations, classified as either single-hit (n=3) or multi-hit (n=4) according to ICC criteria (1), have shown a longer median latency from primary disease compared to TP53 wild-type [8.2 years (IQR: 4.6–19.3) vs. 6.1 years (IQR: 1.9–17.0), p=0.044] (Figure 2). Conversely, no significant differences were observed between DTA-mutated cases compared to TP53 or SF3B1 mutated. No differences were instead recorded between normal and complex karyotype, -7/del(7q) and -5/del(5q) cohort (Figure 2).
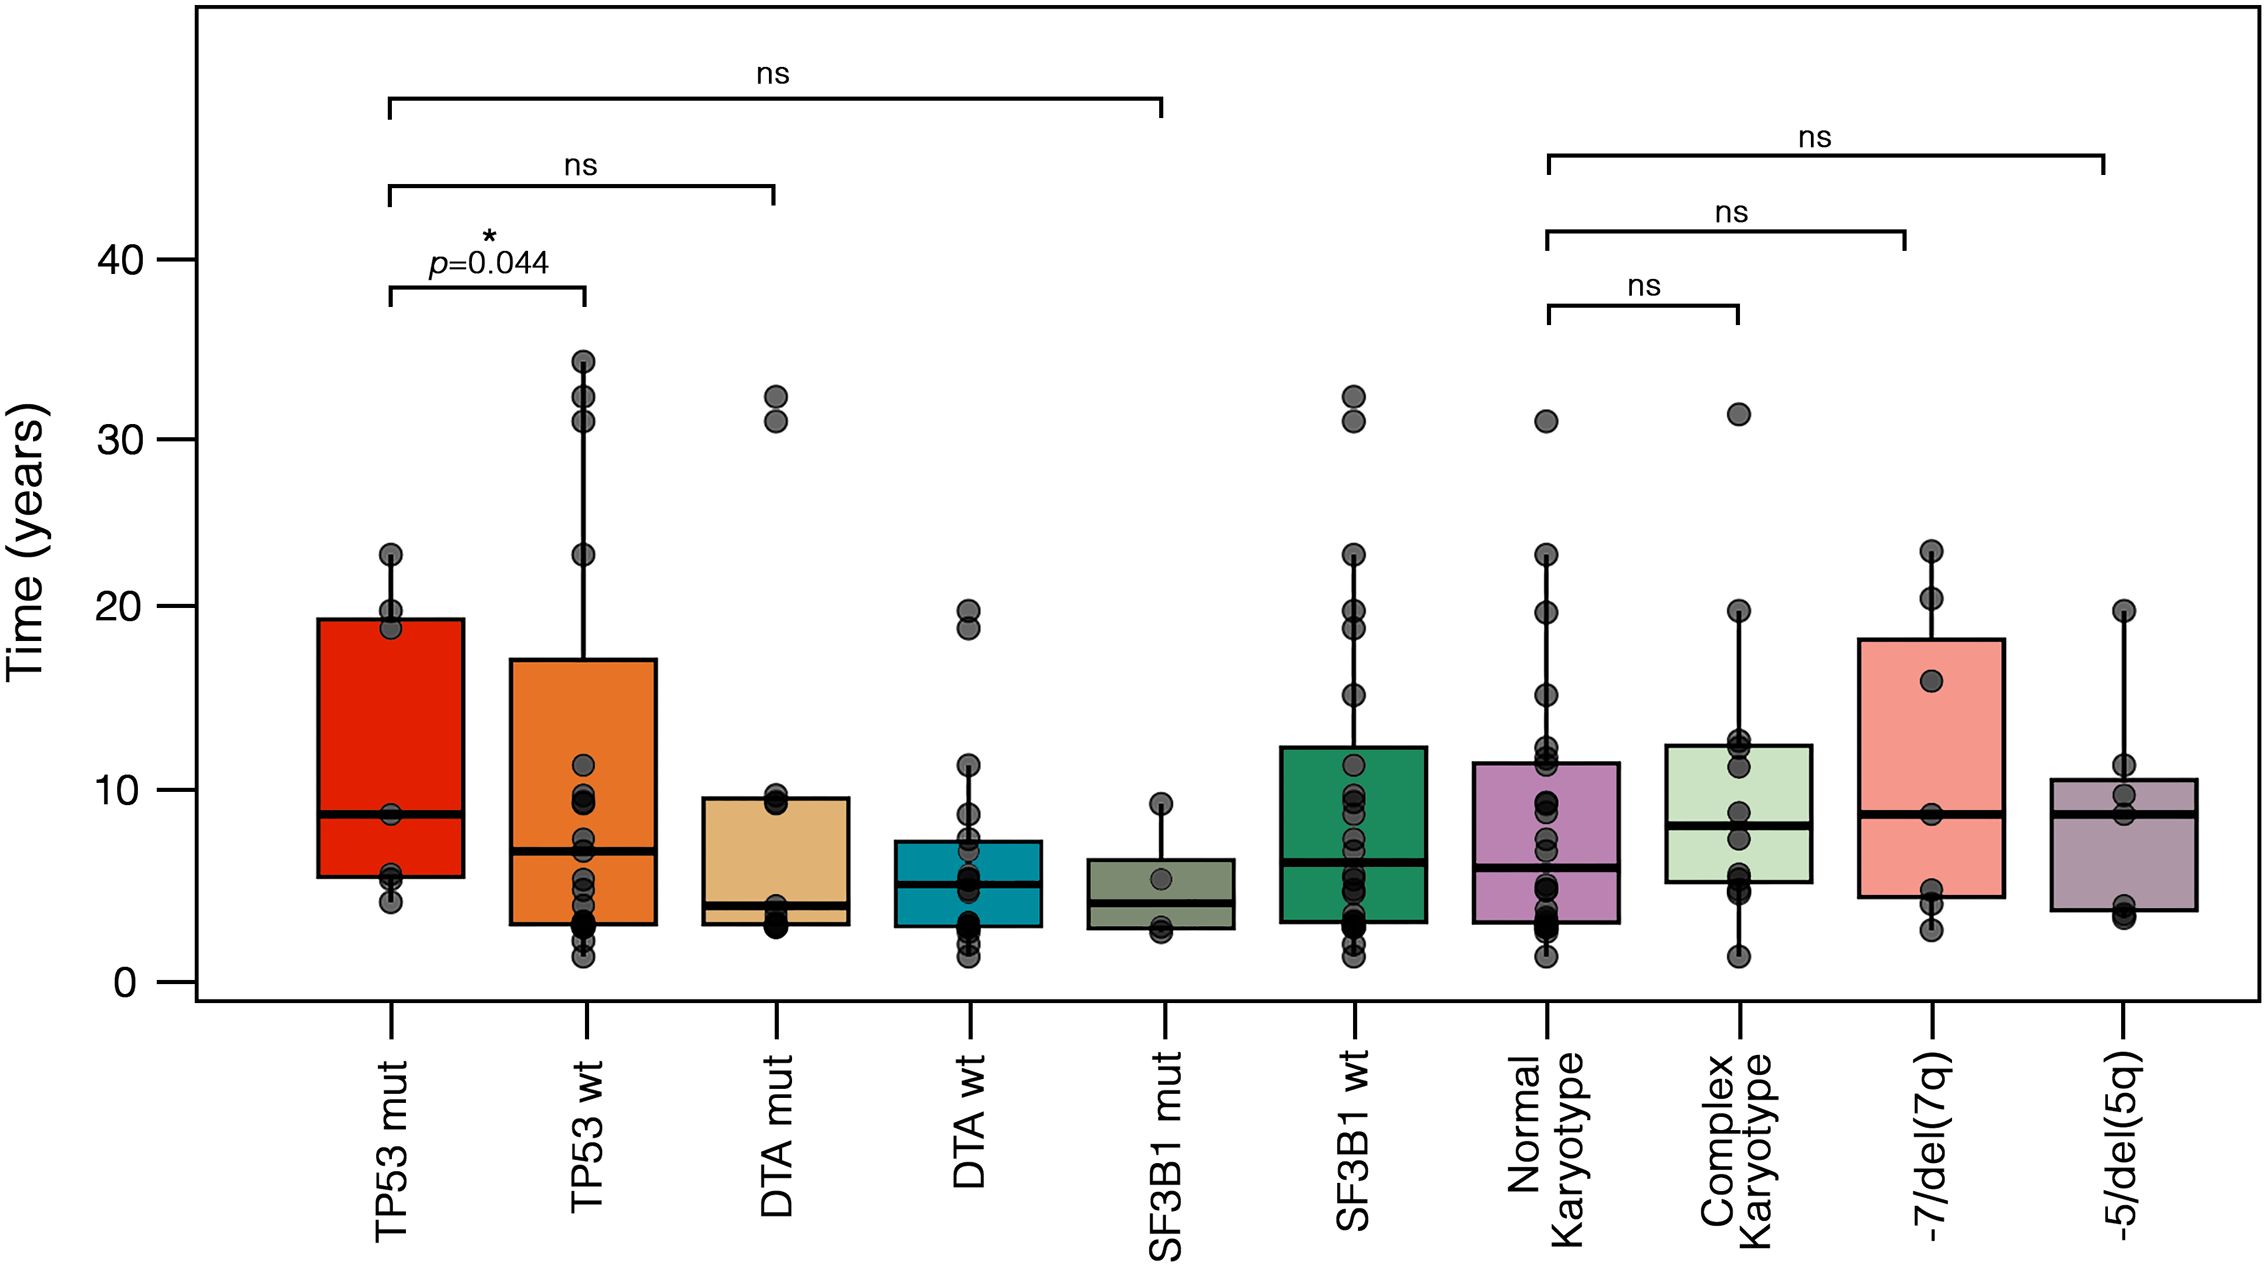
Figure 2. Different latencies from primary cancer to t-MN according to cytogenetic and molecular abnormalities. Boxplots display the distribution of latency times, with individual values, median, and outliers shown for each molecular and cytogenetic subgroup. Statistical differences were assessed using the Kruskal-Wallis test. TP53-mut cases exhibited a longer median latency compared to TP53-wt [8.2 years (IQR: 4.6–19.3) vs. 6.1 years (IQR: 1.9–17.0), p = 0.044]. In contrast, no significant differences were observed when comparing TP53-mut cases to DTA-mut [3.0 years (IQR: 1.9–9.1), p = 0.23] or SF3B1-mut cases [3.1 years (IQR: 1.7–5.6), p = 0.450]. Similarly, no significant differences were found between cases with a normal karyotype [4.2 years (IQR: 1.9–11.0)] and those with a complex karyotype [7.5 years (IQR: 4.3–12.1), p = 0.466], -7/del(7q) [8.2 years (IQR: 3.5–18.2), p = 0.429], or -5/del(5q) [8.2 years (IQR: 2.8–10.2), p = 0.315]. DTA, DNMT3A, ASXL1 and TET2; IQR, interquartile range; mut, mutated; ns, not significative; t-MN, therapy-related myeloid neoplasms; wt, wild-type.
3.2 Clinical features and risk stratification of t-MDS patients
According to the 2022 WHO classification, 12 patients (31.6%) were defined as MDS with low blasts (MDS-LB), 7 patients (18.4%) as MDS with increased blasts-1 (MDS-IB1), 6 patients (15.8%) as MDS with increased blasts-2 (MDS-IB2), 5 patients (13.2%) as MDS with TP53 mutation (TP53-MDS), 3 patients (7.9%) as MDS with del(5q) (MDS-5q), 3 patients (7.9%) as MDS with SF3B1 mutation, and one patient (2.6%) as MDS with fibrosis. According to the IPSS-R score, most patients were categorized as very-low, low, and intermediate risk (63.2%) (Figure 3). Nineteen patients (50.0%) were evaluable for the IPSS-M score; of these, 57.9% had an IPSS-M risk ranging from moderate-high to very high. Regarding the primary cancer diagnosis, 23 patients (60.5%) had a history of solid tumors, and 15 (39.5%) had a previous hematologic malignancy. The distribution of primary tumor types among t-MDS patients is shown in Figure 1. Notably, patients with a history of hematologic cancer were younger (p=0.003), had lower platelet counts (p=0.002), and had a higher blast percentage at diagnosis (p=0.021) compared to patients with a history of solid tumors (Table 2). Consequently, a greater tendency toward higher-risk IPSS-R (p=0.020) and IPSS-M (p=0.012) categories was observed in patients with a history of hematologic malignancy. However, the comparison of latency times was not significant (p=0.347).
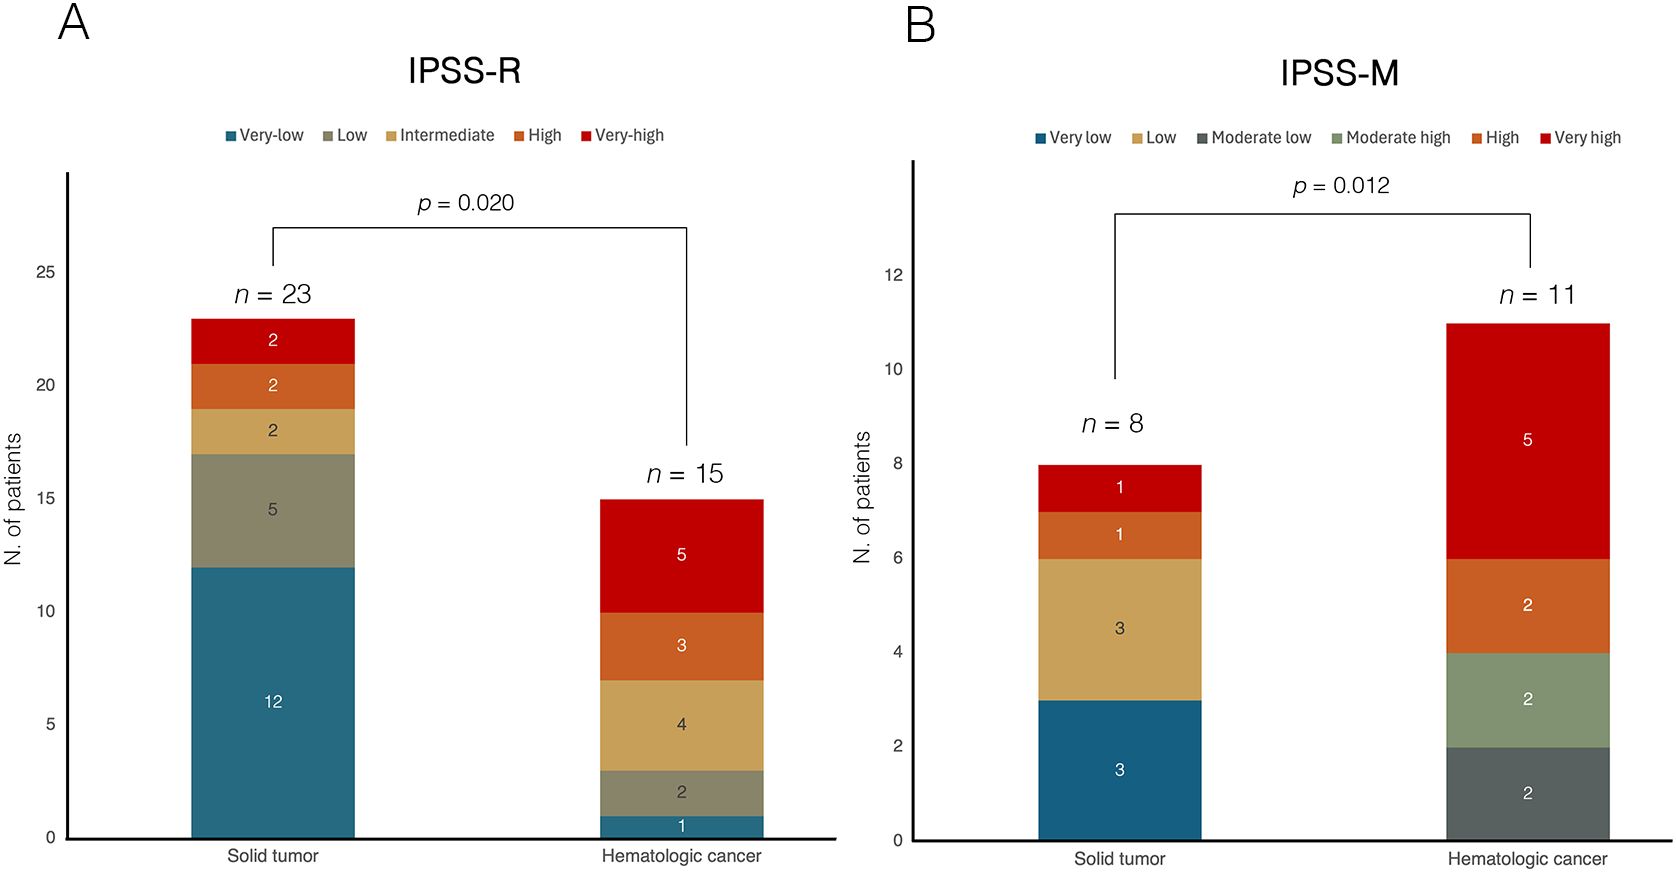
Figure 3. Comparison of risk stratification according to (A) IPSS-R and (B) IPSS-M in t-MDS cohort, categorized by prior history of solid or hematologic malignancy. In both panels, bars represent the two groups (solid tumor vs hematologic cancer), with internal segments corresponding to individual risk categories. The numbers within each segment indicate the absolute number of patients per risk category. In panel (A), based on the IPSS-R classification, among patients with a history of solid tumors (n=23), 12 patients (52.2%) were classified as very low risk, 5 (21.7%) as low risk, 2 (8.7%) as intermediate risk, and 4 (17.4%) as high or very high risk. In contrast, among patients with prior hematologic malignancies (n=15), 1 patient (6.7%) were categorized as very low risk, 2 (13.3%) as low risk, 4 (26.7%) as intermediate risk, and 8 patients (53.3%) as high or very high risk, indicating a significantly higher proportion of patients in the higher-risk categories in this group (Chi-square test, p = 0.020). In panel (B), among patients evaluable for IPSS-M (n=19), those with a history of solid tumors (n=8) were stratified as very low in 3 patients (37.5%), low in 3 patients (37.5%), and high or very high in 2 patients (25.0%). Conversely, patients with prior hematologic malignancies (n=11) were classified as moderate-low in 2 patients (18.2%), moderate-high in 2 patients (18.2%), and high or very high in 7 patients (63.6%), demonstrating a significantly greater representation in the higher-risk categories (Chi-square test, p = 0.012). IPSS-M, molecular international prognostic scoring system; IPSS-R, revised IPSS; t-MDS, therapy-related myelodysplastic syndrome.
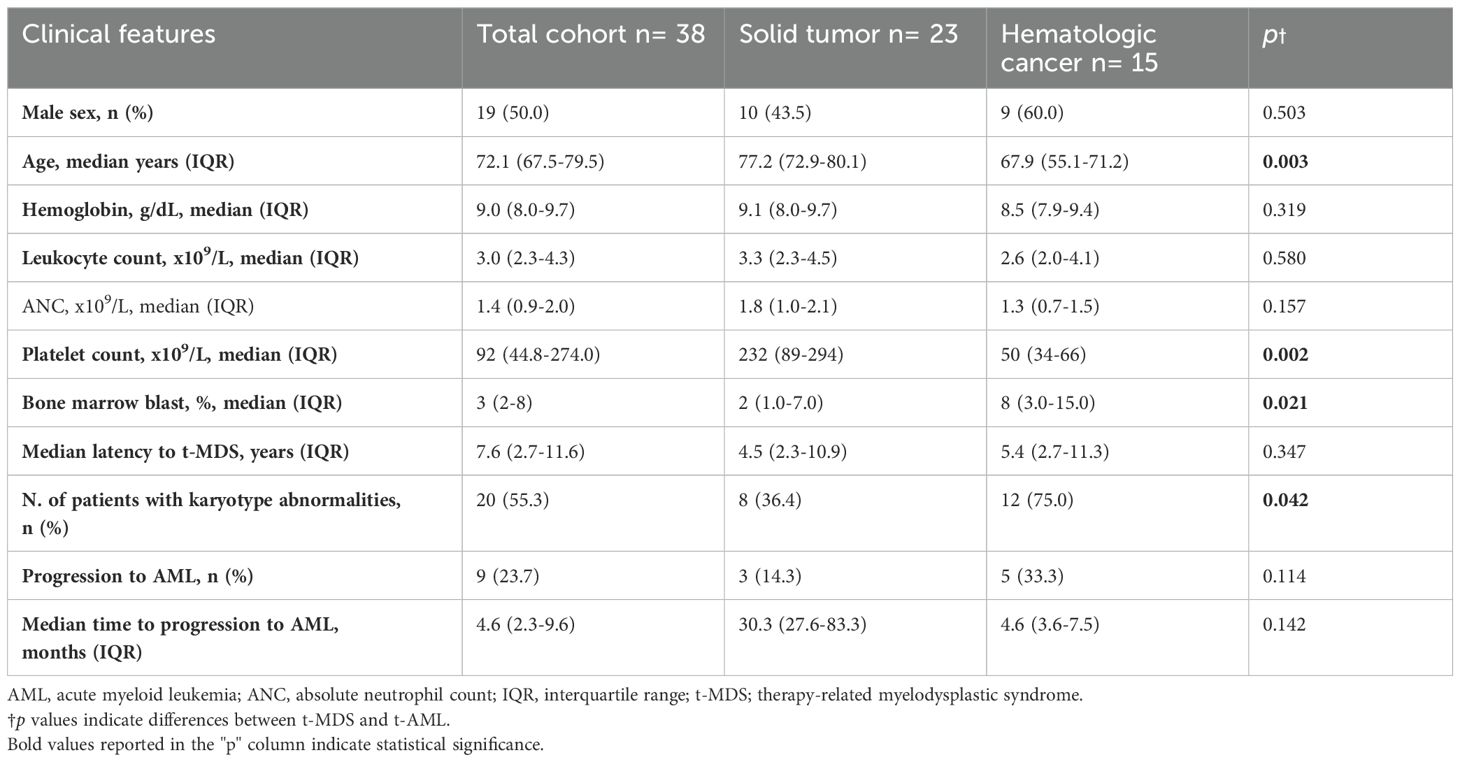
Table 2. Key features of t-MDS and comparison between patients with a history of solid tumors and hematologic malignancies. .
3.3 Cytogenetic and molecular profile of the t-MDS cohort
Cytogenetic abnormalities (Figure 4A) were reported in 20 patients (52.6%). Of these, 11 patients (32.4%) had two concomitant abnormalities, and 8 patients (23.5%) had ≥3 abnormalities. According to cancer history, patients with prior hematologic neoplasm had a higher frequency of detectable cytogenetic abnormalities than those with a history of solid cancer (p=0.042). Nineteen patients (50%) underwent NGS analysis, and mutations were detected in 15 patients (78.9%). Among them, 10 patients (66.7%) had a normal karyotype. Overall, TP53, SF3B1, ASXL1 and TET2 were the most frequently identified abnormalities (Figure 4B). DTA mutations were found in 42.1% of patients, more frequently in the solid cancer group than in the hematologic cancer group, though not significantly (50.0% vs. 25.0%, p=0.349). In our cohort, DTA mutations did not significantly correlate with age (p=0.861). All four patients with TP53-MDS had a history of hematologic malignancy, and 75% had a complex karyotype. Additionally, younger patients were at higher risk of TP53 alterations [OR 0.87 (95% CI, 0.72-0.99), p=0.040].
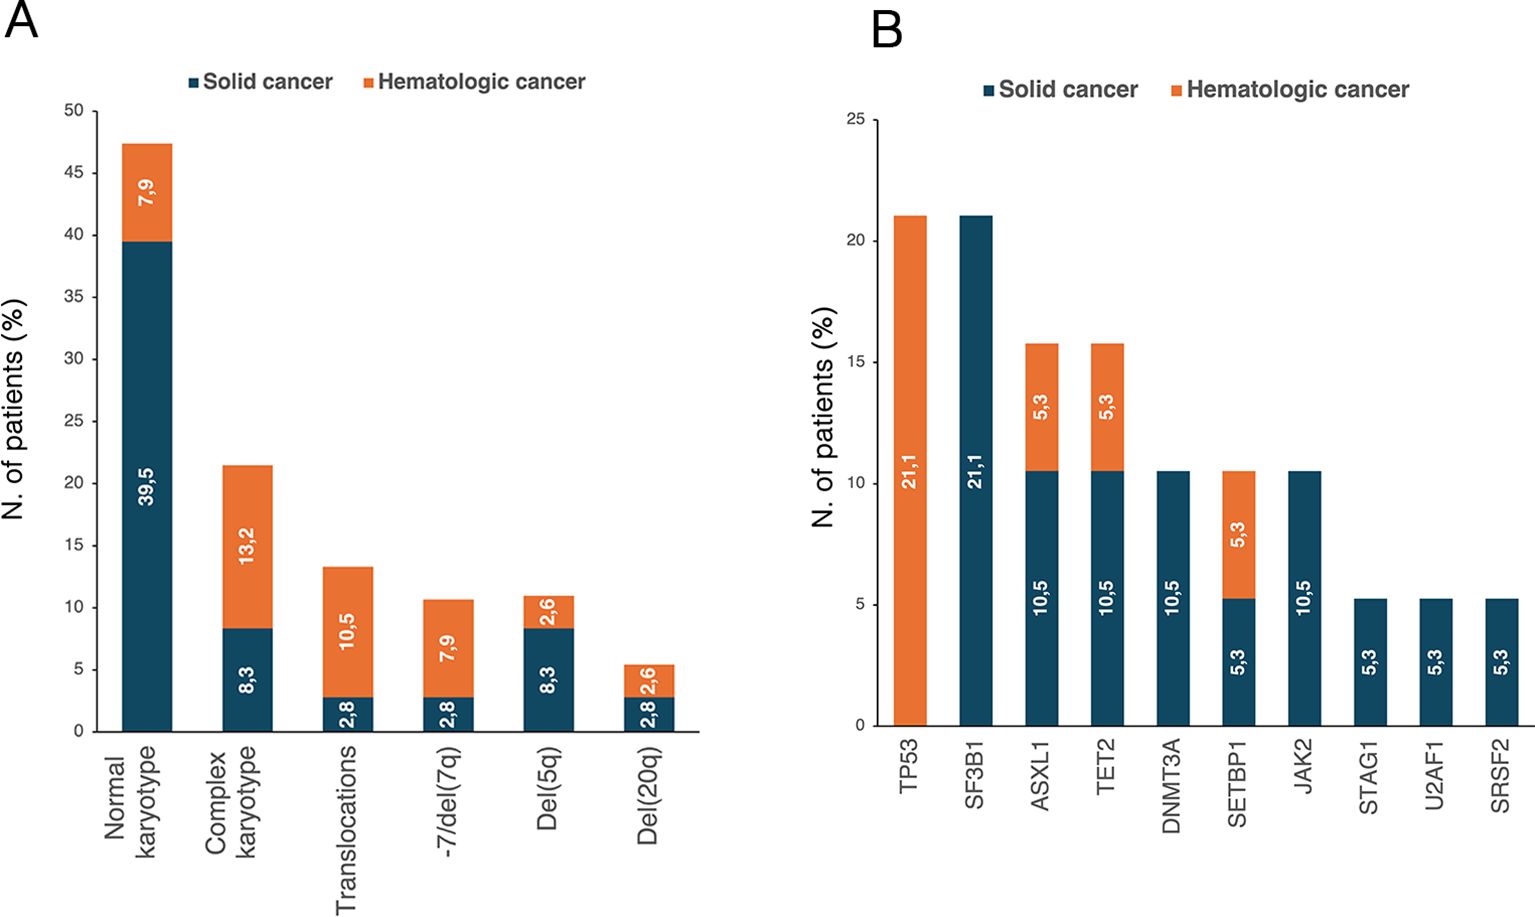
Figure 4. Distribution of (A) karyotype abnormalities in t-MDS patients with available cytogenetic data (n=36) and (B) NGS-detected mutations in patients who underwent NGS analysis (n=19). The percentages reported within the bars were calculated based on the total number of patients in each respective group. NGS, next-generation sequencing; t-MDS, therapy-related myelodysplastic syndrome.
3.4 Treatment and survival analysis in t-MDS patients
Overall, 26 patients (68.4%) received treatment for t-MDS, including recombinant erythropoietin in 14 patients (36.8%), hypomethylating agents (HMA) in 8 patients (21.1%), eltrombopag in two patients (5.3%), luspatercept and lenalidomide in one patient each. Among patients treated with HMA, a median of 2 cycles was administered, with more than 50% of patients receiving ≤3 treatment cycles. Three patients who received HMA were referred for HSCT after achieving complete response (CR), with a 4-year OS of 100% compared to 25% (95% CI, 0.1-0.6) for non-transplanted patients. Of the remaining patients, two died of leukemic progression, and two of infectious complications.
With a median follow-up of 10.6 months (IQR: 5.7–29.8), the 1-year OS was 74% (95% CI, 0.6–0.9) (Figure 5A). Stratified analysis by sex revealed a significantly lower survival in male patients (Figure 5B), with a 1-year OS of 56% (95% CI, 0.3-0.8) compared to 93% (95% CI, 0.8-0.9) in females (p=0.006). Patients with a history of hematologic cancer had a 1-year OS of 59% (95% CI, 0.3–0.9) compared to 82% (95% CI, 0.6–0.9) in those with prior solid tumors, though without statistical significance (p=0.130) (Figure 5C). Notably, a significantly lower 6-month OS was found also for TP53-MDS compared to TP53 wild-type MDS (p=0.025) (Figure 5D). Conversely, no significant differences were observed based on the DTA mutation status (Figure 5E).
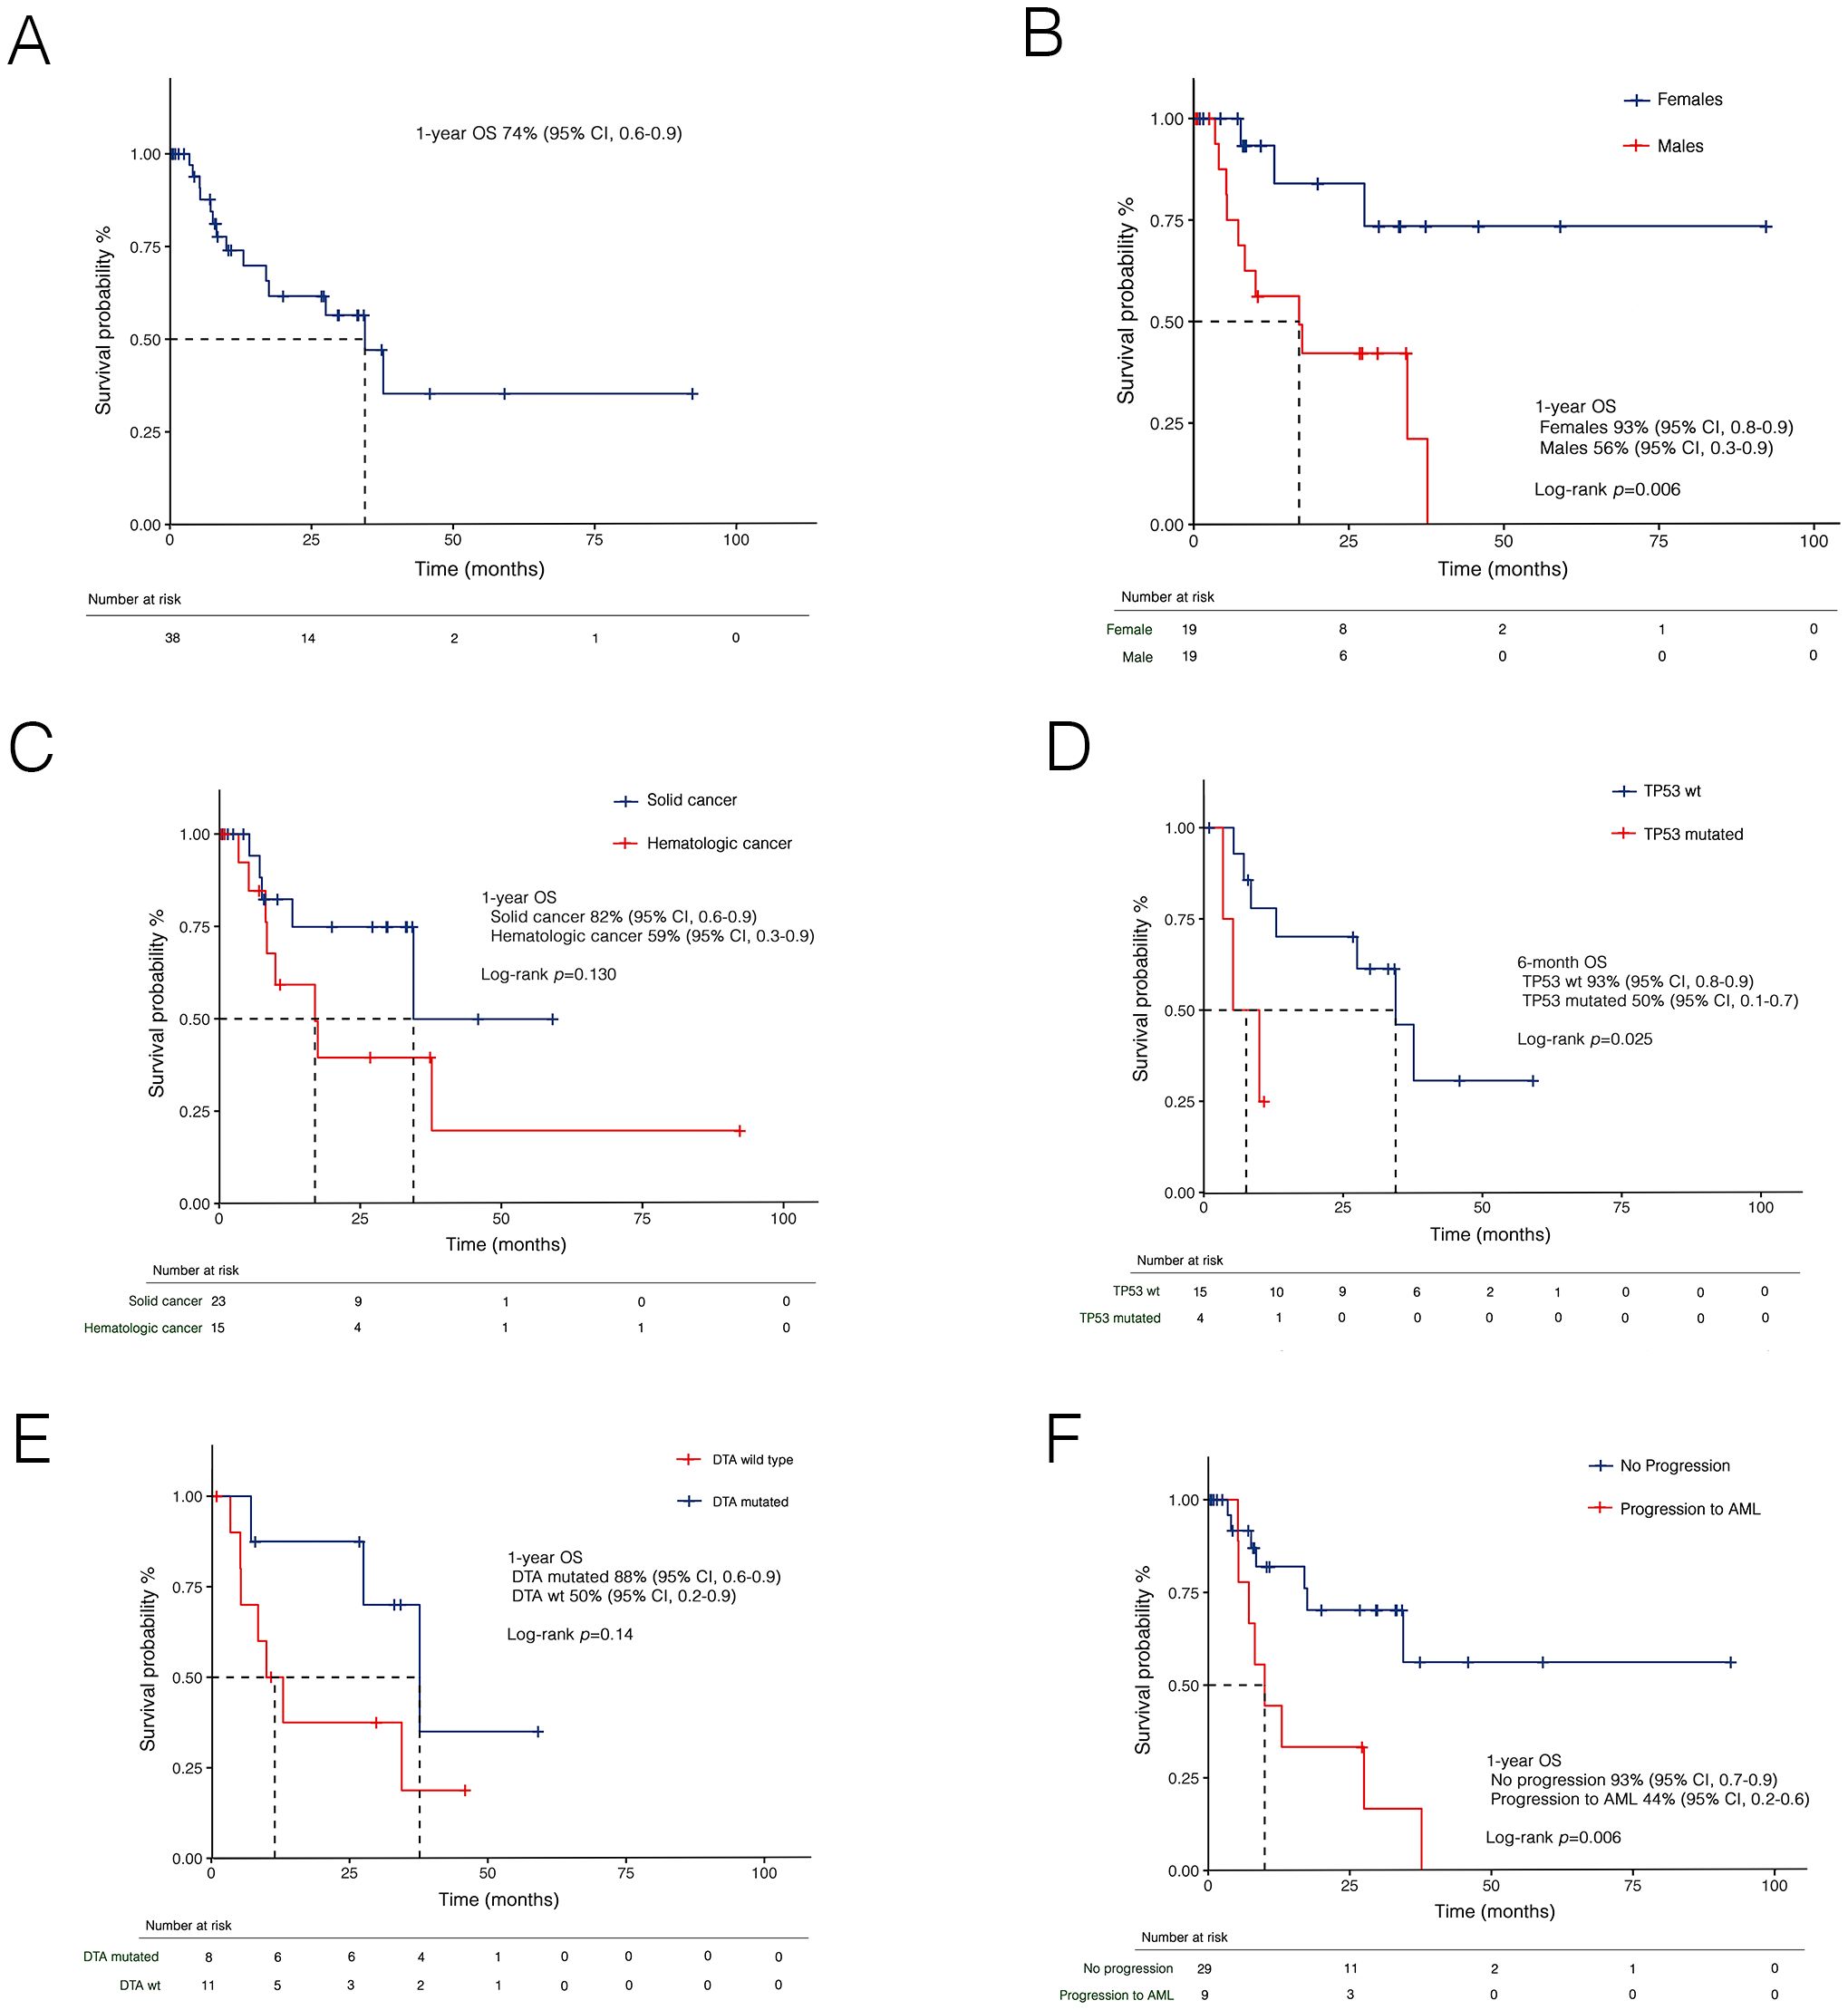
Figure 5. Kaplan-Meier curves for overall survival (OS) in t-MDS in the whole cohort (A), and stratified by sex (B), prior malignancies (C), TP53 (D), DTA mutational status (E), and disease progression (F). AML, acute myeloid leukemia; DTA, DNMT3A, TET2 and ASXL1; t-MDS, therapy-related myelodysplastic syndrome; wt, wild-type.
3.5 Progression rates to t-AML and prognostic performance of risk score
Overall, 9 patients (23.7%) experienced progression to AML. At a median follow-up of 9.0 months (IQR: 3,5-29.8), the 1-year PFS was 79% (95% CI, 0.65-0.96). PFS was lower in patients with prior hematologic cancer compared to solid tumors [64% (95% CI, 0.4-0.8) vs 87% (0.7-0.9)], with a trend towards statistical significance (p=0.071). Expectedly, disease progression was associated with a dismal prognosis (Figure 5F). In univariate analysis (Table 3), female sex was associated with better survival, while disease progression was associated with worse outcomes. Additionally, both the IPSS-R (p=0.020) and IPSS-M (p=0.012) scores were predictive of survival. However, in multivariate analysis, only IPSS-M remained a predictive factor for survival (HR 2.9, 95% CI 1.06-8.4; p=0.038). Notably, no differences were found in terms of 6-month PFS between risk cohorts according to IPSS-R (p=0.320) (Figure 6A). At the same time, IPSS-M effectively predicted progression to AML among different risk classes (p=0.038) (Figure 6B).
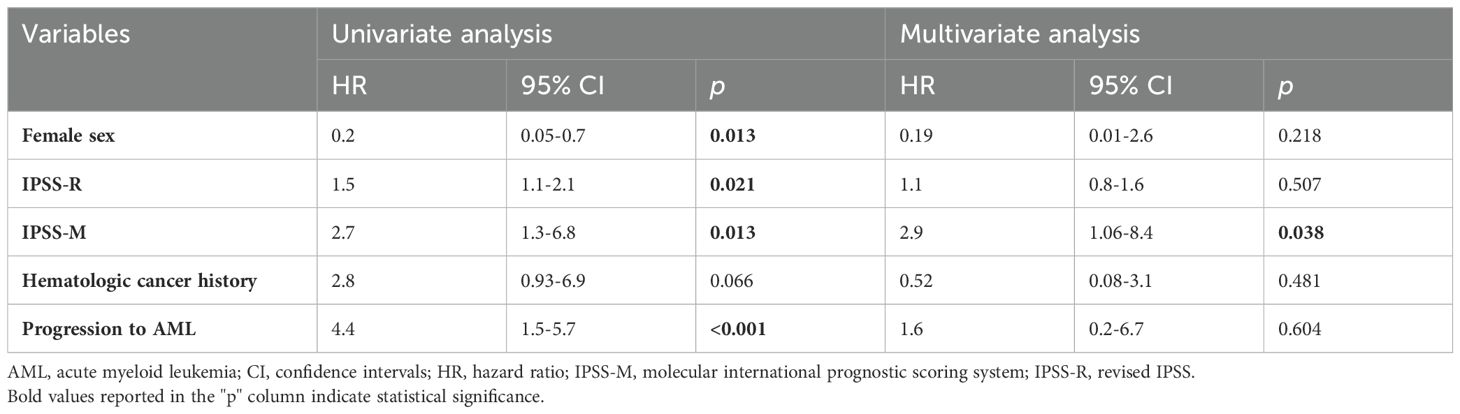
Table 3. Predictive factors for survival in t-MDS in univariate and multivariate analysis.
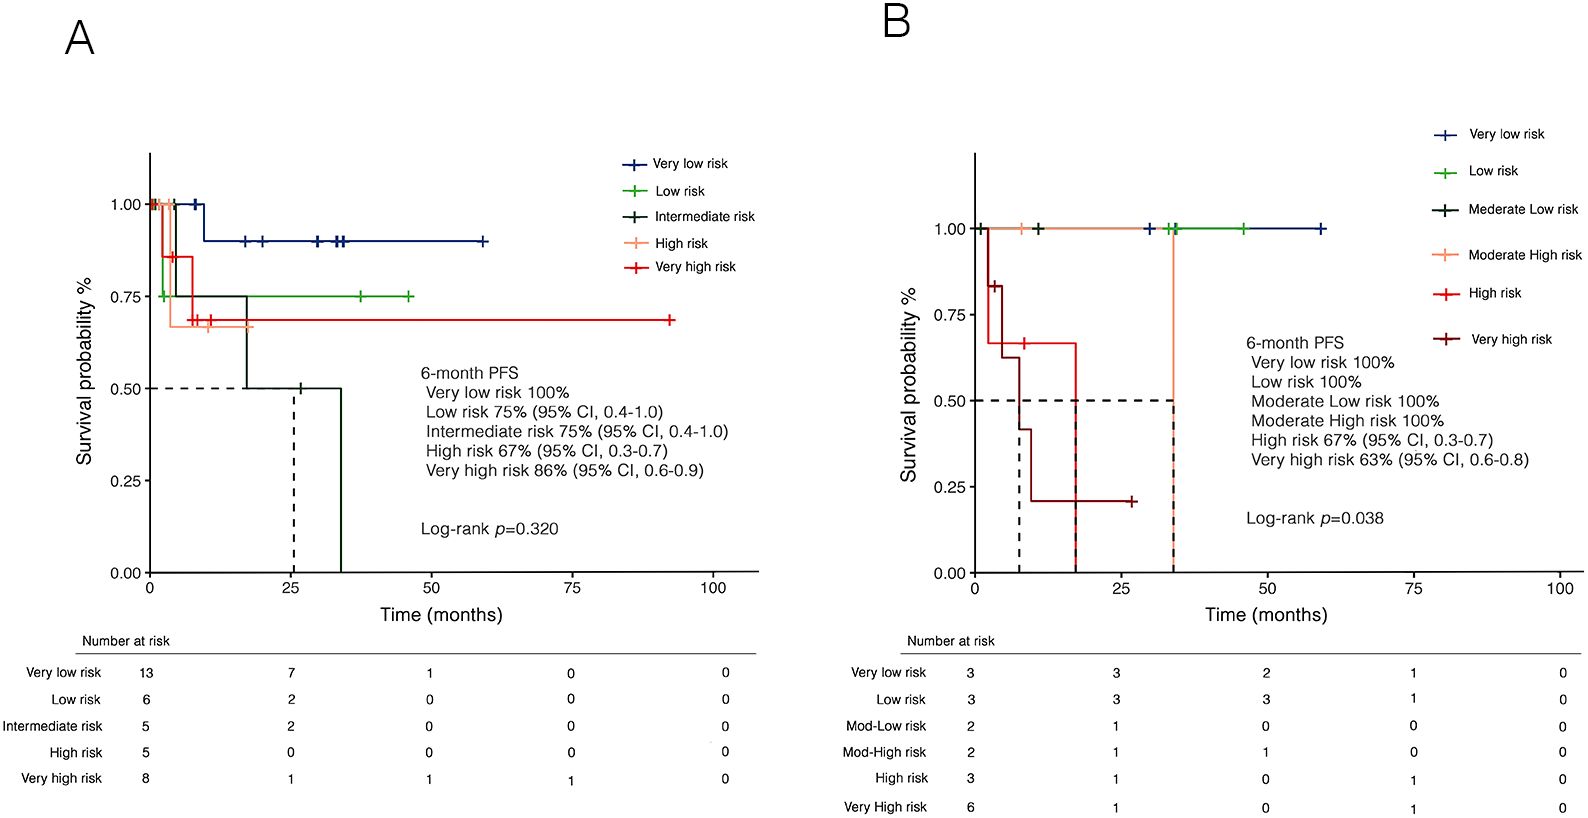
Figure 6. Kaplan-Meier curves for progression-free survival (PFS) according to (A) IPSS-R and (B) IPSS-M. Panel (A) shows PFS stratified by IPSS-R risk categories, with no significant differences observed between cohorts in 6-month PFS (p=0.320). Panel (B) presents PFS stratified by IPSS-M, demonstrating a statistically significant difference between risk categories in 6-month PFS (p=0.038). IPSS-M, molecular international prognostic scoring system; IPSS-R, revised IPSS.
3.6 Clinical and genetic features of t-AML
According to the ELN 2022 classification, three patients (13.0%) were considered at favorable risk, 6 patients (26.1%) at intermediate risk, and 11 patients (47.8%) at adverse risk. Three patients (13.0%) had a diagnosis of APL and were all considered at low risk according to Sanz’s risk score. A history of solid and hematologic cancer was reported in 15 (65.2%) and 8 patients (34.8%), respectively. No differences were observed between the two groups regarding sex, age, and fitness (Table 4). Additionally, median latency from primary cancer was shorter for patients with a history of hematologic tumors, although not statistically significant (p=0.227) (Table 4). The distribution of primary diagnoses and treatments received for the primary tumor are shown in Figure 1.
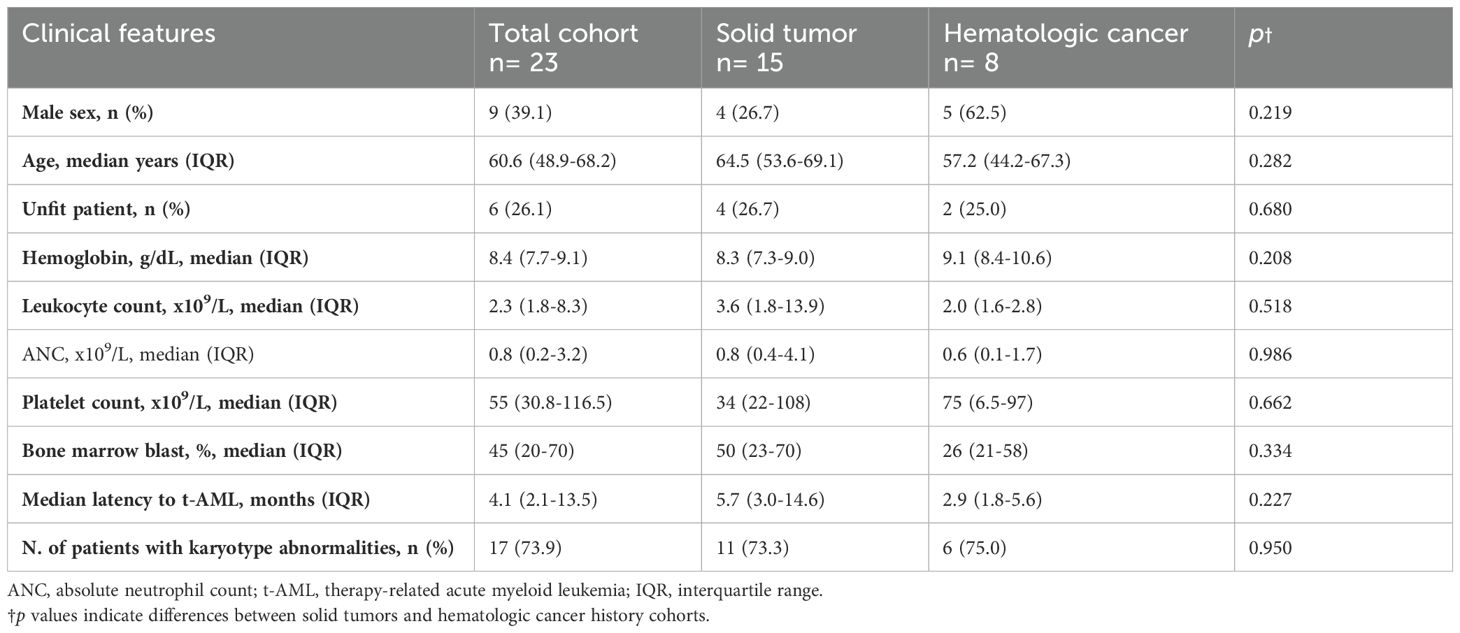
Table 4. Key features of t-AML and comparison between patients with a history of solid tumors and hematologic malignancies.
All patients underwent immunophenotypic analysis at the time of t-AML diagnosis. Specifically, except for the three APL patients, an APL-like phenotype (i.e., CD34- and HLA-DR-) was observed in 4 patients (17.4%). Cytogenetic analysis was positive for abnormalities in 17 patients (73.9%). Cytogenetic and molecular abnormalities are pictured in Figure 7. Furthermore, 21 patients (91.3%) underwent RT-PCR, which was positive for abnormalities in 11 cases (52.4%). WT1 abnormalities were the most common (23.8%). Twelve patients (52.2%) underwent NGS testing. The analysis, which tested positive in 9 cases, revealed abnormalities in 9 different genes, mainly involving TP53 (25.0%), ASXL1 (25.0%), and U2AF1 (16.7%).
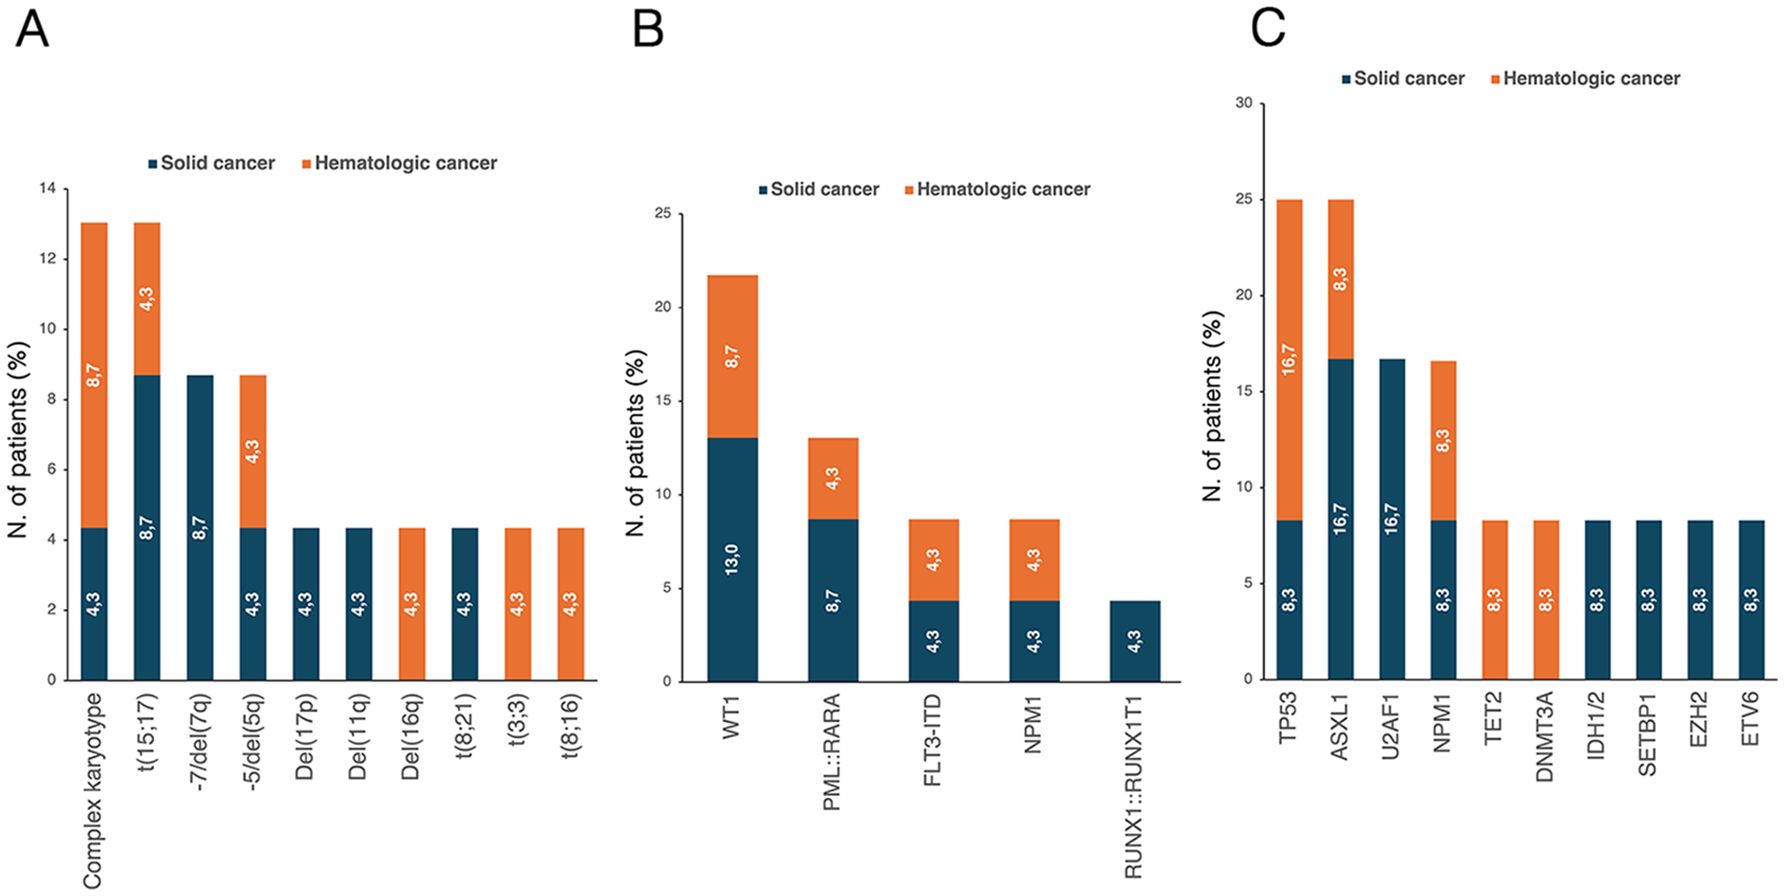
Figure 7. Distribution of (A) karyotype abnormalities in evaluable patients (n=23) and molecular mutations detected through (B) Real-time PCR (evaluated patients, n=21) and (C) NGS (evaluated patients, n=12). The percentages reported within the bars were calculated based on the total number of patients in each respective group. NGS, next-generation sequencing; PCR, polymerase chain reaction.
3.7 Treatment and survival analysis in the t-AML cohort
Overall, 16 patients (69.6%) received intensive chemotherapy for t-AML, including CPX-351 in 10 patients (43.5%), standard 3 + 7 regimen in 3 patients (13.0%), 3 + 7+ Gemtuzumab ozogamicin (GO) in 2 patients (8.7%), and one patient received FLAG-IDA regimen. Four patients (17.4%) received non-intensive therapy with venetoclax and azacitidine. APL patients (n=3) received chemo-free therapy according to the APL0406 treatment protocol.
Nine patients (39.1%) were referred for HSCT after a median time of 5.8 months (IQR: 5.1–6.8) from diagnosis. Three patients were at low ELN risk, three at intermediate risk, and other three at adverse risk. Of transplant recipients, 5 patients (55.6%) had received induction therapy with CPX-351, 3 (33.3%) received standard 3 + 7 chemotherapy, and one patient received FLAG-IDA. At a median post-transplant follow-up of 21.8 months (IQR: 14.5–36.3), only one death was recorded due to disease relapse.
At a median follow-up of 13.5 months (IQR: 5.8–49.2), the 1-year OS of the entire cohort was 65% (95% CI, 0.4–0.9) (Figure 8A). No significant differences were observed between the ELN 2022 risk categories [low risk: 100% vs intermediate risk: 75% (95% CI, 0.6–0.8) vs adverse risk: 64% (95% CI, 0.5–0.8), p=0.623] or based on primary disease (Figure 8B). However, a significant difference emerged based on fitness criteria, with a 6-month OS of 50% (95% CI, 0.1–0.7) for unfit patients compared to 88% (95% CI, 0.7–0.9) for fit patients eligible for intensive therapy (p=0.0029) (Figure 8C). Moreover, increased survival rates were observed in transplant-recipients compared to non-transplanted patients (p=0.021) (Figure 8D).
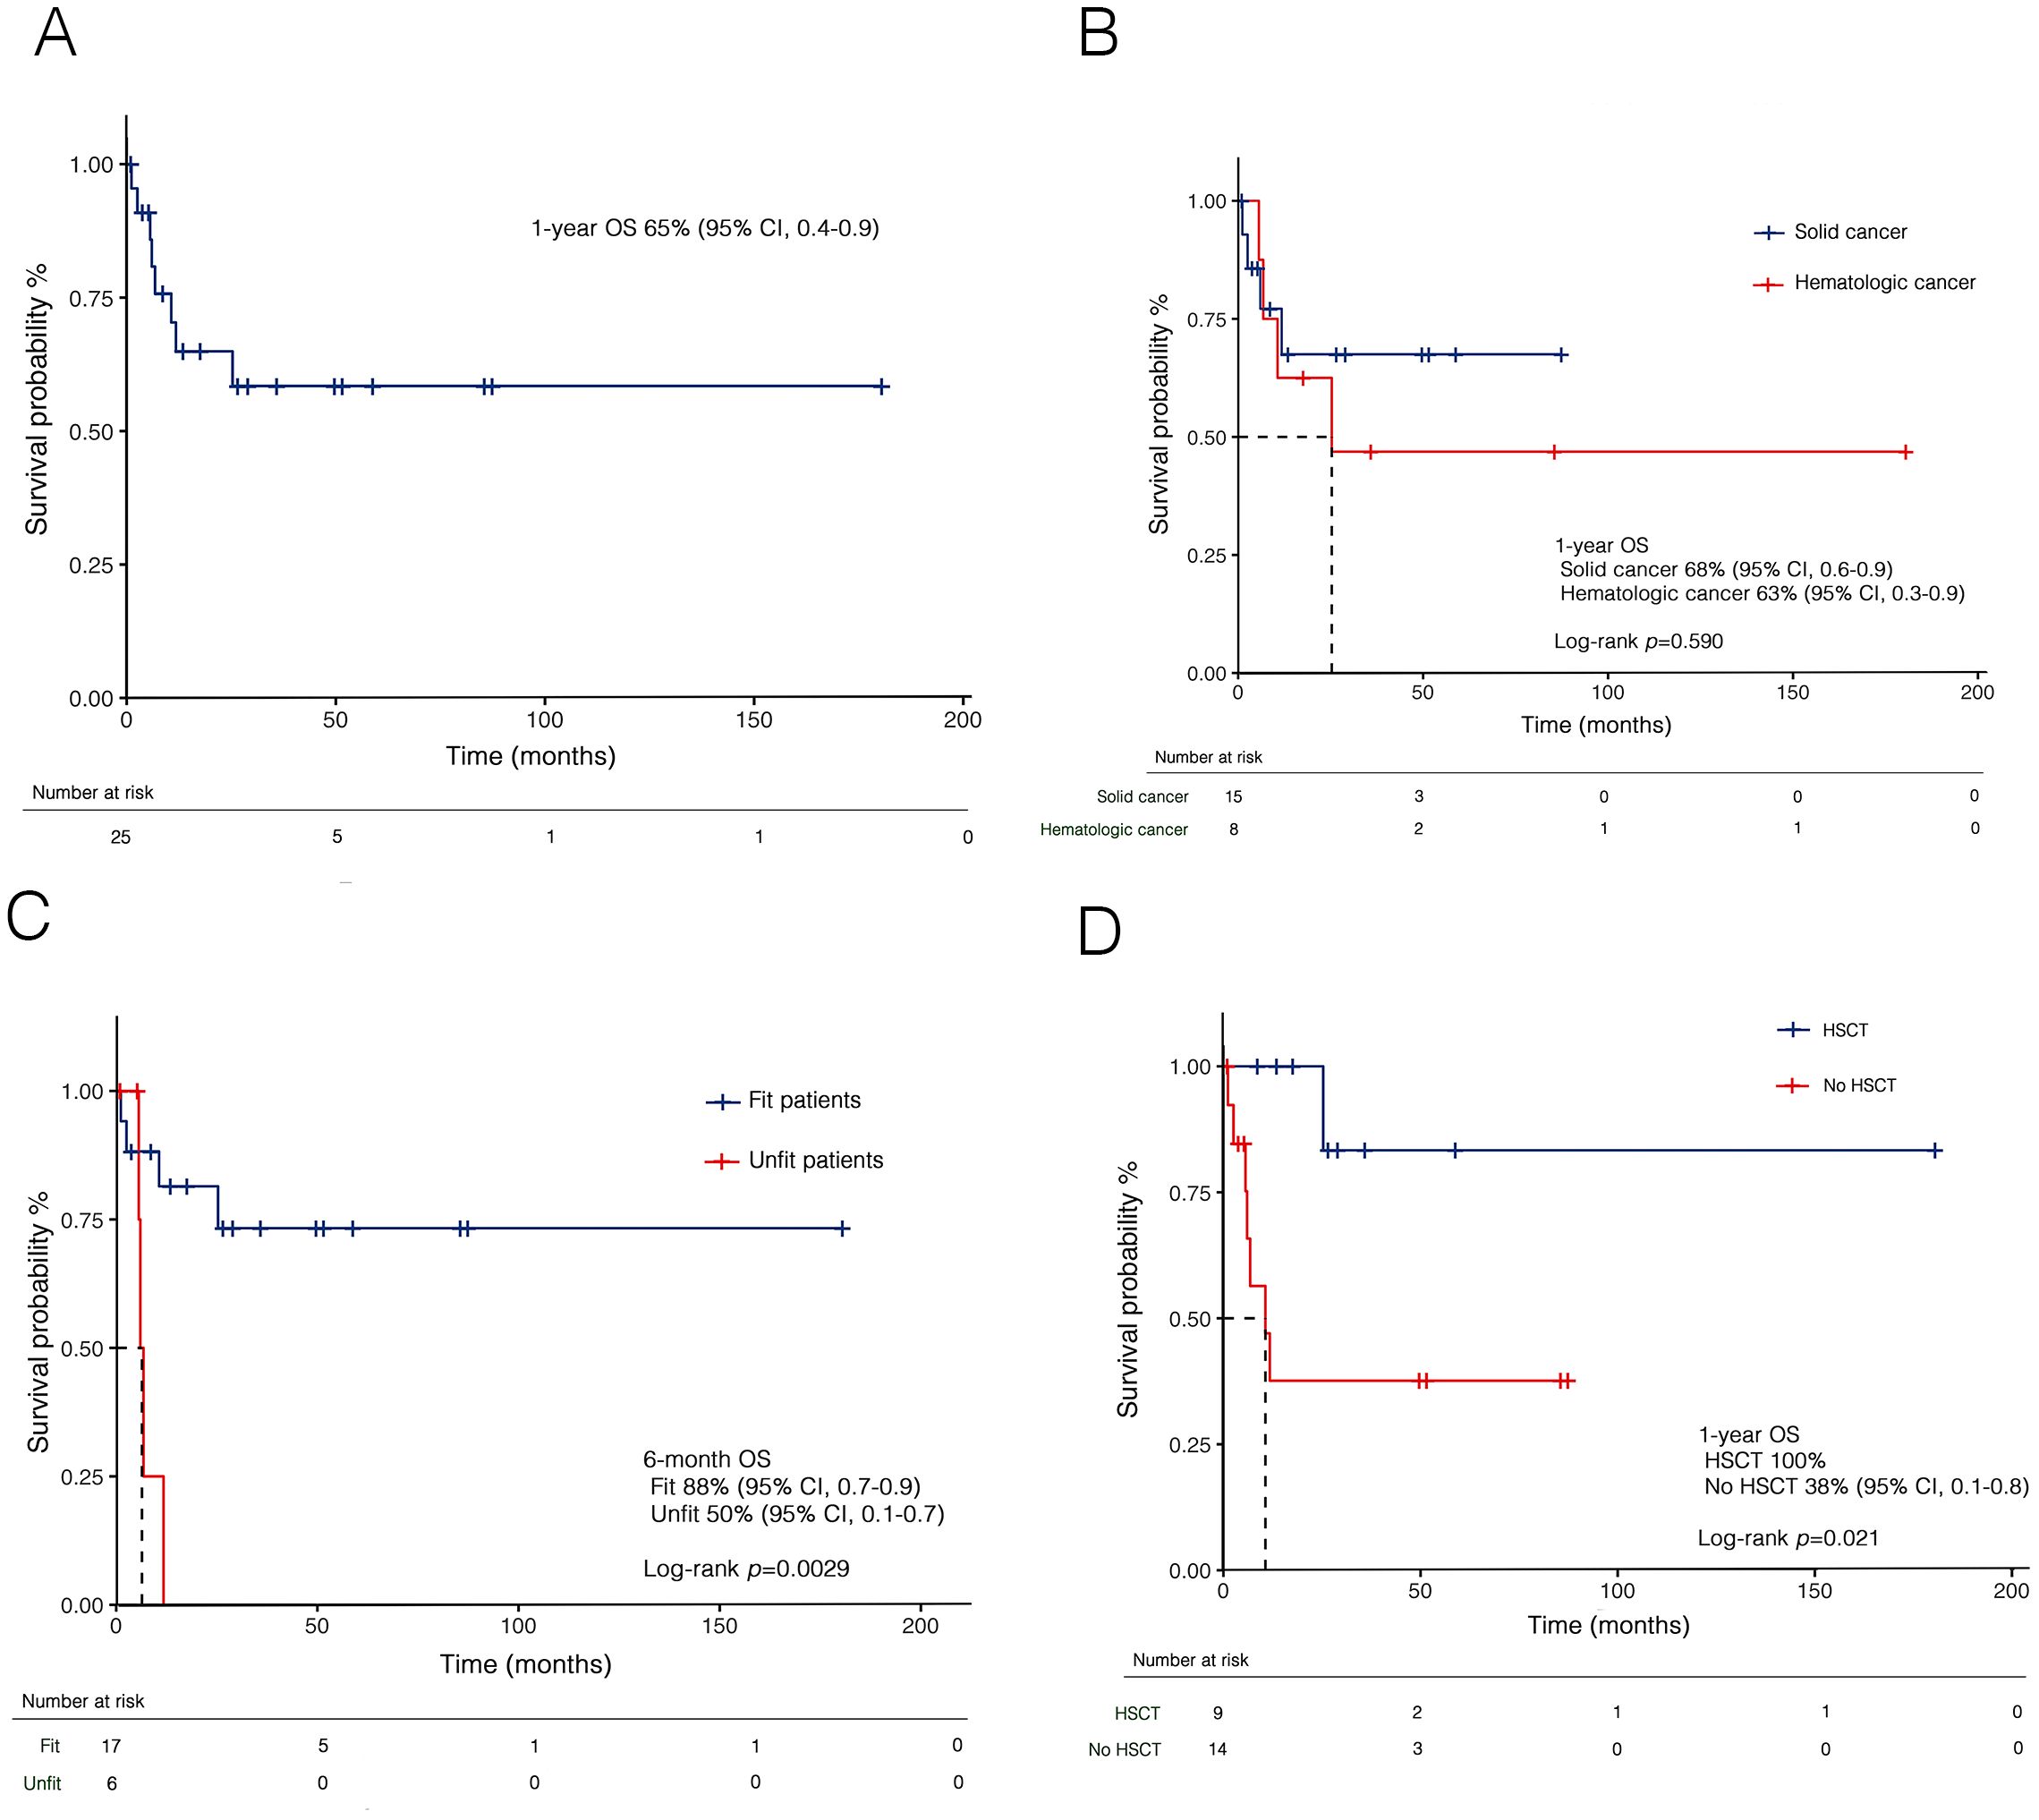
Figure 8. Kaplan-Meier curves for overall survival (OS) in t-AML in the whole cohort (A), and stratified by prior malignancies (B), fitness according to SIE/SIES/GITMO criteria (C), and transplantation (D). HSCT, hematopoietic stem cell transplant; t-AML, therapy-related acute myeloid leukemia; SIE, Società Italiana di Ematologia; SIES, Società Italiana di Ematologia Sperimentale; GITMO, Gruppo Italiano per il Trapianto di Midollo Osseo.
4 Discussion
In this retrospective study, we aim to provide new insights into the clinical and prognostic features of t-MN. The demographics and distribution of primary diseases were similar to prior studies (4, 5), with breast cancer being the most frequent malignancy. Indeed, advances in breast cancer diagnosis and treatment have improved survival rates but have also increased the incidence of t-MN (17). Similarly, among hematologic primary diseases, lymphoproliferative neoplasms were the most prevalent, likely reflecting the extensive use of polychemotherapy and the resulting improvements in survival rates (18).
In patients with t-MDS, prior studies have highlighted the superior prognostic accuracy of the IPSS-M compared to the IPSS-R (9, 19). Notably, a higher prevalence of high-risk features is typically observed in t-MDS compared to de novo cases (20, 21). However, in our cohort, over 50% of patients were categorized as low to very low risk based on the IPSS-R, consistent with findings from more recent studies (22, 23). Conversely, the molecular score identified a higher proportion of high-risk patients. To our knowledge, this is the first study to specifically analyze the distribution of risk categories between the IPSS-R and IPSS-M in relation to the history of primary malignancy, also demonstrating a slight superiority of the molecular score over the standard one. Patients with prior hematologic cancer exhibited more adverse characteristics, including TP53 mutation, with a higher proportion classified as high to very high risk by IPSS-M, likely due to greater exposure to polychemotherapy, multiple lines of cytotoxic treatment, and high-risk genetic alterations. Notably, this is highlighted by the higher prevalence of karyotypic abnormalities and a history of hematologic malignancies compared to solid tumors. The additional value of molecular analysis becomes even more pronounced when assessing the risk of progression to AML. In our cohort, the progression rate of 26.5% was consistent with previous reports (20), yet the IPSS-R score surprisingly failed to discriminate this outcome adequately. In contrast, a clear prognostic difference emerged when applying the molecular score. Although not statistically significant, the higher progression rate observed in patients with a history of hematologic neoplasm likely reflects greater biological complexity compared to solid cancer.
An intriguing aspect of our analysis is the observation of an extended latency period in patients harboring TP53 mutations compared to their TP53 wild-type counterparts, consistent with recent findings by Hung et al. (24). Similar prolonged latencies have also been reported in other contexts, although not directly compared to wild-type cases (16, 25). At first glance, this observation may appear paradoxical, as TP53-mutated clones are generally associated with more rapid progression to advanced, chemo-resistant disease stages (26). However, the leukemogenic mechanisms driven by TP53 mutations appear to diverge from those of other mutational processes, reinforcing the notion of TP53-mutated myeloid neoplasms as a distinct biological entity.
Notably, TP53 mutations are enriched in clones lacking concurrent DTA mutations, suggesting an alternative leukemogenic trajectory. Indeed, the mutational landscape of t-MN may differ depending on the type of primary malignancy, potentially reflecting distinct selective pressures imposed by previous therapies. TP53-mutated clones are well-documented for their resistance to chemotherapy, which predominantly relies on DNA damage-induced apoptosis, and they are recognized as early drivers in the pathogenesis of MDS and AML (27, 28). Moreover, latency duration does not appear to differ significantly between single-hit and multi-hit TP53 mutations (25). In this context, alterations within the bone marrow microenvironment may play a critical role. TP53-mutated clones seem to exist at subclonal levels prior to cytotoxic therapy, insufficient to outcompete normal hematopoietic cells or initiate overt leukemia. However, these clones may acquire a selective advantage when therapy-induced microenvironmental changes create conditions favorable for their expansion (29).
The extended latency observed in TP53-mutated cases may thus reflect the temporal requirement for therapy-mediated remodeling of the bone marrow niche to establish an environment conducive to the proliferation of therapy-resistant TP53-mutated clones. However, the concept of “latency” requires further investigation, particularly in relation to clonal evolution, the role of the bone marrow microenvironment, and whether prolonged exposure to prior cytotoxic therapies acts as a critical trigger in the development of t-MN. It can be hypothesized that the cumulative effect of cytotoxic treatments in prior malignancies resembles the role of reactive oxygen species (ROS) in oxidative stress, where sustained exposure leads to DNA, mitochondrial, and protein damage, ultimately promoting genomic instability. A key limitation of our analysis is the combined evaluation of latency in both t-MDS and t-AML, which may mask the specific contributions of certain mutations to different stages of disease progression.
A crucial aspect of managing t-MN concerns the differing outcomes for t-AML and t-MDS. While survival rates for t-AML have shown modest improvement, likely due to the introduction of CPX-351, similar advancements have not been seen in t-MDS (30, 31). According to the IPSS-R, most t-MDS patients received supportive therapies, with only a small subset treated with HMAs. The high mortality in high-risk t-MDS patients without access to HSCT underscores the lack of effective curative options for this group. In our cohort, HSCT provided a significant prognostic benefit, with markedly improved outcomes in t-AML patients who underwent transplantation. The importance of patient selection was evident, with significant survival differences observed between fit and unfit patients based on the SIE/SIES/GITMO criteria, highlighting their crucial role in treatment decisions. All unfit patients received non-intensive therapy, while fit patients underwent intensive therapy, achieving complete response, which was present in all transplanted patients.
To note, our study has several limitations. First, the limited sample size and retrospective design introduce potential selection and analysis biases. Indeed, molecular data and molecular-based risk stratification were not available for all patients. Furthermore, although not the primary focus of the study, assessing the individual contribution of each chemotherapeutic agent was not feasible due to the widespread use of polychemotherapy regimens and multiple lines of therapy. More importantly, this limitation precluded evaluating how primary disease therapies affect cytogenetic and molecular abnormalities. Nevertheless, our study emphasizes the contribution of molecular analysis to improving the prognostic stratification of patients with t-MDS, particularly in predicting progression to AML, and highlights its critical role in clinical decision-making. Furthermore, there is an urgent need for appropriate therapeutic solutions for patients with t-MDS, for whom HSCT remains the only potential curative option.
5 Conclusions
This study provides a comprehensive analysis of the clinical and genetic characteristics of patients with t-MN, highlighting key differences between patients with a history of solid and hematologic tumors and emphasizing the importance of incorporating molecular analysis into the diagnostic and decision-making process. We also underscore the urgent need for effective therapeutic solutions for t-MDS patients, where HSCT remains the only curative option for eligible patients. We also stressed the importance of appropriate patient selection for intensive therapies in t-AML. Overall, these findings reinforce the need for a personalized treatment strategy based on clinical, cytogenetic, and molecular criteria to optimize outcomes in this complex and high-risk population.
Data availability statement
The original contributions presented in the study are included in the article/Supplementary Material. Further inquiries can be directed to the corresponding author.
Ethics statement
Ethical approval was not required for the studies involving humans because of the retrospective nature of the study. The studies were conducted in accordance with the local legislation and institutional requirements. The participants provided their written informed consent to participate in this study.
Author contributions
AC: Data curation, Visualization, Writing – original draft, Writing – review & editing. FP: Data curation, Resources, Writing – original draft, Writing – review & editing. MP: Resources, Writing – review & editing. EP: Resources, Writing – review & editing. CT: Resources, Writing – review & editing. RR: Resources, Writing – review & editing. PD: Resources, Writing – review & editing. OM: Writing – review & editing. GC: Supervision, Writing – review & editing.
Funding
The authors declare that financial support was received for the research and/or publication of this article. The research leading to these results has received funding from the European Union – NextGenerationEU through the Italian Ministry of University and Research under PNRR—M4C2-I1.3 Project PE_00000019 “HEAL ITALIA” to Giovanni Caocci CUP F53C22000750006 University of Cagliari. The views and opinions expressed are those of the authors only and do not necessarily reflect those of the European Union or the European Commission. Neither the European Union nor the European Commission can be held responsible for them.
Acknowledgments
The authors wish to thank Professor Andrea Perra (Oncology and Molecular Pathology Unit, Department of Biomedical Sciences, University of Cagliari, Cagliari, Italy) for his valuable support and commitment to this project.
Conflict of interest
The authors declare that the research was conducted in the absence of any commercial or financial relationships that could be construed as a potential conflict of interest.
Generative AI statement
The author(s) declare that no Generative AI was used in the creation of this manuscript.
Publisher’s note
All claims expressed in this article are solely those of the authors and do not necessarily represent those of their affiliated organizations, or those of the publisher, the editors and the reviewers. Any product that may be evaluated in this article, or claim that may be made by its manufacturer, is not guaranteed or endorsed by the publisher.
Supplementary material
The Supplementary Material for this article can be found online at: https://www.frontiersin.org/articles/10.3389/fonc.2025.1563990/full#supplementary-material
References
1. Arber DA, Orazi A, Hasserjian RP, Borowitz MJ, Calvo KR, Kvasnicka HM, et al. International Consensus Classification of Myeloid Neoplasms and Acute Leukemias: integrating morphologic, clinical, and genomic data. Blood. (2022) 140:1200–28. doi: 10.1182/blood.2022015850
2. Khoury JD, Solary E, Abla O, Akkari Y, Alaggio R, Apperley JF, et al. The 5th edition of the world health organization classification of haematolymphoid tumours: myeloid and histiocytic/dendritic neoplasms. Leukemia. (2022) 36:1703–19. doi: 10.1038/s41375-022-01613-1
3. Siegel RL, Giaquinto AN, Jemal A. Cancer statistics, 2024. CA Cancer J Clin. (2024) 74:12–49. doi: 10.3322/caac.21830
4. Moreno Berggren D, Garelius H, Willner Hjelm P, Nilsson L, Rasmussen B, Weibull CE, et al. Therapy-related MDS dissected based on primary disease and treatment—a nationwide perspective. Leukemia. (2023) 37:1103–12. doi: 10.1038/s41375-023-01864-6
5. Nilsson C, Linde F, Hulegårdh E, Garelius H, Lazarevic V, Antunovic P, et al. Characterization of therapy-related acute myeloid leukemia: increasing incidence and prognostic implications. Haematologica. (2022) 108:1015. doi: 10.3324/haematol.2022.281233
6. McNerney ME, Godley LA, Le Beau MM. Therapy-related myeloid neoplasms: when genetics and environment collide. Nat Rev Cancer. (2017) 17:513–27. doi: 10.1038/nrc.2017.60
7. Bernard E, Tuechler H, Greenberg PL, Hasserjian RP, Arango Ossa JE, Nannya Y, et al. Molecular international prognostic scoring system for myelodysplastic syndromes. NEJM Evid. (2022) 1:EVIDoa2200008. doi: 10.1056/EVIDoa2200008
8. Gross S, Ihlow J, Busack L, Adamiak K, Schrezenmeier J, Jesse J, et al. Therapy-related AML: long-term outcome in a large cohort of AML-patients with intensive and non-intensive therapy. Blood Cancer J. (2024) 14:1–10. doi: 10.1038/s41408-024-01140-5
9. Smith SM, Le Beau MM, Huo D, Karrison T, Sobecks RM, Anastasi J, et al. Clinical-cytogenetic associations in 306 patients with therapy-related myelodysplasia and myeloid leukemia: the University of Chicago series. Blood. (2003) 102:43–52. doi: 10.1182/blood-2002-11-3343
10. Neuendorff NR, Loh KP, Mims AS, Christofyllakis K, Soo WK, Bolukbasi B, et al. Anthracycline-related cardiotoxicity in older patients with acute myeloid leukemia: a Young SIOG review paper. Blood Adv. (2020) 4:762–75. doi: 10.1182/bloodadvances.2019000955
11. Oken MM, Creech RH, Tormey DC, Horton J, Davis TE, McFadden ET, et al. Toxicity and response criteria of the Eastern Cooperative Oncology Group. Am J Clin Oncol. (1982) 5:649–55. doi: 10.1097/00000421-198212000-00014
12. Greenberg PL, Tuechler H, Schanz J, Sanz G, Garcia-Manero G, Solé F, et al. Revised international prognostic scoring system for myelodysplastic syndromes. Blood. (2012) 120:2454–65. doi: 10.1182/blood-2012-03-420489
13. Döhner H, Wei AH, Appelbaum FR, Craddock C, DiNardo CD, Dombret H, et al. Diagnosis and management of AML in adults: 2022 recommendations from an international expert panel on behalf of the ELN. Blood. (2022) 140:1345–77. doi: 10.1182/blood.2022016867
14. Ferrara F, Barosi G, Venditti A, Angelucci E, Gobbi M, Pane F, et al. Consensus-based definition of unfitness to intensive and non-intensive chemotherapy in acute myeloid leukemia: a project of SIE, SIES and GITMO group on a new tool for therapy decision making. Leukemia. (2013) 27:997–9. doi: 10.1038/leu.2012.303
15. Hart RK, Fokkema IFAC, DiStefano M, Hastings R, Laros JFJ, Taylor R, et al. HGVS Nomenclature 2024: improvements to community engagement, usability, and computability. Genome Med. (2024) 16:149. doi: 10.1186/s13073-024-01421-5
16. Liu YC, Illar GM, Al Amri R, Canady BC, Rea B, Yatsenko SA, et al. Therapy-related myeloid neoplasms with different latencies: a detailed clinicopathologic analysis. Mod Pathol. (2022) 35:625–31. doi: 10.1038/s41379-021-00958-9
17. Lee JW, Oh H, You JY, Lee ES, Lee JH, Song SE, et al. Therapy-related myeloid neoplasm in early breast cancer patients treated with adjuvant chemotherapy. Eur J Cancer. (2023) 191:112952. doi: 10.1016/j.ejca.2023.112952
18. Morton LM, Curtis RE, Linet MS, Schonfeld SJ, Advani PG, Dalal NH, et al. Trends in risk for therapy-related myelodysplastic syndrome/acute myeloid leukemia after initial chemo/immunotherapy for common and rare lymphoid neoplasms, 2000-2018. EClinicalMedicine. (2023) 61:102060. doi: 10.1016/j.eclinm.2023.102060
19. Baer C, Huber S, Hutter S, Meggendorfer M, Nadarajah N, Walter W, et al. Risk prediction in MDS: independent validation of the IPSS-M—ready for routine? Leukemia. (2023) 37:938–41. doi: 10.1038/s41375-023-01831-1
20. Zeidan AM, Al Ali N, Barnard J, Padron E, Lancet JE, Sekeres MA, et al. Comparison of clinical outcomes and prognostic utility of risk stratification tools in patients with therapy-related vs de novo myelodysplastic syndromes: a report on behalf of the MDS Clinical Research Consortium. Leukemia. (2017) 31:1391–7. doi: 10.1038/leu.2017.33
21. Ok CY, Hasserjian RP, Fox PS, Stingo F, Zuo Z, Young KH, et al. Application of the International Prognostic Scoring System-Revised in therapy-related myelodysplastic syndromes and oligoblastic acute myeloid leukemia. Leukemia. (2014) 28:185–9. doi: 10.1038/leu.2013.191
22. Kuendgen A, Nomdedeu M, Tuechler H, Garcia-Manero G, Komrokji RS, Sekeres MA, et al. Therapy-related myelodysplastic syndromes deserve specific diagnostic sub-classification and risk-stratification—an approach to classification of patients with t-MDS. Leukemia. (2021) 35:835–49. doi: 10.1038/s41375-020-0917-7
23. Moreno Berggren D, Folkvaljon Y, Engvall M, Sundberg J, Lambe M, Antunovic P, et al. Prognostic scoring systems for myelodysplastic syndromes (MDS) in a population-based setting: a report from the Swedish MDS register. Br J Haematol. (2018) 181:614–27. doi: 10.1111/bjh.15243
24. Hung K, Al-Kali A, Toop C, Patnaik MM, Price Z, Kourelis T, et al. TP53-mutated therapy-related myeloid neoplasms are associated with a long latency and are more prevalent in patients with primary hematological cancers compared to solid tumors. Blood. (2024) 144:4594. doi: 10.1182/blood-2024-211931
25. Hiwase D, Hahn C, Tran ENH, Chhetri R, Baranwal A, Al-Kali A, et al. TP53 mutation in therapy-related myeloid neoplasm defines a distinct molecular subtype. Blood. (2023) 141:1087–91. doi: 10.1182/blood.2022018236
26. Santini V, Stahl M, Sallman DA. TP53 mutations in acute leukemias and myelodysplastic syndromes: insights and treatment updates. Am Soc Clin Oncol Educ Book. (2024) 44:e432650. doi: 10.1200/EDBK_432650
27. Daver NG, Maiti A, Kadia TM, Vyas P, Majeti R, Wei AH, et al. TP53-mutated myelodysplastic syndrome and acute myeloid leukemia: biology, current therapy, and future directions. Cancer Discovery. (2022) 12:2954. doi: 10.1158/2159-8290.CD-22-1192
28. Wong TN, Ramsingh G, Young AL, Miller CA, Touma W, Welch JS, et al. Role of TP53 mutations in the origin and evolution of therapy-related acute myeloid leukaemia. Nature. (2015) 518:552–5. doi: 10.1038/nature13968
29. Nead KT, Kim T, Joo L, McDowell TL, Wong JW, Chan ICC, et al. Impact of cancer therapy on clonal hematopoiesis mutations and subsequent clinical outcomes. Blood Adv. (2024) 8:5215–24. doi: 10.1182/bloodadvances.2024012929
30. Singhal D, Kutyna MM, Hahn CN, Shah MV, Hiwase DK. Therapy-related myeloid neoplasms: complex interactions among cytotoxic therapies, genetic factors, and aberrant microenvironment. Blood Cancer Discovery. (2024) 5:400–16. doi: 10.1158/2643-3230.BCD-24-0103
Keywords: therapy-related myeloid neoplasm, molecular profiling, latency, TP53 mutation, solid cancer, hematologic cancer, allogeneic transplantation
Citation: Costa A, Pilo F, Pettinau M, Piras E, Targhetta C, Rojas R, Deias P, Mulas O and Caocci G (2025) Impact of primary cancer history and molecular landscape in therapy-related myeloid neoplasms. Front. Oncol. 15:1563990. doi: 10.3389/fonc.2025.1563990
Received: 20 January 2025; Accepted: 24 March 2025;
Published: 24 April 2025.
Edited by:
Hussain Alizadeh, University of Pécs, HungaryReviewed by:
Anna M. Eiring, The University of Texas at El Paso, United StatesDa Zhang, University of Kansas Medical Center, United States
Copyright © 2025 Costa, Pilo, Pettinau, Piras, Targhetta, Rojas, Deias, Mulas and Caocci. This is an open-access article distributed under the terms of the Creative Commons Attribution License (CC BY). The use, distribution or reproduction in other forums is permitted, provided the original author(s) and the copyright owner(s) are credited and that the original publication in this journal is cited, in accordance with accepted academic practice. No use, distribution or reproduction is permitted which does not comply with these terms.
*Correspondence: Federica Pilo, cGlsb2ZlZGVyaWNhQGdtYWlsLmNvbQ==