 Shuxiang Chen
 Huijuan Zhang
- Department of Radiology, Shengli Clinical Medical College of Fujian Medical University, Fujian Provincial Hospital, Fuzhou University Affiliated Provincial Hospital, Fuzhou, Fujian, China
Objectives: Differentiating between benign and malignant pure ground-glass nodule (pGGN) is of great clinical significance. The aim of our study was to evaluate whether AI-derived quantitative parameters could predict benignity versus early-stage tumors manifesting as pGGN.
Methods: A total of 1,538 patients with pGGN detected by chest CT at different campuses of our hospital from May 2013 to December 2023 were retrospectively analyzed. This included CT and clinical data, as well as AI-derived quantitative parameters. All patients were randomly divided into a training group (n=893), an internal validation group (n=382), and an external validation group (n=263). Hazard factors for early-stage tumors were identified using univariate analysis and multivariate logistic regression analysis. Independent risk factors were then screened, and a prediction nomogram was constructed to maximize predictive efficacy and clinical application value. The performance of the nomogram was evaluated using ROC curves and calibration curves, while decision curve analysis (DCA) was used to assess the net benefit prediction threshold.
Results: The final logistic model included nine independent predictors (age, location, minimum CT value, standard deviation, kurtosis, compactness, energy, costopleural distance, and volume) and was developed into a user-friendly nomogram. The AUCs of the ROC curves in the training, internal validation, and external validation cohorts were 0.696 (95% CI: 0.638–0.754), 0.627 (95% CI: 0.533–0.722), and 0.672 (95% CI: 0.543–0.801), respectively. The calibration plot demonstrated a good correlation between observed and predicted values, and the nomogram remained valid in the validation cohort. DCA showed that the model’s predictive performance was acceptable, providing substantial net benefit for clinical application.
Conclusions: The clinical prediction nomogram, based on AI-derived quantitative parameters, visually displays an overall score to differentiate benign lesions from early-stage tumors manifesting as pGGN. This nomogram may serve as a convenient screening tool for clinical use and provides a reference for formulating individualized follow-up and treatment plans for patients with pGGN.
1 Introduction
With the increasing use of low-dose spiral CT and the clinical implementation of artificial intelligence (AI)-based auxiliary diagnostic systems (1, 2), an increasing number of asymptomatic ground-glass nodule (GGN) are being detected during routine physical examinations, even in non-smokers. Among these, pure ground-glass nodule (pGGN) have garnered particular attention due to their association with a spectrum of benign and malignant diseases. Benign lesions can be monitored over an extended period, while preinvasive lesions, such as atypical adenomatous hyperplasia (AAH) and adenocarcinoma in situ (AIS), can be closely followed to determine the optimal timing for limited resection. In contrast, minimally invasive adenocarcinoma (MIA) and invasive adenocarcinoma (IAC) necessitate immediate surgical intervention. The prevalence of “indolent cancers” presenting as pGGN is on the rise (3–7). The psychological and economic burdens on individuals can significantly affect their quality of life. Overdiagnosis and overtreatment are common risks that further complicate the situation. Therefore, reducing the incidence of these phenomena has become a focal point of screening research (8–10).
The management of pulmonary nodule poses a significant clinical challenge due to their varied nature. Most benign lesions either subside or remain stable over time, often requiring only routine follow-up. Among malignant nodule, there exists a spectrum of neoplastic lesions, ranging from AAH to AIS, MIA, and IA. Early-stage tumors, such as AIS and MIA, have a 5-year survival rate approaching 100% (11), Consequently, for these early-stage lesions, initial observation followed by timely surgical intervention is a reasonable approach. In contrast, IA requires more aggressive management. Thus, accurately distinguishing the nature of persistent pGGN holds significant clinical importance to ensure rational responses from both patients and clinicians. Traditional CT imaging features of benign and malignant lesions often overlap, and the phenomena of “same disease, different imaging signs” and “same sign, different diseases” occur frequently, necessitating further investigation. Achieving an accurate qualitative diagnosis and determining appropriate clinical treatment strategies remain critical challenges for both patients and clinicians. Various factors have been identified as potential predictors for differentiating between benign and malignant lung nodule. These include nodule size, spiculation, lobulation, and other radiological features, as well as patient characteristics such as age, smoking history, and family history of lung cancer. These factors have been incorporated into nomograms to calculate individualized risk scores for GGN nature (3–7). Compared to solid nodule, GGN, particularly pGGN, exhibit relatively indolent behavior. In most cases, patients with pGGN demonstrate favorable survival rates and low recurrence. However, predicting the presence of invasive components within pGGN remains a significant challenge. Conventional CT features of pGGN across different diseases are often similar, and there is a lack of precise quantitative indicators. In recent years, radiomics has made remarkable progress in identifying the degree of invasiveness in pulmonary nodule. However, radiomics requires manual delineation, which is time-consuming, labor-intensive, and prone to inter- or intra-observer variability and manual measurement errors (2, 12–14). As a highly efficient and promising automated method, AI-based quantitative parameters may address these shortcomings. AI can capture subtle differences that are difficult to discern with the naked eye.
With the continuous advancement in the integration of medicine and engineering, AI-assisted diagnostic systems for pulmonary nodule have been widely adopted in clinical practice (5, 6, 15). Leveraging 3D deep convolutional neural networks, AI can accurately capture the complete 3D structural information of pulmonary nodule, which vary in shape and size, and enable the automatic extraction of nodule contours. These systems not only automatically detect the location of pulmonary nodule but also perform rapid quantitative analysis. Various three-dimensional quantitative parameters of pulmonary nodule—such as average CT value, 3D long diameter, maximum area, volume, surface area, compactness, sphericity, and entropy—can reveal subtle changes that are imperceptible to the human eye. These AI systems offer higher sensitivity and repeatability, assisting doctors in enhancing the accuracy of imaging diagnoses, reducing missed diagnoses and misdiagnoses, and minimizing repetitive and labor-intensive tasks (16).
AI is becoming increasingly integrated into all areas of medicine and has gradually demonstrated its advantages in lung cancer screening, segmentation, location identification, classification, and diagnosis of lung nodule in clinical practice (8, 17–20). AI-derived quantitative parameters may provide additional information for differentiating the nature of pGGN, aiding in the early screening, diagnosis, and treatment of malignant pulmonary nodule, while also helping to avoid overdiagnosis and overtreatment of benign lung lesions (9, 21). Therefore, whether AI parameters, which are automatic and convenient, can provide further valuable insights remains an interesting question for further investigation. To the best of our knowledge, no published studies have focused on using AI-derived quantitative parameters to predict the nature of pGGN. In this study, we aim to develop a clinical prediction nomogram based on AI-derived quantitative parameters to differentiate between benign and malignant pGGN. We hope to contribute valuable insights to the field of pGGN management and assist healthcare providers in optimizing patient care and treatment decisions.
2 Materials and methods
2.1 Patient data
Chest CT images and clinical data were retrospectively collected from patients with GGN in different campus of hospital from May 2013 to December 2023, 1538 patients with pGGN were enrolled in the study. including 562 males and 976 females, aged from 26 to 78 years, with an average age of 55 ± 12 years. There were 111 cases of IA, 615 cases of MIA, 48 cases of AIS, 610 cases of AAH and 154 cases of benign diseases. The flow chart showed the enrollment of patients (Figure 1).
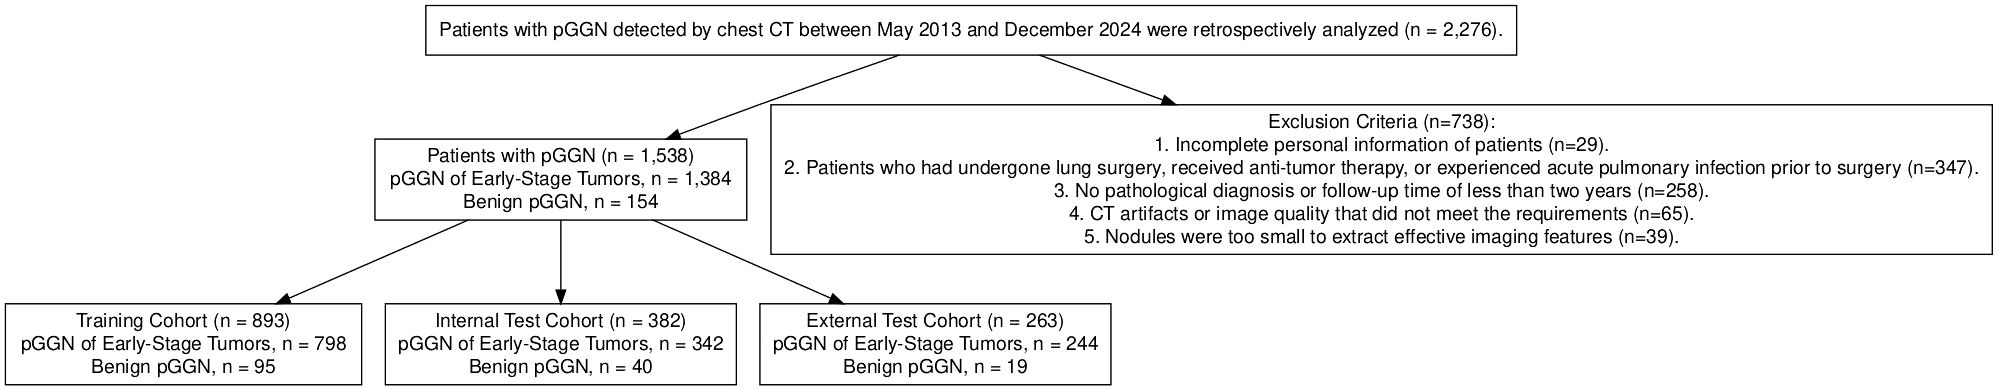
Figure 1. The flow chart showed the enrollment of patients.
The type of nodule is often inconsistent even among chest radiologists, for consistency, the AI classification of ground glass nodule was uniformly used as the standard in this study, and then individually verified by two radiologists with more than 5 years of experience, who were blinded to the lesion results, analyzed and recorded the lesion features, including lesion site, number, If there was a disagreement, the decision was made by a third experienced radiologists.
Inclusion Criteria:
1. Complete CT images and clinical records were available for analysis.
2. Patients had not undergone needle biopsy, surgery, radiotherapy, or other related treatments prior to the CT examination.
3. The image format was required to be DICOM.
4. The nodule were identified as pGGN and the size ranged from 3mm to 3cm.
5. For cases with multiple lesions, postoperative pathological results could be correlated with CT images.
6. For pGGN confirmed as malignant by surgical or biopsy pathology, or those that resolved after anti-inflammatory treatment or follow-up, the diagnosis of malignant nodule was based on pathological evidence. If pGGN resolved during follow-up and were considered benign but lacked pathological confirmation, patients were required to undergo follow-up for more than two years.
2.2 CT image protocol
All patients were scanned at full inspiration while in the supine position with their hands raised, using either the Somatom Definition AS 128 or the Somatom go. Top scanner. All CT examinations were performed from the apex to the base of the lungs following standard clinical scanning protocols. The tube voltage was set at 120 kV, and automatic tube current modulation was applied. Thin-slice reconstructions were performed with a slice thickness of 1.25 mm. Image post-processing adhered to standardized protocols. Routine chest CT imaging included both pulmonary and mediastinal window settings.
2.3 Image analysis
The chest CT images were automatically detected and delineated using the Artificial Intelligence-Assisted Diagnosis System (https://www.shukun.com/product/). This system performed automatic segmentation and extracted quantitative parameters, including mean CT value, maximum CT value, minimum CT value, median CT value, standard deviation, kurtosis, skewness, entropy, compactness, sphericity, energy, surface area, maximum 3D diameter, costopleural distance, mass, and volume. Pathological results, along with the following demographic and clinical data, were also collected, such as sex, age, and lesion location.
2.4 Statistical analysis
The dataset collected from one campuses of our hospital was randomly divided into training and validation cohorts at a ratio of 7:3. Cases collected from another hospital campuses served as an external validation set. Continuous variables are presented as median (interquartile range), and categorical variables are expressed as absolute counts and percentages (%). In the univariate analysis, the chi-square test or Fisher’s exact test was used to analyze categorical variables, while the Student’s t-test or rank-sum test was applied for continuous variables. In the training cohort, least absolute shrinkage and selection operator (LASSO) logistic regression analysis was performed for multivariate analysis to screen for independent risk factors. Based on these results, a practical nomogram was developed to differentiate benign from Early-Stage Tumor pGGN. The performance of the nomogram was evaluated using the receiver operating characteristic (ROC) curve, calibration curve, and decision curve analysis (DCA). Statistical significance was defined as a two-sided p value < 0.05. All statistical analyses were conducted using R software (version 4.2.2) and MSTATA software (www.mstata.com).
3 Results
3.1 Patient characteristics
Univariate analyses were performed to compare indices between different cohort (Table 1, Supplementary Table 1). The baseline demographic and clinical characteristics of the study population were analyzed across three cohorts: the training cohort, which included 893 individuals, the internal test cohort, comprising 382 participants, and the external test cohort, consisting of 263 subjects. The distribution of sex revealed that 63.9% of participants in the training cohort were female, compared to 61.3% in the internal test cohort and 65.0% in the external test cohort, with no significant differences (p = 0.559). Similarly, there were no significant differences in median age across the cohorts (p = 0.802).
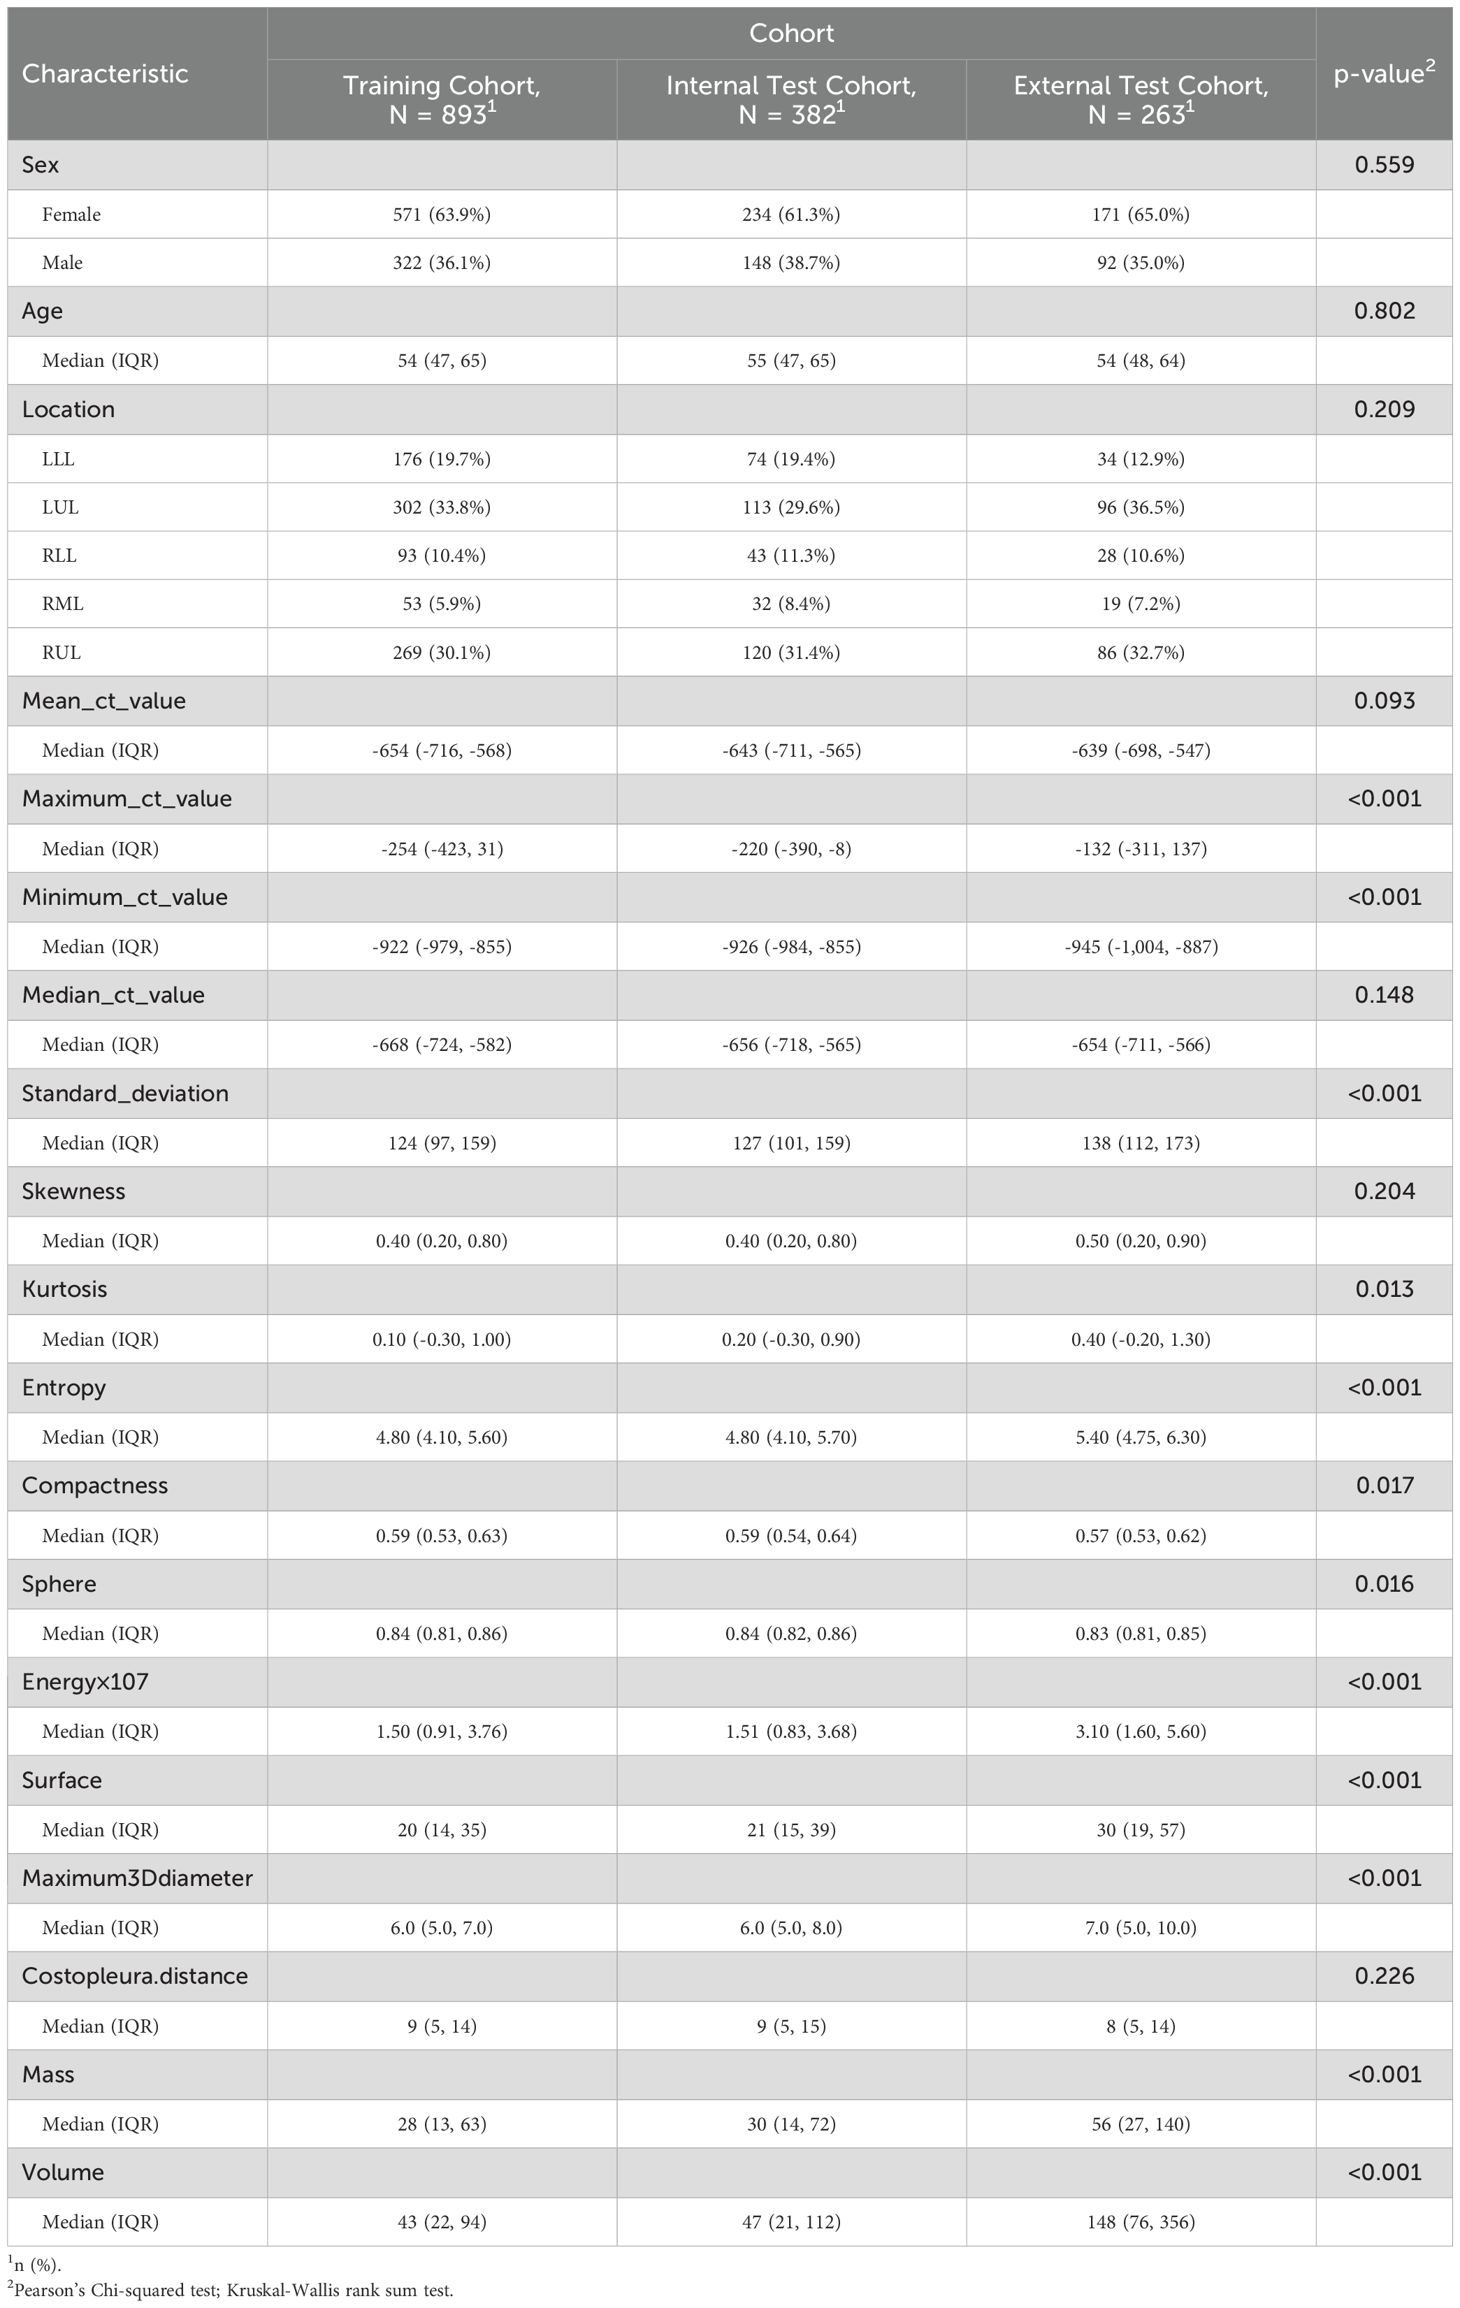
Table 1. Patient demographics and baseline characteristics.
Regarding lesion location, the highest proportion of lesions was observed in the left upper lobe (LUL) across all cohorts, followed by the right upper lobe (RUL) and the left lower lobe (LLL), with varying percentages among the cohorts. The mean CT value did not differ significantly between the cohorts (p = 0.093). However, statistically significant differences were observed for several other parameters, including the maximum CT value, minimum CT value, median CT value, standard deviation, skewness, kurtosis, entropy, compactness, sphericity, and energy, with all p-values below 0.001. Additionally, parameters such as surface area, maximum 3D diameter, costopleural distance, mass, and volume also showed significant variations among the cohorts (p-values below 0.001 or 0.017).
3.2 LASSO regression and hyperparameter tuning
LASSO was employed to select the most predictive features while addressing multicollinearity and overfitting. LASSO applies an L1 penalty (absolute value of coefficients), which shrinks less important feature coefficients to zero. Features with negligible contributions to the prediction task are thus excluded. For example, Eliminated Features: Sex_Male, Mean_ct_value, Maximum_ct_value, and Median_ct_value had coefficients shrunk to zero (Table 2), indicating their minimal discriminatory power in the model.
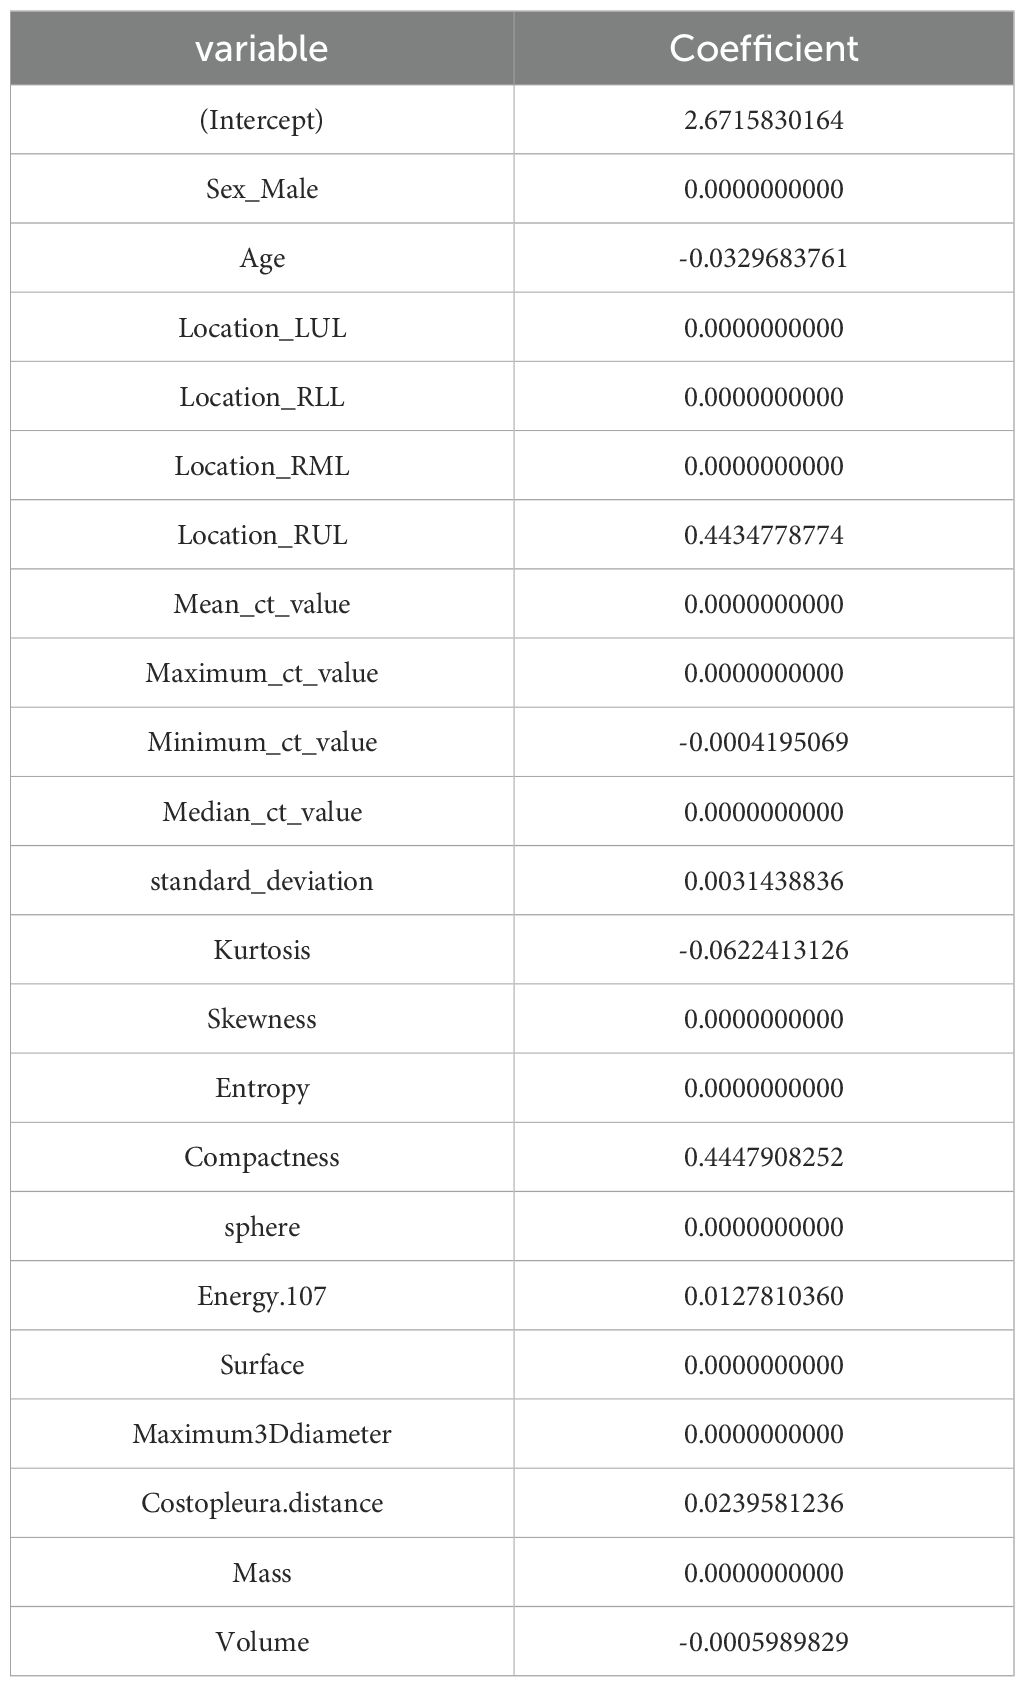
Table 2. The coefficients of Lasso regression analysis.
Retained Features: Age, Location_RUL, and Volume had non-zero coefficients, reflecting their clinical relevance and statistical significance (Table 2, Figure 2). For redundancy reduction, radiomic features often exhibit high correlation (e.g., Mean_ct_value, Maximum_ct_value, and Median_ct_value). LASSO automatically selects one representative feature from correlated clusters, Only Minimum_ct_value was retained from the CT value family, as it captured unique variance not explained by other correlated features (Figure 2).
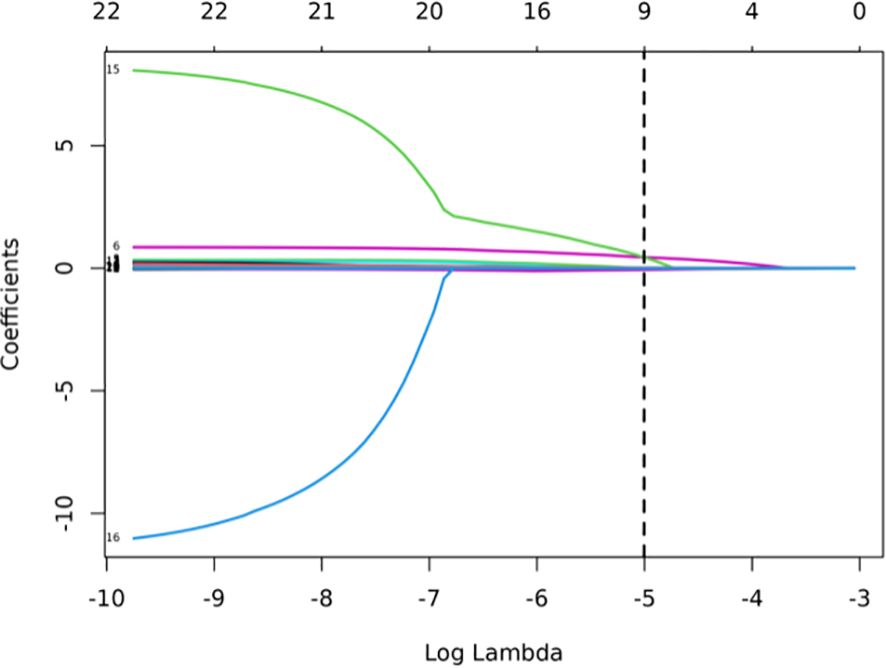
Figure 2. LASSO coefficient profiles of the features. Lasso Regression Coefficient Path Plot (λ = 0.0067).
Hyperparameter Optimization, The hyperparameter λ (lambda) controls the strength of the L1 penalty and was optimized as follows:
Ten-fold cross-validation was performed on the training cohort (N=893) to select λ.The “one standard error (1-SE) rule” was applied to choose the most parsimonious model within 1 SE of the minimum mean squared error (MSE). The optimal λ value (0.0067) balanced model complexity and predictive accuracy (Figure 3). This λ retained 9 out of 21 features, achieving sparsity without sacrificing discriminative performance (AUC: 0.696 in training; Table 3). Finally, the features of AI CT after screening were entered into a support vector machine (SVM) classifier to establish a model that distinguished between benign and malignant pGGN (Tables 2, 4, Figure 4). Further multivariate logistic analyses were carried out in different cohorts.
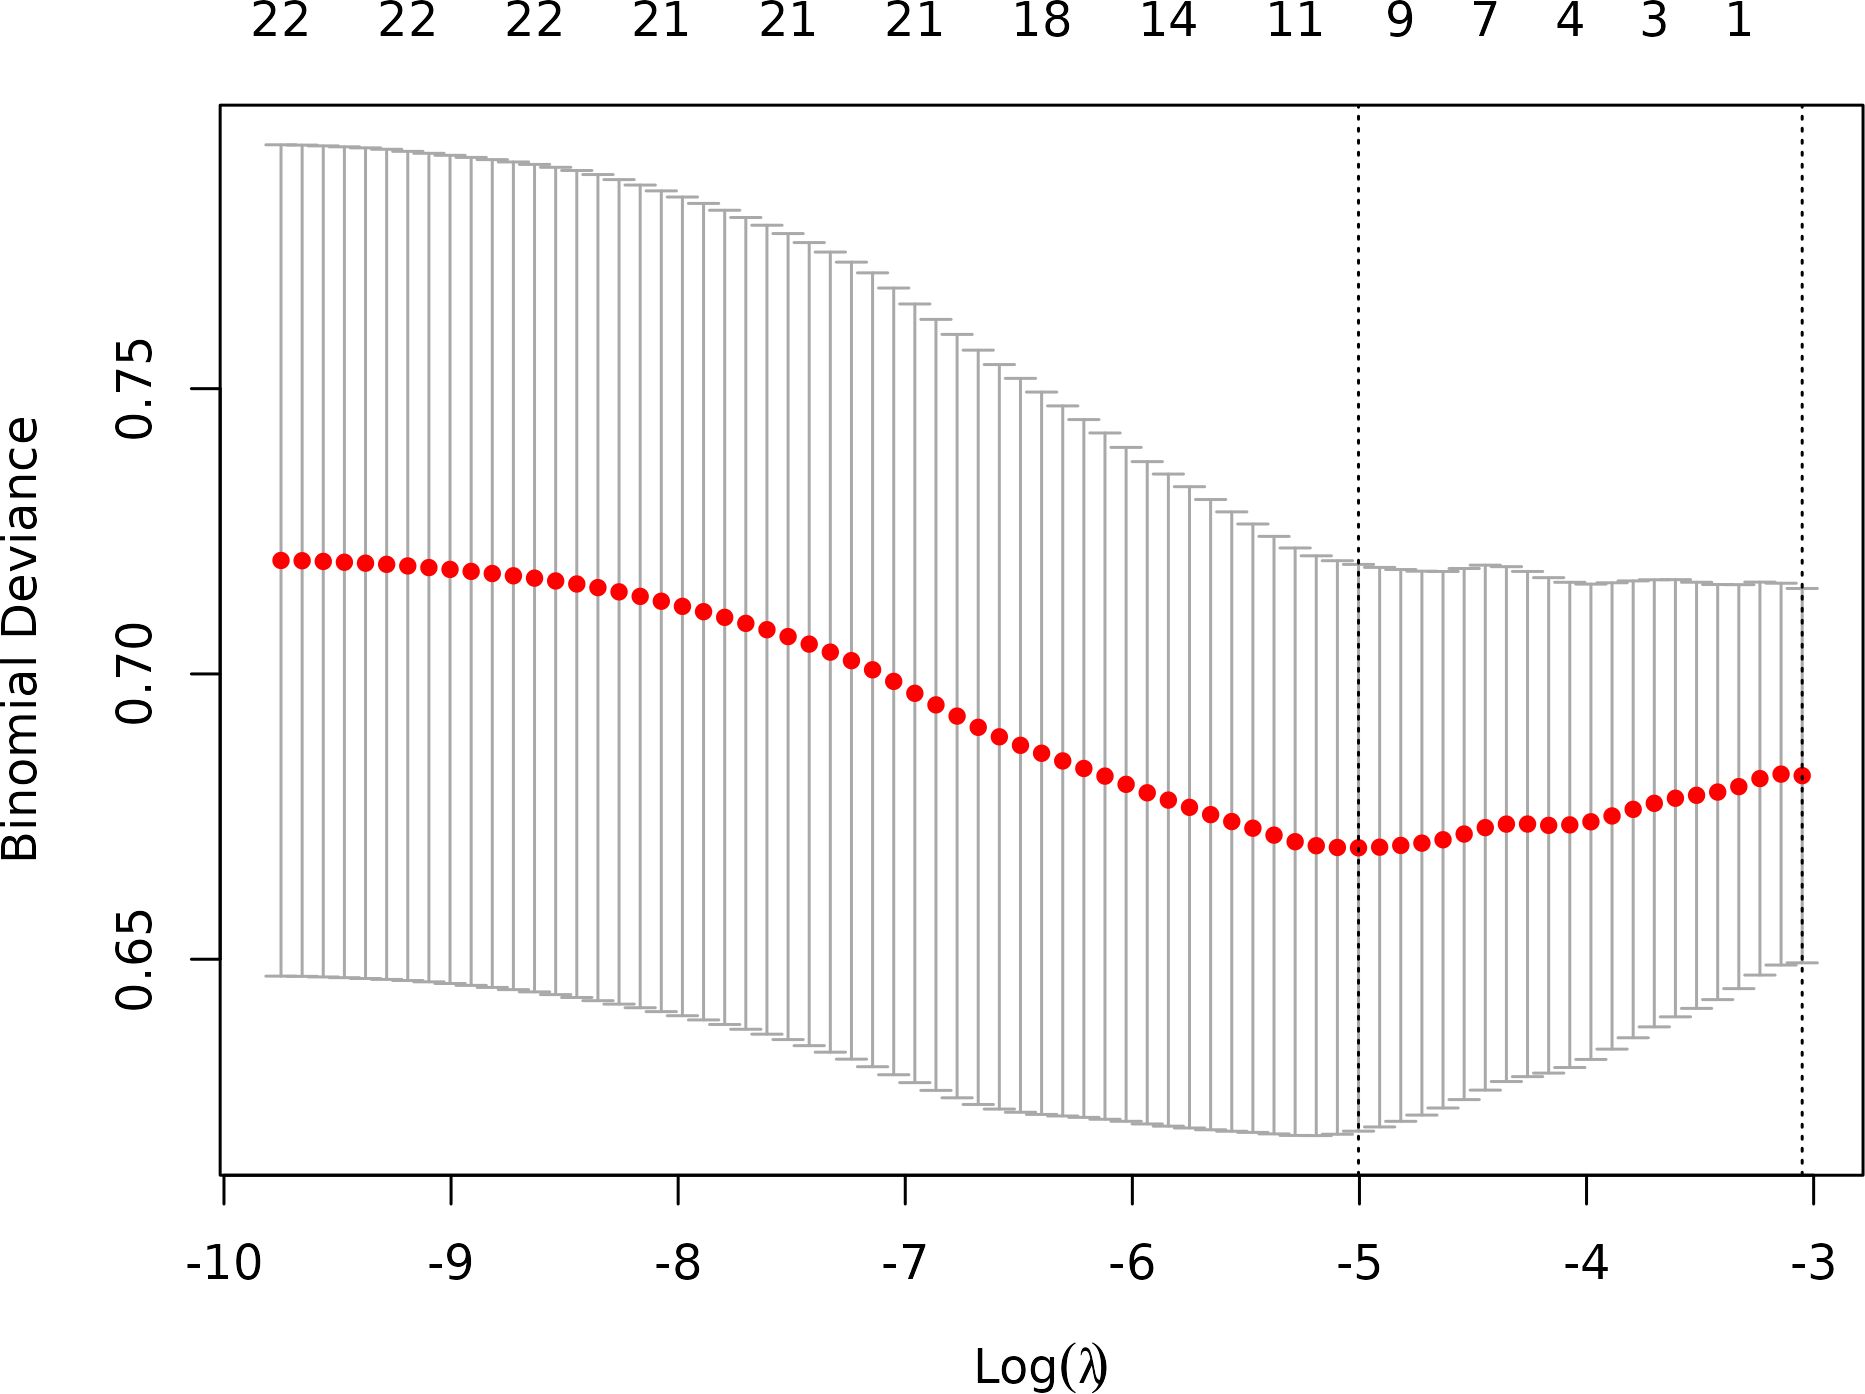
Figure 3. Optimal feature selection of cross-validation. Lasso Regression Cross-Validation Plot.(λ = 0.0067).
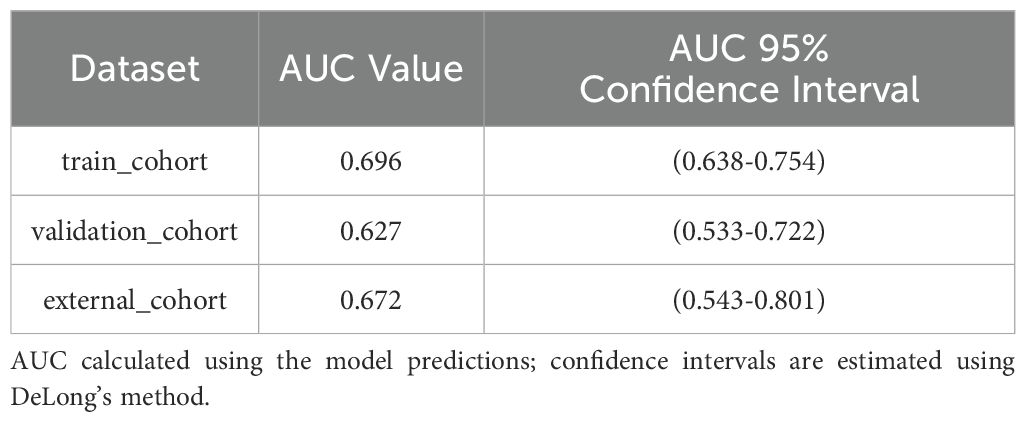
Table 3. AUC values and 95% confidence intervals for datasets.
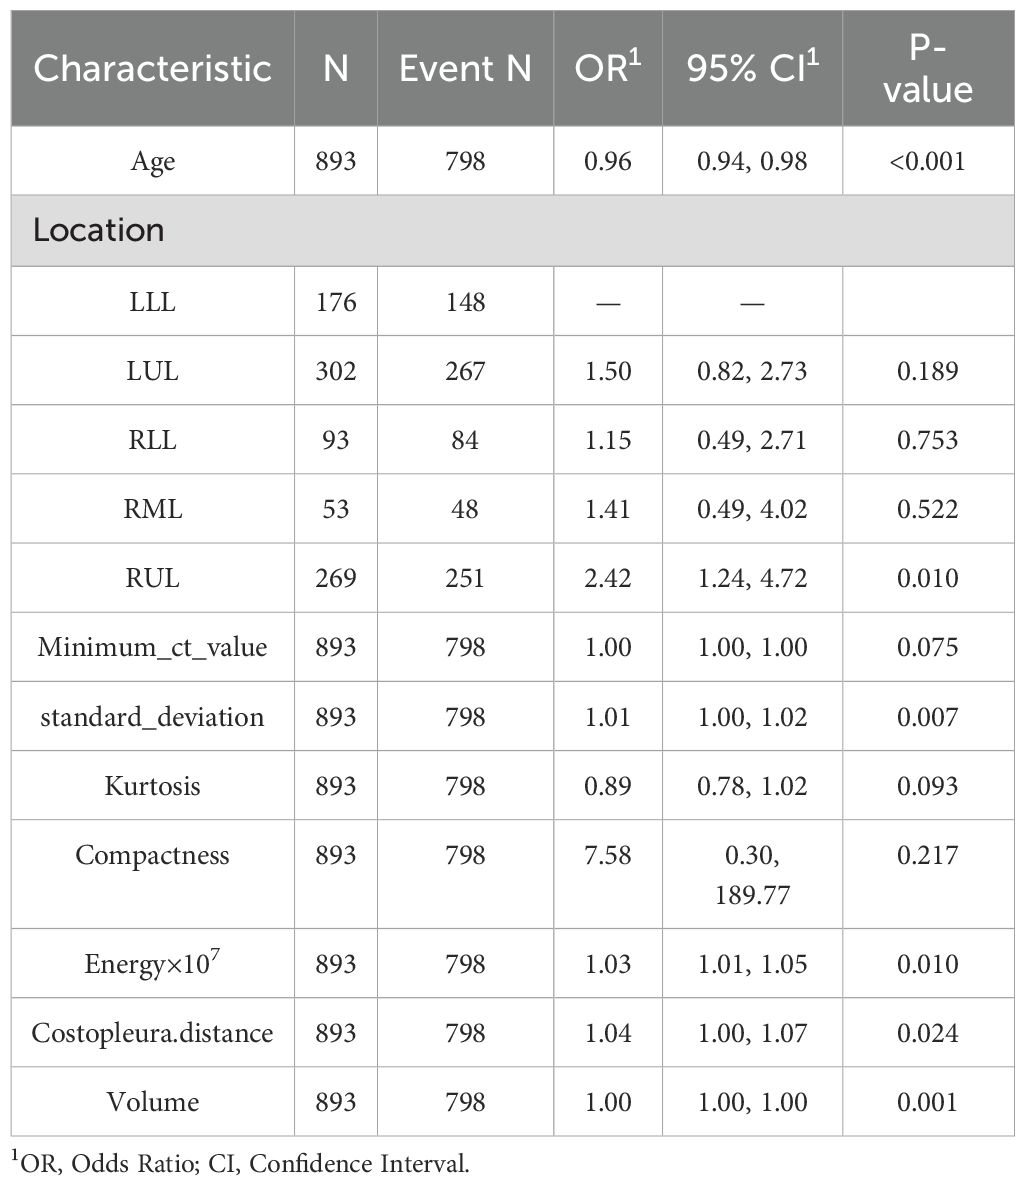
Table 4. Results of multivariate logistic regression for training cohort.
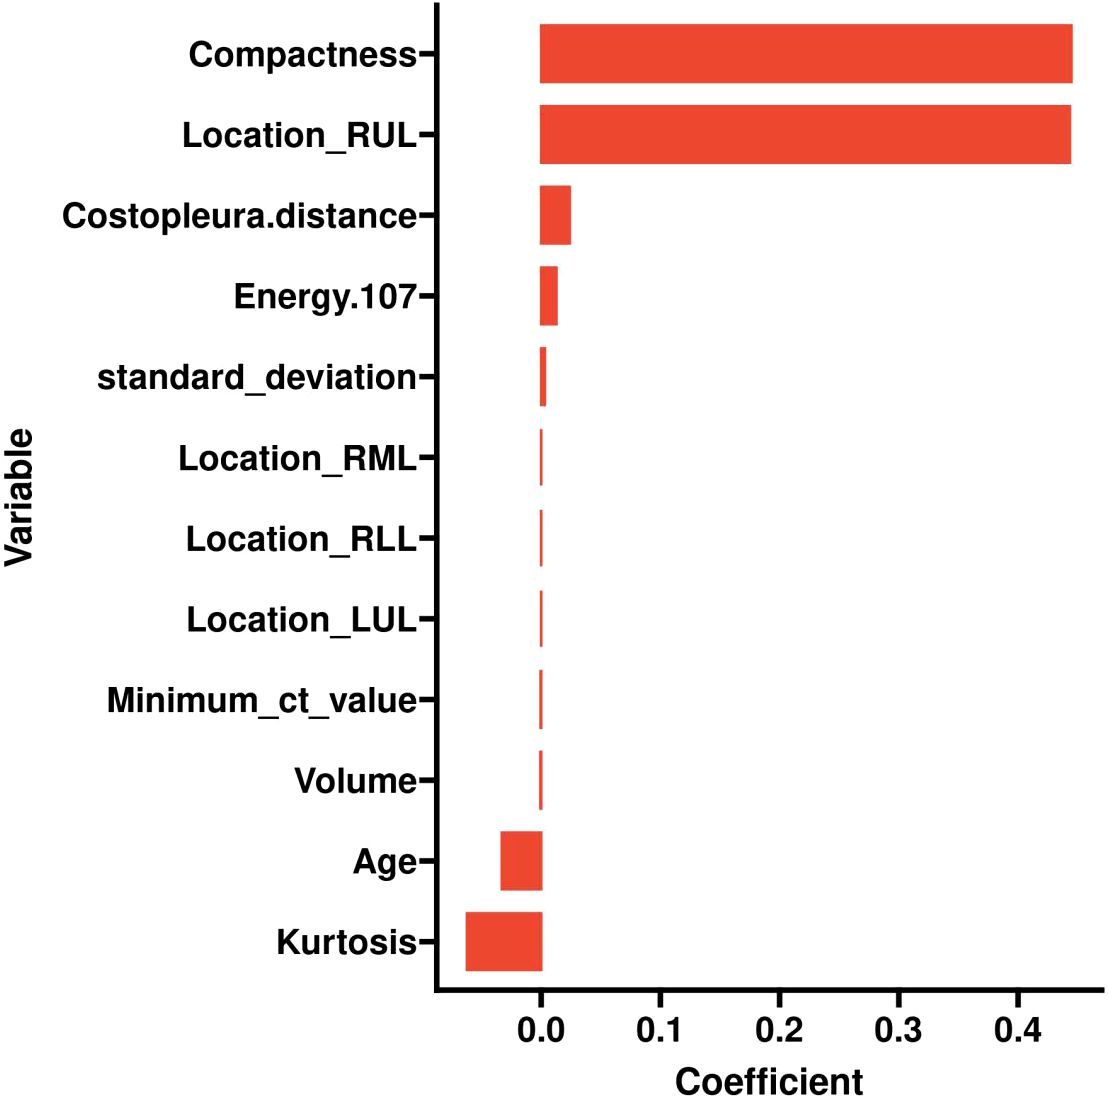
Figure 4. Histogram of the coefficients of the selected feature.
3.3 Predictive model
The final logistic model included 9 independent predictors (Age, Location, Minimum_ct_value, standard_deviation, Kurtosis, Compactness, Energy, Costopleura.distance, and Volume) and developed as a simple-to-use nomogram (Figure 5). The AUCs of the model in different cohorts (Figure 6, Table 3).
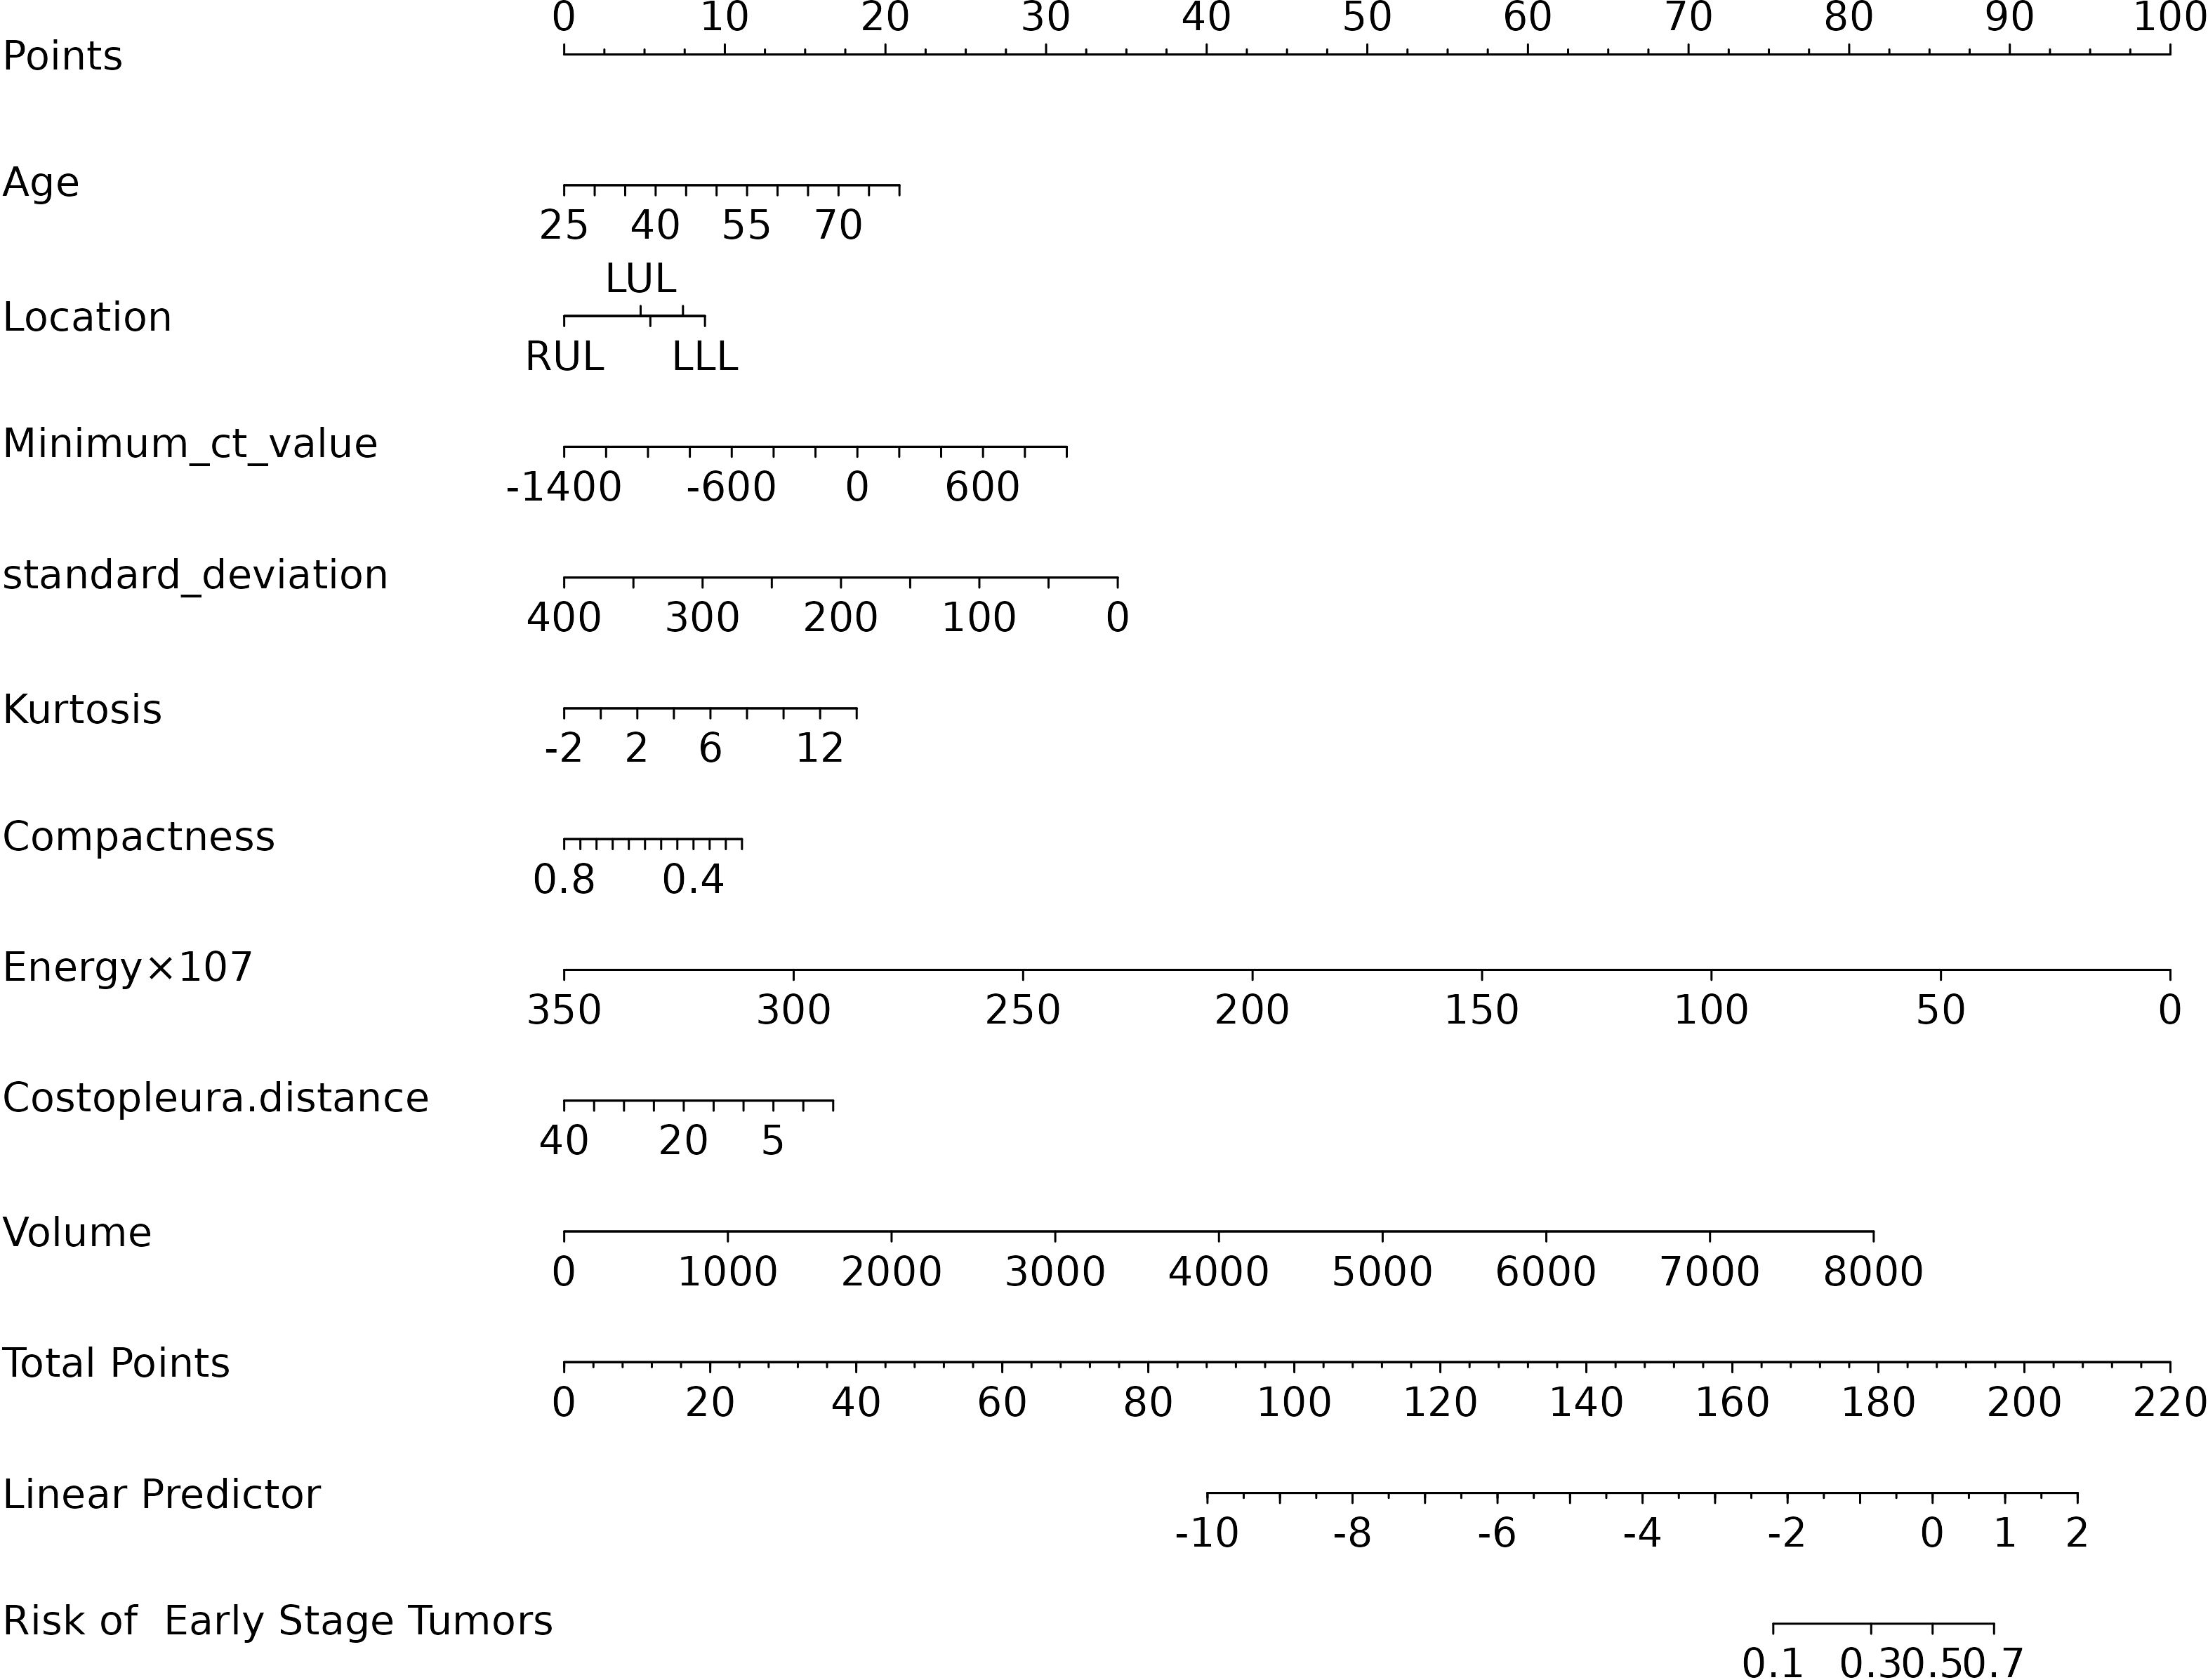
Figure 5. Nomogram of prediction model.
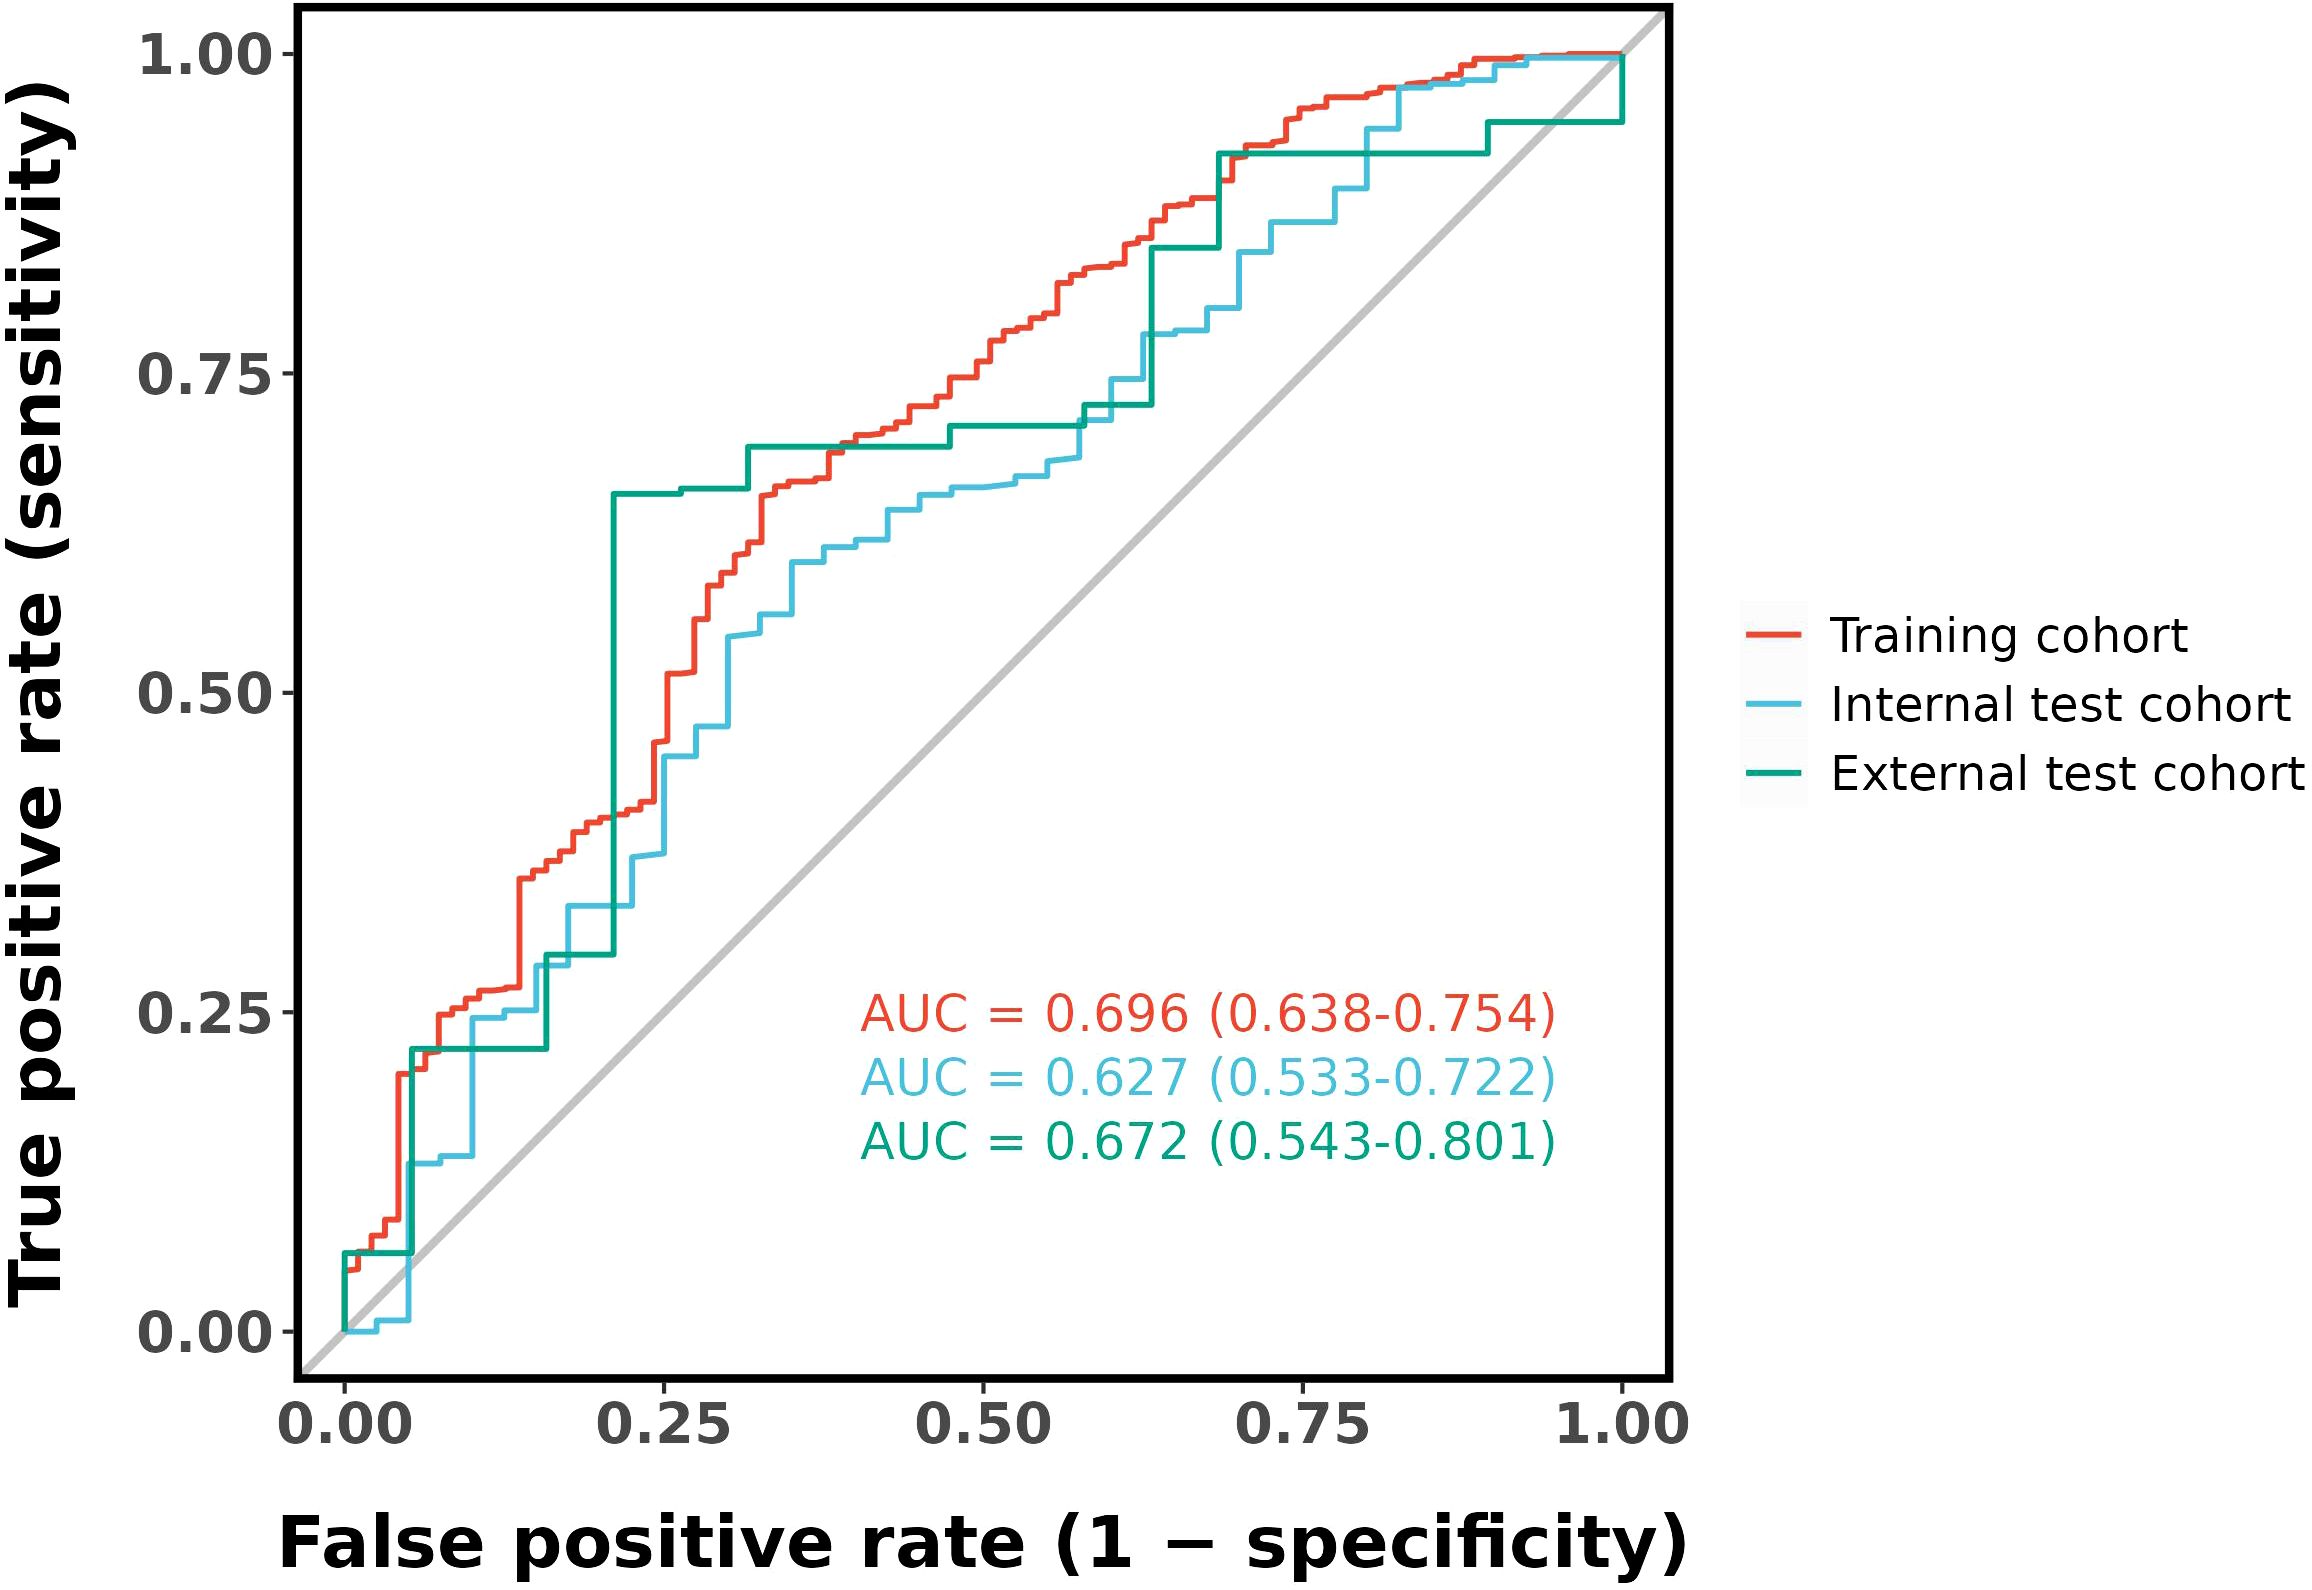
Figure 6. ROC curves of the nomogram.
The calibration plots of the nomogram in different cohorts demonstrate a good correlation between the observed and predicted Status (Figure 7). The results showed that the original nomogram was still valid for use in the validation sets, and the calibration curve of this model was relatively close to the ideal curve, which indicates that the predicted results were consistent with the actual findings. A high-risk threshold probability reflects the likelihood of substantial discrepancies in the model’s predictions when clinicians encounter significant challenges while using the nomogram for diagnostic and decision-making purposes. This study demonstrates that the nomogram provides notable net benefits for clinical application, as evidenced by its DCA curve (Figure 8).
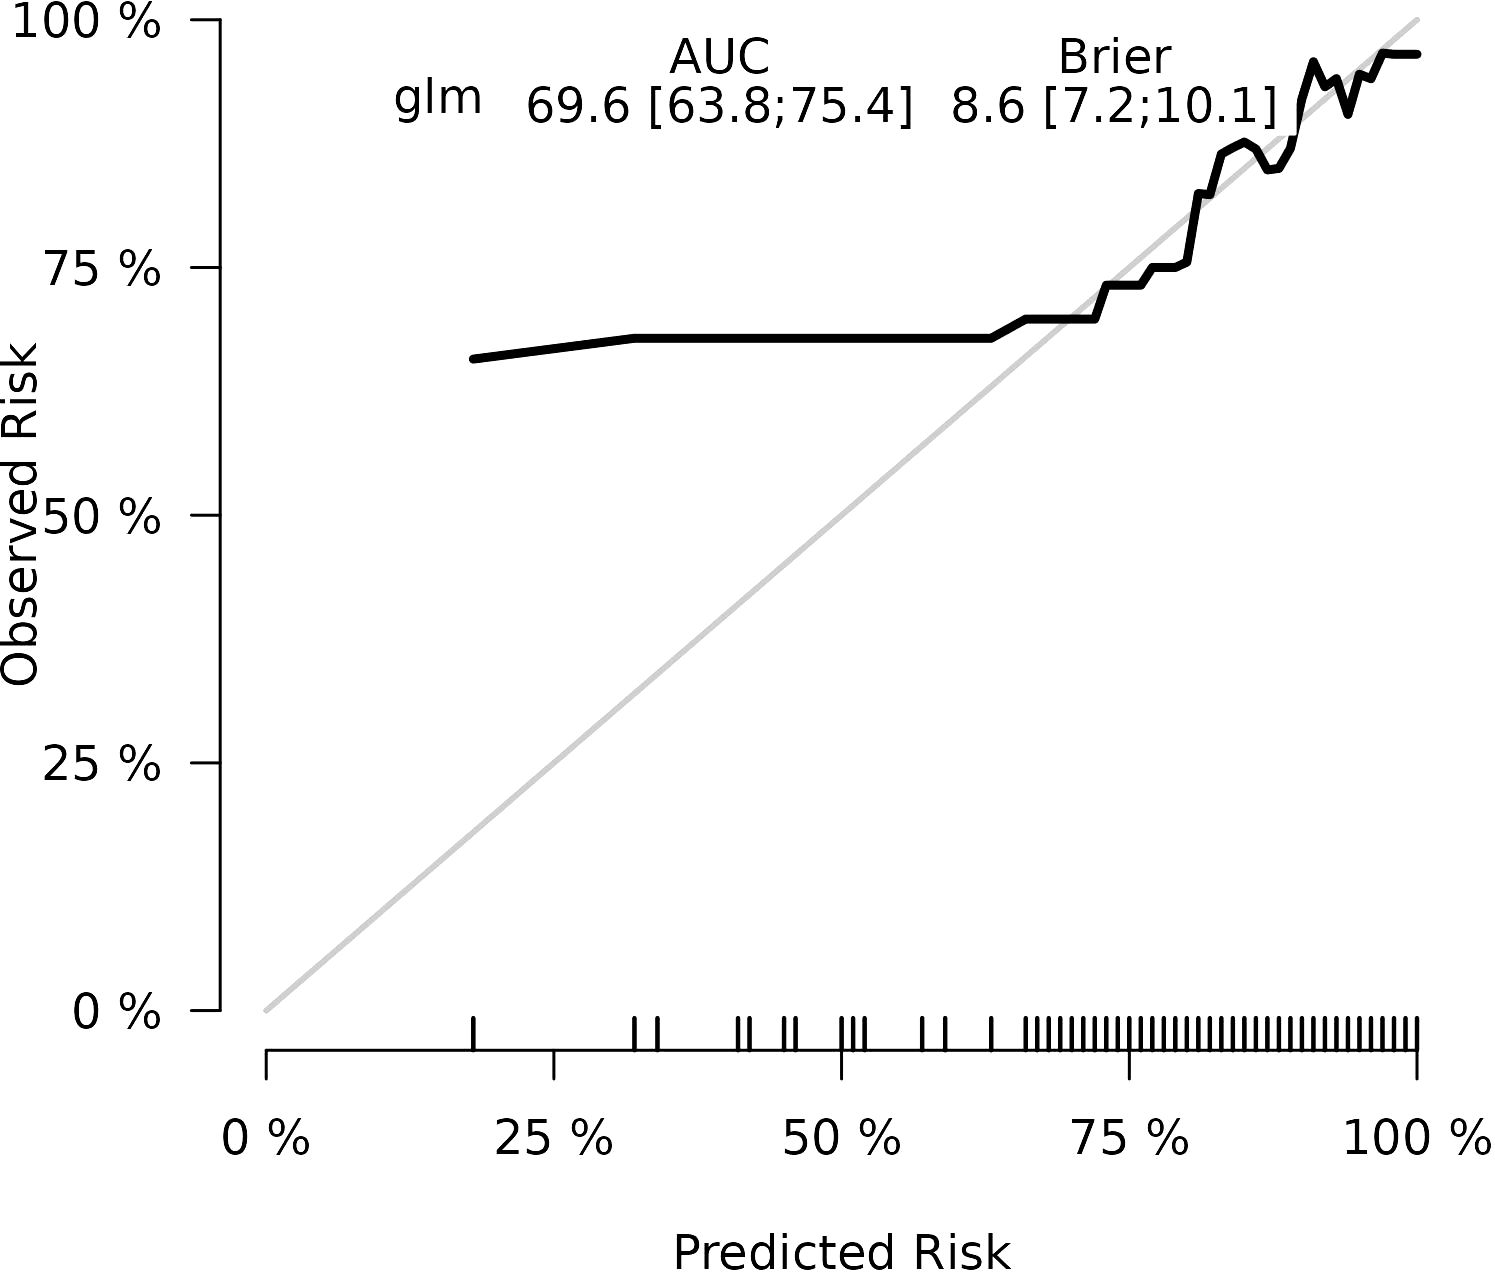
Figure 7. Calibration curve of the nomogram prediction mode for the training cohort.
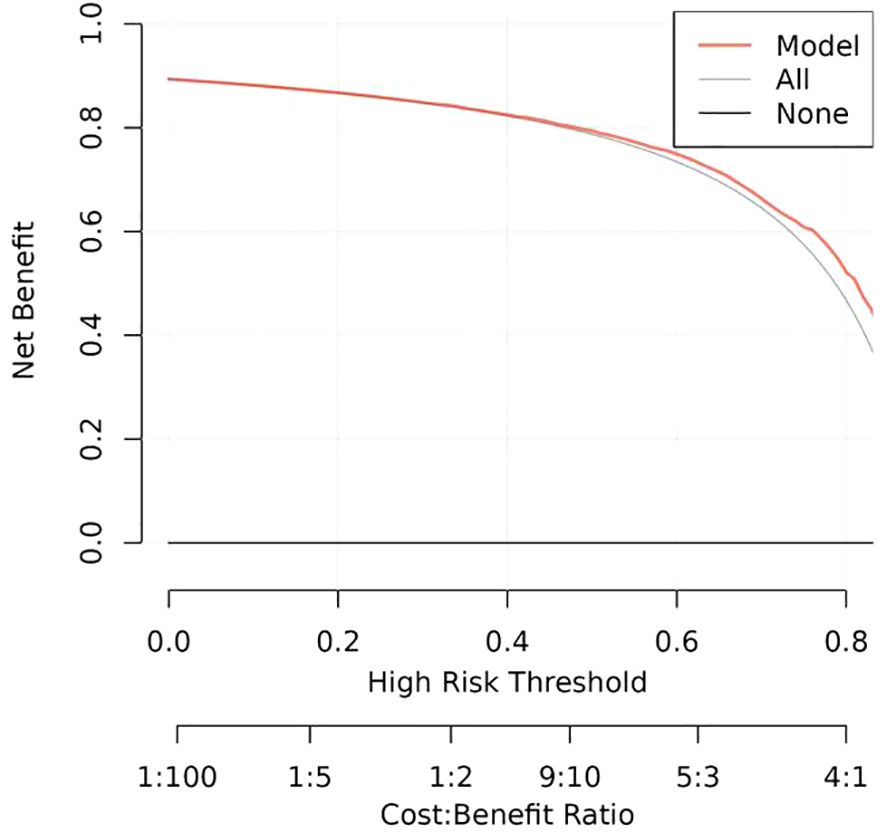
Figure 8. Decision curve analysis of the nomogram of the training cohort.
3.4 Clinical implications of misclassification
Detailing FP/FN cases and mitigation strategies (Table 5). Training Cohort (N=893),False Positives (FP): 62 cases (6.9%), Primary Causes: Benign inflammatory nodules with high radiomic similarity to malignancies (e.g. high Compactness, OR=7.58, p=0.217).Small nodules (Volume < 30 mm³) misclassified due to partial volume effects. False Negatives (FN): 33 cases (3.7%) Primary Causes: Early-stage tumor with low standard_deviation (p=0.007) or atypical Kurtosis (p=0.093).Subpleural nodules where Costopleura.distance was overestimated. Sensitivity-Specificity Inverse Relationship: At 0.3 threshold, sensitivity improves (92.5%) but at the cost of higher FP (41.7%).At 0.7 threshold, specificity rises (89.7%) but misses 35.9% of true positives. Optimal Threshold Selection: For screening, we recommend 0.3 threshold (minimize missed cases).For diagnostic confirmation, 0.7 threshold reduces unnecessary procedures.
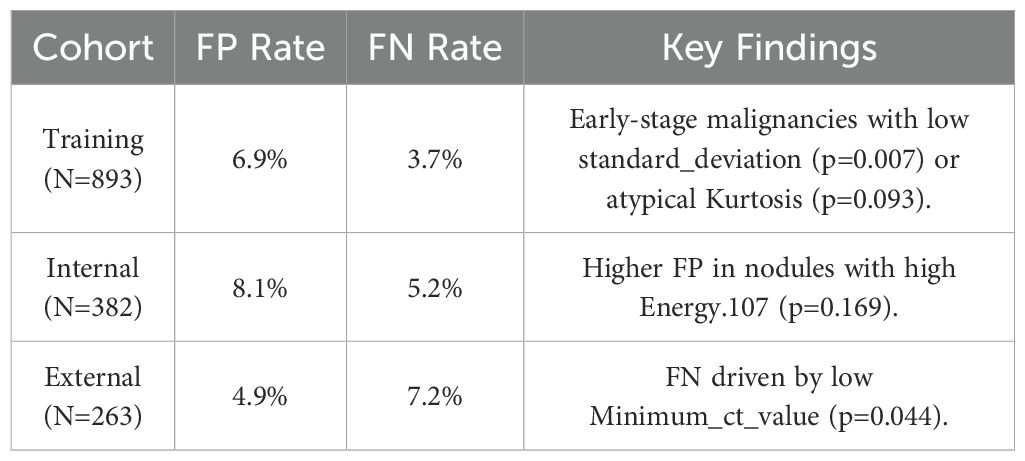
Table 5. FP/FN cases and mitigation strategies in different cohort.
4 Discussion
In this study, we developed and validated a nomogram based on AI-derived quantitative Parameters to differentiate benign lung lesions from early-stage tumors manifesting as pure ground-glass. The primary predictors incorporated into the nomogram included age, lesion location, minimum CT value, standard deviation, kurtosis, compactness, energy, costopleural distance, and volume, all of which were statistically significant in multivariate logistic regression analysis. Similarly, Yang et al. (22) developed a risk prediction model for pGGN invasiveness using meta-analysis-derived features, further validating the utility of radiomics in this context. In our study, we based on AI-derived quantitative Parameters, which rarely reported in the previous literature.
Many literatures have reported that imaging signs of pulmonary nodule, such as lobulation, spiculation, pleural indentation, vacuole sign, and vascular convergence, are suggestive for differentiating malignant lesions (23). However, these signs are less frequently observed in pGGN, and their density is often faint, making it challenging to accurately evaluate the benign or malignant nature of pGGN. Additionally, there is considerable overlap in CT imaging features between benign and malignant lesions. Conventional two-dimensional CT feature analysis has certain limitations, including empirical bias, subjectivity, and insufficient specificity, which cannot be reasonably quantified or accurately assessed. The AI-based quantitative parameters included in this study can help address these limitations.
Our findings are consistent with the existing literature in many respects (22, 24–26), The inclusion of parameters such as energy and compactness in our model reflects their importance in capturing the heterogeneity and morphological complexity of pGGNs, which are often associated with malignancy. For instance, the maximum diameter, regular shape, mean CT value, and lobulation have been previously identified as significant predictors in prior research. However, our study uniquely underscores the importance of quantitative features such as Minimum_ct_value, standard_deviation, kurtosis, compactness energy, costopleura distance, and volume, which are acquired through AI. These features were not emphasized in earlier studies. This discrepancy may be attributed to AI’s ability to extract more quantitative information that is difficult for the human eye to discern.
Asymptomatic pGGN in the lung often persist in clinical practice and represent the most overlapping benign and malignant pulmonary nodule. There is currently no consensus on the management strategy, which often imposes a psychological burden on patients. Clinical attention should focus on early screening, accurate diagnosis, and appropriate treatment of malignant nodule, while also reasonably controlling the frequency of follow-up to avoid overdiagnosis and overtreatment (27, 28).There are ongoing controversies surrounding the management strategy for persistent pGGN. Currently, clinical diagnosis and treatment strategies are primarily based on the dynamic changes observed through manual measurements on routine CT scans, as well as non-quantitative features assessed visually (6, 29–31). While AI-derived metrics offer advantages such as reflecting the natural growth of pGGN and quantitatively capturing subtle changes that are difficult to identify with the naked eye during follow-up, they are also helpful for personalized management.
Our results are consistent with prior research demonstrating the prognostic value of radiomic features in lung nodule assessment. For example, our focus on pGGNs aligns with the growing recognition of their unique clinical behavior, as discussed in studies by Sun et al. (31) and Yang et al. (22). The moderate AUC values in our study are comparable to those reported in similar radiomic models, suggesting that while these tools are promising, they are not yet definitive and should complement, not replace, clinical judgment.
In addition, our study visually displays the overall scores of benign and malignant pGGN patients using a nomogram. This provides clinicians with a quantitative tool to predict benignity or early-stage tumors manifesting as pGGN more accurately than traditional methods, thereby aiding in better risk stratification. Moreover, the early identification of high-risk individuals through this nomogram can facilitate timely interventions, potentially reducing morbidity and mortality.
5 Limitations and future directions
Our study has several limitations that should be acknowledged. First, the current predictive accuracy of our models (with AUC values of 0.696, 0.627, and 0.672) leaves room for improvement. These results align with previous studies that have explored radiomic features for pGGN characterization (31). Ensemble learning or deep learning methodologies may could enhance classification performance. Our next steps will systematically evaluate advanced ensemble methods (e.g.Stacking or Boosting);Incorporate lightweight deep learning architectures (e.g.EfficientNet) to balance performance and computational cost and optimize model generalizability through expanded sample sizes. The moderate performance of our model suggests that while radiomic features provide valuable insights, further refinement—such as incorporating advanced machine learning techniques or additional biomarkers—could enhance predictive accuracy. The cohort consisted exclusively of patients from China, which may limit its representativeness of the broader global population. Expanding the sample size through multi-center studies is a crucial direction for future research, as it will be essential to validate the generalizability of our findings. The cases included in this study comprised all cases with pathological results or follow-up absorption, which introduced a degree of selection bias. Future studies should adopt a prospective design and include all suspected cases in advance, regardless of final diagnosis or follow-up, to avoid retrospective bias. In addition, the number of benign cases was relatively limited. Furthermore, there may be unmeasured confounders that were not accounted for in our model. Furthermore, incorporating novel predictors or biomarkers could improve the predictive accuracy of the nomogram, highlighting the need for further investigation.
In summary, our study presents a practical nomogram for predicting malignancy in pGGNs, leveraging clinical and radiomic features. While the model demonstrates moderate performance, its integration into clinical practice could aid in risk stratification and guide personalized follow-up strategies.
Data availability statement
The datasets generated and/or analyzed during the current study are not publicly available due sharing data is not included in our research institution review board but are available from the corresponding author on reasonable request. Requests to access the datasets should be directed to NTI3MzM2MTAwQHFxLmNvbQ==.
Ethics statement
This retrospective study was approved by the Ethics Committee of Fujian Province Hospital(K2021-12-011)and requirement of patient informed consent was waived. The studies were conducted in accordance with the local legislation and institutional requirements. The ethics committee/institutional review board waived the requirement of written informed consent for participation from the participants or the participants’ legal guardians/next of kin because This study was a retrospective analysis of medical CT images.
Author contributions
ShuxC: Conceptualization, Data curation, Formal Analysis, Funding acquisition, Investigation, Methodology, Project administration, Resources, Software, Supervision, Validation, Visualization, Writing – original draft, Writing – review & editing. HZ: Investigation, Writing – original draft. YC: Writing – original draft, Data curation. ShuoC: Writing – original draft, Data curation. WC: Data curation, Writing – original draft. YT: Formal Analysis, Writing – original draft.
Funding
The author(s) declare that financial support was received for the research and/or publication of this article. This work was funded by Fujian Provincial Science and Technology Department Guided Project(Grant number 2022Y0050), Fujian Provincial Natural Science Foundation General Project (Grant number 2023J011193) and Joint Funds for the innovation of science and Technology, Fujian province(Grant number 2024Y9040).
Conflict of interest
The authors declare that the research was conducted in the absence of any commercial or financial relationships that could be construed as a potential conflict of interest.
Generative AI statement
The authors declare that Generative AI was used in the creation of this manuscript. We employed Grammarly, exclusively for language polishing, to enhance the grammatical accuracy and readability of the manuscript.
Publisher’s note
All claims expressed in this article are solely those of the authors and do not necessarily represent those of their affiliated organizations, or those of the publisher, the editors and the reviewers. Any product that may be evaluated in this article, or claim that may be made by its manufacturer, is not guaranteed or endorsed by the publisher.
Supplementary material
The Supplementary Material for this article can be found online at: https://www.frontiersin.org/articles/10.3389/fonc.2025.1573735/full#supplementary-material
References
1. Ather S, Kadir T, and Gleeson F. Artificial intelligence and radiomics in pulmonary nodule management: current status and future applications. Clin Radiol. (2020) 75:13–9. doi: 10.1016/j.crad.2019.04.017
2. Naidich DP, Bankier AA, MacMahon H, Schaefer-Prokop CM, Pistolesi M, Goo JM, et al. Recommendations for the management of subsolid pulmonary nodules detected at CT: a statement from the Fleischner Society. Radiology. (2013) 266:304–17. doi: 10.1148/radiol.12120628
3. Qi W, Wang Z, and Zhang M. Segmentectomy and wedge resection are equivalent for the treatment of early-stage pulmonary carcinoid tumors: A retrospective cohort study. Sci Rep. (2024) 14:17742. doi: 10.1038/s41598-024-68695-y
4. Pedersen JH, Saghir Z, Wille MM, Thomsen LH, Skov BG, and Ashraf H. Ground-glass opacity lung nodules in the era of lung cancer CT screening: radiology, pathology, and clinical management. Oncol (Williston Park). (2016) 30:266–74.
5. Wan YL, Wu PW, Huang PC, Tsay PK, Pan KT, Trang NN, et al. The use of artificial intelligence in the differentiation of malignant and benign lung nodules on computed tomograms proven by surgical pathology. Cancers (Basel). (2020) 12:2211. doi: 10.3390/cancers12082211
6. Qi LL, Wu BT, Tang W, Zhou LN, Huang Y, Zhao SJ, et al. Long-term follow-up of persistent pulmonary pure ground-glass nodules with deep learning-assisted nodule segmentation. Eur Radiol. (2020) 30:744–55. doi: 10.1007/s00330-019-06344-z
7. Wan YL, Wu PW, Huang PC, Tsay PK, Pan KT, Trang NN, et al. The use of artificial intelligence in the differentiation of malignant and benign lung nodules on computed tomograms proven by surgical pathology. Cancers (Basel). (2020) 12:2211. doi: 10.3390/cancers12082211
8. Pan Z, Hu G, Zhu Z, Tan W, Han W, Zhou Z, et al. Predicting invasiveness of lung adenocarcinoma at chest CT with deep learning ternary classification models. Radiology. (2024) 311:e232057. doi: 10.1148/radiol.232057
9. Liang X, Zhang C, and Ye X. Overdiagnosis and overtreatment of ground-glass nodule-like lung cancer. Asia Pac J Clin Oncol. (2024). doi: 10.1111/ajco.14042
10. Fu CL, Yang ZB, Li P, Shan KF, Wu MK, Xu JP, et al. Discrimination of ground-glass nodular lung adenocarcinoma pathological subtypes via transfer learning: A multicenter study. Cancer Med. (2023) 12:18460–9. doi: 10.1002/cam4.v12.18
11. Yotsukura M, Asamura H, Motoi N, Kashima J, Yoshida Y, Nakagawa K, et al. Long-term prognosis of patients with resected adenocarcinoma in situ and minimally invasive adenocarcinoma of the lung. J Thorac Oncol. (2021) 16:1312–20. doi: 10.1016/j.jtho.2021.04.007
12. Cheng Y and Song Z. The identification of hub genes associated with pure ground glass nodules using weighted gene co-expression network analysis. BMC Pulm Med. (2024) 24:275. doi: 10.1186/s12890-024-03072-z
13. Tao XM, Fang R, Wu CC, Zhang C, Zhang RG, Yu PX, et al. Prediction of pathological subtypes of lung adenocarcinoma with pure ground glass nodules by deep learning model. Zhongguo Yi Xue Ke Xue Yuan Xue Bao. (2020) 42:477–84. doi: 10.3881/j.issn.1000-503X.11693
14. Luo W, Ren Y, Liu Y, Deng J, and Huang X. Imaging diagnostics of pulmonary ground-glass nodules: a narrative review with current status and future directions. Quant Imaging Med Surg. (2024) 14:6123–46. doi: 10.21037/qims-24-674
15. Pinsky P. Artificial intelligence and data mining to assess lung cancer risk: challenges and opportunities. Ann Intern Med. (2020) 173:760–1. doi: 10.7326/M20-5673
16. Jiang L, Zhou Y, Miao W, et al. Artificial intelligence-assisted quantitative CT parameters in predicting the degree of risk of solitary pulmonary nodules. Ann Med. (2024) 56(1):2405075. doi: doi.10.1080/07853890.2024.2405075
17. Fang W, Zhang G, Yu Y, Chen H, and Liu H. Identification of pathological subtypes of early lung adenocarcinoma based on artificial intelligence parameters and CT signs. Biosci Rep. (2022) 42:BSR20212416. doi: 10.1042/BSR20212416
18. Huang P, Park S, Yan R, Lee J, Chu LC, Lin CT, et al. Added value of computer-aided CT image features for early lung cancer diagnosis with small pulmonary nodules: A matched case-control study. Radiology. (2018) 286:286–95. doi: 10.1148/radiol.2017162725
19. Massion PP, Antic S, Ather S, Arteta C, Brabec J, Chen H, et al. Assessing the accuracy of a deep learning method to risk stratify indeterminate pulmonary nodules. Am J Respir Crit Care Med. (2020) 202:241–9. doi: 10.1164/rccm.201903-0505OC
20. Baldwin DR, Gustafson J, Pickup L, Arteta C, Novotny P, Declerck J, et al. External validation of a convolutional neural network artificial intelligence tool to predict Malignancy in pulmonary nodules. Thorax. (2020) 75:306–12. doi: 10.1136/thoraxjnl-2019-214104
21. Wang C, Shao J, Xu X, Yi L, Wang G, Bai C, et al. DeepLN: A multi-task AI tool to predict the imaging characteristics, Malignancy and pathological subtypes in CT-detected pulmonary nodules. Front Oncol. (2022) 12:683792. doi: 10.3389/fonc.2022.683792
22. Yang Y, Zhang L, Wang H, Zhao J, Liu J, Chen Y, et al. Development and validation of a risk prediction model for invasiveness of pure ground-glass nodules based on a systematic review and meta-analysis. BMC Med Imaging. (2024) 24:149. doi: 10.1186/s12880-024-01313-5
23. Jin X, Zhao SH, Gao J, Wang DJ, Wu J, Wu CC, et al. CT characteristics and pathological implications of early stage (T1N0M0) lung adenocarcinoma with pure ground-glass opacity. Eur Radiol. (2015) 25:2532–40. doi: 10.1007/s00330-015-3637-z
24. Chu ZG, Li WJ, Fu BJ, and Lv FJ. CT characteristics for predicting invasiveness in pulmonary pure ground-glass nodules. AJR Am J Roentgenol. (2020) 215:351–8. doi: 10.2214/AJR.19.22381
25. Hu F, Huang H, Jiang Y, Feng M, Wang H, Tang M, et al. Discriminating invasive adenocarcinoma among lung pure ground-glass nodules: a multi-parameter prediction model. J Thorac Dis. (2021) 13:5383–94. doi: 10.21037/jtd-21-786
26. Liu M, Li M, Feng H, Jiang X, Zheng R, Zhang X, et al. Risk assessment of persistent incidental pulmonary subsolid nodules to guide appropriate surveillance interval and endpoints. Pulmonology. (2025) 31:2423541. doi: 10.1080/25310429.2024.2423541
27. Ye T, Wu H, Wang S, Li Q, Gu Y, Ma J, et al. Radiologic identification of pathologic tumor invasion in patients with lung adenocarcinoma. JAMA Netw Open. (2023) 6:e2337889. doi: 10.1001/jamanetworkopen.2023.37889
28. Chang GC, Chiu CH, Yu CJ, Chang YC, Chang YH, Hsu KH, et al. Low-dose CT screening among never-smokers with or without a family history of lung cancer in Taiwan: a prospective cohort study. Lancet Respir Med. (2024) 12:141–52. doi: 10.1016/S2213-2600(23)00338-7
29. Song YS, Park CM, Park SJ, Lee SM, Jeon YK, and Goo JM. Volume and mass doubling times of persistent pulmonary subsolid nodules detected in patients without known Malignancy. Radiology. (2014) 273:276–84. doi: 10.1148/radiol.14132324
30. de Hoop B, Gietema H, van de Vorst S, Murphy K, van Klaveren RJ, and Prokop M. Pulmonary ground-glass nodules: increase in mass as an early indicator of growth. Radiology. (2010) 255:199–206. doi: 10.1148/radiol.09090571
Keywords: lung, pure ground-glass nodule, identification, nomogram, CT, AI, quantitative parameters, benignity
Citation: Chen S, Zhang H, Chen Y, Chen S, Cao W and Tong Y (2025) Differentiation of early-stage tumors from benign lesions manifesting as pure ground-glass nodule: a clinical prediction study based on AI-derived quantitative parameters. Front. Oncol. 15:1573735. doi: 10.3389/fonc.2025.1573735
Received: 09 February 2025; Accepted: 21 April 2025;
Published: 19 May 2025.
Edited by:
Simona Manole, University of Medicine and Pharmacy Iuliu Hatieganu, RomaniaReviewed by:
Milind Ratnaparkhe, ICAR Indian Institute of Soybean Research, IndiaArvind Mukundan, National Chung Cheng University, Taiwan
Copyright © 2025 Chen, Zhang, Chen, Chen, Cao and Tong. This is an open-access article distributed under the terms of the Creative Commons Attribution License (CC BY). The use, distribution or reproduction in other forums is permitted, provided the original author(s) and the copyright owner(s) are credited and that the original publication in this journal is cited, in accordance with accepted academic practice. No use, distribution or reproduction is permitted which does not comply with these terms.
*Correspondence: Shuxiang Chen, NTI3MzM2MTAwQHFxLmNvbQ==