 Li Hua1
 Mengxiao Liu
 Jun Liu
 Qing Yang
- 1Department of Laboratory Medicine, Anhui Medical University Anqing Medical Center, Anqing Municipal Hospital, Anqing, China
- 2Department of Medical Imaging, Anhui Medical University Anqing Medical Center, Anqing Municipal Hospital, Anqing, China
- 3Magnetic Resonance (MR) Search & Marketing Department, Siemens Healthineers Co., Ltd, Shanghai, China
- 4Department of Radiology, The First Hospital of Lanzhou University, Lanzhou, Gansu, China
Objective: This study aims to investigate the application value of fractional-order calculus (FROC) and continuous-time random-walk (CTRW) derived multiple parameters in distinguishing benign and malignant head and neck lesions and compare their performance with conventional diffusion-weighted imaging (DWI).
Methods: A retrospective analysis was conducted on 70 pathologically confirmed cases, including 23 benign lesions (BL) and 47 malignant lesions (ML). ML was further classified into lymphoma subgroups (LS, 11 cases, 15 lesions) and malignant lesions subgroups excluding lymphoma (MLS, 36 cases). DWI scans with 12 b-values were performed before treatment, and seven diffusion parameters—ADC, DFROC, βFROC, μFROC, DCTRW, αCTRW, and βCTRW—were extracted from conventional DWI, FROC, and CTRW diffusion models. Independent t-tests or U-tests were used to compare parameter differences among BL, ML, LS, and MLS. Diagnostic performance was evaluated using receiver operating characteristic (ROC) curves, with area under the curve (AUC) compared via DeLong analysis. Pearson correlation analysis was conducted to explore relationships between diffusion parameters and Ki-67 expression in the MLS group.
Results: ADC, DFROC, μFROC, DCTRW, and αCTRW showed significant differences between all groups, αCTRW demonstrated the highest diagnostic performance (AUC). Significant correlations were found between Ki-67 expression and DFROC (r = -0.367, p = 0.028), DCTRW (r = -0.376, p = 0.024), αCTRW (r = -0.418, p = 0.011), and βCTRW (r = 0.525, p = 0.001).
Conclusion: Multiple diffusion parameters derived from FROC and CTRW models effectively differentiate between benign and malignant head and neck lesions, reflecting tumor heterogeneity. Among them, αCTRW showed the best diagnostic performance, making it a promising non-invasive imaging biomarker for quantitative assessment and differential diagnosis of head and neck tumors, thereby improving diagnostic accuracy.
Introduction
Head and neck tumors, both benign and malignant, represent a diverse group of pathological entities. Accurate preoperative differentiation is vital for guiding individualized treatment strategies (1). Imaging serves as a cornerstone in the assessment of head and neck tumors, with computed tomography (CT) and magnetic resonance imaging (MRI) being the most frequently employed non-invasive modalities. CT, owing to its high spatial resolution, provides excellent visualization of anatomical structures and is particularly advantageous for evaluating bone involvement. However, its relatively poor soft-tissue contrast limits its capacity to fully characterize tumor composition. Recent advancements, including hyperspectral imaging and computer-aided diagnosis, have enhanced soft-tissue differentiation by enabling material decomposition and virtual monoenergetic imaging, offering improved accuracy in the quantitative analysis of iodine concentration (2). Nevertheless, the use of ionizing radiation in CT poses concerns, especially for patients requiring serial follow-up, thereby limiting its routine clinical use. In contrast, MRI offers superior soft-tissue contrast and provides valuable information regarding tumor localization and invasion of adjacent structures. Despite these advantages, MRI interpretation remains highly dependent on radiologist expertise and lacks standardized quantitative diagnostic criteria (3).
The conventional apparent diffusion coefficient (ADC), which quantitatively evaluates the microstructure of tumor tissues (4), has been widely used to differentiate between benign and malignant head and neck lesions (5, 6). This model assumes that the diffusion of water molecules occurs in a homogeneous environment. However, in tumor tissues with high structural heterogeneity, where simple ADC values are unable to adequately describe the tissue heterogeneity (7). Given the heterogeneity of biological tissues, especially tumors that exhibit a high degree of structural heterogeneity and complexity, it is widely accepted that water molecule diffusion in such tissues does not follow a Gaussian distribution (8). While some studies have reported significant differences between benign and malignant groups (9), others show considerable overlap between different types of tumors (10).
To address these limitations, non-Gaussian diffusion models have been developed to better capture tissue microstructure and heterogeneity. The fractional order calculus (FROC) model, based on the Bloch-Torrey equation (11), generates three parameters that describe the complex diffusion process in heterogeneous tumor tissues: diffusion coefficient (DFROC, μm²/ms), spatial fractional order derivative (βFROC), and spatial parameter (μFROC, μm). These parameters provide insights into diffusion dynamics (DFROC), structural complexity (βFROC), and the diffusion environment (μFROC). Similarly, the continuous-time random walk (CTRW) is another interesting model (12) that provides two parameters related to intra-voxel tissue structural heterogeneity: temporal diffusion heterogeneity (aCTRW) and spatial diffusion heterogeneity (βCTRW), thus providing a method for studying changes in tumor structure. Additionally, the derived parameter, DCTRW (μm²/ms), is similar to ADC, measures abnormal diffusion processes, and is sensitive to tissue cellularity.
Previous studies have demonstrated the value of the FROC and CTRW models in differentiating lesions of the nervous system, breast, prostate, and bladder (11–22). However, no study to date has delved into the application of high spatial resolution FROC and CTRW diffusion in the differentiation of head and neck tumors. Therefore, the purpose of this study was to evaluate the value of these two non-Gaussian models for the differentiation of head and neck tumors and analyze the relationship between each diffusion parameter and Ki-67 expression in squamous cell carcinoma.
Materials and methods
Patients
This retrospective study, approved by our hospital’s medical ethics committee, was designed with a waived consent process due to its retrospective nature. From January 2022 to July 2024, 70 patients with pathologically confirmed head and neck tumors were retrospectively analyzed. The inclusion criteria were as follows: (1) MRI scans performed before or within three days of biopsy without receiving relevant treatment, and without a history of head and neck cancer; (2) All patients were diagnosed by tissue biopsy or postoperative pathology and tested for Ki-67 marker expression; (3) scans included multi-b-value diffusion sequences; (4) The minimum short diameter of the lesion is > 1 cm. The exclusion criteria were defined as follows: (1) inflammatory lesions or lipomas; (2) underwent radiotherapy or chemotherapy before MRI scan; (3) severe image artifacts or small lesions caused difficulties in delineating the region of interest (ROI); (4) Excessive areas of necrosis, hemorrhage, or cystic degeneration are present within the lesion.
Immunohistochemical assessment of Ki-67 expression was performed as follows. Tissue specimens were fixed in 10% neutral buffered formalin for 18–36 hours, followed by dehydration and paraffin embedding. Two consecutive 3-μm-thick sections were cut from each paraffin block. One section was subjected to hematoxylin and eosin staining for histopathological classification and tumor grading. The other section underwent immunohistochemical staining for Ki-67. After dewaxing and rehydration, antigen retrieval was performed using ethylenediaminetetraacetic acid buffer. The sections were then incubated with the primary antibody at room temperature for 60 minutes, followed by incubation with the secondary antibody for 20 minutes. Diaminobenzidine was used for chromogenic detection, and the sections were subsequently counterstained with hematoxylin, blued, dehydrated through graded alcohols, cleared in xylene, and mounted with a coverslip. For quantification, five randomly selected high-power fields (×400) were examined. Tumor cells with brownish-yellow nuclear staining were considered Ki-67 positive. In each field, 200 tumor cells were counted, and the proportion of positively stained cells was calculated. The average of the five fields was used to determine the Ki-67 labeling index, expressed as: Ki-67 labeling index (%) = (number of positively stained cells/total number of tumor cells) × 100%.
MR acquisitions
MR imaging protocol
All MR examinations were performed using a 3.0T whole-body scanner (MAGNETOM Vida, Siemens Healthcare, Erlangen, Germany) equipped with a 20-channel head and neck phased-array coil.
The routine imaging protocol included the following sequences:
1. Coronal T2-weighted imaging with fat saturation (T2WI-FS): repetition time (TR) = 4110 ms; echo time (TE) = 94 ms; field of view (FOV) = 28cm × 28cm; slice thickness = 4 mm; inter-slice gap = 1 mm; matrix size = 320 × 224; number of excitations (NEX) = 2; bandwidth = 401 Hz; echo spacing = 9.42 ms.
2. Axial T1-weighted imaging (T1WI): TR = 468 ms; TE = 6.5 ms; FOV = 22cm × 22cm; slice thickness = 4 mm; inter-slice gap = 1 mm; matrix = 320 × 224; NEX = 3; bandwidth = 391 Hz; echo spacing = 6.53 ms.
3. Axial T2-weighted imaging with fat saturation (T2WI-FS): TR = 4170 ms; TE = 96 ms; FOV = 22cm × 22cm; slice thickness = 4 mm; inter-slice gap = 1 mm; matrix = 320 × 224; NEX = 2; bandwidth = 381 Hz; echo spacing = 9.56 ms.
4. Diffusion-weighted imaging (DWI) was performed using a readout-segmented echo-planar imaging sequence (RESOLVE) with 12 b-values (0, 10, 20, 50, 100, 200, 400, 800, 1000, 1500, 2000, and 3000 s/mm²), with a single excitation for each b-value. Imaging parameters were as follows: TR = 5200 ms; TE = 70 ms; slice thickness = 4 mm; inter-slice gap = 20% of slice thickness; FOV = 22cm × 22cm; partial Fourier = 6/8; number of slices = 22; diffusion mode = 3-scan trace; readout segments = 5; bandwidth = 930 Hz; echo spacing = 0.36 ms; acquisition time = 11 min 49 s.
Finally, contrast-enhanced axial, coronal, and sagittal T1-weighted images were obtained after intravenous injection of 0.1 mmol/kg of gadolinium-DTPA (Gd-DTPA) via the median cubital vein at a rate of 2 mL/s, followed by a 20 mL saline flush.
Imaging analysis
The conventional DWI, FROC, and CTRW diffusion images were processed using the Body DiffusionLab (BoDilab, Chengdu ZhongYing Medical Technology Co., Ltd., Chengdu,CN) software in the MR workstation.
For conventional DWI, the quantitative parameter ADC was generated by fitting a mono-exponential model (Equation 1):
The FROC model is given by Equation 2:
where S0 is the signal intensity without diffusion weighting, Gd is the diffusion gradient amplitude, δ is the diffusion gradient pulse width and Δ is the gradient interval. The β (dimensionless; 0 < β ≤ 1) parameter is the intra-voxel diffusion heterogeneity parameter, and μ (unit: μm) is a spatial constant to maintain the unit of diffusion coefficient D (unit: μm2/ms). The multi-b-value diffusion images were fitted pixelwise to the FROC diffusion model using the Levenberg-Marquardt nonlinear fitting algorithm, in which D (reflecting the intrinsic diffusion coefficient) was estimated using a mono-exponential model and data were acquired at lower b-values (≤ 1000 s/mm2). After determining the DFROC, β and μ were obtained by performing pixel-wise nonlinear fitting using all b-values.
The CTRW model was fitted using Equation 3:
where D is the anomalous diffusion coefficient, α and β are parameters related to temporal and spatial diffusion heterogeneity, respectively, and Eα is the Mittag-Leffler function. DCTRW was first estimated through the nonlinear fitting of diffusion images with b-values less than 1000 ms/mm2, then α and β were determined simultaneously from all diffusion-weighted images (b-values = 0–3000 s/mm2).
Two observers with 5 and 15 years of experience in diagnosing head and neck tumor diagnosis independently evaluated all parameters in a double-blind manner, transcending potential bias. Using dynamic contrast-enhanced or T2WI images as reference, the DWI images with the best lesion signal intensity contrast were selected to manually delineate the ROIs, while avoiding necrotic areas, air, major blood vessels, and adjacent anatomical structures. The software automatically transferred the delineated ROIs to the parameter maps and obtained the calculation results. The mean values of the two observers’ measurements were taken as final values for all parameters and the interclass correlation coefficients between the two observers were calculated. The same observer repeated the measurements after one week to calculate the intraclass correlation coefficients.
Statistical analysis
Quantitative parameters were tested for normality and parameters were expressed as mean ± standard deviation ( ± S). SPSS v.23.0 (IBM Corp, Armonk, NY), GraphPad Prism v.8.0 (GraphPad Software, San Diego, CA), and MedCalv.15.11.4 (MedCalc Software, Mariakerke, Belgium) was used for data analysis. Differences in the parameters between each group were analyzed by independent samples t-tests or U-tests. Receiver operating characteristic (ROC) curves were employed to analyze the diagnostic performance of each parameter in predicting benign and malignant lesions. The DeLong test was performed to compare the area under the curve (AUC) between the two groups. The relationship between each diffusion parameter and Ki-67 in the MLS group was analyzed by Pearson’s correlation analysis. Inter-observer agreement was defined by the intraclass and interclass correlation coefficients within the 95% confidence interval. Two-tailed P ≤ 0.05 indicates the difference was statistically significant.
Results
1. Lesion Grouping: Among the 70 patients with head and neck tumors finally enrolled in the study, 23 had benign lesions (BL), including 11 cases of pleomorphic adenomas, 2 cases of hemangiomas, 2 cases of inverted papillomas, 2 cases of nasal polyps, 3 cases of lymphoid hyperplasia, 1 case of basal cell adenoma and 2 cases of schwannomas; 47 patients had malignant lesions (ML), ML was further divided into the lymphoma subgroup (LS) (11 cases of lymphomas with 15 lesions) and malignant lesion subgroup excluding lymphoma (MLS) (36 cases of squamous cell carcinoma). The patient enrollment process is shown in Figure 1; patient clinical information is presented in Table 1; examples of multi-parameter imaging and measurements of the lesions are shown in Figure 2 and 3.
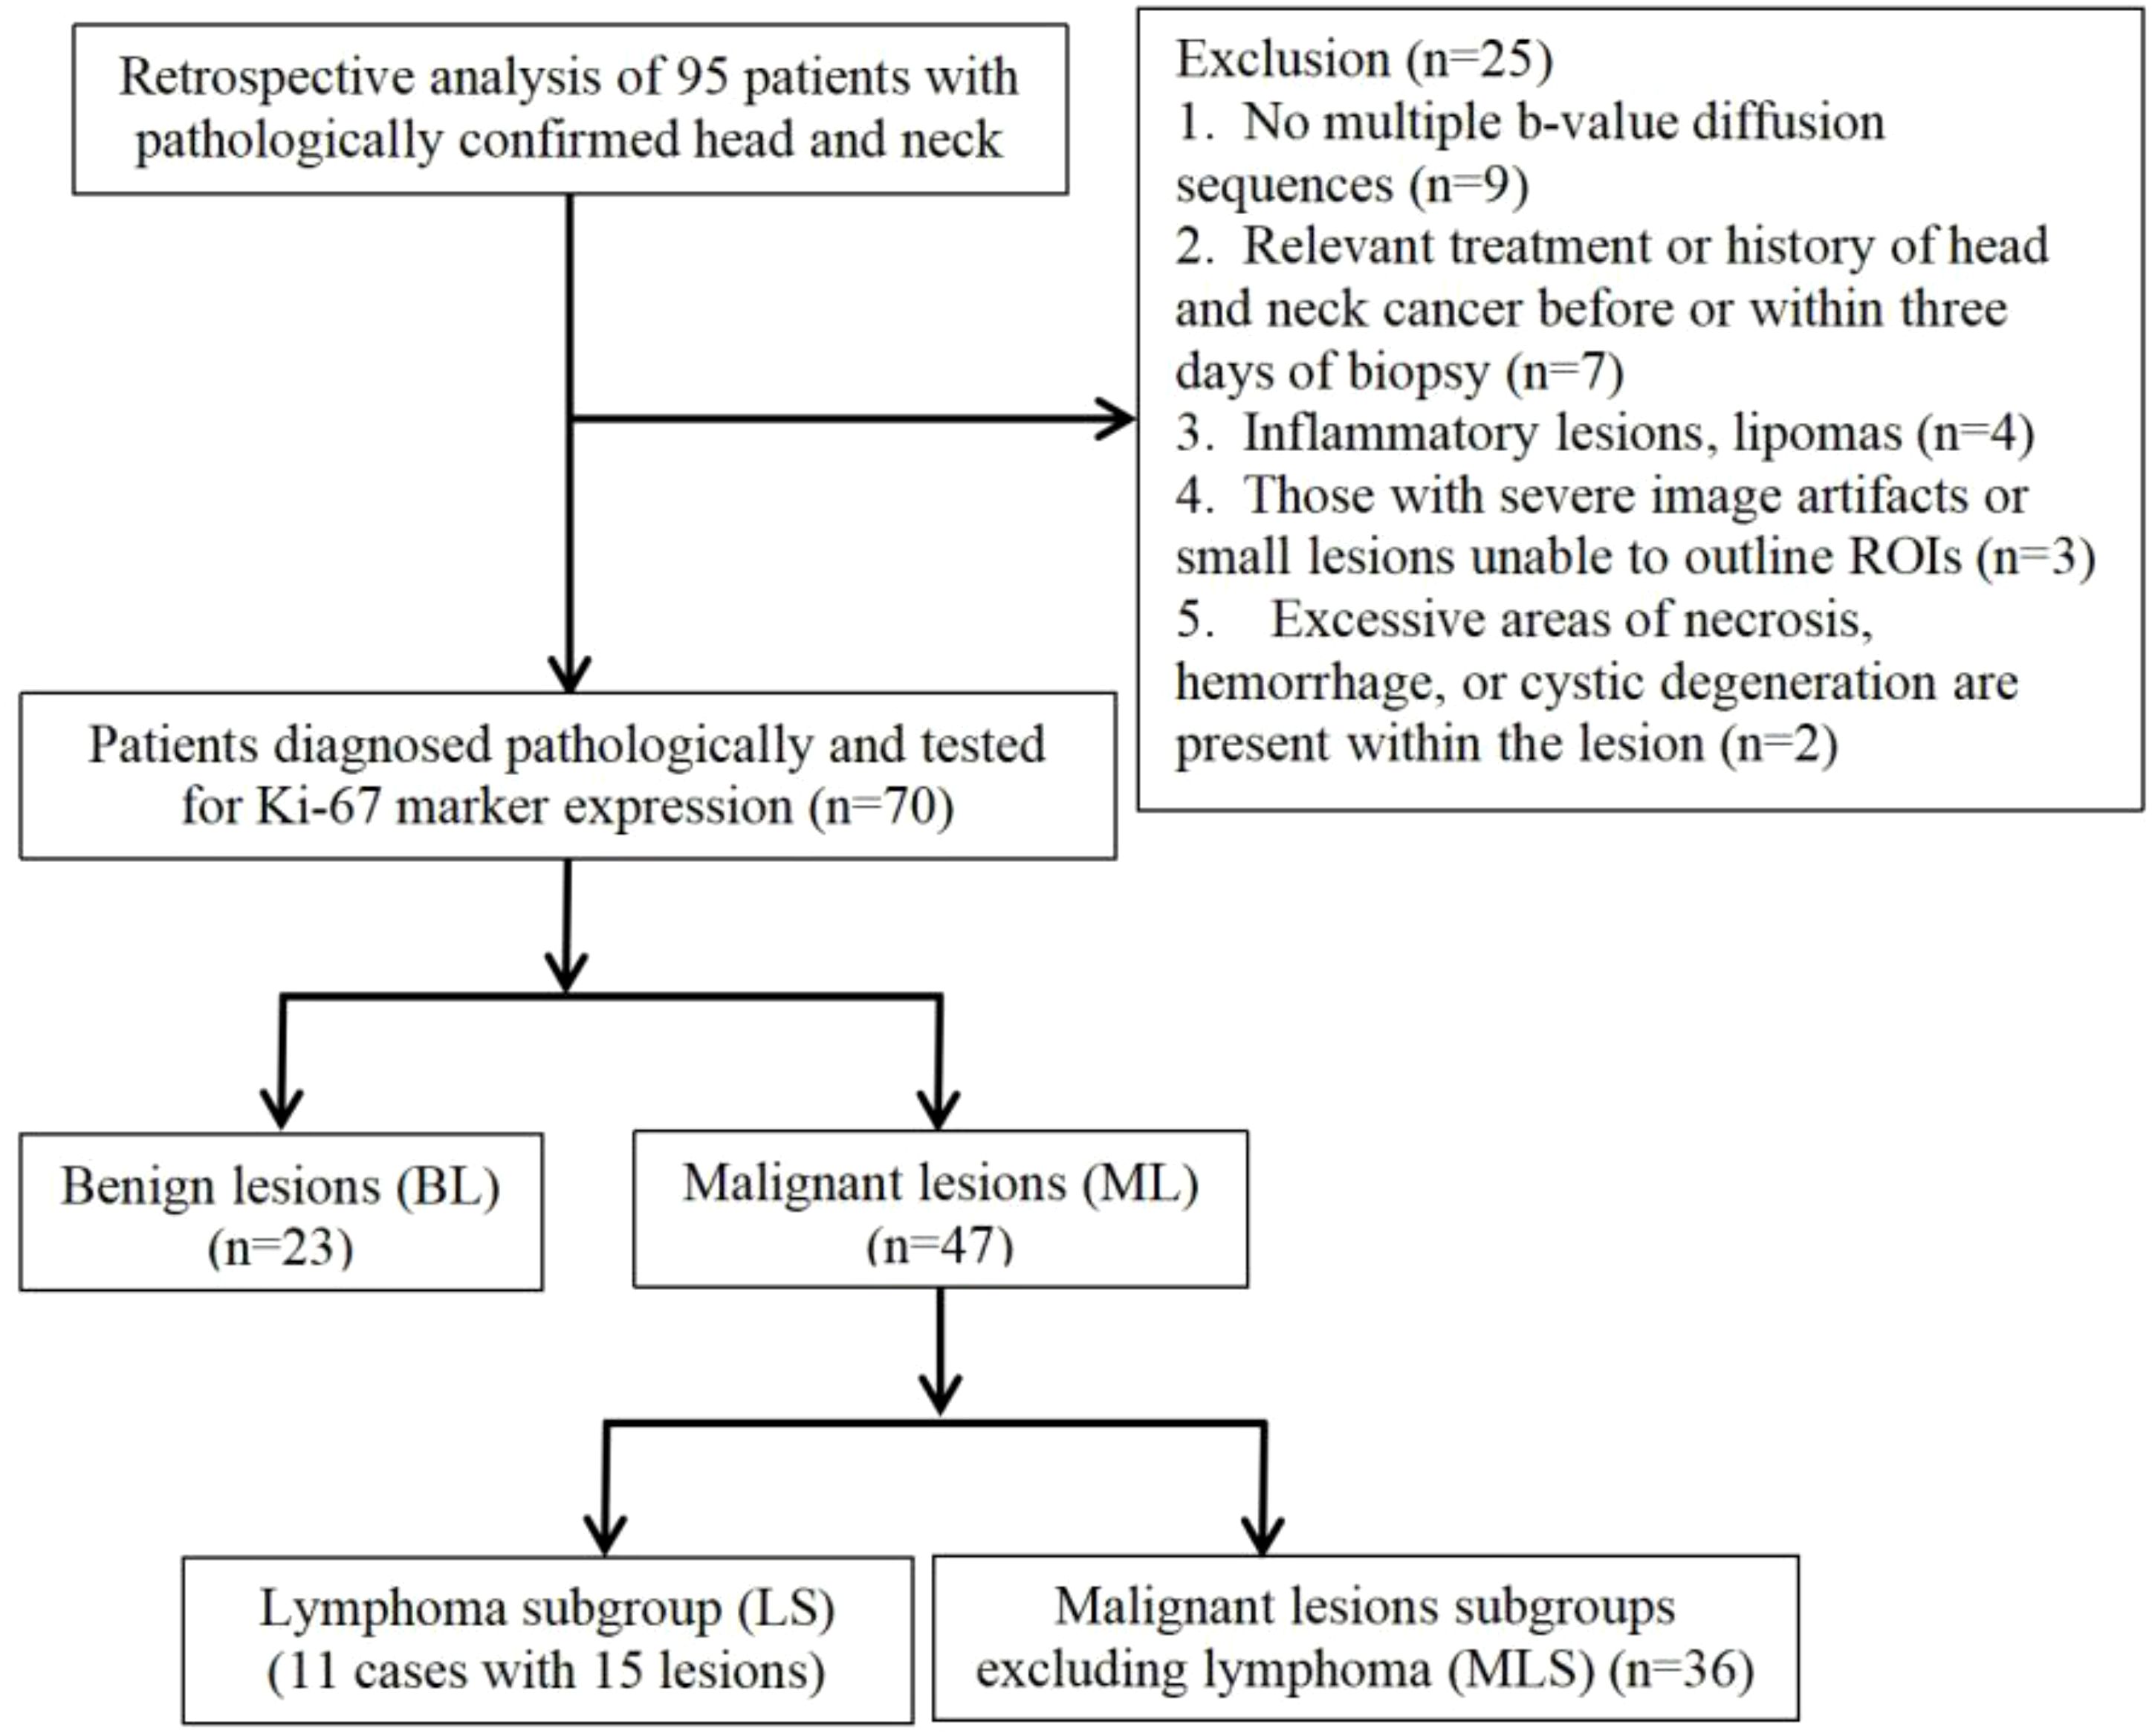
Figure 1. Flowchart of enrolled cases.
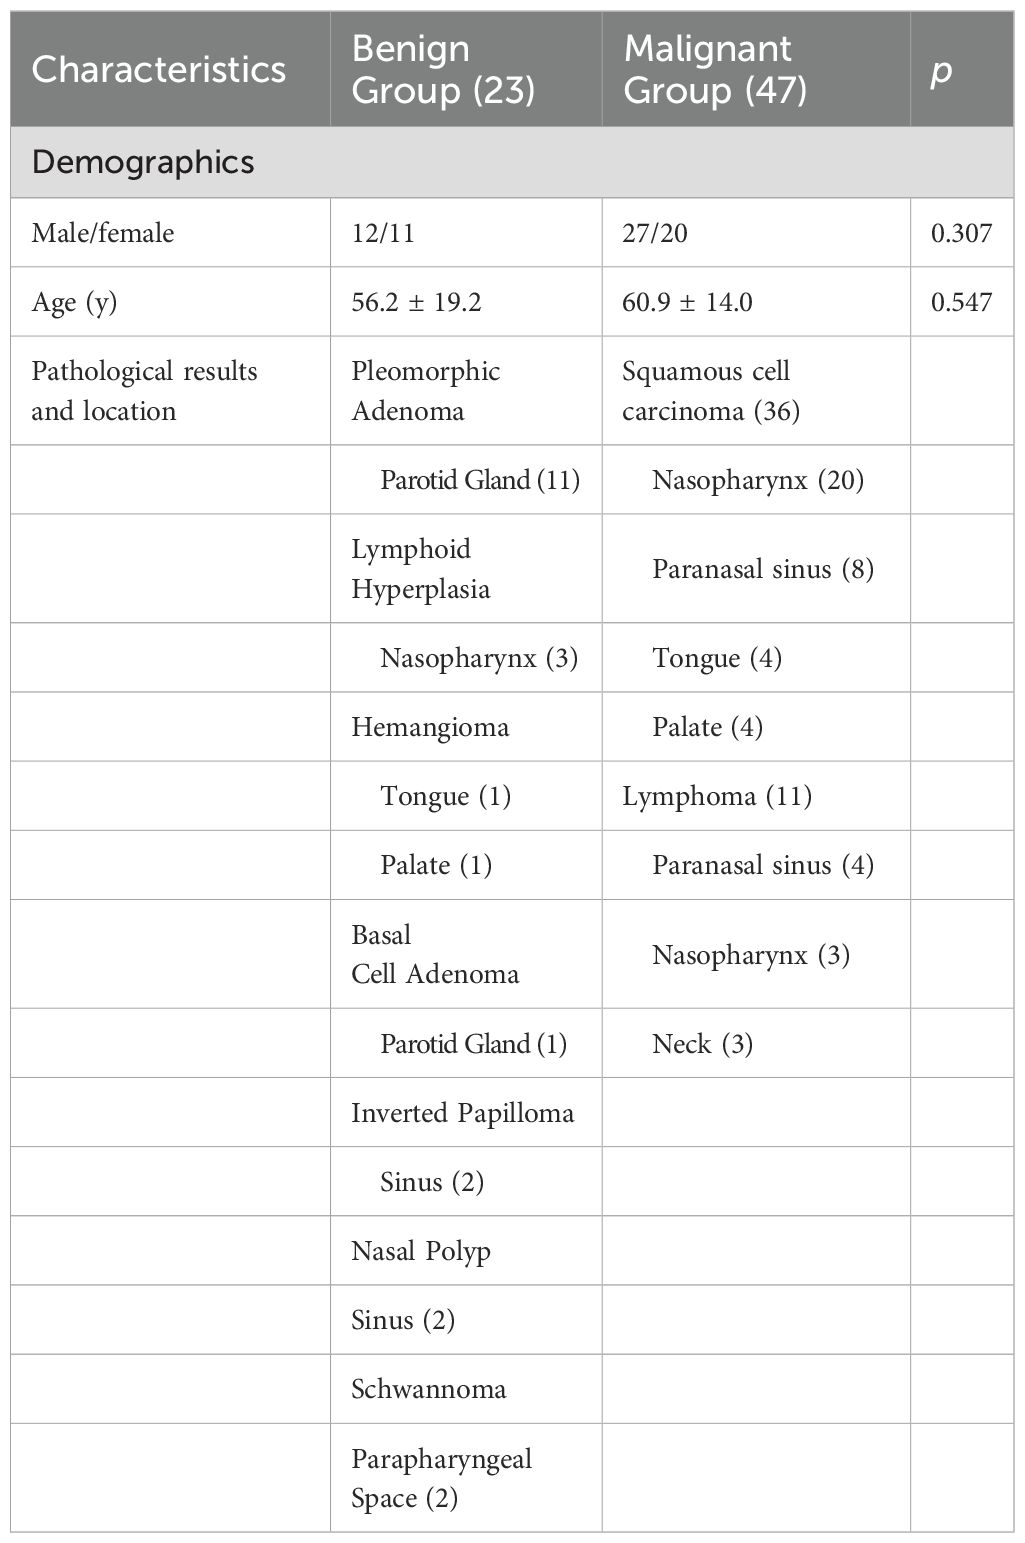
Table 1. Patient and pathological characteristics of benign and malignant lesions.
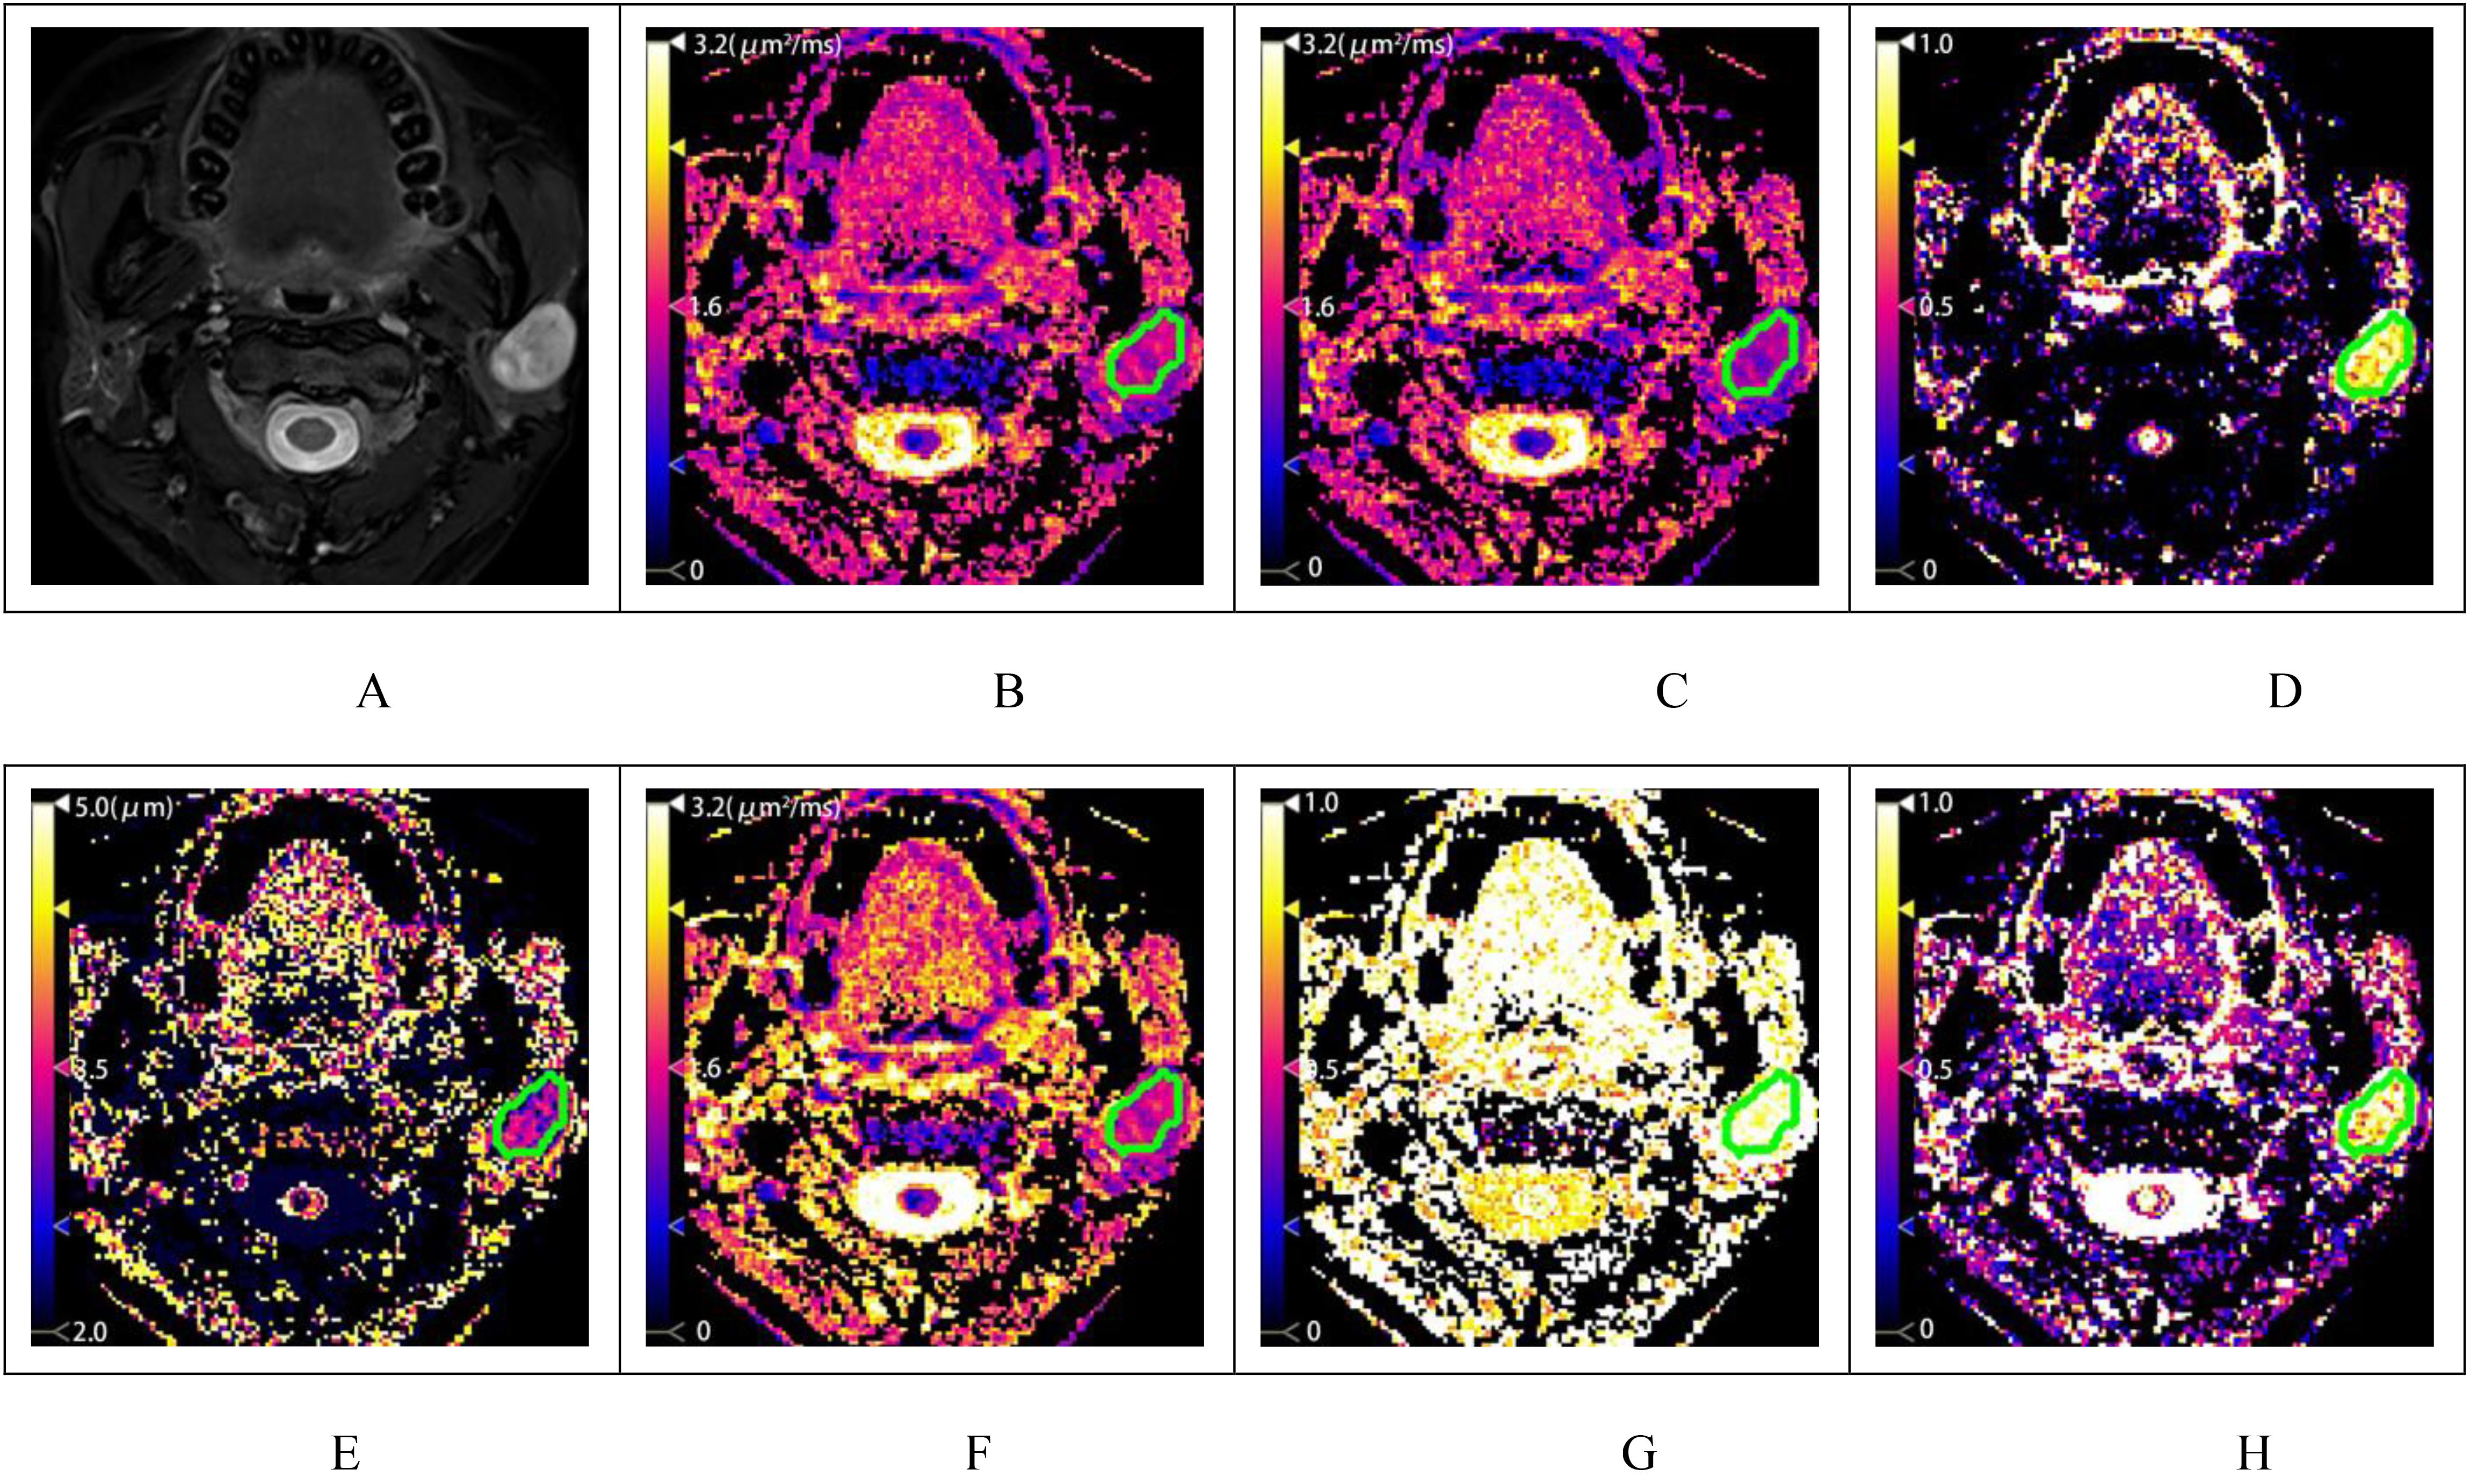
Figure 2. A patient with pleomorphic adenoma of the left parotid gland. (A) shows the T2-weighted fat-saturation image, and (B–H) display the diffusion-weighted image (DWI), fractional anisotropy (FROC), and color maps of the CTRW model parameters, respectively. The measured values are as follows: ADC=1.510μm2/ms (2B), DFROC=1.203μm2/ms (C), βFROC=0.888 (D), μFROC=3.021μm (E), DCTRW=1.412μm2/ms (F), αCTRW=0.971 (G) and βCTRW=0.891 (H).
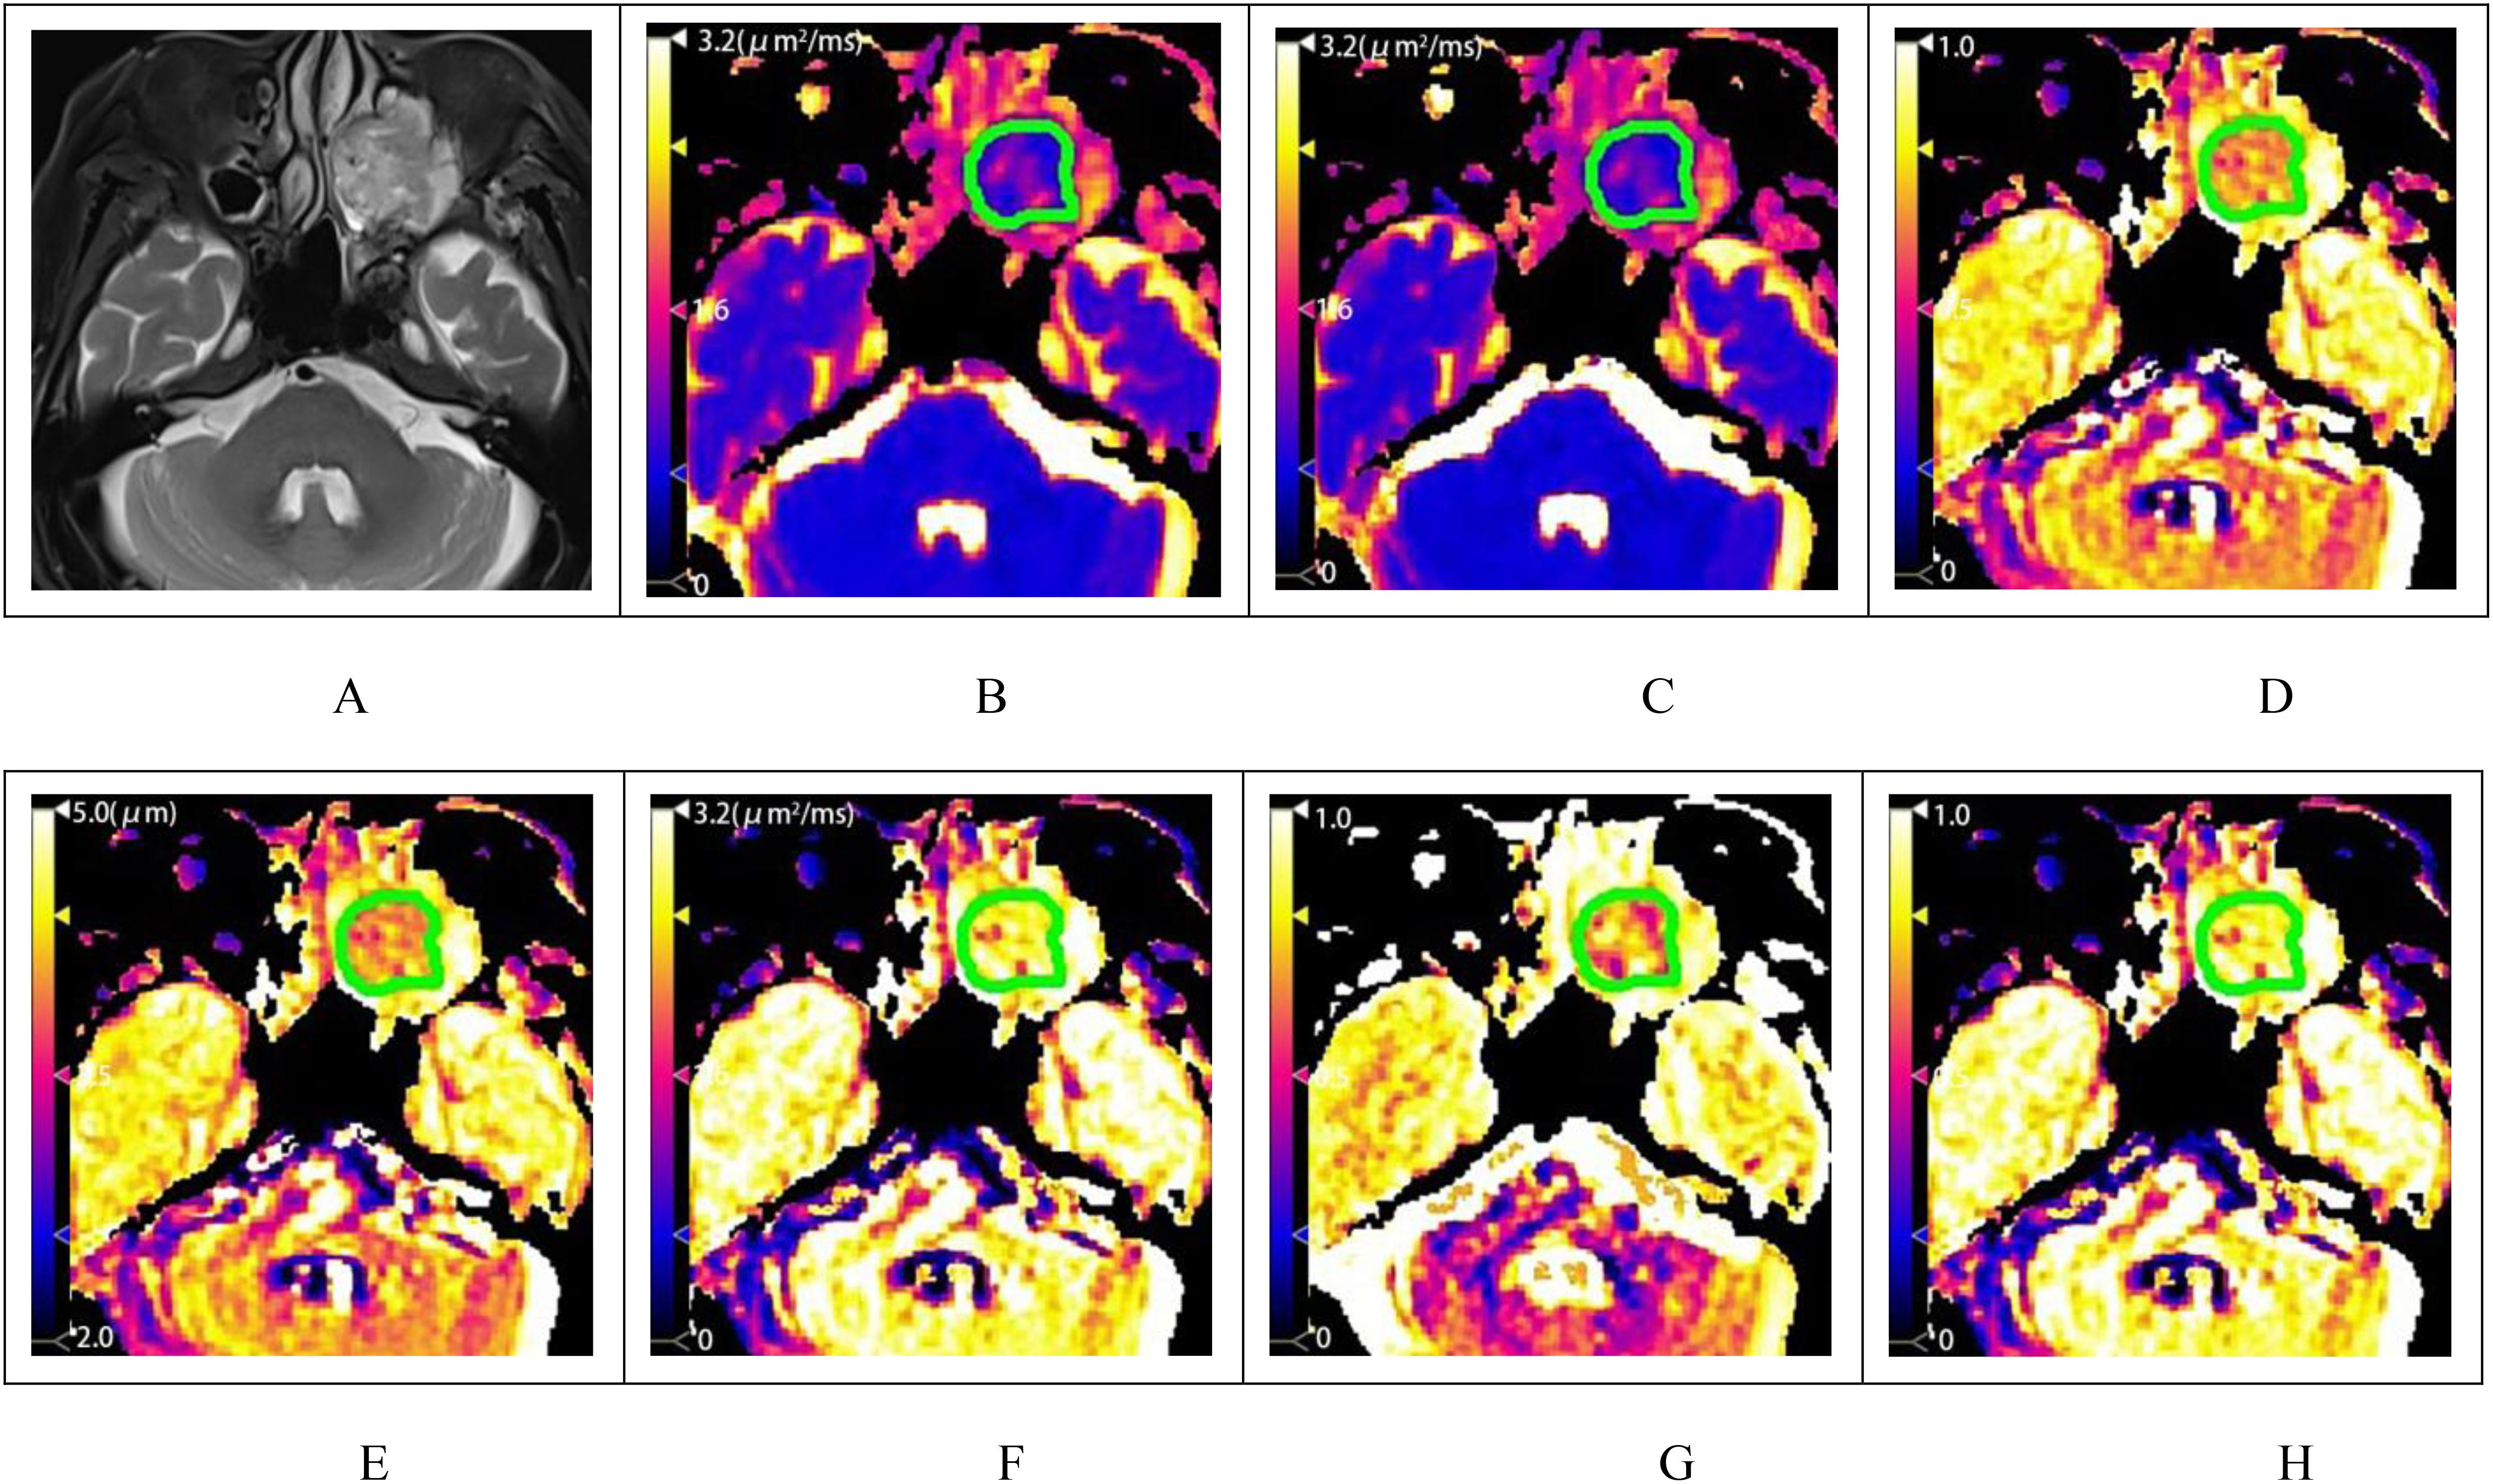
Figure 3. A patient with squamous cell carcinoma of the left maxillary sinus. (A) shows the T2-weighted fat-saturation image, and (B–H) display the pseudo-color maps of DWI, FROC, and CTRW model parameters, respectively. The measured values are as follows: ADC=0.963μm2/ms (B), DFROC=0.903μm2/ms (C), βFROC=0.780 (D), μFROC=3.505μm (E), DCTRW=1.219μm2/ms (F), αCTRW=0.795 (G) and βCTRW=0.875 (3H).
2. Inter-observer agreement of parameters: The interclass correlation coefficients (95% CI) of the quantitative parameters DFROC, βFROC, μFROC, DCTRW, αCTRW, and βCTRW for inter-observer reproducibility ranged from 0.801 to 0.950, while the intraclass correlation coefficients (95% CI) for intra-observer reproducibility ranged from 0.885 to 0.959. These results indicate that the parameters had good inter- and intra-observer reproducibility and consistency (Table 2).
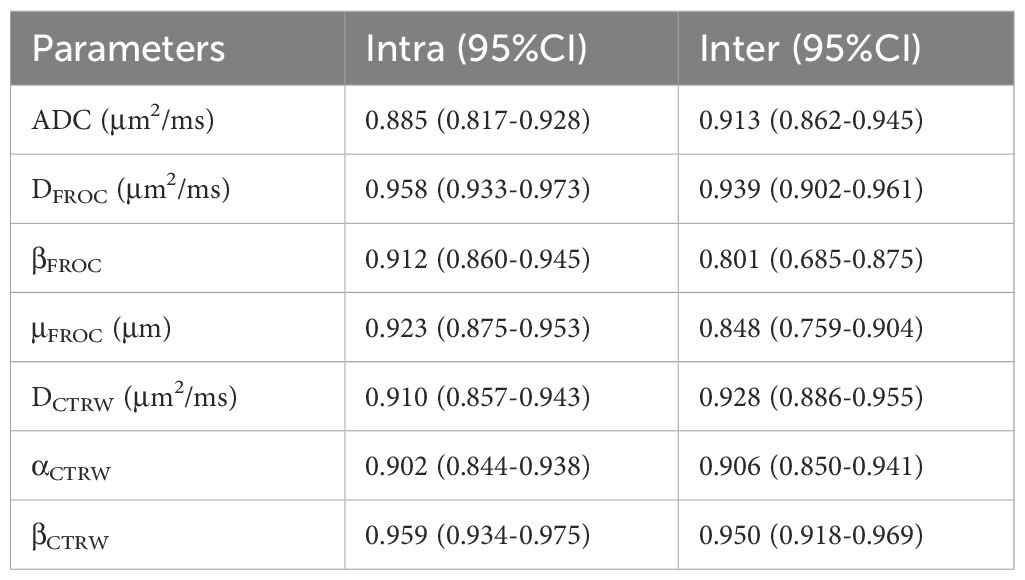
Table 2. Reproducibility of DWI parameters.
3. Parameter Differences between Groups: Among the BL, ML, LS, and MLS groups, all differences were statistically significant for ADC, DFROC, μFROC, DCTRW, and αCTRW. The differences in βFROC were statistically significant for BL vs. ML, BL vs. LS, and BL vs. MLS; whereas the differences in βCTRW were not statistically significant between the groups (Tables 3, 4, Figure 4).

Table 3. Differences in parameters between benign and malignant head and neck lesions.
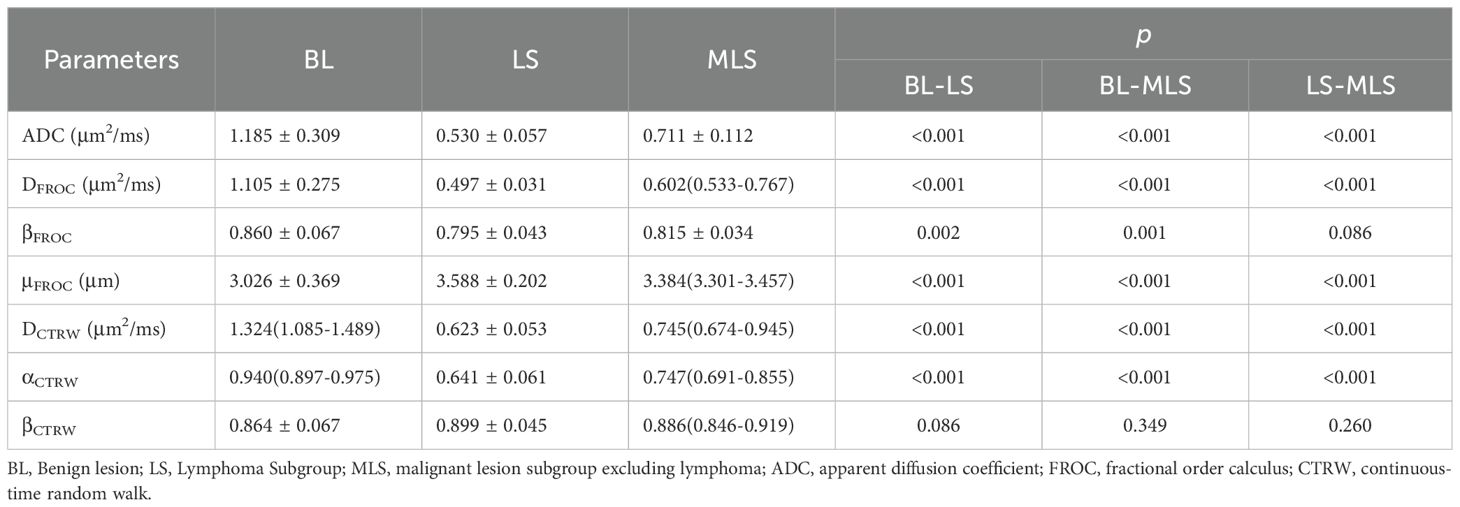
Table 4. Difference in each parameter between benign and malignant subgroups.
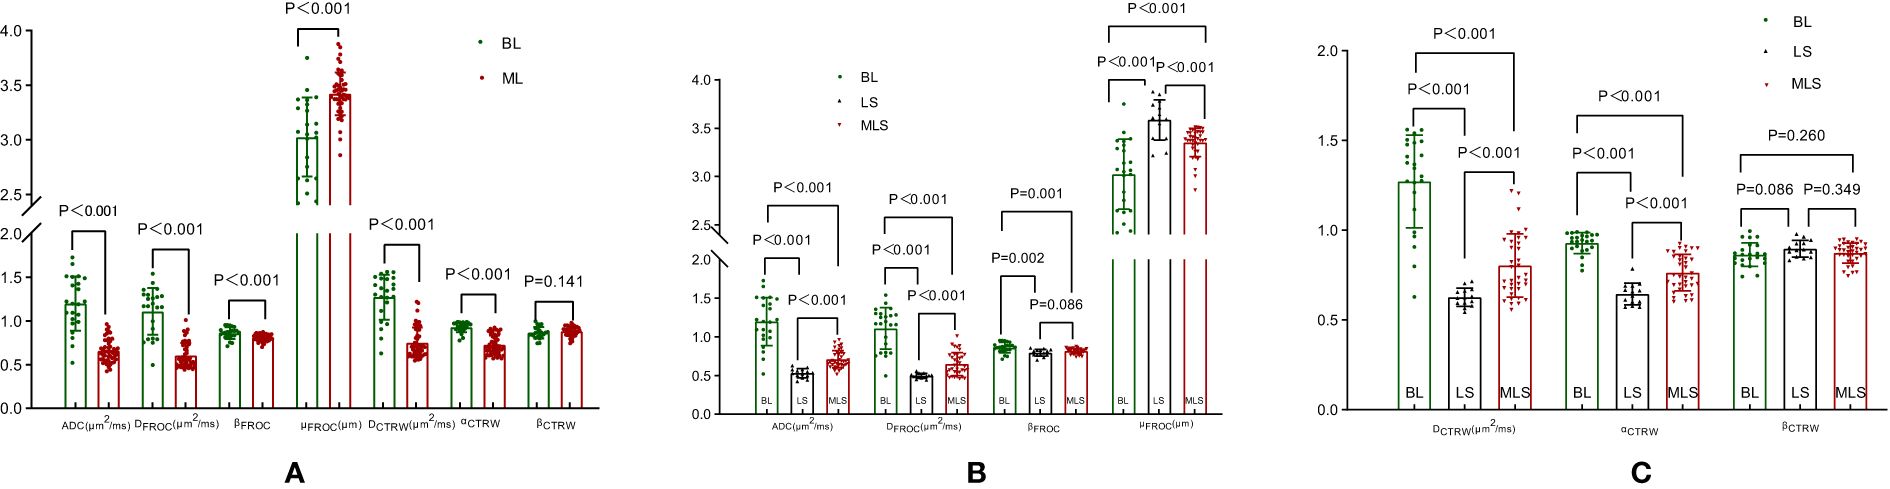
Figure 4. Box plots of DWI, FROC, and CTRW diffusion model parameters between benign and malignant lesions (A); box plots of differences in DWI, FROC diffusion model parameters between BL, LS, and MLS (B); box plots of differences in CTRW diffusion model parameters between BL, LS, and MLS (C). DWI, diffusion-weighted imaging; ADC, apparent diffusion coefficient; FROC, fractional-order calculus; CTRW, continuous-time random walk; BL, benign lesion; ML, malignant lesion; LS, lymphoma subgroup; MLS, malignant lesions excluding lymphoma subgroup.
4. Diagnostic performance and comparisons of parameters between BL vs. ML, LS and MLS, and LS vs. MLS are summarized in Table 5. ROC curve analysis showed that αCTRW had the best performance in differentiating between BL vs. ML (AUC = 0.947), while the diagnostic performance of ADC, DFROC, DCTRW and αCTRW differed significantly from that of βFROC (p = 0.024, 0.018, 0.031, and 0.006, respectively) (Figure 5A).
For BL vs. LS, αCTRW again exhibited the best diagnostic efficacy (AUC = 0.997), with ADC, DFROC, DCTRW, and αCTRW outperforming βFROC (p = 0.024, 0.018, 0.018, and 0.008, respectively; Figure 5).
In differentiating BL from MLS, αCTRW achieved the best performance (AUC = 0.929), and its diagnostic ability, along with that of ADC and DFROC, was significantly higher than that of βFROC (p = 0.031, 0.025, and 0.009, respectively; Figure 5).
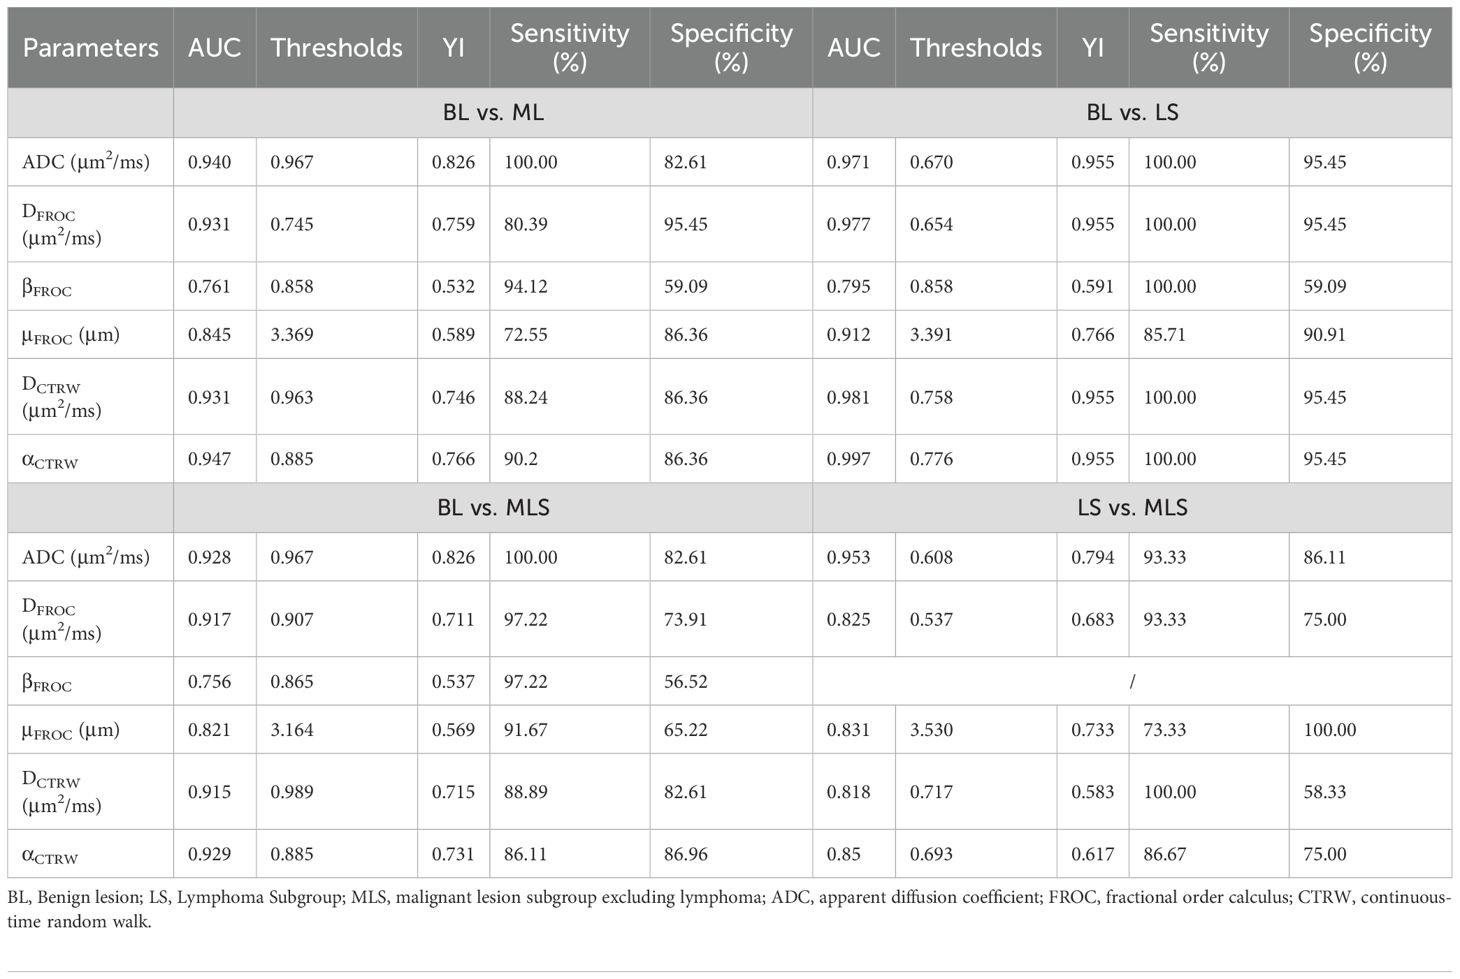
Table 5. ROC results of each parameter in differential diagnosis of head and neck lesions.

Figure 5. ROC curves of DWI, FROC, and CTRW diffusion model parameters in the diagnosis of benign and malignant (A), BL vs. LS (B), BL vs. MLS (C) and LS vs. MLS (D). DWI, diffusion-weighted imaging; ADC, apparent diffusion coefficient; FROC, fractional-order calculus; CTRW, continuous-time random walk; BL, benign lesions; ML, malignant lesions; LS, lymphoma subgroup; MLS, malignant lesions excluding lymphoma subgroup.
For LS vs. MLS, ADC demonstrated the highest diagnostic performance (AUC = 0.953). Its performance was significantly superior to DFROC, DCTRW, and αCTRW (p = 0.008, 0.011, and 0.015, respectively; Figure 5).
Table 5 provides a detailed summary of these diagnostic comparisons.
5. Correlation with Ki-67 Expression: The correlation between each diffusion parameter and Ki-67 expression level in 36 cases with head and neck squamous cell carcinoma was further analyzed. The results showed that the correlation coefficients r of Ki-67 with DFROC, DCTRW, αCTRW and βCTRW were -0.367 (p = 0.028), -0.376 (p = 0.024), -0.418 (p = 0.011) and 0.525(p = 0.001), respectively. While the correlation coefficients r of Ki-67 with ADC, βFROC and μFROC were -0.276 (p = 0.103), 0.252 (p = 0.139), and 0.144 (p = 0.402), respectively (Figure 6).
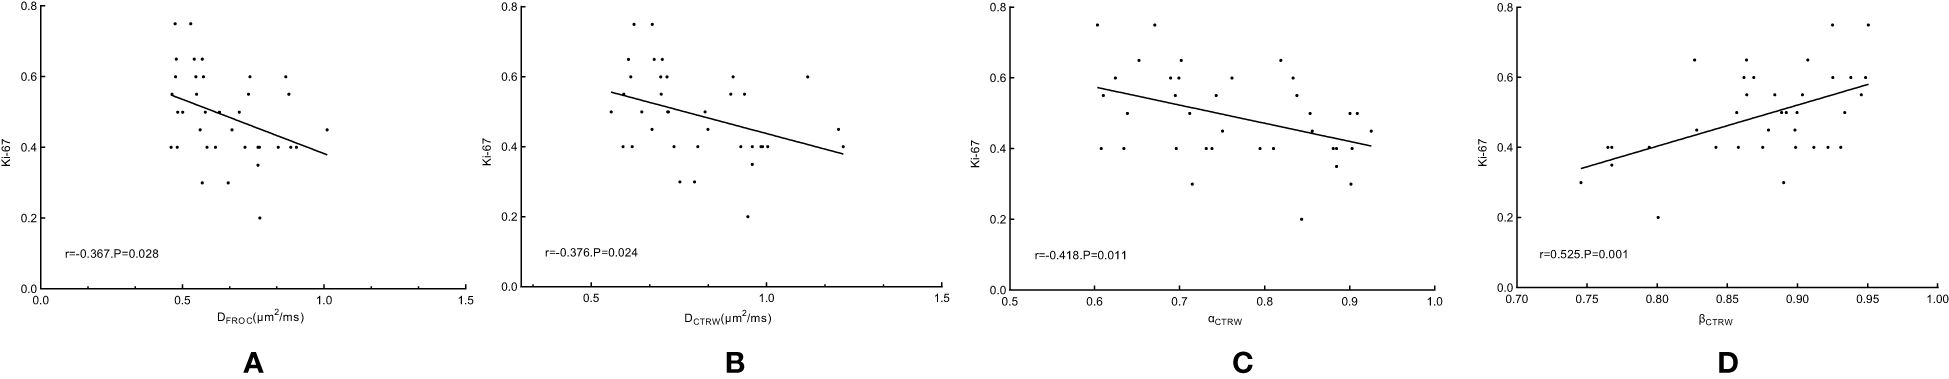
Figure 6. Scatterplot of correlation coefficients between DFROC (A), DCTRW (B), αCTRW (C) and βCTRW (D) and Ki-67. FROC, fractional-order calculus; CTRW, continuous-time random walk.
Discussion
In this study, we examined the clinical value of FROC, CTRW, and conventional DWI diffusion parameters for benign and malignant lesions of the head and neck. Our findings revealed that: Multi-parameters derived from the FROC and CTRW diffusion models can be used to differentiate between benign and malignant lesions of the head and neck and provide indicators that reflect tissue heterogeneity. Moreover, some of the diffusion parameters correlated with the expression level of Ki-67 in the pathological findings.
DWI is a powerful tool for exploring biological microstructures, with the ability to elucidate the cell number, extracellular matrix, vascular distribution, and microstructure of tumor tissues. ADC is derived from a mono-exponential diffusion model, which assumes that the diffusion-driven displacement of water molecules follows a Gaussian distribution. Our study found that ADC showed good diagnostic performance in the differential diagnosis of benign and malignant lesions of the head and neck, which is consistent with previous studies (5, 6). However, it oversimplifies the anomalous diffusion process in complex biological tissues and fails to recognize the heterogeneity of intra-voxel structures. As the complexity of tissue structure increases, this assumption becomes increasingly invalid (13). Unlike the mono-exponential diffusion model, the FROC model recognizes this heterogeneity of diffusion through its three parameters, namely, DFROC, βFROC, and μFROC. DFROC is obtained by fitting the FROC model with multiple b-values less than 1000, which better reflects the true diffusion process in tissues. In this study, DFROC showed good diagnostic performance for BL vs. ML, LS and MLS, and LS vs. MLS, which is similar to the findings in breast cancer (14). Previous studies have shown that βFROC values are negatively correlated with increased intra-voxel heterogeneity (11, 15), which is due to the higher tissue heterogeneity of ML, leading to lower βFROC values. Our findings indicated that BL had a greater βFROC value than ML, and differences in βFROC values were also observed between BL vs. LS and BL vs. MLS. μFROC is regarded as a measure of the mean free path of diffusion, with which it is negatively correlated (16). Malignant tumors present higher μFROC values as the abnormal proliferation of tumor cells can restrict the free diffusion of water molecules. Studies have shown that malignant breast lesions and high-grade bladder tumors exhibit higher μFROC values (14, 16). In this study, the μFROC value of BL was lower, which is in agreement with the results of previous studies. Lymphomas are tumors characterized by high cell density and low microvascularity, with histopathological features that include cellular hyperplasia, larger and irregular nuclei, limited extracellular space, and cellular compartments composed of lymphoma cells and fine fibers. As such, they exhibit more pronounced diffusion restriction and shorter diffusion mean free paths, which in turn manifests as lower DFROC and higher μFROC. Hence, lymphomas are often grouped separately for further evaluation (23). This was verified by our findings and is also consistent with previous studies demonstrating the lower ADC values of lymphomas (24, 25).
The CTRW model is another advanced diffusion MRI technique that describes non-Gaussian behavior (17–19). The model introduces two new parameters, αCTRW and βCTRW, which denote temporal and spatial diffusion heterogeneity, respectively. In a homogeneous medium, αCTRW and βCTRW are close to 1, whereas the presence of tissue heterogeneity causes them to decrease. Smaller αCTRW values indicate that the water molecules are diffusing through a more temporally inhomogeneous environment (i.e., the time taken for water molecules to move is variable), while larger βCTRW values indicate a more spatially homogeneous environment (i.e., the water molecules diffuse in more uniform step sizes for each movement) (18, 19). In this study, BL was shown to have relatively high αCTRW, with differences in αCTRW values found among the BL, LS, and MLS groups. Furthermore, αCTRW had the highest diagnostic performance for BL vs. ML, LS, and MLS, and for LS vs. MLS, which was similar to high-grade gliomas with relatively high αCTRW values (15). Theoretically, βCTRW values should be negatively correlated with tissue heterogeneity, but the βCTRW values in this study did not show significant differences between BL vs. ML, LS and MLS, and LS vs. MLS. This, on the one hand, may be due to the limited sample size, which led to the failure to achieve statistically significant differences. On the other hand, it may be because the different diffusion parameters reflect different aspects of tissue heterogeneity. For example, in studies involving vessels encapsulating tumor clusters in hepatocellular carcinoma and different subtypes of breast lesions (20, 21), only αCTRW showed differences, whereas the βCTRW did not. In contrast, in another study that assessed whether the muscle of bladder cancer was invaded or not (22), only βCTRW showed a difference, and αCTRW values did not differ between the two. This suggests that αCTRW and βCTRW can characterize changes in different properties of water molecule diffusion within the lesion. Thus, we can speculate that the diffusion heterogeneity of water molecules in the head and neck lesions included in this study may manifest more significantly as temporal differences. However, the specific mechanism involved remains unclear and awaits further investigation in future studies. The CTRW model also has an important derived parameter, DCTRW, which is similar to ADC (17, 21) and serves as a measure of tissue cell density. In this study, BL showed higher DCTRW, which was due to the higher cell density of ML leading to lower DCTRW values.
Single-shot echo-planar imaging is commonly used for signal acquisition in DWI scans. Despite its fast-scanning speed, it is prone to geometric distortion and image blurring. It is also restricted by the high degree of heterogeneity present in the components of the head and neck region, is very sensitive to magnetic susceptibility artifacts at tissue interfaces, and is limited by its maximum resolution (26). The RESOLVE diffusion technique can shorten the echo gap by acquiring signals in the gradient direction in segments, thereby reducing the geometric distortion and T2* blurring of DWI to improve the anatomical accuracy of images. This technique has gradually been adopted for the evaluation of head and neck tumors (27, 28). Therefore, in this study, image acquisition was performed using RESOLVE to reduce distortions and artifacts in DWI images (28), and hence obtain more stable data. The results showed that the ICC of the diffusion parameters obtained ranged from 0.801 to 0.959, which showed very good agreement. Further comparative analysis of ROC curves showed that αCTRW had the best diagnostic performance for BL vs. ML, LS, and MLS; αCTRW did not differ from ADC, DFROC, μFROC, and DCTRW, but differed from βFROC. ADC showed better diagnostic performance for LS vs. MLS. These findings suggest that the FROC and CTRW models can provide more diffusion parameters for the assessment of head and neck tumors.
Ki-67 is a nuclear antigen expressed by proliferating cells and is confined to the G1 to M phases of the cell cycle. It is involved in cell mitosis, and its positive expression is closely related to cell proliferation activity. Thus, it is widely used to assess the proliferation activity of tumor cells and can serve as an important indicator for determining the local recurrence, lymph node metastasis, distant metastasis, and poor prognosis of malignant tumors (29, 30). In general, ADC values are negatively correlated with Ki-67 (31, 32), but results may vary across different lesions. For example, a study of nasopharyngeal carcinoma confirmed that there was no correlation between ADC and Ki-67 (33), which is similar to the absence of correlation between ADC and Ki-67 found in this study. Further analysis of the relationship of FROC and CTRW parameters with Ki-67 parameters revealed that Ki-67 showed a low to moderate correlation with DFROC, DCTRW, αCTRW, and βCTRW, with correlation coefficients r of -0.367, -0.376, -0.418, and 0.525, respectively; βFROC and μFROC were not correlated with Ki-67. This was due to the increased number of intratumoral cells with high Ki-67 expression and decreased extracellular space, which resulted in lower DFROC and DCTRW values. The αCTRW and βCTRW parameters, which are indicators of tissue heterogeneity, showed a higher correlation with Ki-67, which suggests that non-Gaussian diffusion models can provide more reference information for the clinical treatment of tumors. Although the differences in AUC values among the diffusion-derived parameters were relatively small, αCTRW consistently exhibited superior diagnostic performance across all classification tasks. This consistent superiority suggests that αCTRW may serve as a robust imaging biomarker. Its moderate correlation with Ki-67 further supports its potential to reflect tumor proliferative activity, highlighting its clinical value in non-invasive tumor characterization. Interestingly, a previous study investigating cervical cancer demonstrated that βCTRW was an independent predictor of the Ki-67 proliferation index, significantly improving the predictive accuracy of the combined model (34). This finding implies that βCTRW may be related to tumor cell proliferation or microstructural remodeling. Taken together, these results suggest that non-Gaussian diffusion models could offer additional biological insights into tumor characterization and potentially support clinical decision-making. Nevertheless, the current evidence remains limited, and further well-designed studies are warranted to validate these findings and clarify the underlying mechanisms. However, limited research has been conducted on the association between the two, and further investigations are needed.
There are several limitations to this study. First, this is a single-center study with a small sample size. The value of non-Gaussian FROC and CTRW models for benign and malignant lesions of the head and neck region requires further exploration through multi-center studies with larger sample sizes. Second, no direct correlation analysis was performed between the MR images and the tissue sections. Although there were significant differences in several diffusion parameters between BL vs. ML, LS and MLS, and between LS v. MLS, we were unable to determine the histological basis for the changes in each individual parameter (e.g. associations with cell size, distribution, cytoplasmic ratio, or degree of necrosis in tumor tissues). Therefore, the correlation between each parameter and histological features is an area for future research. Third, the sample size for each tumor subtype is relatively small, and there is a diverse range of pathological types included, particularly in the benign lesion group. This potential bias in case selection may affect the final thresholds, limiting our ability to explore the correlation of various parameters with the Ki-67 index within smaller malignant subgroups. Future studies will require larger cohorts to clarify the diagnostic capabilities of the two non-Gaussian models in subgroups and their relationship with Ki-67. Fourth, additional non-Gaussian models, such as diffusion kurtosis imaging and intravoxel incoherent motion imaging, were not included for comparative analysis, which restricts our ability to explore the interrelationships among different diffusion parameters. Fifth, although this study utilized RESOLVE scanning as a replacement for single-shot echo-planar imaging for the acquisition of diffusion signals, the relatively longer acquisition time may introduce some motion artifacts. Therefore, future studies could use, for example, multi-slice simultaneous acquisition techniques to shorten the signal acquisition time, further improve the stability of the data, and increase the inter-observer agreement of quantitative parameters.
In conclusion, non-invasive, non-Gaussian FROC- and CTRW-based diffusion models are not only able to differentiate between malignant and benign tumors in the head and neck but can also provide additional information related to the heterogeneity of tumor tissues. Moreover, multiple diffusion parameters derived from these models were correlated with the level of Ki-67 positive expression in tumor histopathology. Therefore, the FROC and CTRW diffusion models and their derived parameters, especially αCTRW, are promising imaging tools and biomarkers for the differential diagnosis of lesions in the head and neck region.
Data availability statement
The raw data supporting the conclusions of this article will be made available by the authors, without undue reservation.
Ethics statement
The studies involving humans were approved by the Ethics Committee of Anhui Medical University (Ethics number: 83244611). The studies were conducted in accordance with the local legislation and institutional requirements. The ethics committee/institutional review board waived the requirement of written informed consent for participation from the participants or the participants' legal guardians/next of kin because Given its retrospective nature, the requirement for written informed consent was waived by the Ethics Committee
Author contributions
LH: Data curation, Formal Analysis, Investigation, Writing – original draft. QG: Investigation, Writing – original draft. YT: Data curation, Investigation, Writing – original draft. XD: Data curation, Investigation, Writing – original draft. JYL: Data curation, Formal Analysis, Investigation, Writing – original draft. ML: Data curation, Formal Analysis, Methodology, Software, Writing – original draft. JL: Conceptualization, Data curation, Formal Analysis, Funding acquisition, Software, Supervision, Validation, Visualization, Writing – original draft, Writing – review & editing. QY: Conceptualization, Data curation, Formal Analysis, Funding acquisition, Investigation, Methodology, Project administration, Resources, Software, Supervision, Validation, Visualization, Writing – original draft, Writing – review & editing.
Funding
The author(s) declare that financial support was received for the research and/or publication of this article. This study was supported by the Key Projects of Natural Science Research in Universities of Anhui Province (Grant No. 2024AH050749 and 2022AH050701) and Youth Science Fund Projects of Anhui Medical University (Grant No. 2021xjk114).
Acknowledgments
We would like to thank Editage (www.editage.cn) for providing English language editing services.
Conflict of interest
Author ML was employed by the company Siemens Healthineers Co.,Ltd.
The remaining authors declare that the research was conducted in the absence of any commercial or financial relationships that could be construed as a potential conflict of interest.
Generative AI statement
The author(s) declare that no Generative AI was used in the creation of this manuscript.
Publisher’s note
All claims expressed in this article are solely those of the authors and do not necessarily represent those of their affiliated organizations, or those of the publisher, the editors and the reviewers. Any product that may be evaluated in this article, or claim that may be made by its manufacturer, is not guaranteed or endorsed by the publisher.
Abbreviations
FROC, Fractional order calculus; CTRW, Continuous-time random walk; CT, Computed tomography; BL, Benign lesions; ML, Malignant lesions; LS, Lymphoma subgroup; MLS, Malignant squamous cell carcinoma lesions subgroup; ADC, Apparent diffusion coefficient; ROC, Receiver operating characteristic; AUC, Area under the receiver operating characteristic curve; ICC, Intraclass correlation coefficient; MRI, Magnetic resonance imaging; ROI, Region of interest; RESOLVE, The readout segmentation of long variable echo trains; SS-EPI, Single-shot echo-planar imaging
CI, confidence interval; DWI, diffusion weighted imaging; ADC, apparent diffusion coefficient; FROC, fractional order calculus; CTRW, continuous-time random walk.
References
1. Junn JC, Soderlund KA, and Glastonbury CM. Imaging of head and neck cancer with CT, MRI, and US. Semin Nucl Med. (2021) 51:3–12. doi: 10.1053/j.semnuclmed.2020.07.005
2. Wu IC, Chen YC, Karmakar R, Mukundan A, Gabriel G, Wang CC, et al. Advancements in hyperspectral imaging and computer-aided diagnostic methods for the enhanced detection and diagnosis of head and neck cancer. Biomedicines. (2024) 12:2315. doi: 10.3390/biomedicines12102315
3. Hernandez-Herrera GA, Calcano GA, Nagelschneider AA, Routman DM, and Van Abel KM. Imaging modalities for head and neck cancer: present and future. Surg Oncol Clin N Am. (2024) 33:617–49. doi: 10.1016/j.soc.2024.04.002
4. Zhang L, Li X, Yang L, Tang Y, Guo J, Li D, et al. Multi-sequence and multi-regional MRI-based radiomics nomogram for the preoperative assessment of muscle invasion in bladder cancer. J Magn Reson Imaging. (2023) 58:258–69. doi: 10.1002/jmri.28498
5. Baba A, Kurokawa R, Rawie E, Kurokawa M, Ota Y, Srinivasan A, et al. Normalized parameters of dynamic contrast-enhanced perfusion MRI and DWI-ADC for differentiation between posttreatment changes and recurrence in head and neck cancer. AJNR Am J Neuroradiol. (2022) 43:1184–9. doi: 10.3174/ajnr.A7567
6. Koontz NA and Wiggins RH 3rd. Differentiation of benign and Malignant head and neck lesions with diffusion tensor imaging and DWI. AJR Am J Roentgenol. (2017) 208:1110–5. doi: 10.2214/AJR.16.16486
7. Zhang K, Dai Y, Liu Y, Tao J, Pan Z, Xie L, et al. Soft tissue sarcoma: IVIM and DKI parameters correlate with Ki-67 labeling index on direct comparison of MRI and histopathological slices. Eur Radiol. (2022) 32:5659–68. doi: 10.1007/s00330-022-08646-1
8. Marzi S, Minosse S, Vidiri A, Piludu F, and Giannelli M. Diffusional kurtosis imaging in head and neck cancer: On the use of trace-weighted images to estimate indices of non-Gaussian water diffusion. Med Phys. (2018) 45:5411–9. doi: 10.1002/mp.2018.45.issue-12
9. Connolly M and Srinivasan A. Diffusion-weighted imaging in head and neck cancer: technique, limitations, and applications. Magn Reson Imaging Clin N Am. (2018) 26:121–33. doi: 10.1016/j.mric.2017.08.011
10. Sakamoto J, Yoshino N, Okochi K, Imaizumi A, Tetsumura A, Kurohara K, et al. Tissue characterization of head and neck lesions using diffusion-weighted MR imaging with SPLICE. Eur J Radiol. (2009) 69:260–8. doi: 10.1016/j.ejrad.2007.10.008
11. Zhou XJ, Gao Q, Abdullah O, and Magin RL. Studies of anomalous diffusion in the human brain using fractional order calculus. Magnetic Resonance Medicine. (2010) 63:562–9. doi: 10.1002/mrm.22285
12. Karaman MM, Sui Y, Wang H, Magin RL, Li Y, Zhou XJ, et al. Differentiating low-and high-grade pediatric brain tumors using a continuous-time random-walk diffusion model at high b-values. Magn Reson Med. (2016) 76:1149–57. doi: 10.1002/mrm.26012
13. Sui Y, Wang H, Liu G, Damen FW, Wanamaker C, Li Y, et al. Differentiation of low- and high-grade pediatric brain tumors with high b-value diffusion-weighted MR imaging and a fractional order calculus model. Radiology. (2015) 277:489–96. doi: 10.1148/radiol.2015142156
14. Wang C, Wang G, Zhang Y, Dai Y, Yang D, Wang C, et al. Differentiation of benign and Malignant breast lesions using diffusion-weighted imaging with a fractional-order calculus model. Eur J Radiol. (2023) 159:110646. doi: 10.1016/j.ejrad.2022.110646
15. Sui Y, Xiong Y, Jiang J, Karaman MM, Xie KL, Zhu W, et al. Differentiation of low- and high-grade gliomas using high b-value diffusion imaging with a non-gaussian diffusion model. AJNR Am J Neuroradiol. (2016) 37:1643–9. doi: 10.3174/ajnr.A4836
16. Feng C, Wang Y, Dan G, Zhong Z, Karaman MM, Li Z, et al. Evaluation of a fractional-order calculus diffusion model and bi-parametric VI-RADS for staging and grading bladder urothelial carcinoma. Eur Radiol. (2022) 32:890–900. doi: 10.1007/s00330-021-08203-2
17. Zhong Z, Merkitch D, Karaman MM, Zhang J, Sui Y, Goldman JG, et al. High-spatial-resolution diffusion MRI in parkinson disease : lateral asymmetry of the substantia nigra. Radiology. (2019) 291:149–57. doi: 10.1148/radiol.2019181042
18. Tang C, Li F, He L, Hu Q, Qin Y, Yan X, et al. Comparison of continuous-time random walk and fractional order calculus models in characterizing breast lesions using histogram analysis. Magn Reson Imaging. (2024) 108:47–58. doi: 10.1016/j.mri.2024.01.012
19. Jiang Y, Fan F, Zhang P, Wang J, Huang W, Zheng Y, et al. Staging liver fibrosis by a continuous-time random-walk diffusion model. Magn Reson Imaging. (2024) 105:100–7. doi: 10.1016/j.mri.2023.11.009
20. Li C, Wen Y, Xie J, Chen Q, Dang Y, Zhang H, et al. Preoperative prediction of VETC in hepatocellular carcinoma using non-Gaussian diffusion-weighted imaging at high b values: a pilot study. Front Oncol. (2023) 13:1167209. doi: 10.3389/fonc.2023.1167209
21. Mao C, Hu L, Jiang W, Qiu Y, Yang Z, Liu Y, et al. Discrimination between human epidermal growth factor receptor 2 (HER2)-low-expressing and HER2-overexpressing breast cancers: a comparative study of four MRI diffusion models. Eur Radiol. (2024) 34:2546–59. doi: 10.1007/s00330-023-10198-x
22. Fan Z, Guo J, Zhang X, Chen Z, Wang B, Jiang Y, et al. Non-Gaussian diffusion metrics with whole-tumor histogram analysis for bladder cancer diagnosis: muscle invasion and histological grade. Insights Imaging. (2024) 15:138. doi: 10.1186/s13244-024-01701-z
23. Cheng J, Shao S, Chen W, and Zheng N. Application of diffusion kurtosis imaging and dynamic contrast-enhanced magnetic resonance imaging in differentiating benign and Malignant head and neck lesions. J Magn Reson Imaging. (2022) 55:414–23. doi: 10.1002/jmri.27885
24. Song C, Cheng P, Cheng J, Zhang Y, Sun M, Xie S, et al. Differential diagnosis of nasopharyngeal carcinoma and nasopharyngeal lymphoma based on DCE-MRI and RESOLVE-DWI. Eur Radiol. (2020) 30:110–8. doi: 10.1007/s00330-019-06343-0
25. Fong D, Bhatia KS, Yeung D, and King AD. Diagnostic accuracy of diffusion-weighted MR imaging for nasopharyngeal carcinoma, head and neck lymphoma and squamous cell carcinoma at the primary site. Oncol. (2010) 46:603–6. doi: 10.1016/j.oraloncology.2010.05.004
26. Porter DA and Heidemann RM. High resolution diffusion-weighted imaging using readout-segmented echo-planar imaging, parallel imaging and a two-dimensional navigator based reacquisition. Magn Reson Med. (2009) 62:468–75. doi: 10.1002/mrm.22024
27. He M, Tang Z, Qiang J, Xiao Z, and Zhang Z. Differentiation between sinonasal natural killer/T-cell lymphomas and diffuse large B-cell lymphomas by RESOLVE DWI combined with conventional MRI. Magn Reson Imaging. (2019) 62:10–7. doi: 10.1016/j.mri.2019.06.011
28. Huang N, Xiao Z, Chen Y, She D, Guo W, Yang X, et al. Quantitative dynamic contrast-enhanced MRI and readout segmentation of long variable echo-trains diffusion-weighted imaging in differentiating parotid gland tumors. Neuroradiology. (2021) 63:1709–19. doi: 10.1007/s00234-021-02758-z
29. Chen W, Lin G, Chen Y, Cheng F, Li X, Ding J, et al, et al. Prediction of the Ki-67 expression level in head and neck squamous cell carcinoma with machine learning-based multiparametric MRI radiomics: a multicenter study. BMC Cancer. (2024) 24:418. doi: 10.1186/s12885-024-12026-x
30. Zheng YM, Chen J, Zhang M, Wu ZJ, Tang GZ, Zhang Y, et al. CT radiomics nomogram for prediction of the Ki-67 index in head and neck squamous cell carcinoma. Eur Radiol. (2023) 33:2160–70. doi: 10.1007/s00330-022-09168-6
31. Swartz JE, Driessen JP, van Kempen PMW, de Bree R, Janssen LM, Pameijer FA, et al. Influence of tumor and microenvironment characteristics on diffusion-weighted imaging in oropharyngeal carcinoma: A pilot study. Oncol. (2018) 77:9–15. doi: 10.1016/j.oraloncology.2017.12.001
32. Wang Y, He M, Cao P, Ip PPC, Lin CY, Liu W, et al. Tissue characteristics of endometrial carcinoma analyzed by quantitative synthetic MRI and diffusion-weighted imaging. Diagnostics. (2022) 12:2956. doi: 10.3390/diagnostics12122956
33. Wu W, Jiang G, Xu Z, Wang R, Pan A, Gao M, et al, et al. Three-dimensional pulsed continuous arterial spin labeling and intravoxel incoherent motion imaging of nasopharyngeal carcinoma: correlations with Ki-67 proliferation status. Quant Imaging Med Surg. (2021) 11:1394–405. doi: 10.21037/qims-20-349
34. Su Y, Zeng K, Yan Z, Yang X, Yang L, Yang L, et al. Predicting the Ki-67 proliferation index in cervical cancer: a preliminary comparative study of four non-Gaussian diffusion-weighted imaging models combined with histogram analysis. Quant Imaging Med Surg. (2024) 14:7484–95. doi: 10.21037/qims-24-576
Keywords: head and neck lesions, fractional-order calculus, continuous-time random walk, diffusion-weighted imaging, magnetic resonance imaging
Citation: Hua L, Guo Q, Tang Y, Ding X, Lin J, Liu M, Liu J and Yang Q (2025) Using non-Gaussian diffusion models to distinguish benign from malignant head and neck lesions. Front. Oncol. 15:1581637. doi: 10.3389/fonc.2025.1581637
Received: 22 February 2025; Accepted: 05 May 2025;
Published: 29 May 2025.
Edited by:
Paolo Tini, Siena University Hospital, ItalyReviewed by:
Hailin Tang, Sun Yat-Sen University Cancer Center (SYSUCC), ChinaArvind Mukundan, National Chung Cheng University, Taiwan
Copyright © 2025 Hua, Guo, Tang, Ding, Lin, Liu, Liu and Yang. This is an open-access article distributed under the terms of the Creative Commons Attribution License (CC BY). The use, distribution or reproduction in other forums is permitted, provided the original author(s) and the copyright owner(s) are credited and that the original publication in this journal is cited, in accordance with accepted academic practice. No use, distribution or reproduction is permitted which does not comply with these terms.
*Correspondence: Qing Yang, NTY0NjkyMjVAcXEuY29t; Jun Liu, MTAyMzE5NjA1MEBxcS5jb20=
†ORCID: Jun Liu, orcid.org/0000-0003-0916-2834
Qing Yang, orcid.org/0000-0002-9641-3170