 Shihui Zhen1,2,3*†
 Peng Zhang3†Hanxiao Huang3†Zhiyu Jiang2
 Yankai Jiang3,4
 Jihong Sun5
 Liqing Zhang6Mei Ruan6
 Qingqing Chen5
 Yujun Wang7Yubo Tao3Weizhi Luo3Ming Cheng3Zhetuo Qi8
 Wei Lu9Hai Lin3*
 Xiujun Cai2*
- 1Department of Surgical Oncology, Sir Run Run Shaw Hospital, School of Medicine, Zhejiang University, Hangzhou, Zhejiang, China
- 2Department of General Surgery, Sir Run Run Shaw Hospital, School of Medicine, Zhejiang University, Hangzhou, Zhejiang, China
- 3State Key Laboratory of Computer-aided Design and Computer Graphics (CAD&CG), Zhejiang University, Hangzhou, Zhejiang, China
- 4Shanghai Artificial-Intelligence Laboratory, Shanghai, China
- 5Department of Radiology, Sir Run Run Shaw Hospital, School of Medicine, Zhejiang University, Hangzhou, Zhejiang, China
- 6Department of Radiology, Affiliated Hangzhou First People’s Hospital, Zhejiang University School of Medicine, Hangzhou, China
- 7Department of Radiology, Tongde Hospital of Zhejiang Province, Hangzhou, China
- 8Department of Hepatobiliary and Pancreatic Surgery, First Affiliated Hospital, Zhejiang University School of Medicine, Hangzhou, China
- 9Department of Radiology, Ningbo NO. 2 Hospital, Ningbo, Zhejiang, China
Objectives: Non-contrast MRI(NC-MRI) is an attractive option for liver tumors screening and follow-up. This study aims to develop and validate a deep convolutional neural network for the classification of liver lesions using non-contrast MRI.
Methods: A total of 50418 enhanced MRI images from 1959 liver tumor patients across three centers were included. Inception-ResNet V2 was used to generate four models through transfer-learning for three-way lesion classification, which processed T2-weighted, diffusion-weighted (DWI) and multiphasic T1-weighted images. The models were then validated using one independent internal and two external datasets with 5172, 2916, and 1338 images, respectively. The efficacy of non-contrast models (T2,T2+DWI) in differentiating between benign and malignant liver lesions at the patient level was also evaluated and compared with radiologists. The performance of models was evaluated using the area under the receiver operating characteristic curve (AUC),sensitivity and specificity.
Results: Similar to multi-sequence and enhanced image-based models, the non-contrast models showed comparable accuracy in classifying liver lesions as benign, primary malignant or metastatic. In the independent internal cohort, the T2+DWI model achieved AUC of 0.91(95% CI,0.888–0.932), 0.873(0.848-0.899), and 0.876(0.840-0.911) for three tumour categories, respectively. The sensitivities for distinguishing malignant tumors in three validation sets were 98.1%, 89.7%, and 87.5%%, with specificities over 70% in all three sets.
Conclusions: Our deep-learning-based model yielded good applicability in classifying liver lesions in non-contrast MRI. It provides a potential alternative for screening liver tumors with the advantage of reducing costs, scanning time and contrast-agents risks. It is more suitable for benign tumours follow-up, surveillance of HCC and liver metastasis that need periodic repetitive examinations.
1 Introduction
Liver cancer is one of the leading causes of cancer-related mortality worldwide (1). Based on the primary tumor site, liver cancer may be divided into primary liver cancer and metastatic cancer of the liver. Hepatocellular carcinoma (HCC) accounts for 75-85% of primary liver cancer while intrahepatic cholangiocarcinoma (ICC) accounts for 10-15% (2). The liver is also the dominating site of metastasis for gastrointestinal cancers and is a location highly susceptible to the establishment of metastasis in many other primary cancers, including breast, lung, and pancreatic cancers (3). In addition, several types of benign masses also arise in the liver, including cyst, hemangioma, focal nodular hyperplasia, abscess and some benign nodules, such as cirrhotic nodules, regenerative nodules, dysplastic nodules and adenoma (4, 5). Clinically, a key diagnostic challenge lies in differentiating between primary hepatic malignancies, metastatic lesions, and benign tumors. While benign, asymptomatic lesions typically require no intervention other than observation (6),accurate and timely diagnosis of malignant liver lesions is crucial for effective treatment and improved prognosis (7).
Compared to ultrasound and computed tomography (CT), Magnetic Resonance Imaging (MRI) achieves higher detection rate and diagnosis accuracy for focal liver lesions, which makes it the best candidate for surveillance of liver cancer (8, 9). However, full contrast-enhanced MRI protocols are limited by long acquisition times, high costs, and the potential adverse effects of gadolinium-based contrast agents, including nephrogenic systemic fibrosis and gadolinium deposition in tissues (10–19).
Non-contrast MRI (NC-MRI), incorporating T2-weighted (T2W) imaging and diffusion-weighted imaging (DWI), is emerging as a practical and safer alternative, especially for patients requiring repeated follow-up. HCC presents with mild to moderate hyperintensity on T2-weighted images, while non-malignant lesions (e.g. cysts, hemangiomas, fibrosis) usually display marked T2 hypo-intensity or marked T2 hyperintensity (20). However, NC-MRI still has some limitations. Lesions like FNH and adenomas can mimic malignancy, and certain HCCs may appear isointense to the surrounding liver parenchyma on T2WI. DWI is vulnerable to artifacts and has blind spots. Some reviews pointed out that relatively low sensitivity and low inter-reader agreement are main concerns in NC-MRI (21, 22).
With the advancement of artificial intelligence in medical imaging, deep learning (DL), particularly convolutional neural networks (CNNs), has shown great promise in improving image-based diagnosis (23, 24). Although several studies have applied DL to liver lesion classification, most of them rely on contrast-enhanced MRI, limiting their applicability in routine screening or contrast-contraindicated patients (25–28). If CNN-based DL models can achieve high diagnostic performance using only NC-MRI, this would substantially reduce the cost and complexity of liver tumor surveillance, while minimizing patient risk. This would be especially advantageous for patients with benign lesions requiring long-term follow-up and for those under regular surveillance for HCC or liver metastases. Therefore, this study aims to evaluate the diagnostic performance of a deep learning model using only non-contrast MRI for classifying liver tumors. Specifically, we developed and validated the model on a multicenter dataset encompassing diverse liver lesion types, and compared its performance with that of experienced radiologists to assess its clinical utility.
2 Materials and methods
2.1 Study design
This was a retrospective, multi-center, diagnostic study using liver MRI image sets from three hospitals in China. The inclusion criteria were as follows: (1) with liver tumors; (2) accepted enhanced MRI inspection; (3) with final diagnosis: histopathologic report from biopsy or surgery; HCC with typical Li-RADS 5 imaging diagnostic criteria; metastatic lesions with typical imaging features and known primary sites; benign tumors with typical imaging features; (4) aged 18 years or older. The exclusion criteria were as follows: (1) accepted treatment related to the lesion before MRI inspection, including surgery, transcatheter arterial chemoembolization (TACE), radiofrequency ablation, chemotherapy, radiotherapy, targeted drug therapy, etc.(2) unqualified image quality. This study consisted of two stages: the training stage, in which deep learning models were trained using MRI image sets from the hepatic focal lesion database by affiliated Sir Run Run Shaw Hospital, Zhejiang University School of Medicine (SRRSH, obtained from January 2014 to December 2018) and the test stage to examine the performance of the models using three different test MRI image sets which were obtained from SRRSH (January 2019 to July 2019), Hangzhou First People’s Hospital (HZFPH) and Tongde Hospital of Zhejiang Province(TDH), respectively. In the training, to classify liver tumors into three categories, we undertook a series of supervised CNN learning using different combinations of MRI sequences (T2, diffusion, Pre-contrast T1, late arterial, portal venous, equilibrium phase) as input data. A flowchart of the outline of this study are demonstrated in Figure 1.
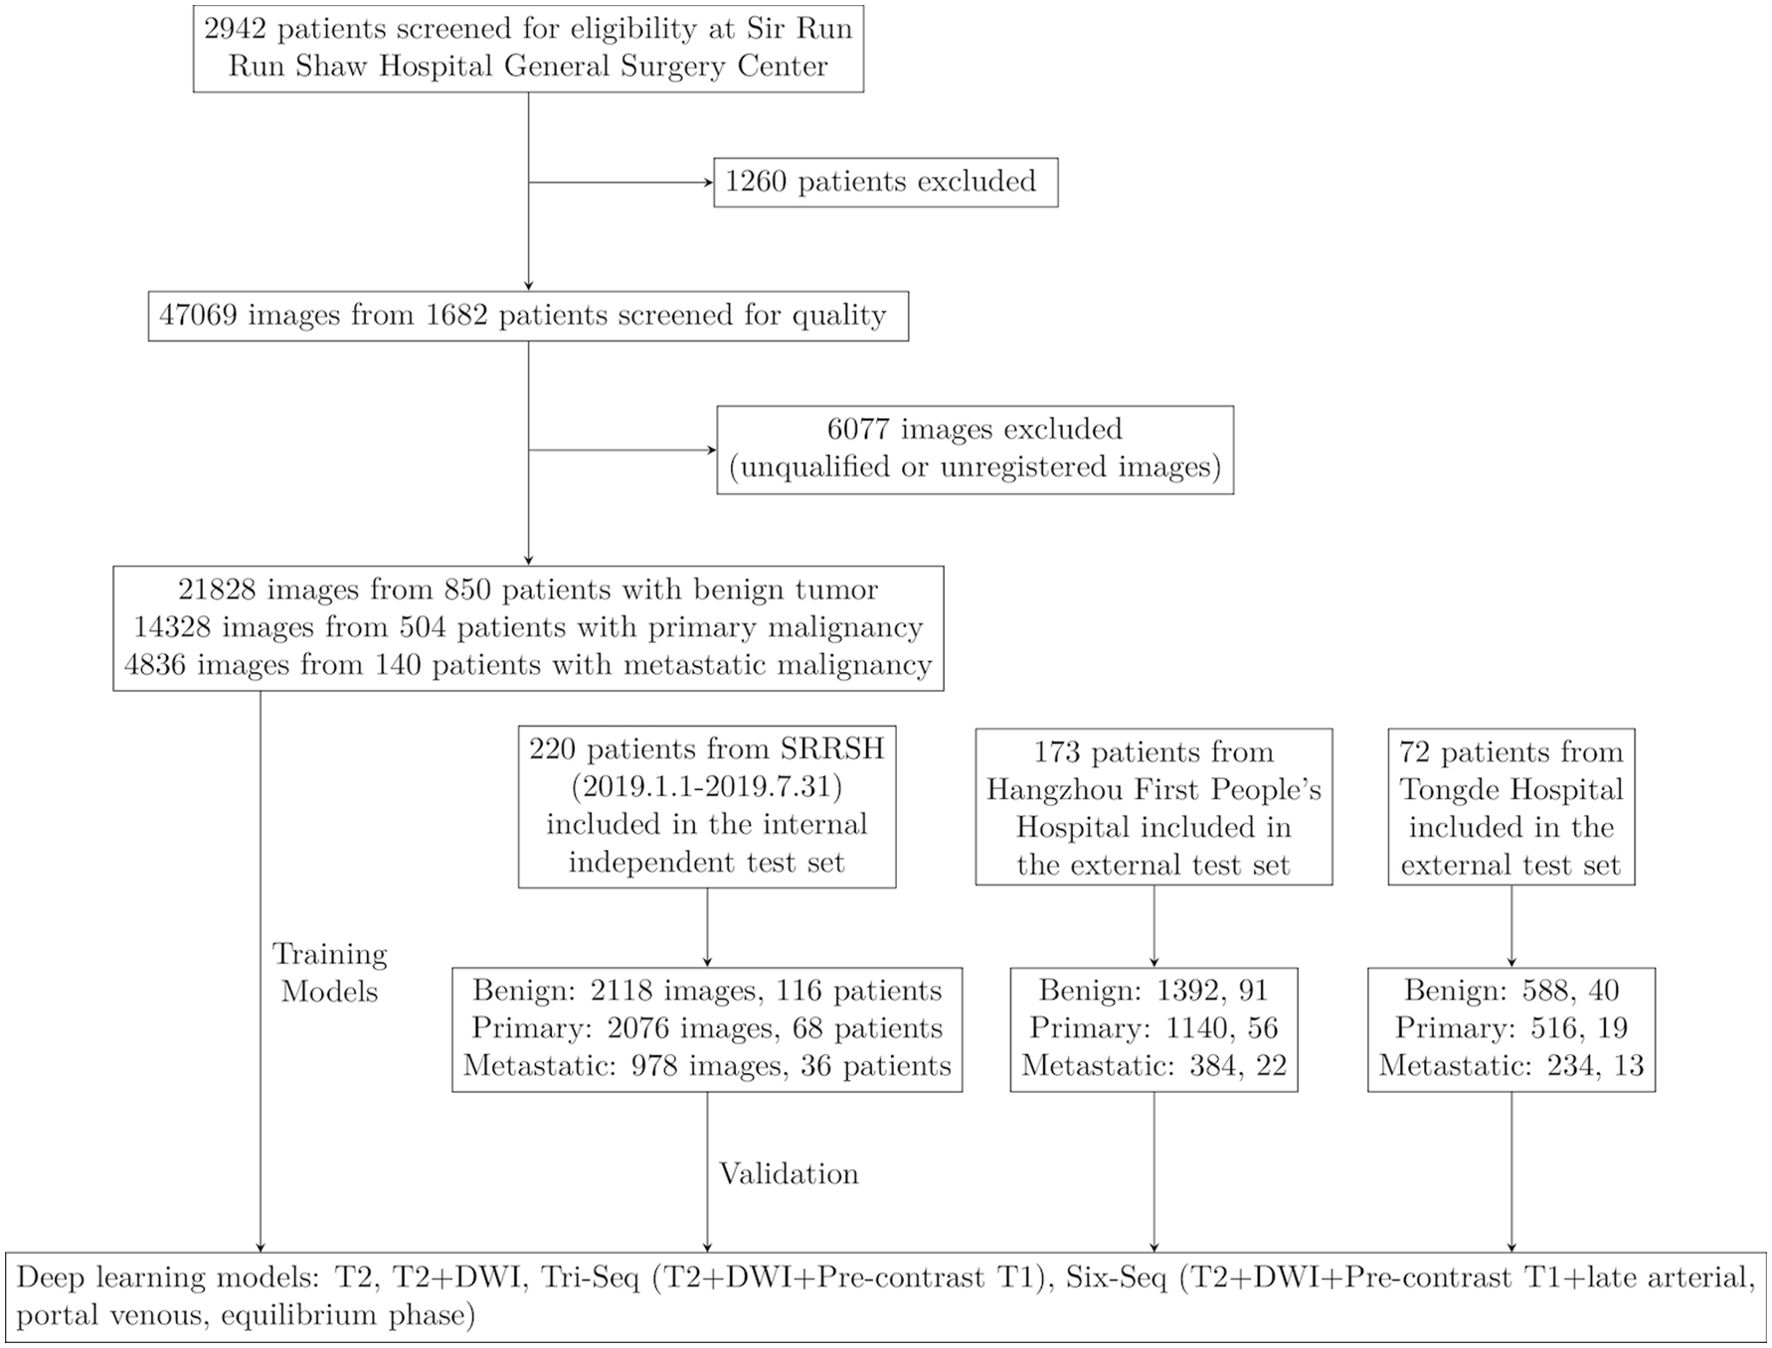
Figure 1. Workflow diagram for the development and evaluation of deep learning models. SRRSH, Sir Run Run Shaw Hospital.
This study has been approved by the Institutional Review Board of Sir Run Run Shaw Hospital (SRRSH) and was conducted in accordance with the Declaration of Helsinki. This work has been reported in line with the STARD (Standards for the Reporting of Diagnostic accuracy studies) criteria (29).
2.2 Ground truth
Four general radiologists with more than 10 years of experience in abdominal imaging diagnosis were divided into 2 groups of 2 to participate in data quality control and data annotation. Each lesion was manually annotated by two general radiologists, with one radiologist delineating the boundaries of the lesion under the supervision of another radiologist. The contours of the lesion were finalized when the two radiologists reached a consensus.
The gold standard for lesion classification was established either from available histopathological reports or from the consensus of two senior general radiologists, each with over 20 years of experience in abdominal imaging diagnosis. Specifically, malignancies were validated via histopathology, while benign lesions were confirmed either through appropriate histopathology or by the joint agreement of the senior radiologists mentioned earlier. The agreement was achieved after an independent review of all pertinent information, which included clinical data, MRI scans, and associated radiological reports which were collected over a follow-up period of at least six months. Cases that had neither a histopathological report nor a consensus agreement were all excluded from the study. For patients who had several liver masses of the same diagnosis, the most typical and largest liver mass was selected. These datasets covered almost all types of liver mass-like lesions.
Liver masses were finally classified into three categories adhering to the criteria as follows: A. benign tumor, including these types: cyst, hemangioma, abscess, focal nodular hyperplasia (FNH), other benign nodules (cirrhotic nodules, regenerative nodules(RN), dysplastic nodules(DN), rare benign tumors); B. primary malignancy, including HCC and other primary hepatic malignancy(intrahepatic cholangiocarcinoma(ICC), mixed HCC-ICC, etc.); C. metastatic malignancy, with primary sites from colorectal, breast, lung, pancreas, etc.
2.3 MRI acquisition protocol
Abdominal MRIs were performed in the supine position. The T2 weighted sequence and diffusion weighted sequence (b value: 800s/mm2 or 1000s/mm2) were performed according to the standard institutional liver MR imaging protocol, and the acquisition time was 2-2.5min and 2-2.5min, respectively. Contrast-enhanced T1 sequences were performed with acquisition time of 12–18 s. Images of pre-contrast T1, late arterial phase (~ 15s post-injection), portal venous phase (~ 60 s post-injection) and equilibrium phase (~3 min post- injection) were also screened. The scanners and contrast media used for MR acquisition in three hospitals are listed in Supplementary Table S1. Imaging parameters varied across different scanners and time frames.
2.4 Image preprocessing
Eligible MRI images were downloaded from the Picture Archiving and Communication Systems (PACS) and stored as Digital Imaging and Communications in Medicine (DICOM) files. The region of interest (ROI) about liver tumor was annotated in T2 sequences by trained senior abdominal radiologists based on ground truth standard. Six images from six sequences (T2, diffusion, Pre-contrast T1, late arterial, portal venous, equilibrium phase) were then obtained for each cross section of the lesion and resampled to a resolution of 0.7 × 0.7 × 10 mm. Then the annotations of the other five sequences were generated according to the origin and spacing information of sequences. DICOM files were converted to images for the training stage. To increase the diversity of data, the images were augmented using rotation, flipping, scaling, shifting and shearing.
2.5 Deep learning model development
The overall process of the proposed deep learning system to liver tumor diagnosis is explained in Figure 1. Our network architecture was initially derived from Google Inception-ResNet V2 CNN architecture. For initializing the network, we applied a transfer learning method with backbone network pretrained on ImageNet dataset (30) (see Supplementary Figure S1), while the first convolution layer was modified to take in inputs of three or six channels (for a single T2 sequence input, the T2 images were copied and stacked to have three identical channels; for multi-sequence input, the sequences were stacked in specified orders), and the last fully-connected layer was modified to output three channels (for tri-classification task) or two channels (for binary-classification task). For each group of input images, the output was a three or two-dimensional vector representing the predicted probabilities for the three or binary categories. The category with the largest value in the vector was taken as the predicted diagnosis. To calculate the patient-wise predicted value, the predicted vector for each image group was summed up and the category with the largest value was used as the final diagnosis of the patient.
The network was trained via back-propagation. The optimization was stochastic gradient descent with global learning rate of 0.1 and momentum of 0.9, while the step decay was set to decrease by 50% every 20 epochs, combined with a linear warm-up in the first 10 epochs. The training epoch was set to be 200 and batch size as 16. Python and TensorFlow framework were used to implement the training and validation stages. During the training and validation stages, each image was first resized to 299×299 pixels with bicubic interpolation. The images were also augmented via random rotation within 40°, horizontal/vertical flip, and width/height scaling, shearing and zooming which were all within 20%.
All codes were implemented in Python and Pytorch. One work-station was used for individual model training and validation. More specifically, all experiments were performed on a workstation platform with 2 NVIDIA RTX 2080 Ti GPUs with 11GB GPU memory, 256 G RAM, 1 NVIDIA RTX 1080Ti GPU and Intel(R) Xeon(R) Gold6248 CPU @ 2.50 GHz, using Ubuntu 16.04.
To generate a visual explanation of the model diagnosis process, attention maps were plotted using the Grad-CAM algorithm which displayed the pixels in the ROIs that provided the greatest contribution to the classification output (31).
2.6 Statistical analysis
Descriptive statistics were summarized as mean ± SD. Comparisons between groups were made with the Kruskal-Wallis H test, when appropriate, for quantitative variables and with the X2 test or Fisher’s test for qualitative variables. For classification purposes, the receiver operating characteristic (ROC) curve was used to show the diagnostic ability of the model in discriminating specific category from the others. The ROC curve and the corresponding area under ROC curve (AUC) for each category were calculated in each model using the python library sklearn. Differences between various AUCs were compared using a Delong test. 95% CIs for sensitivity and specificity were calculated with the Clopped-Pearson method. The diagnostic likelihood ratio (DLR) was calculated to evaluate the clinical value of binary models. All statistical tests were two-sided with a significance level of 0·05.
3 Results
3.1 Baseline characters
Between Jan, 2014, and Dec, 2018, 2942 patients with liver tumors were enrolled from the hepatic focal lesions MR imaging database at SRRSH (Figure 1). Owing to undetermined final diagnosis and prior anti-tumor treatment before MRI inspection, 1260 patients were excluded. After quality control evaluation, 6077 of 47069 images were discarded because of poor quality or multi-sequence images that were not registered during image processing. For the internal independent validation dataset, 5172 tumor images from 220 patients were included at SRRSH between Jan, 2019, and Jul, 2019. At the two other participating hospitals, 2916 images of 173 patients were obtained from Hangzhou First People’s Hospital and 1338 images of 72 patients were acquired from Zhejiang Tongde Hospital. The patient characteristics were summarized in Table 1. Detailed diagnosis information about each type of tumors in training and validation sets was shown in Supplementary Table S2.
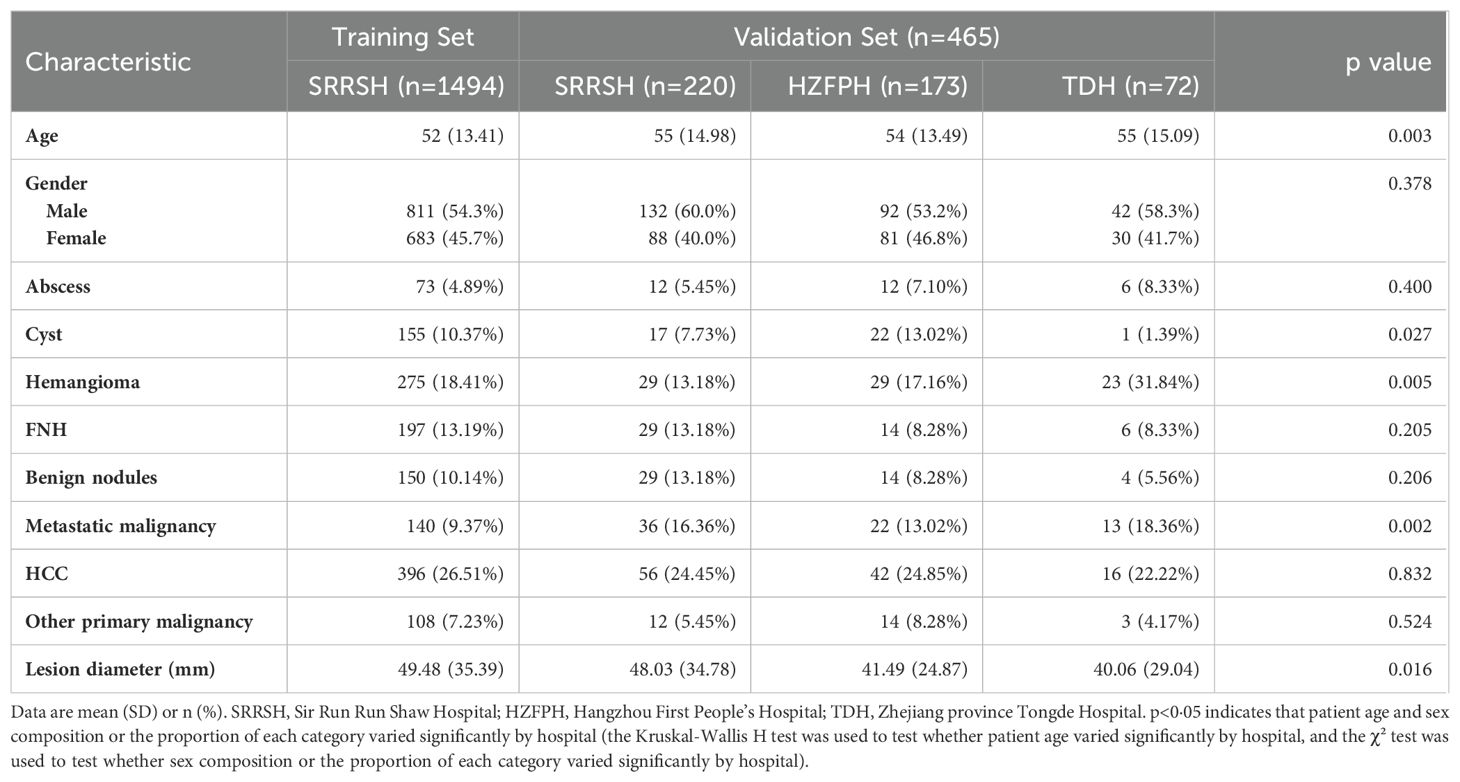
Table 1. Baseline characteristics.
3.2 AUC performance of CNN models
The CNN models were first validated on the internal independent SRRSH dataset (Figure 2). T2 and T2+DWI exhibited similar performance compared to the other two multi-sequence models in classifying benign tumor, primary malignancy and metastatic tumor. Compared with T2+DWI, the other three models for each category bascially showed no statistical significance in AUC (p>0.05, Supplementary Table S3). However, the ability for distinguishing metastatic tumor was significantly inferior in T2 model compared to T2+DWI model (p=0.03, Supplementary Table S3). The AUCs of T2+DWI reached 0.91, 0.873, and 0.876 for three categories, respectively, while in T2 model, the AUCs were 0.92, 0.885 and 0.842.
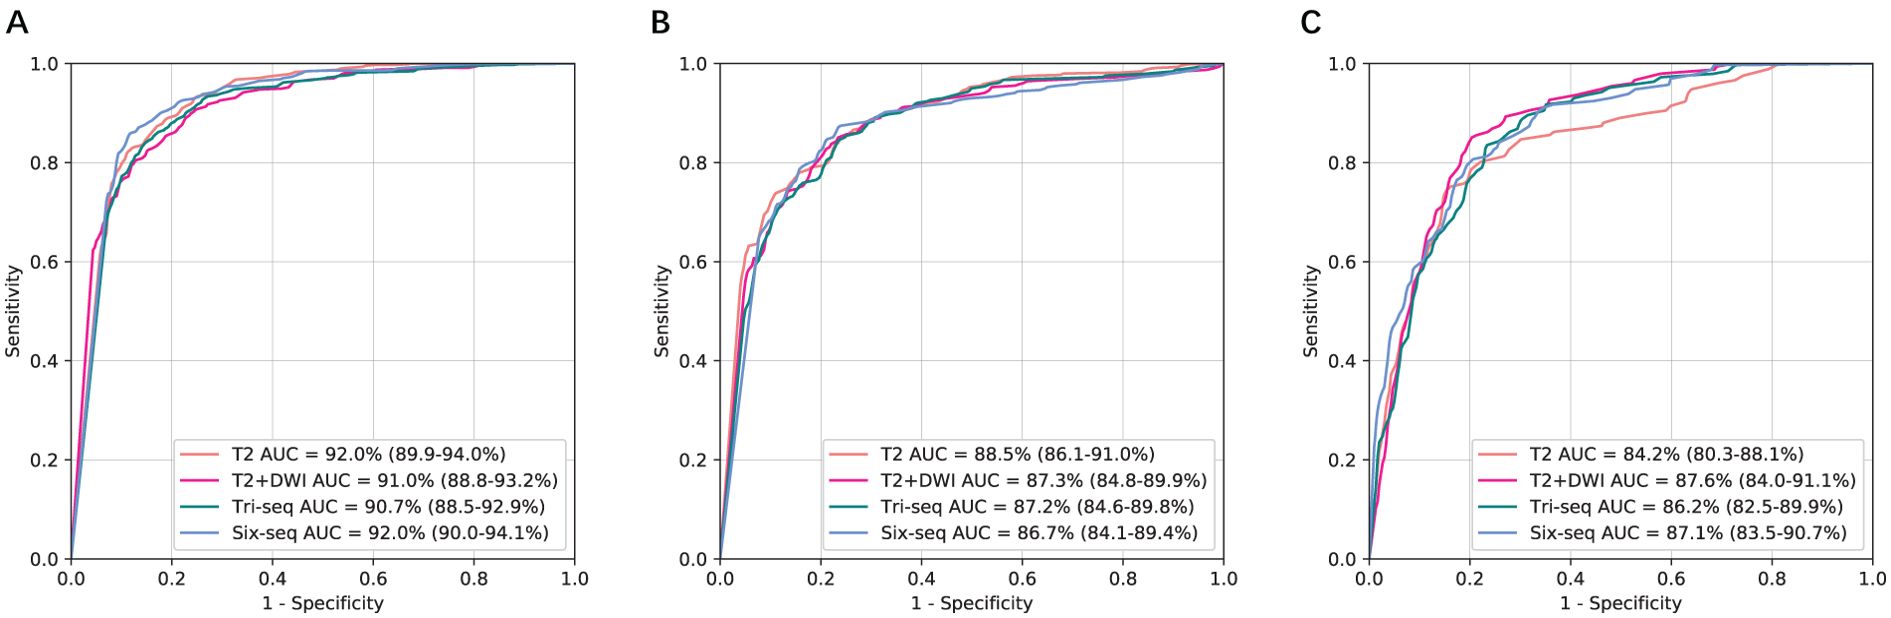
Figure 2. Comparison of receiver operating characteristic curves between T2, T2+DWI and Tri-Seq, Six-Seq models for the assessment of three categories in the independent SRRSH internal validation cohort. (A) Benign tumor versus malignancy. (B) Primary malignancy versus other lesions(benign and metastatic tumors). (C) Metastatic malignancy versus other lesions (benign and primary malignant tumors). SRRSH, Sir Run Run Shaw Hospital; AUC, area under the receiver operating characteristic curve; Tri-Seq, Three sequences; T2+DWI+Pre-contrast T1; Six-Seq, Six sequences; T2+DWI +Pre-contrast T1+ late arterial, portal venous, equilibrium phase.
To further examine generalizability, we tested the models on the two external independent cohorts beyond the SRRSH data (Figure 3). The AUCs on these two test datasets presented with similar trends to SRRSH validation set. On the HZFPH dataset, the performances of four models on three-way classification were not statistically different (p>0.05, Supplementary Table S3). However, on the TDH dataset, the AUCs of T2+DWI were significantly better than Six-Seq model with enhanced images (p<0.01, Supplementary Table S3), which might be related to the different contrast medium used in TDH validation set and SRRSH training set. The corresponding ROC curves were shown in Figures 3A–C and 2D–F.
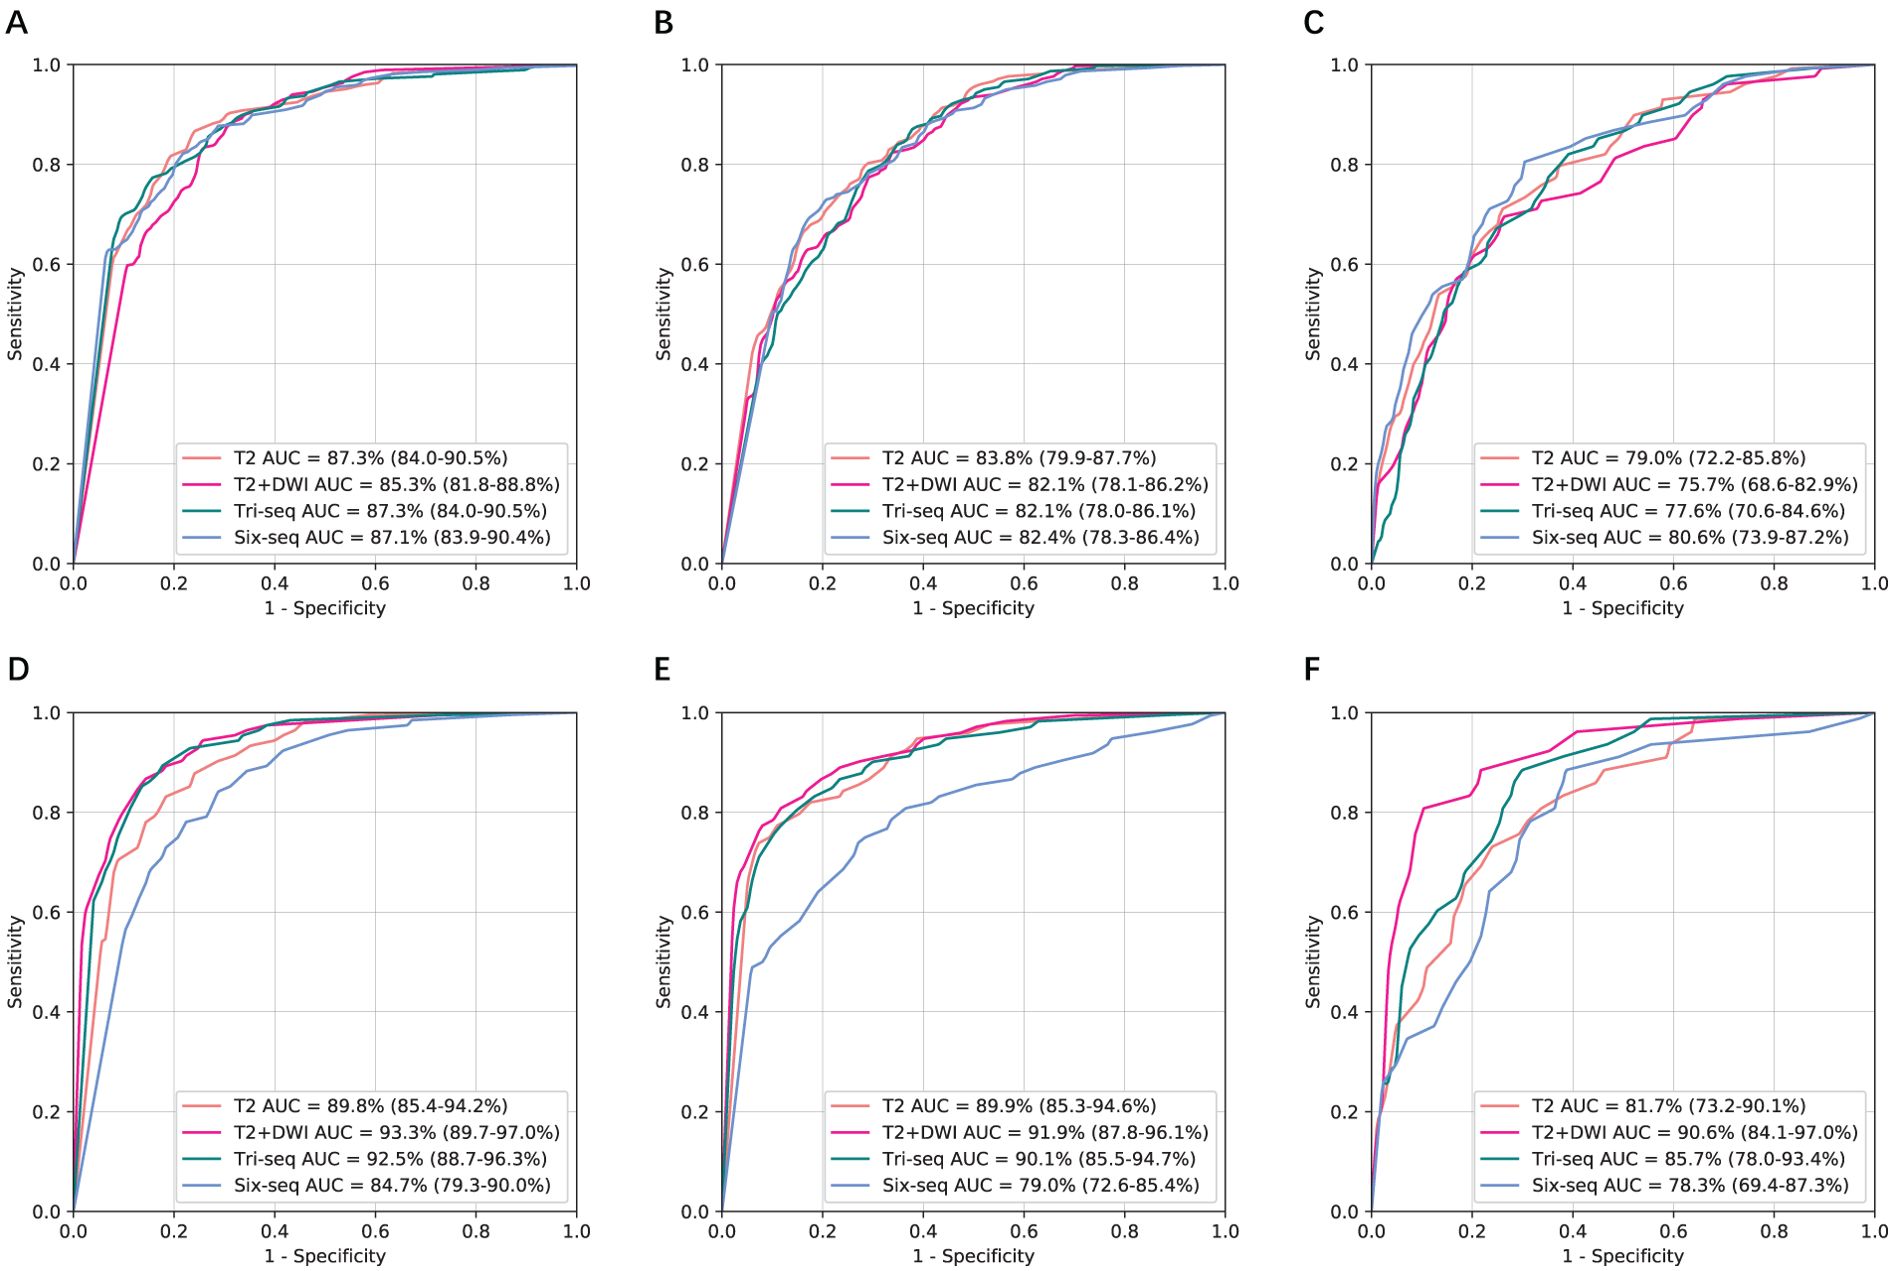
Figure 3. Comparison of receiver operating characteristic curves between T2, T2+DWI and Tri-Seq, Six-Seq models for the classification of three categories in two external validation cohorts.(A, D) Benign tumor versus malignancy. (B, E) Primary malignancy versus other lesions(benign and metastatic tumors). (C, F) Metastatic malignancy versus other lesions (benign and primary malignant tumors). (A-C) Hangzhou First People’s Hospital external independent validation set. (D-F) Zhejiang province Tongde Hospital external independent validation set. AUC, area under the receiver operating characteristic curve; Tri-Seq, Three sequences; T2+DWI+Pre-contrast T1; Six-Seq, Six sequences: T2+DWI +Pre-contrast T1+ late arterial, portal venous, equilibrium phase.
3.3 Diagnostic accuracy of non-contrast models
The performance of two models based on non-contrast images in classifying liver tumors on three independent validation datasets was shown in Figure 4. Their diagnostic accuracy showed no significant variation for classifying benign tumor and primary malignant tumor (P>0.05, Supplementary Table S3). However, T2+DWI exhibited a higher diagnostic accuracy compared with T2 for differentiating metastatic tumors from the other tumors, and differences of AUCs were all statistically significant (p<0.05, Supplementary Table S3) in SRRSH and TH datasets. The sensitivity and specificity analyses also demonstrated that T2+DWI was better than T2 (Supplementary Table S4) based on the comprehensive consideration about their performance on the three hospital datasets.
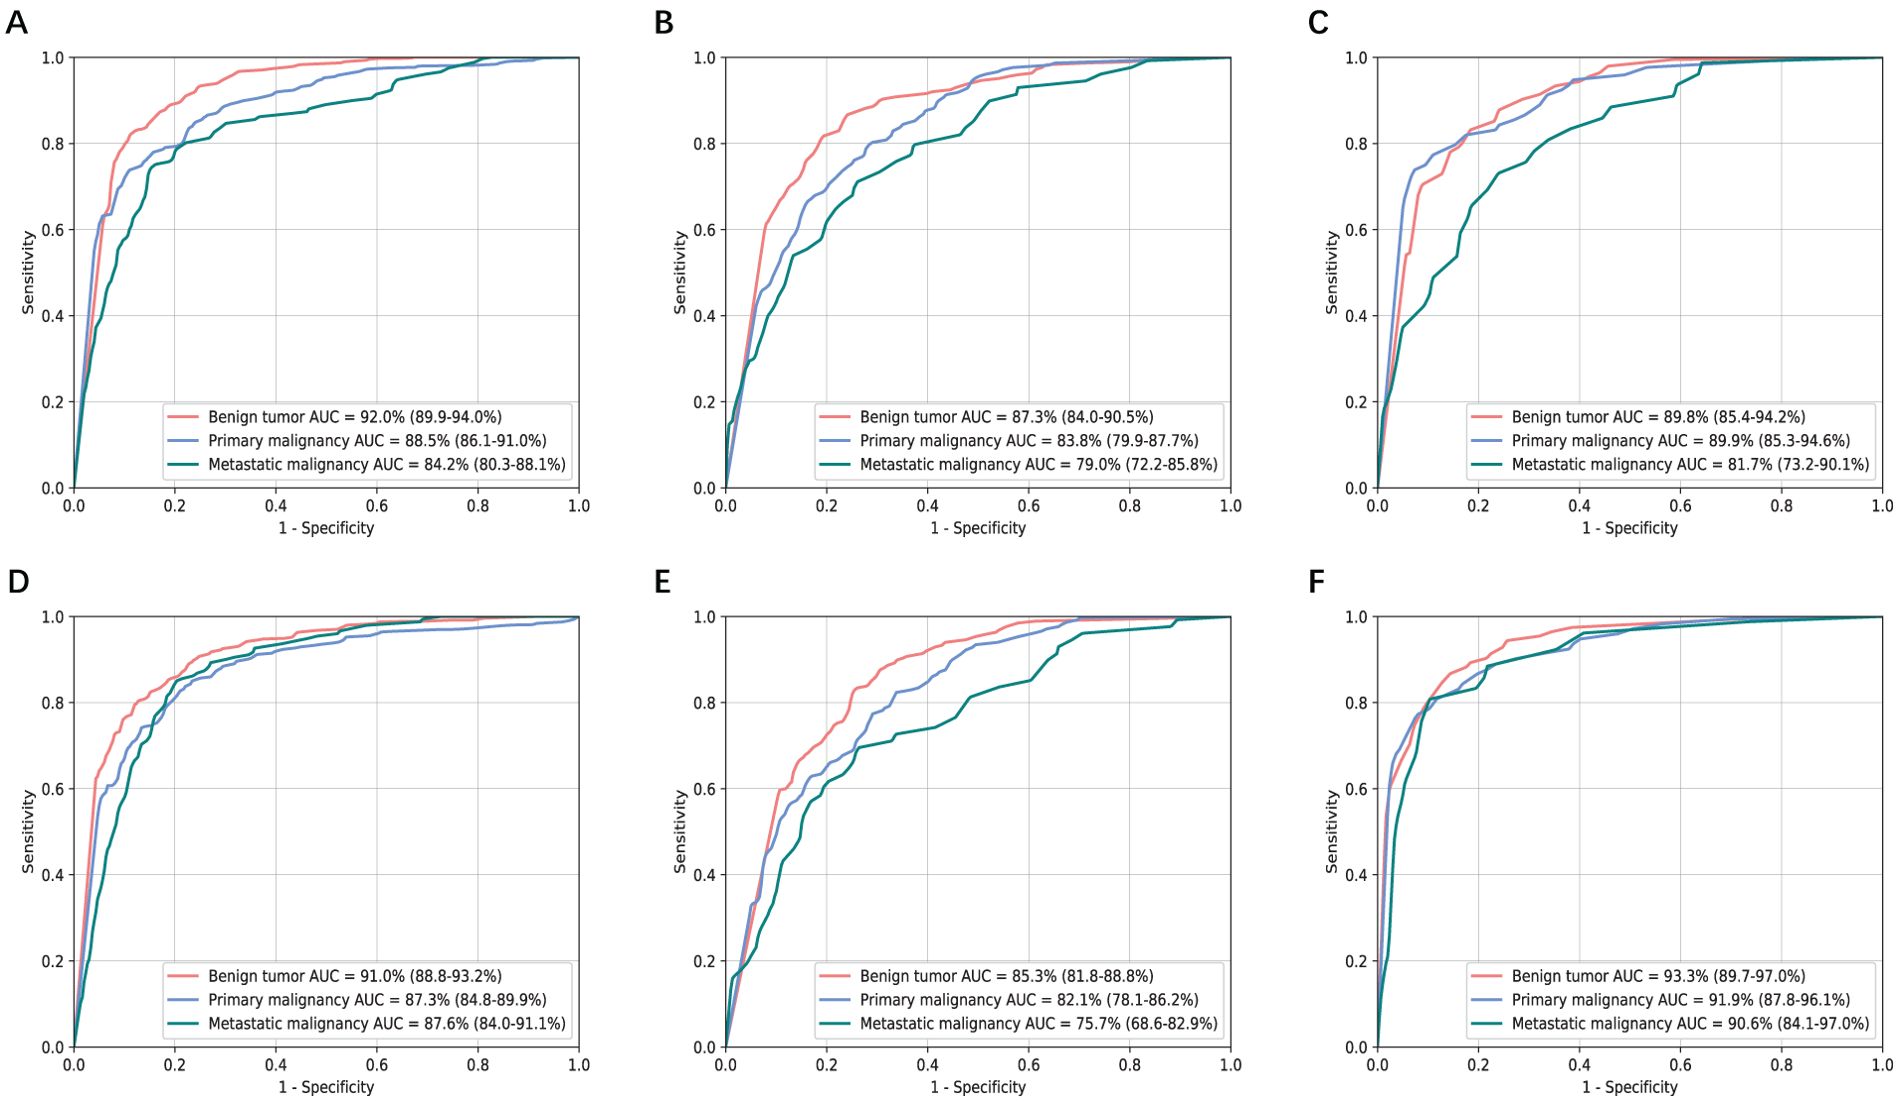
Figure 4. Receiver operating characteristic curves and area under the curve (AUC) analysis of two non-contrast models in three independent validation sets. (A-C) T2 model. (D-F) T2+DWI model. (A, D) Sir Run Run Shaw Hospital internal validation set. (B, E) Hangzhou First People’s Hospital external validation set. (C, F) Zhejiang province Tongde Hospital external validation set.
We examined the internal features learned by the CNNs of non-contrast models using t-SNE (t-distributed Stochastic Neighbor Embedding) (32) (Supplementary Figure S2). Each point represented a tumor image projected from the high-dimensional output of the CNN’s last hidden layer into two dimensions. The point cluster of benign tumors were basically split from those of malignant tumors, while the point clusters of two malignant categories were partly mixed. This indicated that the CNN could distinguish malignant images from benign images with a high accuracy, while more prediction errors occurred within the specific classifications of malignant tumors.
Figure 5 showed attention maps from eight types of cases to interpret the diagnostic mechanism of the neural networks. These lesions were difficult to distinguish on T2 by naked vision, while CNN models provided accurate diagnostic outcomes. The map quantified each pixel’s contribution to diagnosis by analyzing the lesion ROI. The red parts indicated areas that provided more related information during the network’s diagnostic process. The networks focused most of its attention on the tumor lesions themselves and ignored liver background.
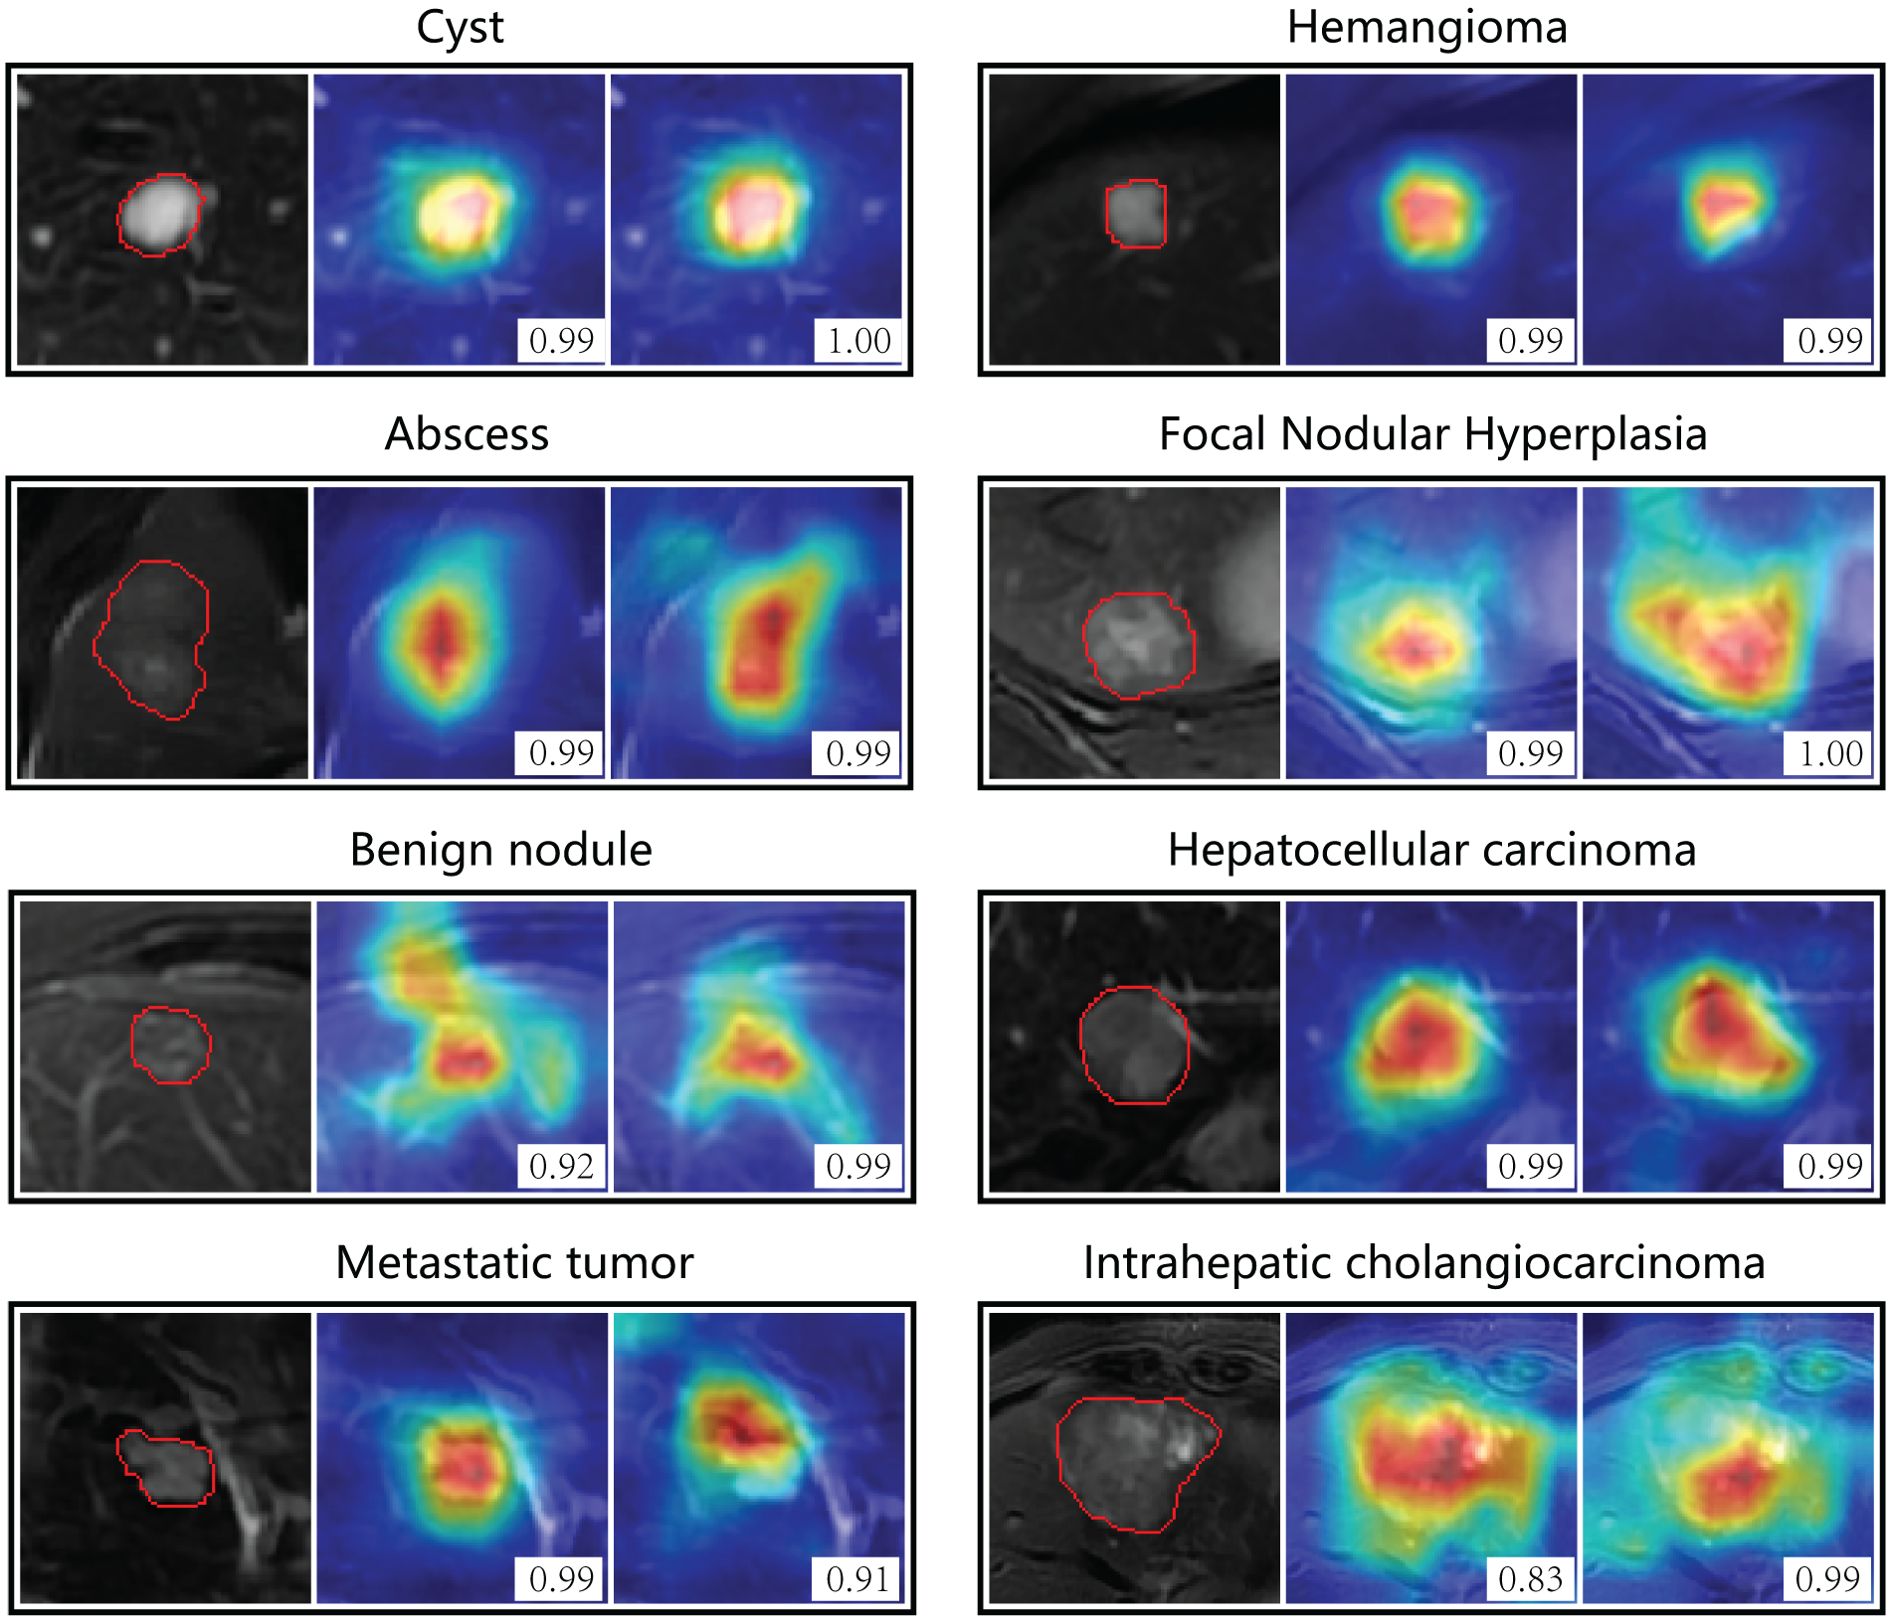
Figure 5. Attention maps of non-contrast models on eight types of focal liver lesions. The color-coded maps highlight regions which were most discriminative for a certain category. Red indicates the areas that contributed most, and blue areas contributed least. The left column is the region of interest from T2 image, the middle is the attention map of T2 model, and the right is attention map of T2+DWI model. The number in the picture indicates the probability of corresponding category predicted by the model. The original T2 images for each lesion were presented in Supplementary Figure S4.
3.4 Binary classification at the specific algorithm
In the performance analysis above, the prediction results about CNN models were all based on single 2-D MR image slice of liver tumor lesions. However, in clinical setting, one lesion with several image slices usually had only one diagnosis. Therefore, we tried to develop an algorithm which could combine the confidences at slice-level to predict the lesion-level confidence.
Firstly, the predicted vectors of all slices for each lesion were summed up and the category with the largest value was taken as the final diagnosis of the lesion. Then we obtained the diagnostic performance of the T2+DWI model on three independent test sets. Our study also conducted performance comparisons with radiologists. To ensure a fair comparison, the radiologists only relied on the T2 and DWI sequences to make independent diagnoses, while blinded to medical history and histopathological/radiological reports.
The ROC curves depicted in Figure 6 highlighted that T2+DWI model surpassed all radiologists in binary classification on three independent test sets, achieving an AUC of 0.935 (95% CI: 0.915-0.955), 0.902(0.858-0.946), 0.920(0.867-0.972). In particular, the model achieved superior performance in terms of accuracy, sensitivity, and specificity. The accuracy across three test sets was significantly higher than that of junior radiologists (P<0.05) and was comparable to that of senior radiologists. The sensitivities from the model were 0.908, 0.882, and 0.843, respectively. While superior to those of radiologists, these differences did not reach statistical significance.
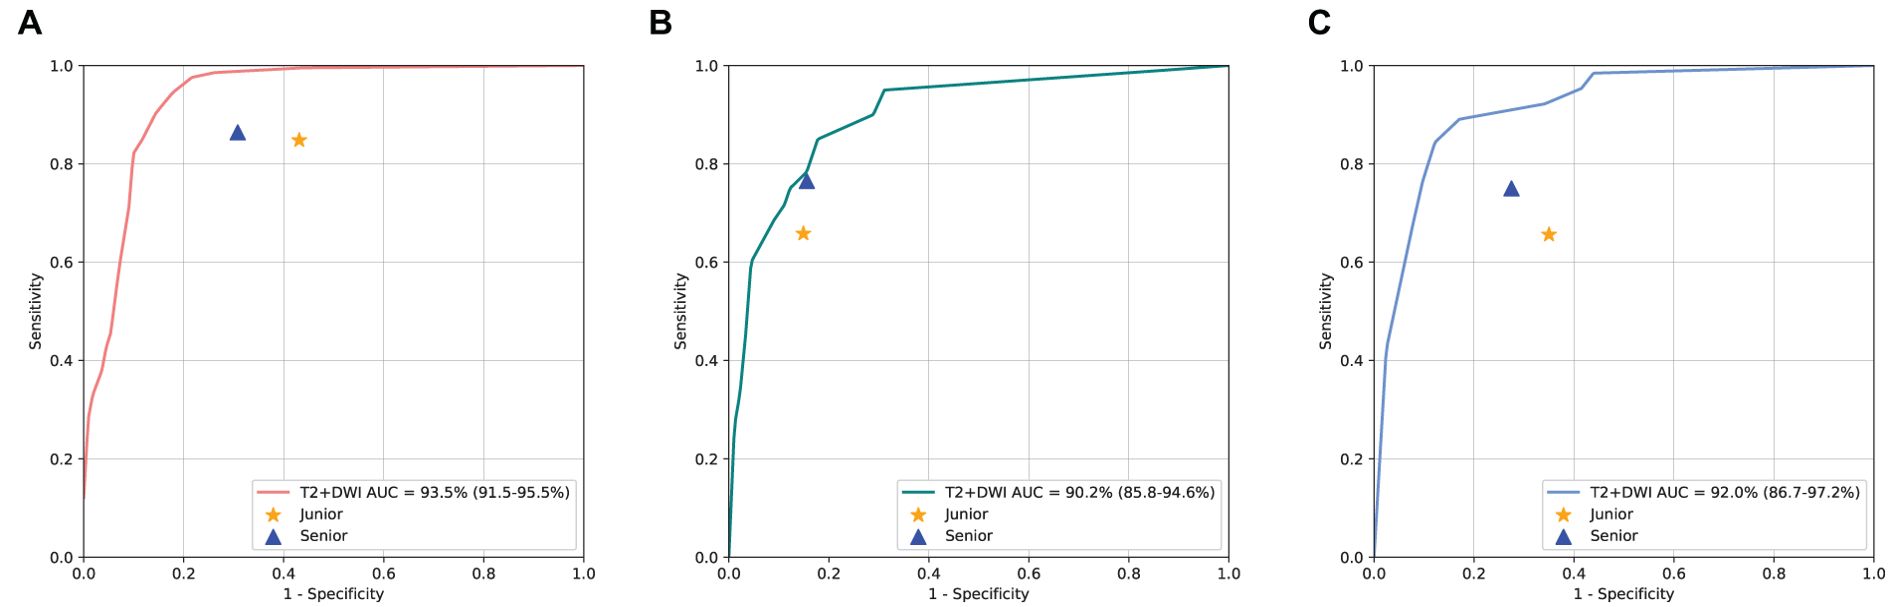
Figure 6. Performance Comparison of T2+DWI model with Radiologists on three dependent test sets. ROC curves for binary classification; (A) Sir Run Run Shaw Hospital internal validation set. (B) Hangzhou First People’s Hospital external validation set. (C) Zhejiang province Tongde Hospital external validation set.
In order to reduce the risk of delayed or missed care from false negatives, we further defined an algorithm as follows: the tumor was classified as benign only if all the related 2D slices were predicted negative, otherwise, once any of the slices was predicted as primary or metastatic malignancy, the tumor should be classified as malignant. Table 2 presented the sensitivity and specificity of T2 and T2+DWI model based on this rule, along with the corresponding positive and negative DLRs.
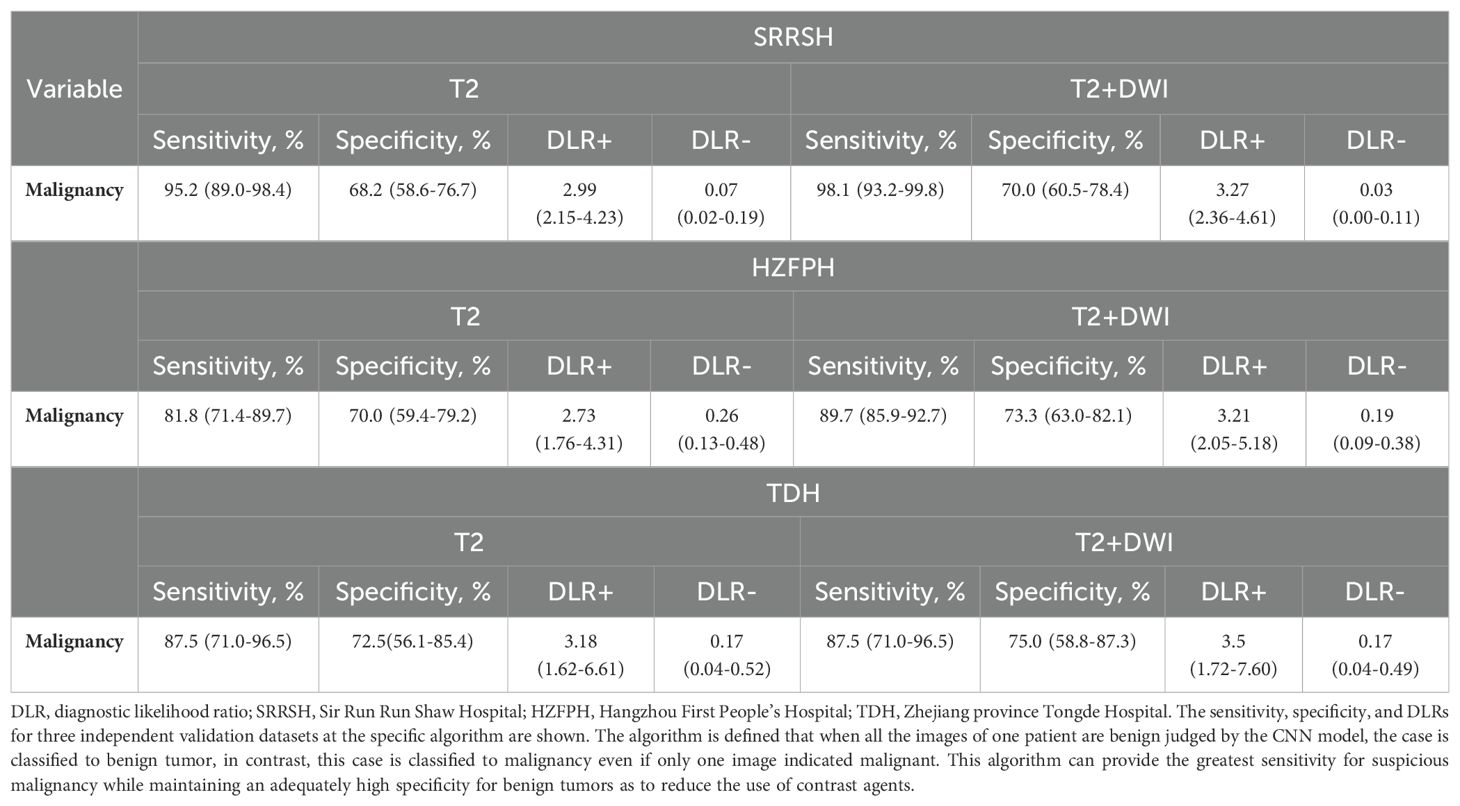
Table 2. Sensitivity, specificity, and diagnostic Likelihood Ratio testing associated with T2 and T2+DWI models at specific algorithm.
The sensitivities of malignant tumors gained from T2 model were 95.2%, 81.8%, and 87.5% in SRRSH, HZFPH and TDH datasets, respectively, and the corresponding results in T2+DWI model were 98.1%, 89.7%, and 87.5% respectively, while all specificities were almost greater than 70%. These results indicated that our models could identify over 95% patients with malignancy at best using non-contrast images, and more than 70% of patients with benign tumors could have the opportunity to avoid a further inspection using contrast mediums.
4 Discussion
In this multicenter study, we investigated whether different categories of liver tumor could be differentiated by deep learning CNN models using only non-contrast MRI. Compared with the multi-sequence model using enhanced images, Model T2 and T2+DWI showed similar performances on classifying liver masses into benign liver tumors, primary malignancy and metastatic malignancy. Their robustness and generality were demonstrated in three independent validation datasets. Moreover, under the defined algorithm, they could identify more than 98% malignancy and over 70% benign lesions at best. To the best of our knowledge, this is currently the largest study in the field of deep-learning-assisted liver tumor diagnosis based on non-contrast MR images worldwide, which has the most variable types of focal liver lesions.
To date, there are hardly few studies that explore the feasibility of non-contrast MRI for classifying liver tumors using deep learning (27, 33). Previous studies are usually based on enhanced images and smaller datasets (n< 500 patients). In contrast, our model exhibited a robust performance on multiple independent, real-world, heterogeneous datasets (acquired with many different imaging protocols and scanners, Supplementary Table S1), independent of differences in patient demographics. Although the six-seq model added with enhanced images did not perform better than the non-contrast models on validation sets, it should still be noted that its performance might be underestimated owing to the incomplete registration between enhanced sequences and non-enhanced sequences. Especially in the TDH set, the performance of the six-sequence model was significantly weaker than the T2 model. It might result from different contrast media (Supplementary Table S1) used in Tongde hospital (Gadodiamide, 0.1mmol/kg) and SRRSH (Gadopentetate dimeg-lumine, 0.2 mmol/kg) that lead to different enhanced-image features in TDH validation set compared with the training set.
As for non-contrast models in this study, T2+DWI showed similar diagnostic efficacy with T2 for classifying liver tumors. However, given that the excellent performance of DWI sequence in detecting small malignant lesion (<2cm) (34), T2+DWI should be the better choice in clinical application. After all, the problem of automatic tumor detection was not considered in this study. Moreover, for the TDH validation set with high-quality DWI images, the performance of T2+DWI was better than that of T2 model, in contrast, the results of the other two larger datasets with worse diffusion images were not improved. These results indicated that the performance of T2+DWI model was highly associated with the quality of diffusion images.
For three-way classification per image, it is commonly seen that differentiating metastatic malignancy from the other two categories is more challenging in non-contrast models. Many metastatic tumors were mis-predicted primary malignancy. This is because the heterogeneity of metastatic lesions is more severe owing to diverse primary tumor sites and histological types, and the proportion of this category (11.5%, 4836/42150) was much less than that of images with other categories in the training set. The current CNN models still have tremendous room for improvements, and it is likely that CNN may achieve better sensitivity in assessing metastatic tumors, if the sample population of this category could be further extended in future studies. Similarly, this situation has also been observed in some rare types of two other categories, such as adenoma, ICC, small highly differentiated HCC, etc., which were more likely to be misclassified.
The non-contrast models achieved basically satisfactory diagnosis accuracy at image-level, encouraging further exploration of its utility at patient-level. According to our defined rule, over 95% of patients with malignant tumors in SRRSH validation set were correctly judged, with a bit inferior about this indicator in two other datasets. However, an inspection of misclassifications also provided excellent feedback for our models (see Supplementary Figure S3, confusion matrix). These errors are mostly concentrated in the intrahepatic cholangiocarcinoma without typical image manifestations, and usually all images of the lesion are misjudged. For example, two ICCs from HFPH were considered as inflammatory granuloma and epithelial hemangioendothelioma respectively in formal radiology reports. These tumors were underrepresented in the training set and typically had a benign-looking appearance.
To the best of our knowledge, this is the largest multicenter study that aimed to analyze the diagnostic performance of non-contrast MRI for liver tumors by means of deep neural networks, covering the most variable types of focal liver lesions. This system could be applicable to get the first-step judgement for patients with liver masses by non-contrast MRI, and then potential malignant patients be selected for further enhanced inspections with suitable contrast agents. It could be beneficial especially for the patients that require multiple follow-up MRIs, such as those with benign lesions, or at relatively high risk of liver metastasis, or post liver cancer resection, etc., which can avoid unnecessary enhanced testing to reduce side effects and financial costs.
The work presented here has limitations. First, as our study population was composed of those have confirmed focal liver lesions (usually >1cm), our study results should be interpreted with caution. Future studies need to involve more patients with <1cm small lesions, especially those at high risk of HCC or metastasis. Prospective studies focusing on these specific populations will be more convincing. Second, our study performed in a diagnostic setting, thus the detection ability to lesions under non-contrast MRI needs to be further demonstrated. Fortunately, some studies have provided optimistic evidence. Non-contrast MRI showed high sensitivity and specificity for detecting HCCs in the early stage and in high-risk HCC patients under the evaluation of radiologists (11, 12, 14, 35, 36). In the study of Kim et al (26), a fully automated deep learning model outperformed less experienced radiologists in detecting very small HCCs using hepatobiliary phase MR images. From this perspective, we have reason to believe that the deep learning model using T2 and DWI images may also have a higher detection performance than human readers. Third, future studies need to involve more patients of small number of types in a large scale, as well as to achieve an equal distribution of patients in major categories, to make the deep learning model better trained. Moreover, the model itself also needs to be further developed with more comprehensive integration of other clinical data, such as medical history, tumor markers, other serological results, etc., which are valuable for tumor diagnosis.
In summary, using DL algorithms, NC-MRI provided accurate diagnosis for liver tumors in classifying to benign, primary malignancy and metastatic tumors. Moreover, the sensitivity of malignant tumors achieved significant improvement at the patient-level algorithm. In the independent internal and external cohorts, the models also showed excellent robustness. The developed DL model has potential to be used for benign tumors follow-up, surveillance of HCC and liver metastasis that need regular repetitive examinations in high-risk patients, yet further prospective studies are still needed before applied to real-world clinical settings.
Data availability statement
The data analyzed in this study is subject to the following licenses/restrictions: The original contributions presented in the study are included in the article/Supplementary Material. Further inquiries can be directed to the corresponding authors. Requests to access these datasets should be directed to MTE3MTgyODdAemp1LmVkdS5jbg==.
Ethics statement
The studies involving humans were approved by the Institutional Review Board of Sir Run Run Shaw Hospital (SRRSH). The studies were conducted in accordance with the local legislation and institutional requirements. Written informed consent for participation was not required from the participants or the participants’ legal guardians/next of kin in accordance with the national legislation and institutional requirements.
Author contributions
SZ: Conceptualization, Data curation, Formal Analysis, Funding acquisition, Supervision, Writing – original draft, Writing – review & editing. PZ: Methodology, Project administration, Software, Writing – original draft. HH: Investigation, Methodology, Project administration, Software, Supervision, Visualization, Writing – original draft. ZJ: Data curation, Formal Analysis, Writing – original draft. YJ: Formal Analysis, Methodology, Project administration, Software, Supervision, Writing – original draft. JS: Conceptualization, Supervision, Validation, Writing – original draft. LZ: Data curation, Writing – original draft. MR: Data curation, Formal Analysis, Writing – original draft. QC: Data curation, Formal Analysis, Writing – original draft. YW: Data curation, Project administration, Writing – original draft. YT: Methodology, Project administration, Supervision, Writing – original draft. WLuo: Methodology, Project administration, Software, Writing – original draft. MC: Investigation, Methodology, Project administration, Software, Writing – original draft. ZQ: Data curation, Formal Analysis, Writing – original draft. WLu: Data curation, Formal Analysis, Methodology, Writing – original draft. HL: Supervision, Visualization, Writing – review & editing. XC: Conceptualization, Funding acquisition, Writing – review & editing.
Funding
The author(s) declare that financial support was received for the research and/or publication of this article. This work was supported by grants from the National Natural Science Foundation of China (81827804 to X.C.); Zhejiang Provincial Health Commission, Youth Innovation Talent Support Program (2023RC177 to S.Z.); Zhejiang Provincial Natural Science Foundation, Provincial Natural Science Foundation / Exploratory Project / Youth Exploratory Program (LQ23H160038 to S.Z.).
Acknowledgments
The authors appreciate the study participants, as well as researchers and staff in the groups of Professor Cai, Professor Hu and Professor Lin.
Conflict of interest
The authors declare that the research was conducted in the absence of any commercial or financial relationships that could be construed as a potential conflict of interest.
Generative AI statement
The author(s) declare that no Generative AI was used in the creation of this manuscript.
Publisher’s note
All claims expressed in this article are solely those of the authors and do not necessarily represent those of their affiliated organizations, or those of the publisher, the editors and the reviewers. Any product that may be evaluated in this article, or claim that may be made by its manufacturer, is not guaranteed or endorsed by the publisher.
Supplementary material
The Supplementary Material for this article can be found online at: https://www.frontiersin.org/articles/10.3389/fonc.2025.1582322/full#supplementary-material
References
1. Siegel RL, Miller KD, Wagle NS, and Jemal A. Cancer statistics, 2023. CA Cancer J Clin. (2023) 73:17–48. doi: 10.3322/caac.21763
2. Singal AG, Kanwal F, and Llovet JM. Global trends in hepatocellular carcinoma epidemiology: implications for screening, prevention and therapy. Nat Rev Clin Oncol. (2023) 20:864–84. doi: 10.1038/s41571-023-00825-3
3. Goodwin TJ, Zhou Y, Musetti SN, Liu R, and Huang L. Local and transient gene expression primes the liver to resist cancer metastasis. Sci Transl Med. (2016) 8:364ra153. doi: 10.1126/scitranslmed.aag2306
4. Yasaka K, Akai H, Abe O, and Kiryu S. Deep learning with convolutional neural network for differentiation of liver masses at dynamic contrast-enhanced CT: A preliminary study. Radiology. (2018) 286:887–96. doi: 10.1148/radiol.2017170706
5. Grazioli L, Ambrosini R, Frittoli B, Grazioli M, and Morone M. Primary benign liver lesions. Eur J Radiol. (2017) 95:378–98. doi: 10.1016/j.ejrad.2017.08.028
6. Marrero JA, Ahn J, Rajender Reddy K, and Americal College of G. ACG clinical guideline: the diagnosis and management of focal liver lesions. Am J Gastroenterol. (2014) 109:1328–48. doi: 10.1038/ajg.2014.213
7. Llovet JM, Kelley RK, Villanueva A, Singal AM, Pikarsky E, Roayaie S, et al. Hepatocellular carcinoma. Nat Rev Dis Primers. (2021) 7:6. doi: 10.1038/s41572-020-00240-3
8. Kim SY, An J, Lim YS, Han S, Lee JY, Byun JH, et al. MRI with liver-specific contrast for surveillance of patients with cirrhosis at high risk of hepatocellular carcinoma. JAMA Oncol. (2017) 3:456–63. doi: 10.1001/jamaoncol.2016.3147
9. Westwood M, Joore M, Grutters J, Redekop WK, Armstrong N, Lee K, et al. Contrast-enhanced ultrasound using SonoVue(R) (sulphur hexafluoride microbubbles) compared with contrast-enhanced computed tomography and contrast-enhanced magnetic resonance imaging for the characterisation of focal liver lesions and detection of liver metastases: a systematic review and cost-effectiveness analysis. Health Technol Assess. (2013) 17:1–243. doi: 10.3310/hta17090
10. Park HJ, Jang HY, Kim SY, Lee SJ, Won HJ, Byun JH, et al. Non-enhanced magnetic resonance imaging as a surveillance tool for hepatocellular carcinoma: Comparison with ultrasound. J Hepatol. (2020) 72:718–24. doi: 10.1016/j.jhep.2019.12.001
11. Whang S, Choi MH, Choi JI, Youn SY, Kim DH, and Rha SE. Comparison of diagnostic performance of non-contrast MRI and abbreviated MRI using gadoxetic acid in initially diagnosed hepatocellular carcinoma patients: a simulation study of surveillance for hepatocellular carcinomas. Eur Radiol. (2020) 30:4150–63. doi: 10.1007/s00330-020-06754-4
12. Kim JS, Lee JK, Baek SY, and Yun HI. Diagnostic performance of a minimized protocol of non-contrast MRI for hepatocellular carcinoma surveillance. Abdom Radiol (NY). (2020) 45:211–9. doi: 10.1007/s00261-019-02277-9
13. Kim YK, Kim YK, Park HJ, Park MJ, Lee WJ, and Choi D. Noncontrast MRI with diffusion-weighted imaging as the sole imaging modality for detecting liver Malignancy in patients with high risk for hepatocellular carcinoma. Magn Reson Imaging. (2014) 32:610–8. doi: 10.1016/j.mri.2013.12.021
14. Han S, Choi JI, Park MY, Choi MH, Rha SE, and Lee YJ. The diagnostic performance of liver MRI without intravenous contrast for detecting hepatocellular carcinoma: A case-controlled feasibility study. Korean J Radiol. (2018) 19:568–77. doi: 10.3348/kjr.2018.19.4.568
15. Ghorra C, Pommier R, Piveteau A, Rubbia-Brandt L, Vilgrain V, Terraz S, et al. The diagnostic performance of a simulated “short” gadoxetic acid-enhanced MRI protocol is similar to that of a conventional protocol for the detection of colorectal liver metastases. Eur Radiol. (2021) 31:2451–60. doi: 10.1007/s00330-020-07344-0
16. Hwang JA, Kim YK, Min JH, Song KD, Sohn I, and Ahn HS. Non-contrast liver MRI as an alternative to gadoxetic acid-enhanced MRI for liver metastasis from colorectal cancer. Acta Radiol. (2019) 60:441–50. doi: 10.1177/0284185118788901
17. Canellas R, Rosenkrantz AB, Taouli B, Sala E, Saini S, Pedrosa I, et al. Abbreviated MRI protocols for the abdomen. Radiographics. (2019) 39:744–58. doi: 10.1148/rg.2019180123
18. Yamaguchi T, Sofue K, Ueshima E, Ueno Y, Tsujita Y, Yabe S, et al. Abbreviated gadoxetic acid-enhanced MRI for the detection of liver metastases in patients with potentially resectable pancreatic ductal adenocarcinoma. J Magn Reson Imaging. (2022) 56:725–36. doi: 10.1002/jmri.28059
19. Levine D, McDonald RJ, and Kressel HY. Gadolinium retention after contrast-enhanced MRI. JAMA. (2018) 320:1853–4. doi: 10.1001/jama.2018.13362
20. Fowler KJ, Brown JJ, and Narra VR. Magnetic resonance imaging of focal liver lesions: Approach to imaging diagnosis. Hepatology. (2011) 54:2227–37. doi: 10.1002/hep.24679
21. Winder M, Grabowska S, Hitnarowicz A, Barczyk-Gutkowska A, Gruszczyńska K, and Steinhof-Radwańska K. The application of abbreviated MRI protocols in Malignant liver lesions surveillance. Eur J Radiol. (2023) 164:110840. doi: 10.1016/j.ejrad.2023.110840
22. Ronot M, Nahon P, and Rimola J. Screening of liver cancer with abbreviated MRI. Hepatology. (2023) 78:670–86. doi: 10.1097/HEP.0000000000000339
23. LeCun Y, Bengio Y, and Hinton G. Deep learning. Nature. (2015) 521:436–44. doi: 10.1038/nature14539
24. Bi WL, Hosny A, Schabath MB, Giger ML, Birkbak NJ, Mehrtash A, et al. Artificial intelligence in cancer imaging: Clinical challenges and applications. CA Cancer J Clin. (2019) 69:127–57. doi: 10.3322/caac.21552
25. Yamashita R, Mittendorf A, Zhu Z, Fowler K, Santillan C, Sirlin C, et al. Deep convolutional neural network applied to the liver imaging reporting and data system (LI-RADS) version 2014 category classification: a pilot study. Abdominal Radiol. (2020) 45:24–35. doi: 10.1007/s00261-019-02306-7
26. Kim J, Min JH, Kim SK, Shin S-Y, and Lee MW. Detection of hepatocellular carcinoma in contrast-enhanced magnetic resonance imaging using deep learning classifier: A multi-center retrospective study. Sci Reports. (2020) 10:9458. doi: 10.1038/s41598-020-65875-4
27. Zhen SH, Cheng M, Tao YB, Wang Y, Juengpanich S, Jiang Z, et al. Deep learning for accurate diagnosis of liver tumor based on magnetic resonance imaging and clinical data. Front Oncol. (2020) 10:680. doi: 10.3389/fonc.2020.00680
28. Wang CJ, Hamm CA, Savic LJ, Ferrante M, Schobert I, Schlachter T, et al. Deep learning for liver tumor diagnosis part II: convolutional neural network interpretation using radiologic imaging features. Eur Radiol. (2019) 29:3348–57. doi: 10.1007/s00330-019-06214-8
29. Bossuyt PM, Reitsma JB, Bruns DE, Gatsonis CA, Glasziou PP, Irwig L, et al. STARD 2015: an updated list of essential items for reporting diagnostic accuracy studies. BMJ. (2015) 351:h5527. doi: 10.1136/bmj.h5527
30. Shao L, Zhu F, and Li X. Transfer learning for visual categorization: A survey. IEEE Trans Neural Networks Learn Syst. (2015) 26:1019–34. doi: 10.1109/TNNLS.2014.2330900
31. Selvaraju RR, Cogswell M, Das A, Vedantam R, Parikh D, and Batra D. (2017). Grad-CAM: visual explanations from deep networks via gradient-based localization. In: Proceedings of the IEEE International Conference on Computer Vision (ICCV). pp. 618–26. doi: 10.1109/ICCV.2017.74
33. Trivizakis E, Manikis GC, Nikiforaki K, Drevelegas K, Constantinides M, and Drevelegas A. Extending 2-D convolutional neural networks to 3-D for advancing deep learning cancer classification with application to MRI liver tumor differentiation. IEEE J BioMed Health Inform. (2019) 23:923–30. doi: 10.1109/JBHI.6221020
34. Park M-S, Kim S, Patel J, Hajdu C, Do R, Mannelli L, et al. Hepatocellular carcinoma: Detection with diffusion-weighted versus contrast-enhanced magnetic resonance imaging in pretransplant patients. Hepatology. (2012) 56:140–8. doi: 10.1002/hep.25681
35. Chan MV, McDonald SJ, Ong Y-Y, Mastrocostas L, Ho E, Huo Y, et al. HCC screening: assessment of an abbreviated non-contrast MRI protocol. Eur Radiol Exp. (2019) 3:49. doi: 10.1186/s41747-019-0126-1
Keywords: deep learning, liver tumor, classification, non-contrast, magnetic resonance imaging
Citation: Zhen S, Zhang P, Huang H, Jiang Z, Jiang Y, Sun J, Zhang L, Ruan M, Chen Q, Wang Y, Tao Y, Luo W, Cheng M, Qi Z, Lu W, Lin H and Cai X (2025) Deep learning-assisted diagnosis of liver tumors using non-contrast magnetic resonance imaging: a multicenter study. Front. Oncol. 15:1582322. doi: 10.3389/fonc.2025.1582322
Received: 24 February 2025; Accepted: 13 May 2025;
Published: 10 July 2025.
Edited by:
Xian-Ning Wu, University of Science and Technology of China, ChinaReviewed by:
Xiwen Bi, Sun Yat-sen University Cancer Center (SYSUCC), ChinaYutao Wang, Ningbo First Hospital, China
Copyright © 2025 Zhen, Zhang, Huang, Jiang, Jiang, Sun, Zhang, Ruan, Chen, Wang, Tao, Luo, Cheng, Qi, Lu, Lin and Cai. This is an open-access article distributed under the terms of the Creative Commons Attribution License (CC BY). The use, distribution or reproduction in other forums is permitted, provided the original author(s) and the copyright owner(s) are credited and that the original publication in this journal is cited, in accordance with accepted academic practice. No use, distribution or reproduction is permitted which does not comply with these terms.
*Correspondence: Xiujun Cai, c3Jyc2hfY3hqQHpqdS5lZHUuY24=; Hai Lin, bGluQGNhZC56anUuZWR1LmNu; Shihui Zhen, MTE3MTgyODdAemp1LmVkdS5jbg==
†These authors share first authorship