 Max Bieder
 Markus Böhm2†
- 1Department of Radiotherapy and Radiation Oncology, Jena University Hospital, Friedrich-Schiller University Jena, Jena, Germany
- 2Institute for Medical Statistics, Computer Science and Data Science (IMSID), Jena University Hospital, Jena, Germany
- 3Department for Human Medicine, MSH Medical School Hamburg, Hamburg, Germany
- 4Department of Radiation Oncology, Helios Hospitals Schwerin, Schwerin, Germany
- 5Department of Radiotherapy and Radiation Oncology, University Hospital Würzburg, Würzburg, Germany
Introduction: Current evidence on atlas-based auto-segmentation (ABS) in radiotherapy primarily addresses organs at risk, whereas its application for clinical target volume (CTV) delineation remains insufficiently explored. Additionally, the optimal number of datasets required for ABS atlases is debated. This study investigates ABS performance for automated CTV (aCTV) segmentation in anal cancer patients with 18F-fluorodeoxyglucose positron emission tomography/computed tomography (18F-FDG PET-CT)-positive lymph node (LN) metastases, using varying atlas sizes.
Methods: A retrospective analysis was conducted on 51 anal cancer patients who underwent 18F-FDG PET-CT-based treatment planning between 2009 and 2018. Patients with FDG-positive LN metastases were identified. Manual CTV (mCTV) delineation was performed in accordance with the UK National Guidance for IMRT in Anal Cancer. The resulting 51 mCTV datasets were integrated into a single ABS atlas, which was used to generate aCTVs for the 27 patients with FDG-positive LN metastases. For each of these 27 patients, five different atlas sizes (n = 10, 20, 30, 40, 50) were evaluated using a leave-one-out approach. Automated and manual CTVs were compared using the Dice Similarity Index (DSI), the percentage of FDG-positive LNs adequately covered, and volumes either erroneously included (mistakenly contoured volume, MCV) or omitted (not contoured volume, NCV) by the ABS process
Results: Of the 51 patients, 27 (52.9%) had FDG-positive LN metastases. The mean DSI for atlas sizes of n = 10, 20, 30, 40, and 50 were 0.73, 0.78, 0.79, 0.79, and 0.80, respectively. A DSI ≥ 0.7 was achieved in 24 patients (88.9%) across all atlas sizes. The increase in DSI between n = 10 and n = 40 was statistically significant (Bonferroni-adjusted p < 0.05). Mean relative NCV and MCV ranged from 21.8–23.9% and 17.7–19.5% of the respective mCTV volume, with decreasing trends as atlas size increased. Segmentation inaccuracies predominantly occurred in the upper mesorectal and lower ischiorectal regions.
Discussion: In conclusion, ABS facilitates the delineation of CTVs in anal cancer patients and improves contouring efficiency. However, manual correction by radiation oncologists remains necessary.
1 Introduction
Although anal cancer is relatively rare, its incidence has been increasing over the past two decades. The standard treatment involves combined chemoradiotherapy (1, 2). Accurate and efficient delineation of regions of interest (ROIs) is essential for radiotherapy planning, as precise calculation of the spatial dose distribution depends on objective and reproducible segmentation of both organs at risk (OARs) and tumor volumes, including the gross tumor volume (GTV) and the clinical target volume (CTV) (3). The CTV encompasses areas at risk of subclinical disease spread, such as lymphatic drainage regions, which are often not clearly visualized on planning computed tomography (CT) scans. Since prognosis in anal carcinoma is closely linked to lymph node (LN) metastases, accurate definition of the CTV and adequate dosimetric coverage of both macroscopic and microscopic disease are critical (4).
Manual delineation of ROIs is labor-intensive and time-consuming. Given the association between delays in radiotherapy and poorer clinical outcomes (5), there is a pressing need to streamline this process without compromising quality. This need is particularly acute in advanced techniques that require repeated planning, such as adaptive radiotherapy addressing anatomical changes throughout the treatment course.
Automated segmentation methods offer a promising alternative to manual contouring. A wide array of auto-segmentation techniques has been developed, aiming to enhance efficiency and reproducibility in the delineation of OARs. Early approaches involved basic image processing methods such as intensity thresholding, region growing, and heuristic edge detection (6). These were followed by region- and probability-based methods, and later by single-atlas and multi-atlas-based segmentation (ABS), the latter of which has become widely adopted in clinical practice (7).
More recently, deep learning (DL) models have been introduced and have demonstrated superior accuracy compared to ABS in ROI segmentation across various anatomical regions (8, 9). However, DL models require large, high-quality datasets (7), extended training times on high-performance graphics processing unit (GPU) clusters (10–12), and are susceptible to overfitting. Their complex, multilayered architectures complicate retraining, guideline updates, and reproducibility (6, 10). As a result, ABS remains the standard in many clinical workflows.
To date, most ABS studies have focused on the automated segmentation of OARs (13), with validation studies in anatomical sites such as the brain (14), head and neck (15), thorax (12, 16) and prostate (13), emphasizing segmentation accuracy and contour reproducibility. In contrast, automated segmentation of target volumes remains underexplored and more challenging, primarily due to tumor- or treatment-induced anatomical distortions. Automated tools often struggle to accurately segment the primary tumor region. However, the lymphatic drainage areas, particularly in cases without major anatomical alterations due to surgery or extensive lesions, are more consistently identifiable. In anal cancer, where such conditions are frequently met, ABS tools may be capable of reliably segmenting the pelvic lymphatic drainage pathways, and hence the CTV.
Nonetheless, auto-segmentation in the pelvic region presents specific challenges (17). The normal anatomy is highly variable, with organs such as the bladder, bowel, and genital structures exhibiting significant intra- and inter-patient variability in shape, filling status, and position (7, 18). Moreover, it remains uncertain whether atlas-based – therefore anatomically-based CTV segmentation adequately includes LNs that are involved but lack clear CT morphological criteria of malignancy. Therefore, Fluorodeoxyglucose positron emission tomography/computed tomography (18F-FDG PET-CT) is recommended during initial staging for the detection of LN metastases (19–21), offering high sensitivity (93%) and is considered a reference standard (22–25). The distribution of pathological and non-pathological LNs varies significantly between individuals, potentially leading to complex and unexpected anatomical patterns. Dapper et al. reported that approximately 20% of FDG-positive LNs in the inguinal, paraaortic, and common iliac regions were located outside of the areas covered by existing pelvic lymphatic delineation guidelines (26). This contributes to inter-observer variability and complicates consistent CTV definitions, particularly when evaluating automated segmentation performance.
To the best of the authors’ knowledge, only seven studies have addressed ABS-based CTV delineation in pelvic malignancies (17, 27–32). Of these, only one has performed a clinical validation of the ABS-generated CTV, and that study used an atlas derived from just four datasets (32).
The present study, therefore, has two main objectives: (a) to clinically validate an atlas-based CTV definition by comparing it to manually defined CTVs using established similarity metrics; and (b) to assess whether PET-positive LNs are adequately included within the atlas-based CTV contours, thereby evaluating its accuracy in encompassing metastatic involvement.
2 Materials and methods
Consecutive patients diagnosed with anal canal cancer or cancer of the anal verge between 2009 and 2018, who underwent PET-CT-based treatment planning, were retrospectively identified from the institutional database (N = 51). Patients with distant metastases (M1) were excluded. CT and PET-CT images were imported into the treatment planning system RayStation version 10B (RaySearch Laboratories, Stockholm, Sweden).
First, the CTV was manually delineated on the CT images using the Structure Definition module. A single observer performed all delineations based on anatomical landmarks in accordance with standard guidelines proposed by Muirhead et al. (33)1. Following these guidelines, the CTV included the following sub-volumes, each contoured as a separate ROI: external and internal iliac, obturator, presacral, inguinal, mesorectal, and ischiorectal regions. The ischiorectal space was delineated in all patients, and the obturator nodes were included within the internal iliac space.
Next, all sub-volume ROIs were combined into a single manually contoured CTV (mCTV) using the union function in the ROI algebra tool in RayStation. The resulting mCTV was then manually refined to correct for any anatomical irregularities.
Subsequently, PET-CT and planning-CT images were co-registered using RayStation’s Image Registration module for the identification of LN metastases in the 27 patients clinically staged as N1 or higher. PET images were rigidly aligned to the planning CT, and metabolic activity was assessed by overlaying PET signal on the CT anatomy using the Fusion view. LNs were classified as FDG-positive if they demonstrated increased FDG uptake and measured greater than 1.0 cm in size. These LNs were delineated in the Structure Definition module and included in the GTV as macroscopic disease. The delineated LNs collectively constituted the total LN volume ROI (Vt). The mCTV was subsequently expanded to include these FDG-positive LNs and surrounding areas to account for potential microscopic disease extension.
ABS was performed using RayStation’s dedicated ABS module. The atlas was constructed from planning CT datasets of multiple patients, each with a corresponding mCTV. To assess the effect of atlas size on segmentation accuracy, all 51 planning CT datasets with corresponding mCTVs were sequentially incorporated into the ABS atlas in a predefined order using the Structure Template Management tool: the first 27 patients with LN metastases were followed by the 24 patients without LN involvement. Auto-segmented CTVs (aCTVs) were generated using RayStation’s ABS algorithm, which applies rigid image registration (RIR) followed by deformable image registration (DIR) using the ANACONDA algorithm. This algorithm integrates both intensity-based and ROI-based information. Based on similarity metrics, the algorithm selected the most suitable atlas datasets (“fusion atlases”) and merged their segmentations into a consensus ROI. A leave-one-out approach was employed, excluding the target CT dataset from the atlas during each segmentation. Mesh-based structure adaptation (MBS) was enabled, and the number of fusion atlases was set to 15.
To investigate the influence of atlas size on segmentation performance, aCTVs were generated exclusively for the 27 patients with FDG-positive LN metastases using five different atlas sizes (n = 10, 20, 30, 40, and 50), where n refers to the number of CT datasets used during each segmentation. Because LN-positive patients were added first, the five atlas configurations included the following numbers of LN-positive patients: 10, 20, 27 (plus 3 LN-negative), 27 (plus 13 LN-negative), and 27 (plus 23 LN-negative), respectively.
The resulting aCTVs were compared to the corresponding mCTVs using established similarity metrics (Figure 1). This analysis was performed specifically in the 27 patients with FDG-positive LN metastases. The shared volume (SV) between the mCTV and aCTV represented the correctly contoured region identified by the algorithm. Automatically segmented regions extending beyond the mCTV were categorized as mistakenly contoured volume (MCV), while areas of the mCTV not covered by the aCTV were defined as mistakenly not contoured volume (NCV). Both MCV and NCV values were calculated relative to the respective mCTV volumes, resulting in the relative mistakenly contoured volume (rMCV = MCV/mCTV) and the relative mistakenly not contoured volume (rNCV = NCV/mCTV).
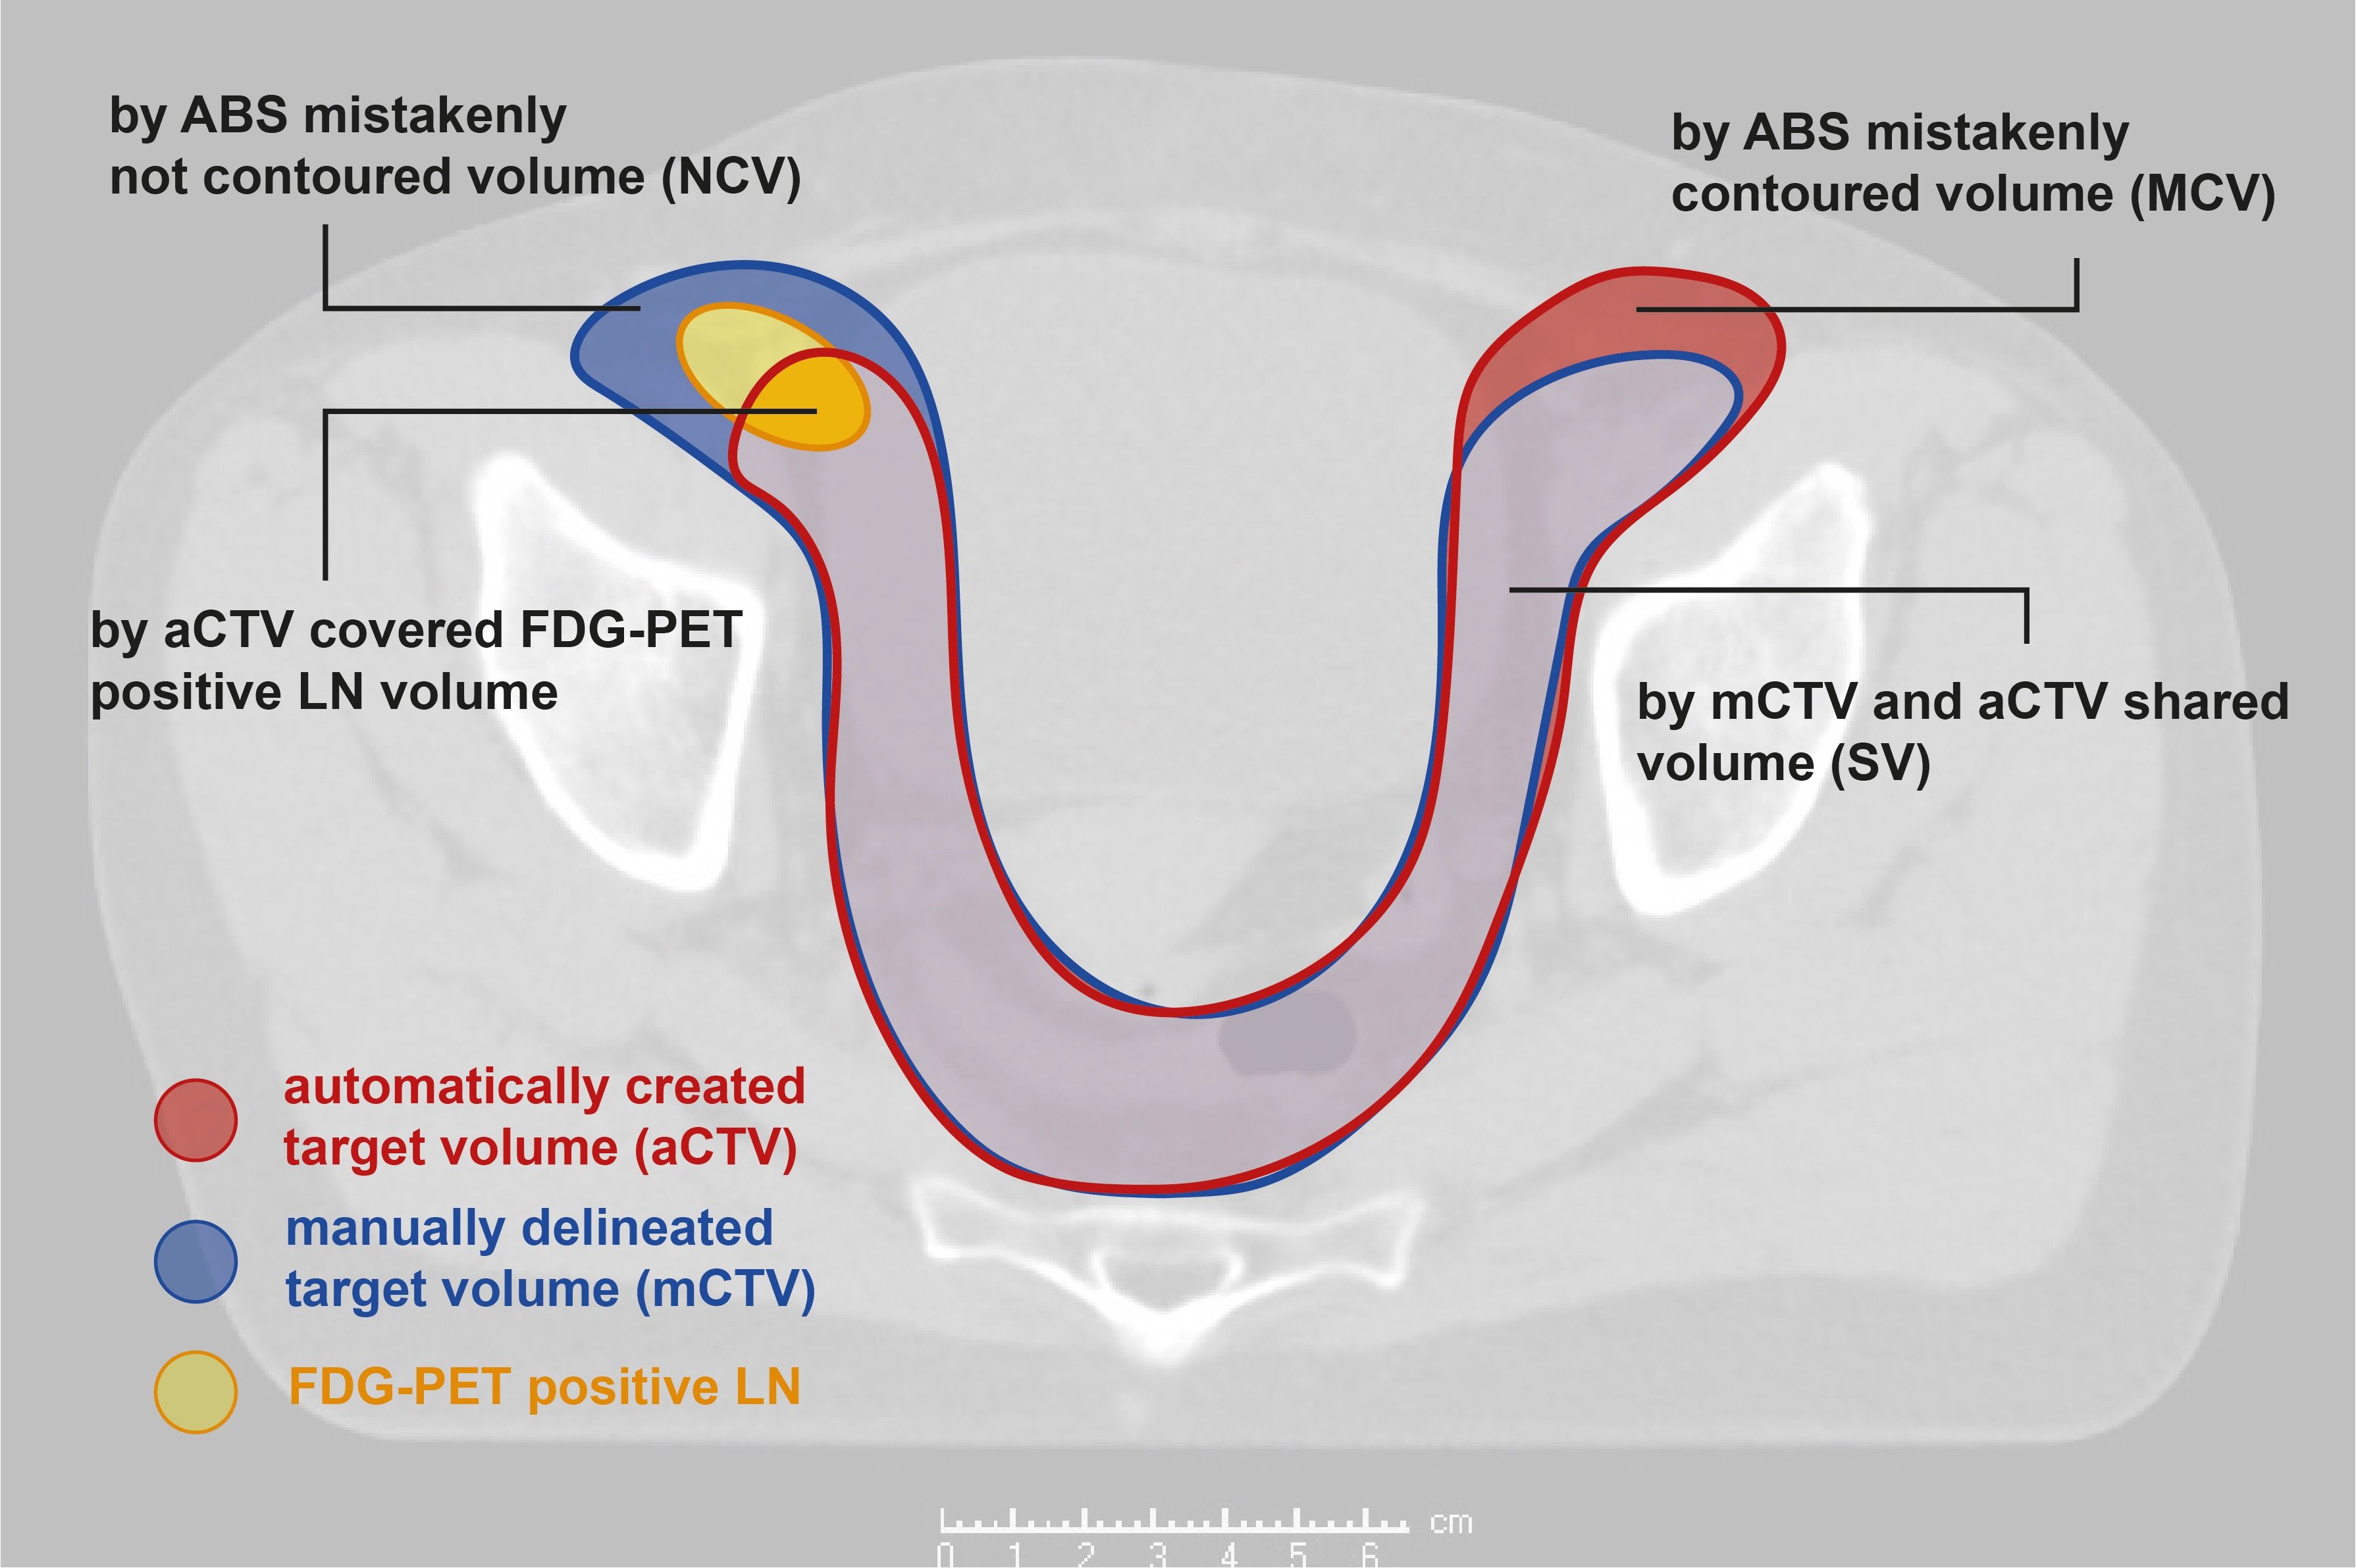
Figure 1. Considered volumes; aCTV, automatically generated clinical target volume; mCTV, manually delineated clinical target volume; LN, lymph node.
The similarity of mCTVs and aCTVs was evaluated using the Dice similarity index (34):
A DSI of 1.00 corresponds to entire mutual covering of target volumes (value and position). Non-overlapping target volumes lead to a DSI of 0.00. In line with previous studies, a DSI of ≥0.70 was considered a threshold for clinical acceptable segmentation performance (13, 35). A LN ratio (QLN) was defined as the amount of FDG-positive LN volume sufficiently covered by the aCTV [QLN = Vc/Vt (Vc - LN volume covered by aCTV; Vt – total LN volume)]. A QLN of 100.0% indicated a complete covering of PET-positive LN volumes while LNs were fully excluded from the aCTV if QLN was 0.0%.
For statistical analyses, SPSS® Statistics Version 27 (IBM®, Armonk, NY, USA) was used. Differences between the five aCTVs regarding DSI, rMCV, rNCV and QLN were assessed using the Friedman Test. In cases of statistical significance (p-value <0.05), post-hoc analyses were performed using Dunn-Bonferroni tests to identify the specific values of n responsible for the observed differences. The Bonferroni correction was applied to adjust the alpha error rate, accounting for multiple comparisons following the Friedman test. The study was approved by the local ethics committee under Reg.-Nr. 2023-2909-Daten and consent was obtained from one patient for the publication of exemplary CT slices.
3 Results
51 consecutive patients were identified, who all underwent PET-CT based treatment planning. Table 1 represents the patient characteristics.
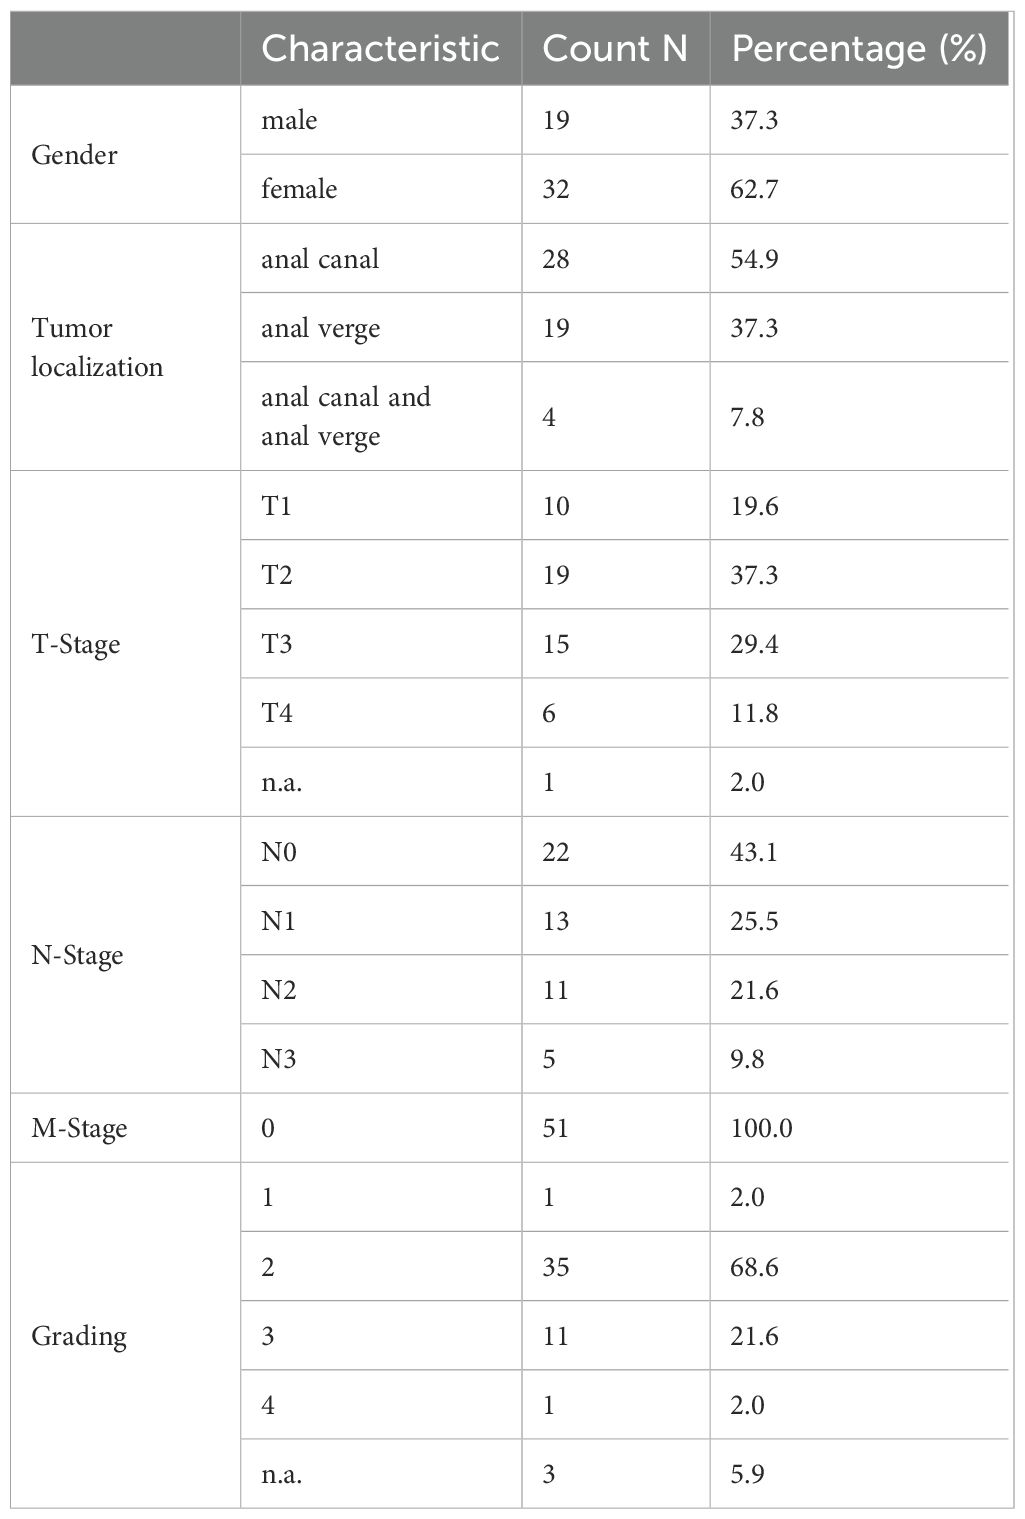
Table 1. Patient characteristics.
In the context of radiation planning, 29 patients were initially classified as FDG-positive (N-Stage ≥1). However, two of these patients showed doubtful FDG-positivity and were therefore reclassified as N-Stage 0 for this study. Consequently, 27 of 51 patients (52.9%) were considered FDG positive. Among these, a median number of two LNs showed an increased FDG-uptake. FDG-positive LNs were most frequently located in the inguinal region (77.8%, N=21), followed by the external and internal iliac (29.6%, N=8, respectively), the mesorectal (25.9%, N=7) and presacral space (18.5%, N=5). Figure 2 provides a representative visualization of CTV contours across different atlas sizes, displayed on selected CT slices, highlighting the variations in segmentation accuracy as the atlas size increases.
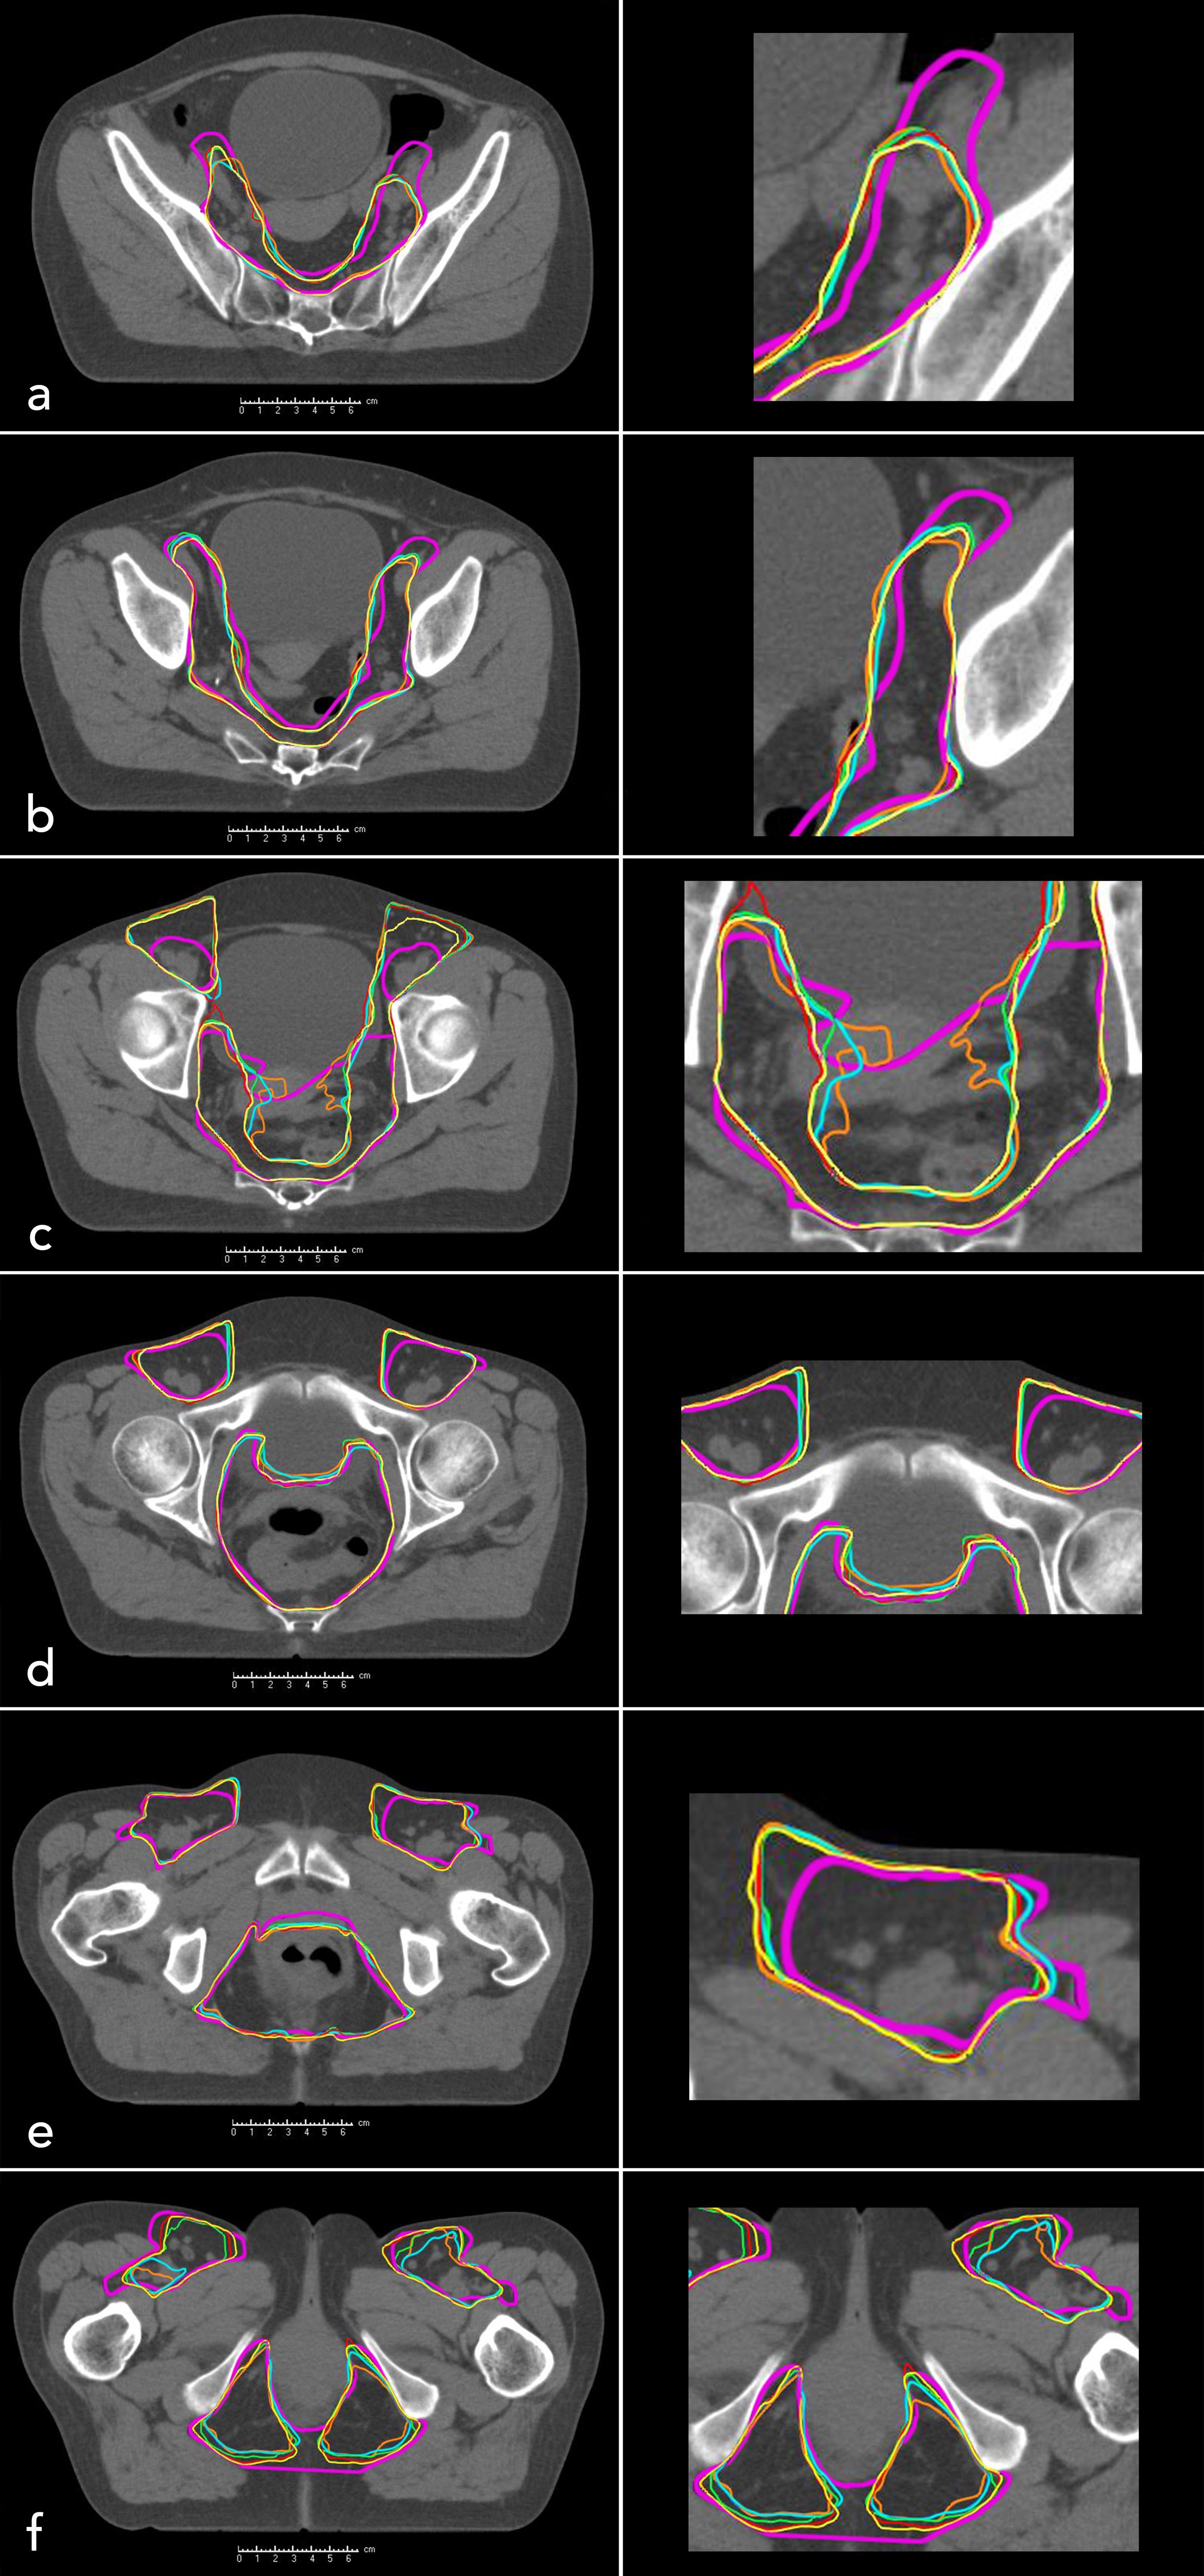
Figure 2. Manually contoured clinical target volume (mCTV, purple, patient 1) and automatically generated clinical target volumes for different atlas sizes: n = 10 (orange), n = 20 (blue), n = 30 (green), n = 40 (red), n = 50 (yellow). Axial CT slices of the pelvis are shown from cranial to caudal levels: (a–f).
The DSI value of 0.18 for patient 2 with n=10 was identified as an outlier based on the deviation of the interquartile range. It was excluded from the analyses to prevent distortion of the results. The DSIs ranged from 0.67 (patient 19, n=10) to 0.85 (patient 16, n=50). The average DSIs for n=10, 20, 30, 40 and 50 amounted 0.78, 0.78, 0.79, 0.79 and 0.80, respectively. The median DSIs ranged from 0.79 (n=10) to 0.80 (n=30; 50) (Table 2). There was a statistically significant increase of the DSI between n=10 and n=40; n=50 (Friedman Test: p<0.05; post-hoc-test: Bonferroni adjusted p1 = 0.012; p2 = 0.006, respectively). Figure 3A depicts the boxplots for the different DSIs.
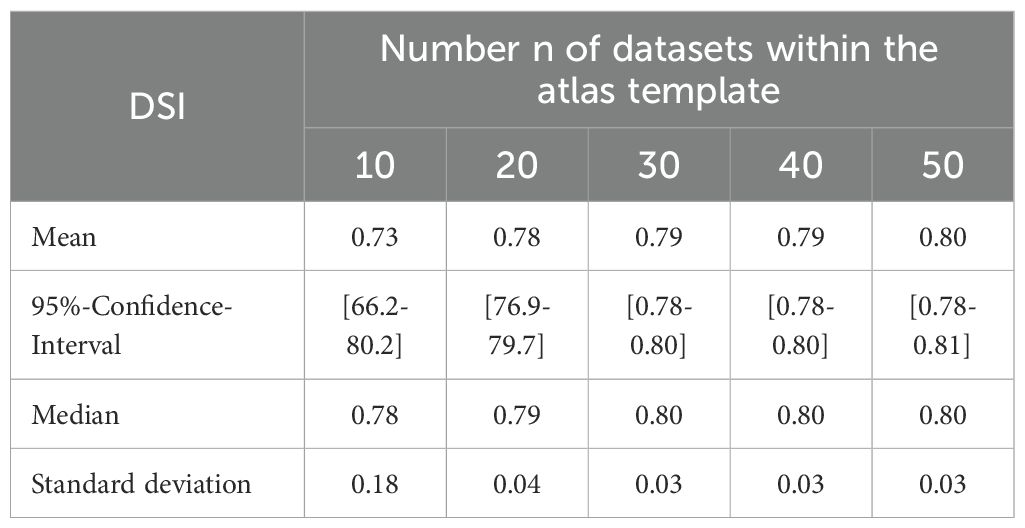
Table 2. Descriptive statistics of Dice similarity index (DSI).
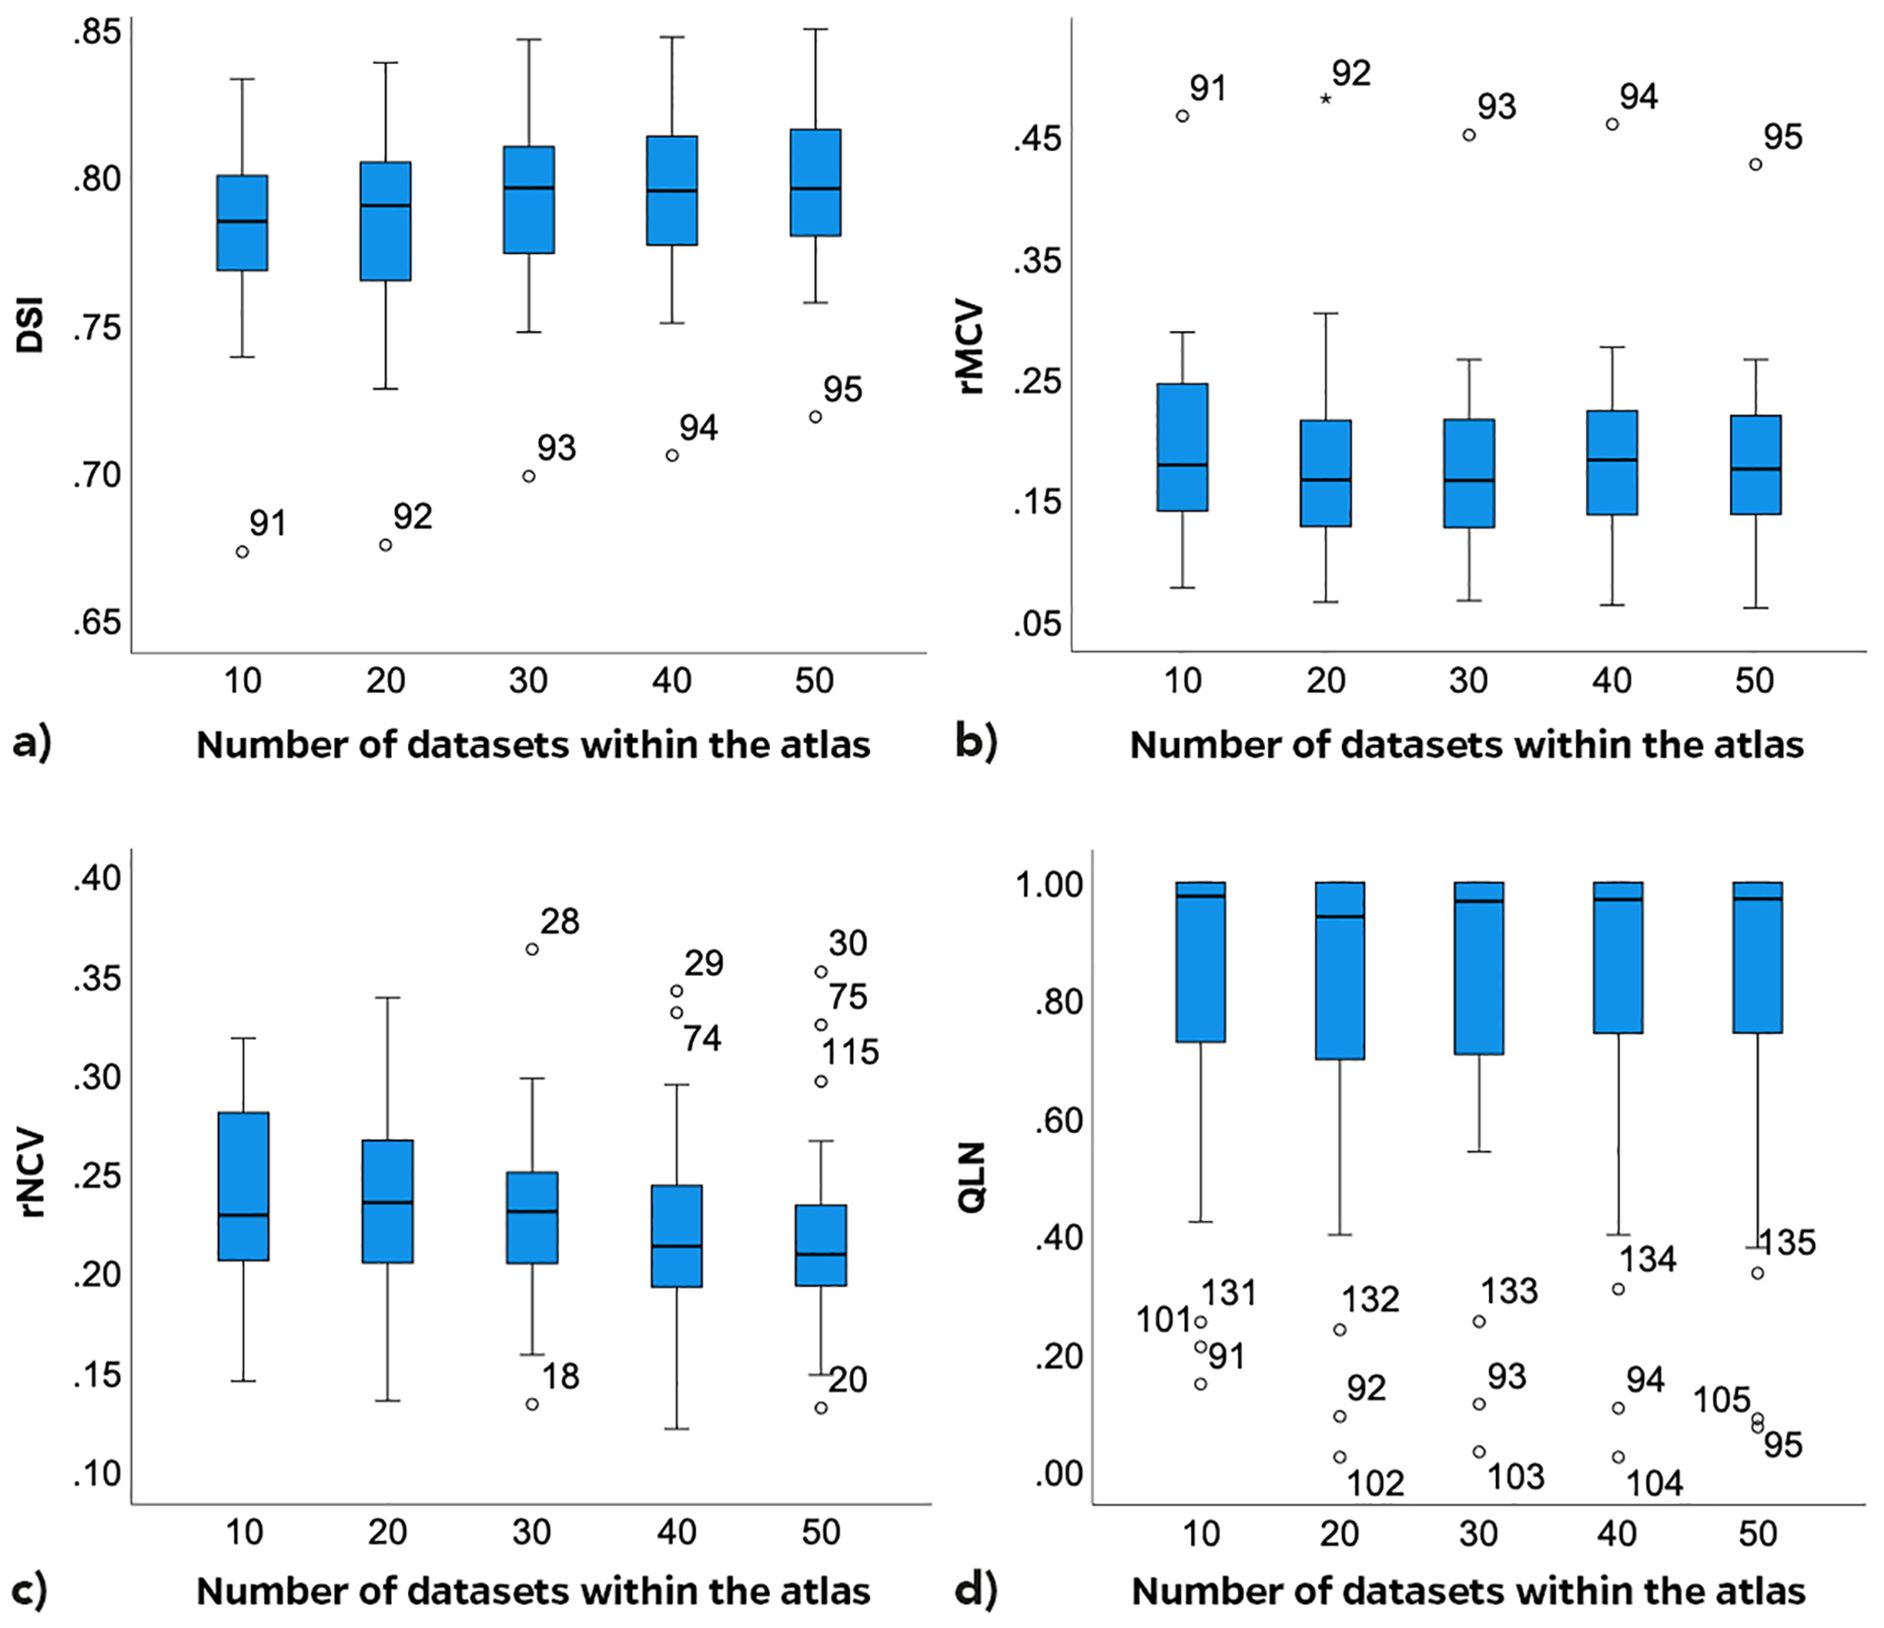
Figure 3. Boxplots depending on number n of datasets within the atlas; Dice similarity index – DSI (a); related mistakenly contoured volume – rMCV (b); related mistakenly not contoured volume – rNCV (c); lymph node ratio – QLN (d).
The rMCVs varied from 6.1% (patient 6, n=50) to 48.1% (patient 19, n=20) (Table 3). The aCTV in patient 19 showed noticeable overextension beyond the intended anatomical regions in the upper mesorectal and lower ischiorectal spaces. The inguinal aCTV partially covered the psoas muscles laterally and dorsally. The boxplots of the five rMCVs (Figure 3B) depict a statistically significant decrease of the rMCV with increasing n (Friedman Test, p<0.01). Statistically significant differences between the rMCVs with n=10 to n=20; n=10 to 30; n=10 to 50 were identified (Friedman Test: p<0.05; post-hoc-test: Bonferroni adjusted p1<0.001; p2<0.001; p3 = 0.011; respectively). There was no statistically significant difference between n=10 and n=40.
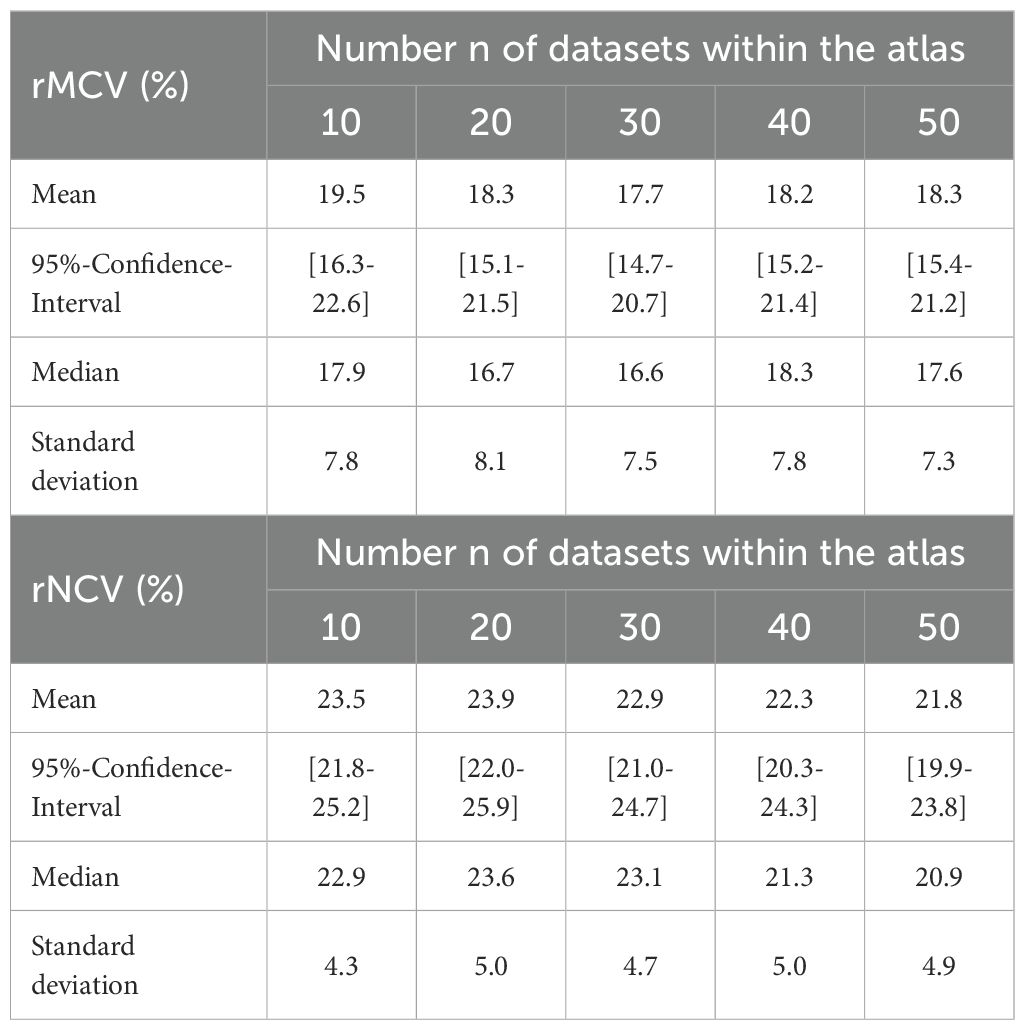
Table 3. Descriptive statistics of relative mistakenly contoured volume (rMCV) and relative mistakenly not contoured volume (rNCV).
The rNCVs ranged from 12.1% (patient 4, n=40) to 36.3% (patient 6, n=30). The small rNCV in patient 4 was mainly due to a correctly contoured ventral inguinal aCTV. Sources of mistakes were the inguinal aCTV spaces in obese patients 6 and 15 (numbers 28–30 and 74–75 in Figure 3) as they were not sufficiently expanded ventrally to the recommended 5 mm from the skin surface (33). While the aCTV in the upper mesorectal and lower ischiorectal spaces was often overextended, this inconsistency also contributed to missed target volumes in adjacent or critical regions. The boxplots for the rNCV suggested a decreasing trend of rNCVs with increasing n (Figure 3C). A statistically significant decrease of the rNCV was found between n=10 to n=40; n=50 and from n=20 to n=40; n=50 (post-hoc-test: Bonferroni adjusted p<0.05, respectively). The median rMCVs were consistently smaller than the median rNCVs across all five atlas sizes (Table 3).
In 8 of the 27 patients with LN metastases (29.6%), the LN volume was completely covered by the aCTV, regardless of the template size. In two patients, an entire covering of the FDG-positive LN volume was achieved from n=30 (7.4%). The median QLN increased with the number of datasets after it passed a minimum at n=20 (Figure 3D). From n=20 to n=40, the QLN improved with statistical significance (post-hoc-test: Bonferroni adjusted p<0.05). Three patients (19, 21 and 27) were outliers with median QLN less than 40.0%. In Patient 19 (91-95, Figure 3), one presacral LN near the promontory and one mesorectal LN was not adequately covered because of an insufficient upper expansion of the mesorectal aCTV. In the CTs of patients 21 and 27 (101-105; 131-135, Figure 3), the aCTV was contoured correctly but was not expanded according to the individual requirements. In both patients, external iliac LN volumes were partially localized outside the recommended 7 mm medial to the external iliac vessels (33).
4 Discussion
While previous studies on ABS have predominantly addressed the delineation of OARs (13, 36–38), investigations focusing on the automated segmentation of entire CTVs remain limited. This study evaluated whether ABS can generate clinically acceptable CTVs for anal cancer, particularly in the context of PET-CT-identified LN metastases and explored the influence of atlas size on segmentation performance. Three main findings emerged: (1) the DSI significantly increased with growing atlas size, indicating improved segmentation accuracy; (2) median rMCVs were consistently smaller than rNCVs and decreased with larger atlas sizes; and (3) in the majority of cases, LN metastases were insufficiently covered by aCTVs, necessitating manual corrections.
Manual CTV delineation in radiotherapy planning is labor-intensive (39), and treatment delays are associated with an elevated risk of local recurrence (40). Moreover, manual segmentation introduces intra- and inter-observer variability (41, 42), which is exacerbated by the low soft tissue contrast and artifact susceptibility of planning CT scans, potentially affecting planning target volume coverage. These challenges may result in inadvertent irradiation of healthy tissue or incomplete tumor coverage (11, 41).
Automated segmentation methods offer potential solutions to these issues. ABS can expedite the workflow for radiation oncologists and has demonstrated time-saving advantages in delineating both OARs and CTVs (43). Additionally, consistent use of the same algorithm and atlas improves reproducibility and contouring consistency (44).
Several algorithmic approaches exist. Intensity-based methods classify voxels using criteria such as Hounsfield unit thresholds and are suited for regions with distinct contrast (11). Deformable shape models adjust predefined contours according to image data to generate ROIs (11). More recently, ABS and machine learning approaches—including both conventional and DL methods—have advanced significantly.
Comparative studies, such as one evaluating the DL-based software DLCExpert (Mirada Medical Ltd., Oxford, UK) versus ABS for OAR segmentation in head and neck, thoracic, and pelvic CTs, found DL to produce a greater proportion of clinically acceptable segmentations (8). Gibbons et al. reported that DL outperformed ABS in anatomically variable organs due to DL’s superior adaptability, achieved through large-scale datasets and millions of parameters (11, 12). However, DL requires extensive datasets and powerful computing infrastructure (e.g., GPU clusters) and is prone to overfitting when models become overly complex (10). Moreover, the opacity and limited reproducibility of deep neural networks hinder correction of systematic errors and adaptation to evolving guidelines. In contrast, ABS requires fewer datasets and can be run on standard workstations, rendering it a more cost effective, practical and widely adopted solution in current clinical settings (11).
The heterogeneous distribution of LN metastases in anal cancer complicates ABS-based CTV segmentation (26, 45, 46). Conventional ABS algorithms do not typically incorporate PET-CT data and are limited in adapting to highly variable anatomy (11). Nevertheless, ABS can encompass areas at high risk for LN involvement, and standardized atlases based on consensus guidelines may enhance segmentation accuracy. However, the degree to which current ABS algorithms adequately cover LN metastases remains uncertain.
In multi-atlas ABS, a library of segmented datasets serves as the reference. Image registration—typically based on mutual information—is used to map atlas ROIs to the target CT scan (11). Although segmentation accuracy generally improves with larger atlas sizes, computational costs also increase (37). Hence, identifying the optimal atlas size is essential. Current literature reports varying recommendations, depending on anatomical regions and ABS algorithms used (47). For example, Sjöberg et al. used 15 atlas datasets for pelvic LN segmentation and achieved median DSIs around 0.7 (48). Li et al. compared atlas sizes ranging from 20 to 120 for cervical cancer CTV and OAR delineation and found no significant differences between groups (36). Anders et al. stratified an atlas by patient sex and reported mean DSIs of up to 0.83 for automatically segmented substructures in anorectal cancer (35).
In our study, similarity metrics between aCTVs and mCTVs were in line with these findings. According to Anders et al. and Aoyama et al., a DSI > 0.7 reflects acceptable geometric similarity (13, 35). This threshold was met in 88.9% (24/27) of cases across all atlas sizes. Median DSIs ranged from 0.67 to 0.85. In a few instances (patients 2, 19, and 24), the threshold was not reached for certain atlas sizes.
Analysis of segmentation errors revealed consistent inaccuracies in the upper mesorectal and inguinal regions. Particularly in the mesorectum, anatomical variability and low tissue contrast complicate registration. In contrast, the internal iliac regions were segmented more accurately, likely due to their boundaries being defined by hyperdense pelvic bones, which favor automatic contouring.
Coverage of FDG-positive LN metastases by aCTVs was suboptimal, necessitating manual corrections. Manual CTV delineation was guided by the UK IMRT recommendations for anal cancer. Despite its accuracy in the study by Dapper et al., up to 20% of LNs remained uncovered in the common iliac, para-aortic, and inguinal regions (26). The absence of consistent recommendations—especially for inguinal coverage—likely contributes to these limitations in ABS.
Only 8 of 27 patients (29.6%) had complete LN coverage by aCTVs. In 2 additional cases (7.4%), increasing atlas size led to full LN inclusion. As noted in earlier studies (49, 50), the inguinal region, particularly its ventral boundary in obese patients, posed challenges due to ABS’s limited adaptability to patient-specific anatomy (11). Expanding the atlas with anatomical outliers may help address this issue. Insufficient cranial expansion of the CTV and LN locations outside the recommended 7 mm boundary of external iliac vessels also contributed to inadequate coverage, highlighting ABS’s current inability to incorporate PET-CT data. Despite guideline adherence, such discrepancies necessitate manual review and correction by radiation oncologists.
Our data indicate a progressive improvement in CTV quality with increasing atlas size. A median DSI of 0.80 was achieved with 30 datasets. Although no definitive optimal atlas size could be established, the consistent improvements up to 50 datasets suggest that larger atlases yield better results. This finding contrasts with Li et al. (36), who observed no significant improvement beyond 20 datasets in cervical cancer radiotherapy.
A limitation of this study is its focus on geometric metrics, which do not capture contour complexity (11). However, incorporating clinically relevant aspects, such as FDG-positive LN coverage, strengthens the analysis. Further research including dosimetric evaluations and OAR involvement is warranted. The small sample size limited the study to descriptive statistics.
The impact of atlas composition remains unclear. Although a leave-one-out approach was used for validation, the non-randomized sequential inclusion of datasets may introduce bias. In this study, LN-positive patients—representing more complex anatomies—were included first, leading to an uneven distribution of clinical phenotypes. Whether nodal status alone affects CTV variability or whether other factors, such as sex, pelvic morphology, or BMI, play greater roles remains to be determined. Future studies can benefit from subgroup-specific analyses to identify anatomical features that systematically affect segmentation accuracy. Nonetheless, segmentation quality improved even when LN-negative cases were added, supporting the robustness of larger atlases. Future studies should explore stratification strategies, such as phenotype balancing or subgroup-specific atlases.
Given that a commercial ABS platform was used, results may vary with different algorithms. However, algorithm-specific settings (e.g., number of fusion atlases) were optimized per manufacturer recommendations to ensure reproducibility and performance.
In conclusion, ABS can generate high-quality whole CTVs for anal cancer. In 88.9% of cases, acceptable DSI thresholds (≥0.7) were met across all atlas sizes, with performance improving alongside atlas expansion. However, persistent inaccuracies—particularly in anatomical outliers and LN coverage—necessitate manual adjustments. To improve robustness, ABS atlases should include anatomically diverse datasets reflecting different tumor stages and patient morphologies.
Compared to DL-based segmentation, ABS requires fewer datasets and allows more flexible adaptation to changing guidelines. Further studies are needed to determine the ideal atlas size, structure, and the potential benefits of incorporating anatomical outliers.
Data availability statement
The raw data supporting the conclusions of this article will be made available by the authors, without undue reservation.
Ethics statement
The studies involving humans were approved by Ethik-Kommission der Friedrich-Schiller-Universität Jena, Germany. The studies were conducted in accordance with the local legislation and institutional requirements. Written informed consent for participation was not required from the participants or the participants’ legal guardians/next of kin in accordance with the national legislation and institutional requirements. Written informed consent was obtained from the individual(s) for the publication of any potentially identifiable images or data included in this article.
Author contributions
MBi: Data curation, Formal Analysis, Investigation, Visualization, Writing – original draft, Writing – review & editing. MBö: Methodology, Writing – review & editing, Formal Analysis, Validation. MD: Conceptualization, Data curation, Formal Analysis, Investigation, Methodology, Project administration, Resources, Supervision, Writing – review & editing. AW: Methodology, Writing – review & editing, Conceptualization, Data curation, Investigation, Project administration, Resources, Software, Supervision, Writing – original draft.
Funding
The author(s) declare that no financial support was received for the research and/or publication of this article.
Conflict of interest
The authors declare that the research was conducted in the absence of any commercial or financial relationships that could be construed as a potential conflict of interest.
Generative AI statement
The author(s) declare that no Generative AI was used in the creation of this manuscript.
Any alternative text (alt text) provided alongside figures in this article has been generated by Frontiers with the support of artificial intelligence and reasonable efforts have been made to ensure accuracy, including review by the authors wherever possible. If you identify any issues, please contact us.
Publisher’s note
All claims expressed in this article are solely those of the authors and do not necessarily represent those of their affiliated organizations, or those of the publisher, the editors and the reviewers. Any product that may be evaluated in this article, or claim that may be made by its manufacturer, is not guaranteed or endorsed by the publisher.
Abbreviations
CTV, clinical target volume; OAR, organ at risk; ABS, atlas-based auto-segmentation; LN, lymph node; 18FDGPET-CT, 18-Flourodesoxyglucose positron emission tomography/computed tomography; ROI, region of interest; DSI, Dice similarity index; mCTV, manually contoured CTV; aCTV, auto-segmented clinical target volume; n, number of atlases in the ABS template; SV, shared volume; MCV, mistakenly contoured volume; NCV, mistakenly not contoured volume; aMCV, adapted mistakenly contoured volume; aNCV, adapted mistakenly not contoured volume; QLN, lymph node ratio; Vc, lymph node volume covered by aCTV; Vt, total lymph node volume; DL, deep learning.
Footnotes
- ^ Note: An updated version of the national guidance for VMAT/IMRT in anal cancer was published by the Royal College of Radiologists in 2024. The present study was conducted in accordance with the 2016 guidance.
References
1. Troester A, Parikh R, Southwell B, Ester E, Sultan S, Greeno E, et al. Treatment of stage I-III squamous cell anal cancer: a comparative effectiveness systematic review. JNCI: J Natl Cancer Institute. (2024) 117:240–52. doi: 10.1093/jnci/djae195
2. Feng M, Hallemeier CL, Almada C, Aranha O, Dorth J, Felder S, et al. Radiation therapy for anal squamous cell carcinoma: an ASTRO clinical practice guideline. Pract Radiat Oncol. (2015) 15:367–86. doi: 10.1016/j.prro.2025.02.001
3. Webster A, Appelt AL, and Eminowicz G. Image-guided radiotherapy for pelvic cancers: A review of current evidence and clinical utilization. Clin Oncol (R Coll Radiol). (2020) 32:805–16. doi: 10.1016/j.clon.2020.09.010
4. Theophanous S, Samuel R, Lilley J, Henry A, Sebag-Montefiore D, Gilbert A, et al. Prognostic factors for patients with anal cancer treated with conformal radiotherapy-a systematic review. BMC Cancer. (2022) 22:607. doi: 10.1186/s12885-022-09729-4
5. Xu Z, Lee S, Albani D, Dobbins D, Ellis RJ, Biswas T, et al. Evaluating radiotherapy treatment delay using Failure Mode and Effects Analysis (FMEA). Radiother Oncol. (2019) 137:102–9. doi: 10.1016/j.radonc.2019.04.016
6. Cardenas CE, Yang J, Anderson BM, Court LE, and Brock KB. Advances in auto-segmentation. Semin Radiat Oncol. (2019) 29:185–97. doi: 10.1016/j.semradonc.2019.02.001
7. Kalantar R, Lin G, Winfield JM, Messiou C, Lalondrelle S, Blackledge MD, et al. Automatic segmentation of pelvic cancers using deep learning: state-of-the-art approaches and challenges. Diagnostics. (2021) 11:1964. doi: 10.3390/diagnostics11111964
8. Gibbons E, Hoffmann M, Westhuyzen J, Hodgson A, Chick B, and Last A. Clinical evaluation of deep learning and atlas-based auto-segmentation for critical organs at risk in radiation therapy. J Med Radiat Sci. (2023) 70 Suppl 2:15–25. doi: 10.1002/jmrs.618
9. Bordigoni B, Trivellato S, Pellegrini R, Meregalli S, Bonetto E, Belmonte M, et al. Automated segmentation in pelvic radiotherapy: A comprehensive evaluation of ATLAS-, machine learning-, and deep learning-based models. Physica Medica. (2024) 125:104486. doi: 10.1016/j.ejmp.2024.104486
10. Liu X, Song L, Liu S, and Zhang Y. A review of deep-learning-based medical image segmentation methods. Sustainability. (2021) 13:1224. doi: 10.3390/su13031224
11. Harrison K, Pullen H, Welsh C, Oktay O, Alvarez-Valle J, and Jena R. Machine learning for auto-segmentation in radiotherapy planning. Clin Oncol (R Coll Radiol). (2022) 34:74–88. doi: 10.1016/j.clon.2021.12.003
12. Yang J, Veeraraghavan H, Armato SG 3rd, Farahani K, Kirby JS, Kalpathy-Kramer J, et al. Autosegmentation for thoracic radiation treatment planning: A grand challenge at AAPM 2017. Med Phys. (2018) 45:4568–81. doi: 10.1002/mp.2018.45.issue-10
13. Aoyama T, Shimizu H, Kitagawa T, Yokoi K, Koide Y, Tachibana H, et al. Comparison of atlas-based auto-segmentation accuracy for radiotherapy in prostate cancer. Phys Imaging Radiat Oncol. (2021) 19:126–30. doi: 10.1016/j.phro.2021.08.002
14. Conson M, Cella L, Pacelli R, Comerci M, Liuzzi R, Salvatore M, et al. Automated delineation of brain structures in patients undergoing radiotherapy for primary brain tumors: from atlas to dose-volume histograms. Radiother Oncol. (2014) 112:326–31. doi: 10.1016/j.radonc.2014.06.006
15. Tao CJ, Yi JL, Chen NY, Ren W, Cheng J, Tung S, et al. Multi-subject atlas-based auto-segmentation reduces interobserver variation and improves dosimetric parameter consistency for organs at risk in nasopharyngeal carcinoma: A multi-institution clinical study. Radiother Oncol. (2015) 115:407–11. doi: 10.1016/j.radonc.2015.05.012
16. Hu Y, Byrne M, Archibald-Heeren B, Thompson K, Fong A, Knesl M, et al. Implementing user-defined atlas-based auto-segmentation for a large multi-center organization: the Australian Experience. J Med Radiat Sci. (2019) 66:238–49. doi: 10.1002/jmrs.v66.4
17. Gambacorta MA, Valentini C, Dinapoli N, Boldrini L, Caria N, Barba MC, et al. Clinical validation of atlas-based auto-segmentation of pelvic volumes and normal tissue in rectal tumors using auto-segmentation computed system. Acta Oncol. (2013) 52:1676–81. doi: 10.3109/0284186X.2012.754989
18. Braide K, Kindblom J, Lindencrona U, Månsson M, and Hugosson J. The value of a bladder-filling protocol for patients with prostate cancer who receive post-operative radiation: results from a prospective clinical trial. Acta Oncologica. (2019) 58:463–8. doi: 10.1080/0284186X.2018.1554261
19. Burnet NG, Thomas SJ, Burton KE, and Jefferies SJ. Defining the tumor and target volumes for radiotherapy. Cancer Imaging. (2004) 4:153–61. doi: 10.1102/1470-7330.2004.0054
20. Lohynska R, Mazana E, Novakova-Jiresova A, Jirkovska M, Nydlova A, Veselsky T, et al. Improved survival in patients with FDG-PET/CT-based radiotherapy treatment planning for squamous cell anal cancer. Neoplasma. (2020) 67:1157–63. doi: 10.4149/neo_2020_191229N1350
21. Myerson RJ, Garofalo MC, El Naqa I, Abrams RA, Apte A, Bosch WR, et al. Elective clinical target volumes for conformal therapy in anorectal cancer: a radiation therapy oncology group consensus panel contouring atlas. Int J Radiat Oncol Biol Phys. (2009) 74:824–30. doi: 10.1016/j.ijrobp.2008.08.070
22. Glynne-Jones R, Nilsson PJ, Aschele C, Goh V, Peiffert D, Cervantes A, et al. Anal cancer: ESMO-ESSO-ESTRO clinical practice guidelines for diagnosis, treatment and follow-up. Radiother Oncol. (2014) 111:330–9. doi: 10.1016/j.radonc.2014.04.013
23. Mahmud A, Poon R, and Jonker D. PET imaging in anal canal cancer: a systematic review and meta-analysis. Br J Radiol. (2017) 90:20170370. doi: 10.1259/bjr.20170370
24. Secerov Ermenc A and Segedin B. The role of MRI and PET/CT in radiotherapy target volume determination in gastrointestinal cancers-review of the literature. Cancers (Basel). (2023) 15:2967. doi: 10.3390/cancers15112967
25. Albertsson P, Alverbratt C, Liljegren A, Björkander E, Strandell A, Samuelsson O, et al. Positron emission tomography and computed tomographic (PET/CT) imaging for radiation therapy planning in anal cancer: A systematic review and meta-analysis. Crit Rev Oncol Hematol. (2018) 126:6–12. doi: 10.1016/j.critrevonc.2018.03.013
26. Dapper H, Schiller K, Münch S, Peeken JC, Borm K, Weber W, et al. Have we achieved adequate recommendations for target volume definitions in anal cancer? A PET imaging based patterns of failure analysis in the context of established contouring guidelines. BMC Cancer. (2019) 19:742. doi: 10.1186/s12885-019-5970-0
27. Velker VM, Rodrigues GB, Dinniwell R, Hwee J, and Louie AV. Creation of RTOG compliant patient CT-atlases for automated atlas based contouring of local regional breast and high-risk prostate cancers. Radiat Oncol. (2013) 8:188. doi: 10.1186/1748-717X-8-188
28. La Macchia M, Fellin F, Amichetti M, Cianchetti M, Gianolini S, Paola V, et al. Systematic evaluation of three different commercial software solutions for automatic segmentation for adaptive therapy in head-and-neck, prostate and pleural cancer. Radiat Oncol. (2012) 7:160. doi: 10.1186/1748-717X-7-160
29. Kim N, Chang JS, Kim YB, and Kim JS. Atlas-based auto-segmentation for postoperative radiotherapy planning in endometrial and cervical cancers. Radiat Oncol. (2020) 15:106. doi: 10.1186/s13014-020-01562-y
30. Li Y. The clinical evaluation of atlas-based auto-segmentation for automatic contouring during cervical cancer radiotherapy. Front Oncol. (2022) 12:945053. doi: 10.3389/fonc.2022.945053
31. Greenham S, Dean J, Fu CK, Goman J, Mulligan J, Tune D, et al. Evaluation of atlas-based auto-segmentation software in prostate cancer patients. J Med Radiat Sci. (2014) 61:151–8. doi: 10.1002/jmrs.64
32. Anders LC. Performance of an atlas-based autosegmentation software for delineation of target volumes for radiotherapy of breast and anorectal cancer. Radiotherapy Oncol. (2012) 102:68–73. doi: 10.1016/j.radonc.2011.08.043
33. Muirhead R, Adams R, Gilbert D, Harrison M, Glynne-Jones R, Sebag-Montefiore D, et al. National Guidance for IMRT in anal cancer. (2016).
34. Park JM, Park SY, Ye SJ, Kim JH, Carlson J, and Wu HG. New conformity indices based on the calculation of distances between the target volume and the volume of reference isodose. Br J Radiol. (2014) 87:20140342. doi: 10.1259/bjr.20140342
35. Anders LC, Stieler F, Siebenlist K, Schäfer J, Lohr F, and Wenz F. Performance of an atlas-based autosegmentation software for delineation of target volumes for radiotherapy of breast and anorectal cancer. Radiother Oncol. (2012) 102:68–73. doi: 10.1016/j.radonc.2011.08.043
36. Li Y, Wu W, Sun Y, Yu D, Zhang Y, Wang L, et al. The clinical evaluation of atlas-based auto-segmentation for automatic contouring during cervical cancer radiotherapy. Front Oncol. (2022) 12:945053. doi: 10.3389/fonc.2022.945053
37. Aljabar P, Heckemann RA, Hammers A, Hajnal JV, and Rueckert D. Multi-atlas based segmentation of brain images: atlas selection and its effect on accuracy. Neuroimage. (2009) 46:726–38. doi: 10.1016/j.neuroimage.2009.02.018
38. Van de Velde J, Wouters J, Vercauteren T, De Gersem W, Achten E, De Neve W, et al. Optimal number of atlases and label fusion for automatic multi-atlas-based brachial plexus contouring in radiotherapy treatment planning. Radiat Oncol. (2016) 11:1. doi: 10.1186/s13014-015-0579-1
39. Vorwerk H, Zink K, Schiller R, Budach V, Böhmer D, Kampfer S, et al. Protection of quality and innovation in radiation oncology: the prospective multicenter trial the German Society of Radiation Oncology (DEGRO-QUIRO study). Evaluation of time, attendance of medical staff, and resources during radiotherapy with IMRT. Strahlenther Onkol. (2014) 190:433–43. doi: 10.1007/s00066-014-0634-0
40. Chen Z, King W, Pearcey R, Kerba M, and Mackillop WJ. The relationship between waiting time for radiotherapy and clinical outcomes: a systematic review of the literature. Radiother Oncol. (2008) 87:3–16. doi: 10.1016/j.radonc.2007.11.016
41. Vinod SK, Jameson MG, Min M, and Holloway LC. Uncertainties in volume delineation in radiation oncology: A systematic review and recommendations for future studies. Radiother Oncol. (2016) 121:169–79. doi: 10.1016/j.radonc.2016.09.009
42. Kim KS, Cheong KH, Kim K, Koo T, Koh HK, Chang JH, et al. Interobserver variability in clinical target volume delineation in anal squamous cell carcinoma. Sci Rep. (2021) 11:2785. doi: 10.1038/s41598-021-82541-5
43. Lim JY and Leech M. Use of auto-segmentation in the delineation of target volumes and organs at risk in head and neck. Acta Oncol. (2016) 55:799–806. doi: 10.3109/0284186X.2016.1173723
44. Young AV, Wortham A, Wernick I, Evans A, and Ennis RD. Atlas-based segmentation improves consistency and decreases time required for contouring postoperative endometrial cancer nodal volumes. Int J Radiat Oncol Biol Phys. (2011) 79:943–7. doi: 10.1016/j.ijrobp.2010.04.063
45. Frennered A, Scherman J, Buchwald P, Johnsson A, Sartor H, Zackrisson S, et al. Patterns of pathologic lymph nodes in anal cancer: a PET-CT-based analysis with implications for radiotherapy treatment volumes. BMC Cancer. (2021) 21:447. doi: 10.1186/s12885-021-08187-8
46. Ng M, Leong T, Chander S, Chu J, Kneebone A, Carroll S, et al. Australasian Gastrointestinal Trials Group (AGITG) contouring atlas and planning guidelines for intensity-modulated radiotherapy in anal cancer. Int J Radiat Oncol Biol Phys. (2012) 83:1455–62. doi: 10.1016/j.ijrobp.2011.12.058
47. Delpon G, Escande A, Ruef T, Darréon J, Fontaine J, Noblet C, et al. Comparison of automated atlas-based segmentation software for postoperative prostate cancer radiotherapy. Front Oncol. (2016) 6:178. doi: 10.3389/fonc.2016.00178
48. Sjöberg C, Lundmark M, Granberg C, Johansson S, Ahnesjö A, and Montelius A. Clinical evaluation of multi-atlas based segmentation of lymph node regions in head and neck and prostate cancer patients. Radiat Oncol. (2013) 8:229. doi: 10.1186/1748-717X-8-229
49. Chang Y, Li G, Yang Z, Han G, Li X, Zhao Y, et al. Inguinal nodal clinical target volume delineation based on analysis of anatomical locations of normal and metastatic lymph nodes in pelvic Malignant tumors. Radiother Oncol. (2023) 183:109634. doi: 10.1016/j.radonc.2023.109634
Keywords: atlas-based auto-segmentation, CTV auto-segmentation, anal cancer, PET/CT, lymph node metastases
Citation: Bieder M, Böhm M, Duma MN and Wittig A (2025) Clinical evaluation of atlas-based auto-segmentation for contouring pelvic CTVs in the treatment of anal cancer with FDG-PET-positive lymph node involvement. Front. Oncol. 15:1585338. doi: 10.3389/fonc.2025.1585338
Received: 28 February 2025; Accepted: 08 August 2025;
Published: 02 September 2025.
Edited by:
Kenshiro Shiraishi, Teikyo University, JapanCopyright © 2025 Bieder, Böhm, Duma and Wittig. This is an open-access article distributed under the terms of the Creative Commons Attribution License (CC BY). The use, distribution or reproduction in other forums is permitted, provided the original author(s) and the copyright owner(s) are credited and that the original publication in this journal is cited, in accordance with accepted academic practice. No use, distribution or reproduction is permitted which does not comply with these terms.
*Correspondence: Max Bieder, bS5iaWVkZXJAdWtlLmRl
†Present address: Max Bieder, Department of Neurology, Hamburg University Hospital, Hamburg, Germany
Markus Böhm, Abbott Rapid Diagnostics Jena GmbH, Jena, Germany
‡These authors have contributed equally to this work and share last authorship