 Yuyan Huang
 Yong Chen†
- Department of Respiratory and Critical Care Medicine, The Affiliated Hospital of North Sichuan Medical College, Nanchong, Sichuan, China
Objectives: To study the characteristic factors associated with the occurrence of malignant nodules in patients presenting with pulmonary nodules, develop a predictive model, and evaluate its diagnostic performance.
Methods: This study analyzed the clinical and imaging data of 830 patients with pulmonary nodules from the Affiliated Hospital of North Sichuan Medical College. The Least Absolute Shrinkage and Selection Operator (LASSO) and multivariate logistic regression analysis were utilized to identify characteristic predictors. Multiple machine learning classification models were employed for analysis, with the optimal model ultimately selected. A Shapley Additive Explanations (SHAP) framework was developed for personalized risk assessment. Finally, external testing was performed using data from 330 pulmonary nodule patients at Guang’an People’s Hospital.
Results: The predictive factors for malignant pulmonary nodules included: age, gender, nodule diameter, spiculation, lobulation, calcification, vacuole, vascular convergence sign, air bronchogram sign, pleural traction, and density of the nodule. The Gradient Boosting Decision Tree (GBDT) classification model demonstrated optimal performance, with an area under the curve (AUC) of 0.873 (95% confidence interval [CI]: 0.840–0.906) on the internal test set and 0.726 (95% CI: 0.668–0.784) on the external test set. Both the calibration curve and clinical decision curve analysis (DCA) indicated excellent model calibration and substantial clinical benefits.
Conclusions: We developed a GBDT model that provides a basis for differentiating malignant pulmonary nodules, which may assist in the diagnosis and treatment of patients with pulmonary nodules.
1 Introduction
A pulmonary nodule refers to a round or oval-shaped, focal, increased-density shadow in the lung observed on imaging, with a diameter of ≤3 cm. With the widespread use of CT scans, the detection rate of pulmonary nodules has continued to rise (1).Pulmonary nodules can be classified into benign and malignant types. Benign nodules are often associated with inflammatory diseases such as tuberculosis and granulomas, while malignant nodules are typically indicative of early-stage lung cancer. Lung cancer remains the most common type of cancer globally, the leading cause of cancer-related deaths, and the disease with the highest global economic burden (2, 3). Prognostic outcomes demonstrate dramatic variation across disease stages, with 5-year survival rates plummeting from 82% in stage IA to merely 7% in stage IVB (4).Early diagnosis and treatment of lung cancer are crucial for improving patient prognosis. Although low-dose spiral CT screening can enhance the detection rate of pulmonary nodules, a significant proportion of nodules initially suspected to be malignant prior to biopsy are ultimately confirmed as benign after pathological examination, which imposes additional clinical risks and financial burdens on patients (5). Therefore, early identification of risk factors and the development of predictive models are of critical significance for improving the early diagnosis, treatment, and prognosis of malignant pulmonary nodules, as well as avoiding unnecessary invasive procedures. Machine learning constitutes a suite of powerful algorithms capable of analyzing, learning from, adapting to, representing, and predicting data. It efficiently addresses multicollinearity among independent variables. Machine learning is widely regarded as the future of computer-aided diagnosis and medical research (6). Therefore, this study collected and organized imaging and clinical data from patients with pulmonary nodules, employed several machine learning classification models to analyze risk factors for malignant nodules, developed a predictive model, and established an evidence-based framework to optimize clinical decision-making in early-stage lung cancer management.
2 Materials and methods
2.1 Materials
2.1.1 Subjects
A retrospective cohort study was conducted involving 1,160 patients with pulmonary nodules who underwent evaluation at two medical centers: the Affiliated Hospital of North Sichuan Medical College and Guang’an People’s Hospital between January 2019 and November 2021. The patient selection process is shown in Figure 1. This study was approved by the Medical Ethics Committee of North Sichuan Medical College Affiliated Hospital (File Number: 2022ER234-1). Since this was a retrospective analysis, the requirement for informed consent from patients was waived.
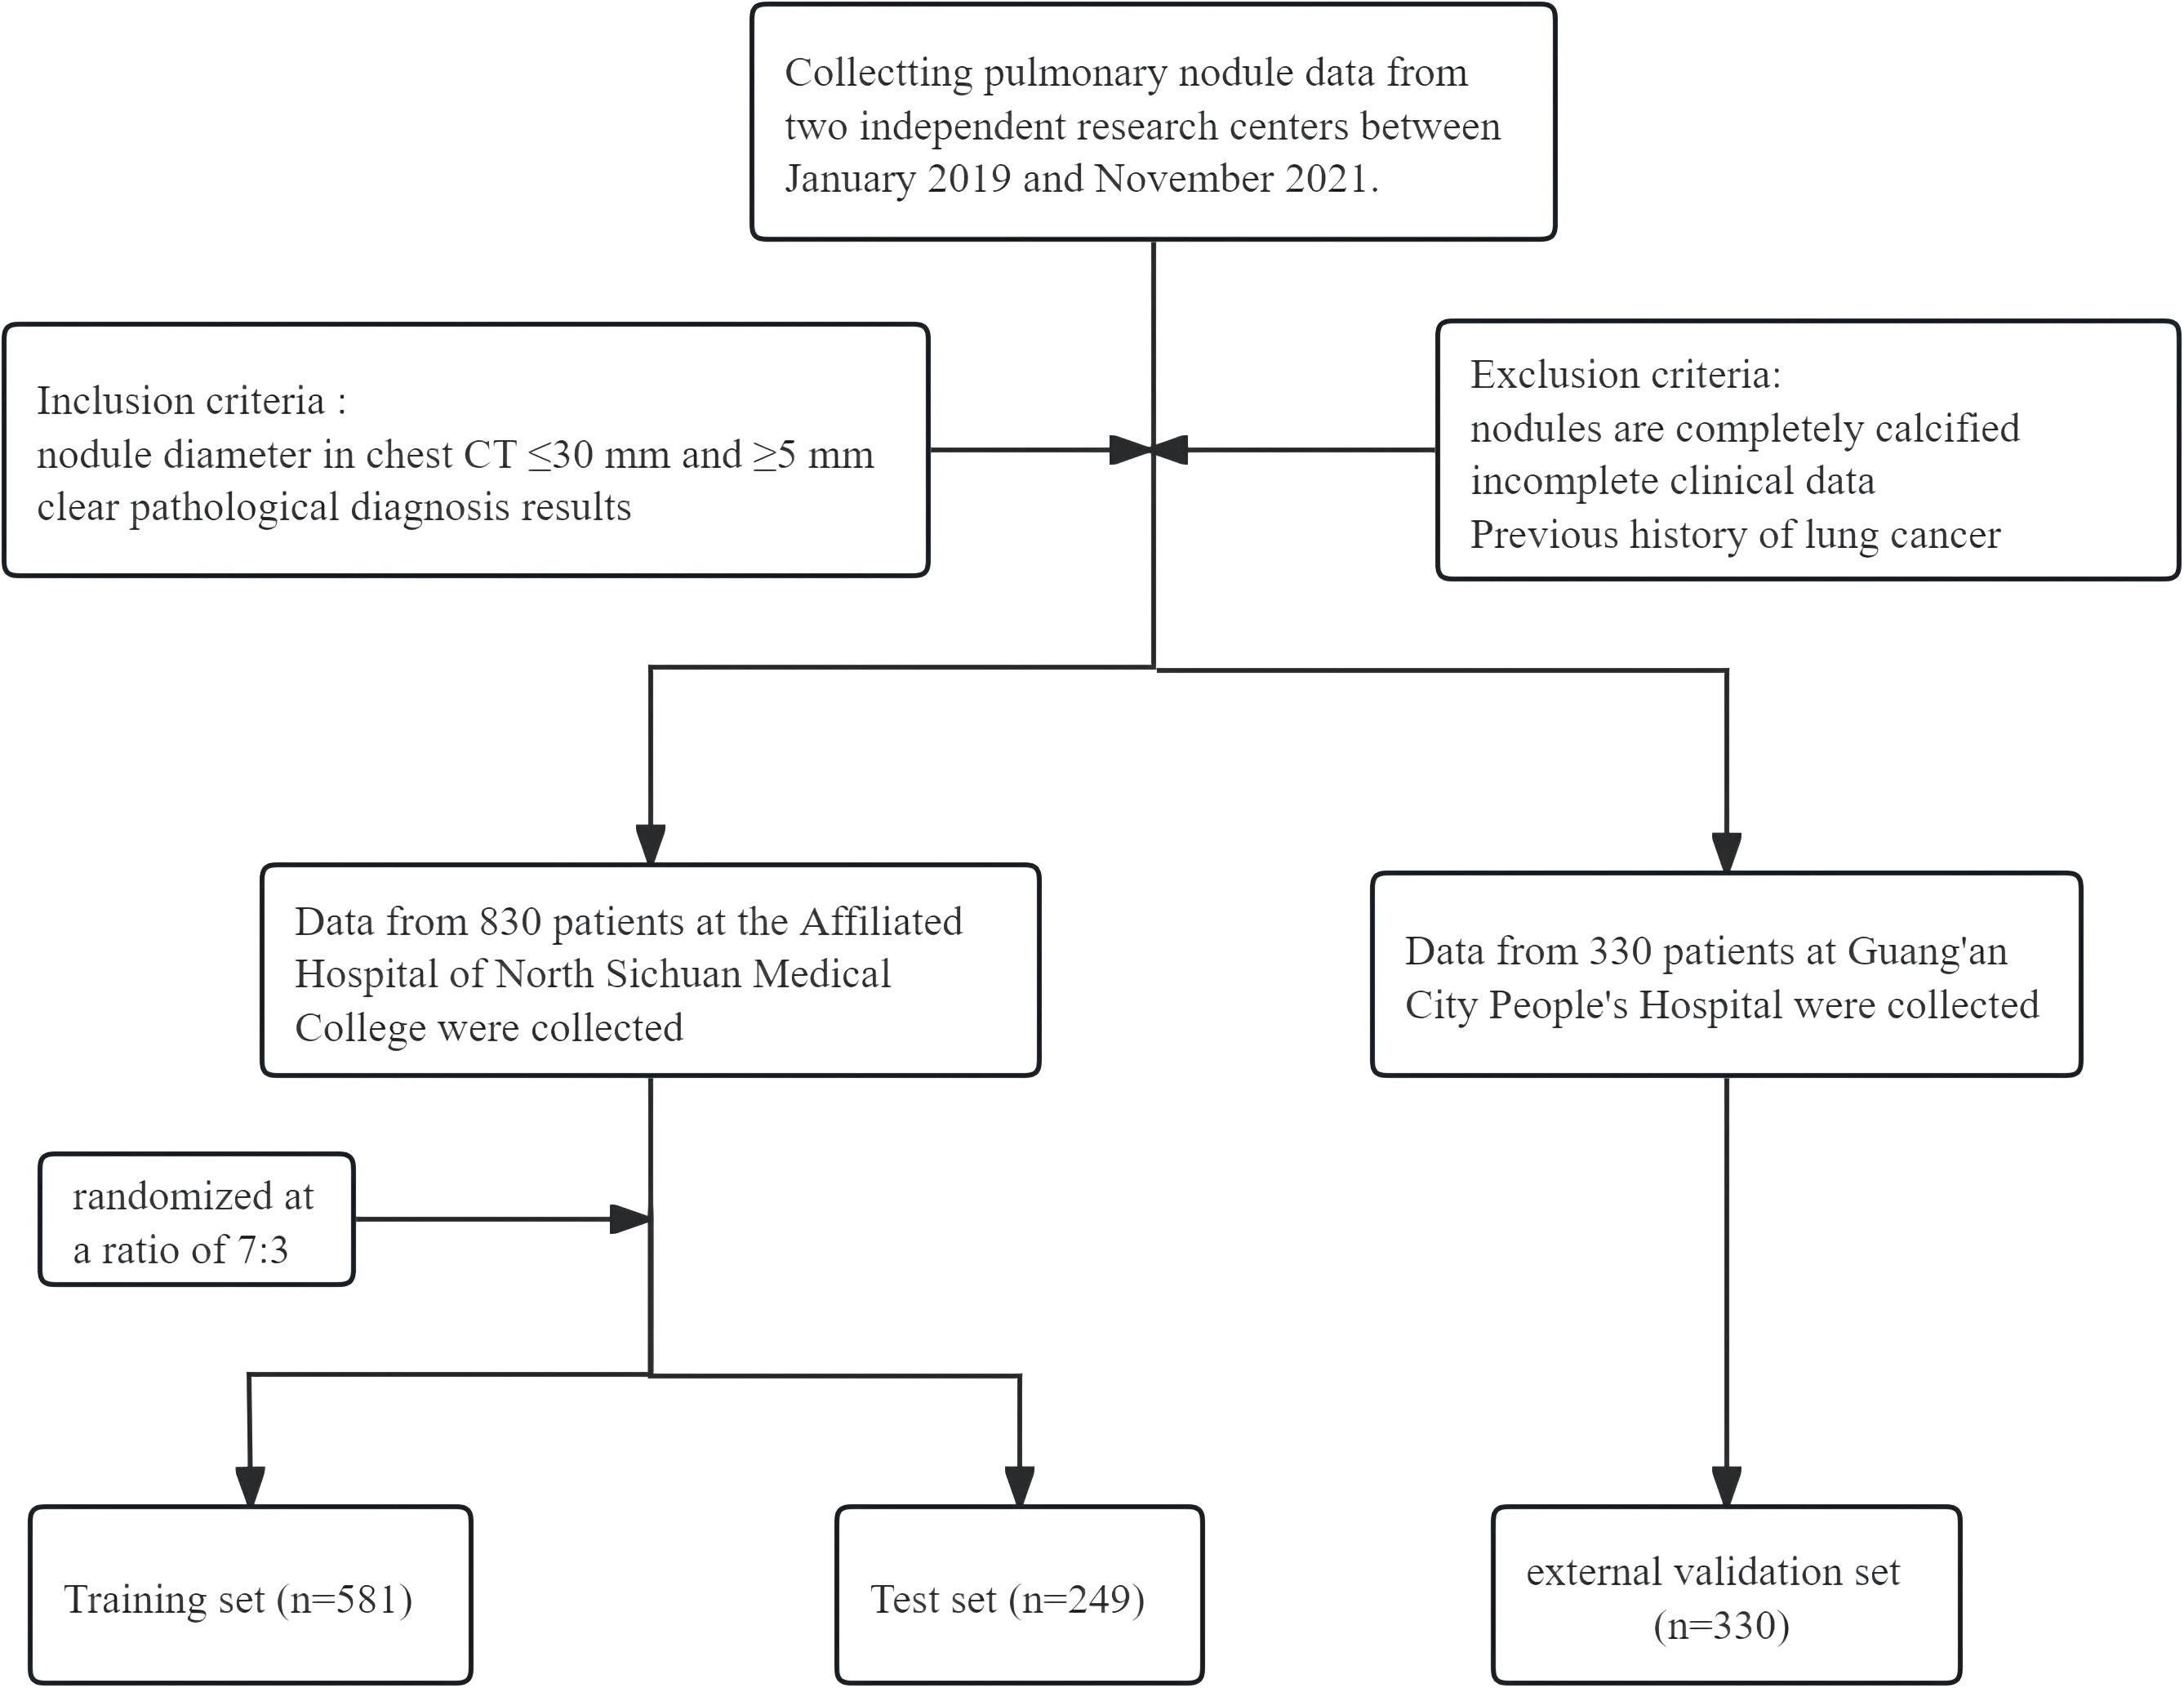
Figure 1. Flowchart of the studied subjects.
2.1.2 Inclusion criteria
Inclusion criteria (1): Presence of pulmonary nodules measuring 5–30 mm in diameter on chest CT scan; (2) Availability of definitive pathological diagnosis; (3) Completion of chest CT imaging prior to pathological confirmation.
2.1.3 Exclusion standards
Exclusion criteria: (1) Pulmonary nodules were completely calcified; (2)Patients were with incomplete clinical data; (3) Patients were with previous history of primary lung cancer.
2.2 Methods
2.2.1 Study Indicators
There were 23 variables:(1) General Information, including gender, smoking, annual smoking volume, dust exposure history, concomitant disease(Chronic Obstructive Pulmonary Disease, Diffuse Pulmonary Fibrosis, Previous Pulmonary Tuberculosis, Pneumoconiosis), tumor history, family history of tumor, family history of lung cancer, family history of non-lung malignancies, and age. (2) imaging features, including nodule diameter, pleural traction, air bronchogram sign, vascular convergence sign, vacuole, cavity, calcification, shape, lobulation, spiculation, edges (Smooth or rough), location(Left Upper Lobe, Left Lower Lobe, Right Upper Lobe, Right Middle Lobe, Right Lower Lobe), and nodule density (solid/part-solid/pure ground-glass).
2.2.2 Construction and evaluation of predictive models
(a) Screening of characteristic factors: First, least absolute shrinkage and selection operator (LASSO) regression analysis was performed using R software (glmnet 4.1.8) for variable screening and complexity adjustment. Subsequently, the results from LASSO regression analysis were subjected to multivariable logistic regression analysis. Finally, characteristic factors with p < 0.05 were identified. (b) Data splitting: Using Python (version 3.11.4) random module, patients from Affiliated Hospital of North Sichuan Medical College with pulmonary nodules were randomly divided into a training set and a test set in a 7:3 ratio, with 581 cases in the training set and 249 cases in the test set. (c) Analysis of multiple machine learning methods: eXtreme Gradient Boosting (XGBoost), Logistic regression, RandomForest, Gradient Boosting Decision Tree(GBDT), support vector machine (SVM), K-Nearest-Neighbors (KNN) were built by using python (version 3.11.4). Subsequently, we trained and validated the aforementioned parametric models, analyzed the significance of training and validation set metrics across different models, and ultimately selected the optimal model. Python (version 3.11.4) was used to calculate the Area under the Receiver Operating Characteristic (ROC) curve, which is commonly employed to evaluate the discriminative ability of predictive models (7). R software (version 4.2.3) implemented decision curve analysis (DCA) to generate clinical utility plots, thereby enabling the evaluation of both clinical significance and applicability of predictive models (8). Plot a calibration curve using Python to evaluate the model’s predictive capability and assess the consistency between the model’s predicted results and actual outcomes (9). Python was used to plot the precision-recall (PR) curves. PR and the area under the PR curve (AP) can provide complementary information to model evaluation methods (10). (d) Optimal model training, validation, and testing pipeline: Perform 10-fold cross-validation on the training set, and evaluate the model on the test set. Python was used to plot learning curves to assess model fitting and stability for both the training set and validation set (11). (e) We plotted the SHapley Additive exPlanations (SHAP) using Python. SHAP is a method for interpreting the predictions of machine learning models. It is based on the concept of Shapley values, which is an impartial method used in game theory to distribute the benefits of cooperation. The computation of Shapley values takes into account all possible combinations of features and evaluates the marginal contribution of each feature to the output of the model. SHAP can interpret the model’s results and calculate its predictive performance (12). (f) External testing of the model: The cohort of 330 pulmonary nodule patients from Guang’an People’s Hospital served as an external test set. Python (version 3.11.4) was used to plot the ROC curve and a calibration curve. R software (version 4.2.3) was used to construct the DCA.
2.2.3 Statistical analysis
Categorical variables were presented as numbers and percentages and compared using the Chi-square test. Continuous variables were expressed as median and interquartile range (IQR) and compared using the Mann-Whitney U test. Bilateral P-value less than 0.05 indicates statistical significance.
3 Results
3.1 Baseline data
In this study, we enrolled a total of 1,160 cases, comprising 830 patients from the Affiliated Hospital of North Sichuan Medical College (dataset 1) and 330 patients from Guang’an City People’s Hospital. In Dataset 1, the cohort comprised 388 males (46.7%) and 442 females (53.3%). Among the 243 subjects with benign nodules, 150 were male (61.7%) and 93 were female (38.3%). Of the 587 patients diagnosed with malignant nodules, 238 were male (40.5%) and 349 were female (59.5%). The specific baseline data of the final Dataset 1 is presented in Table 1.
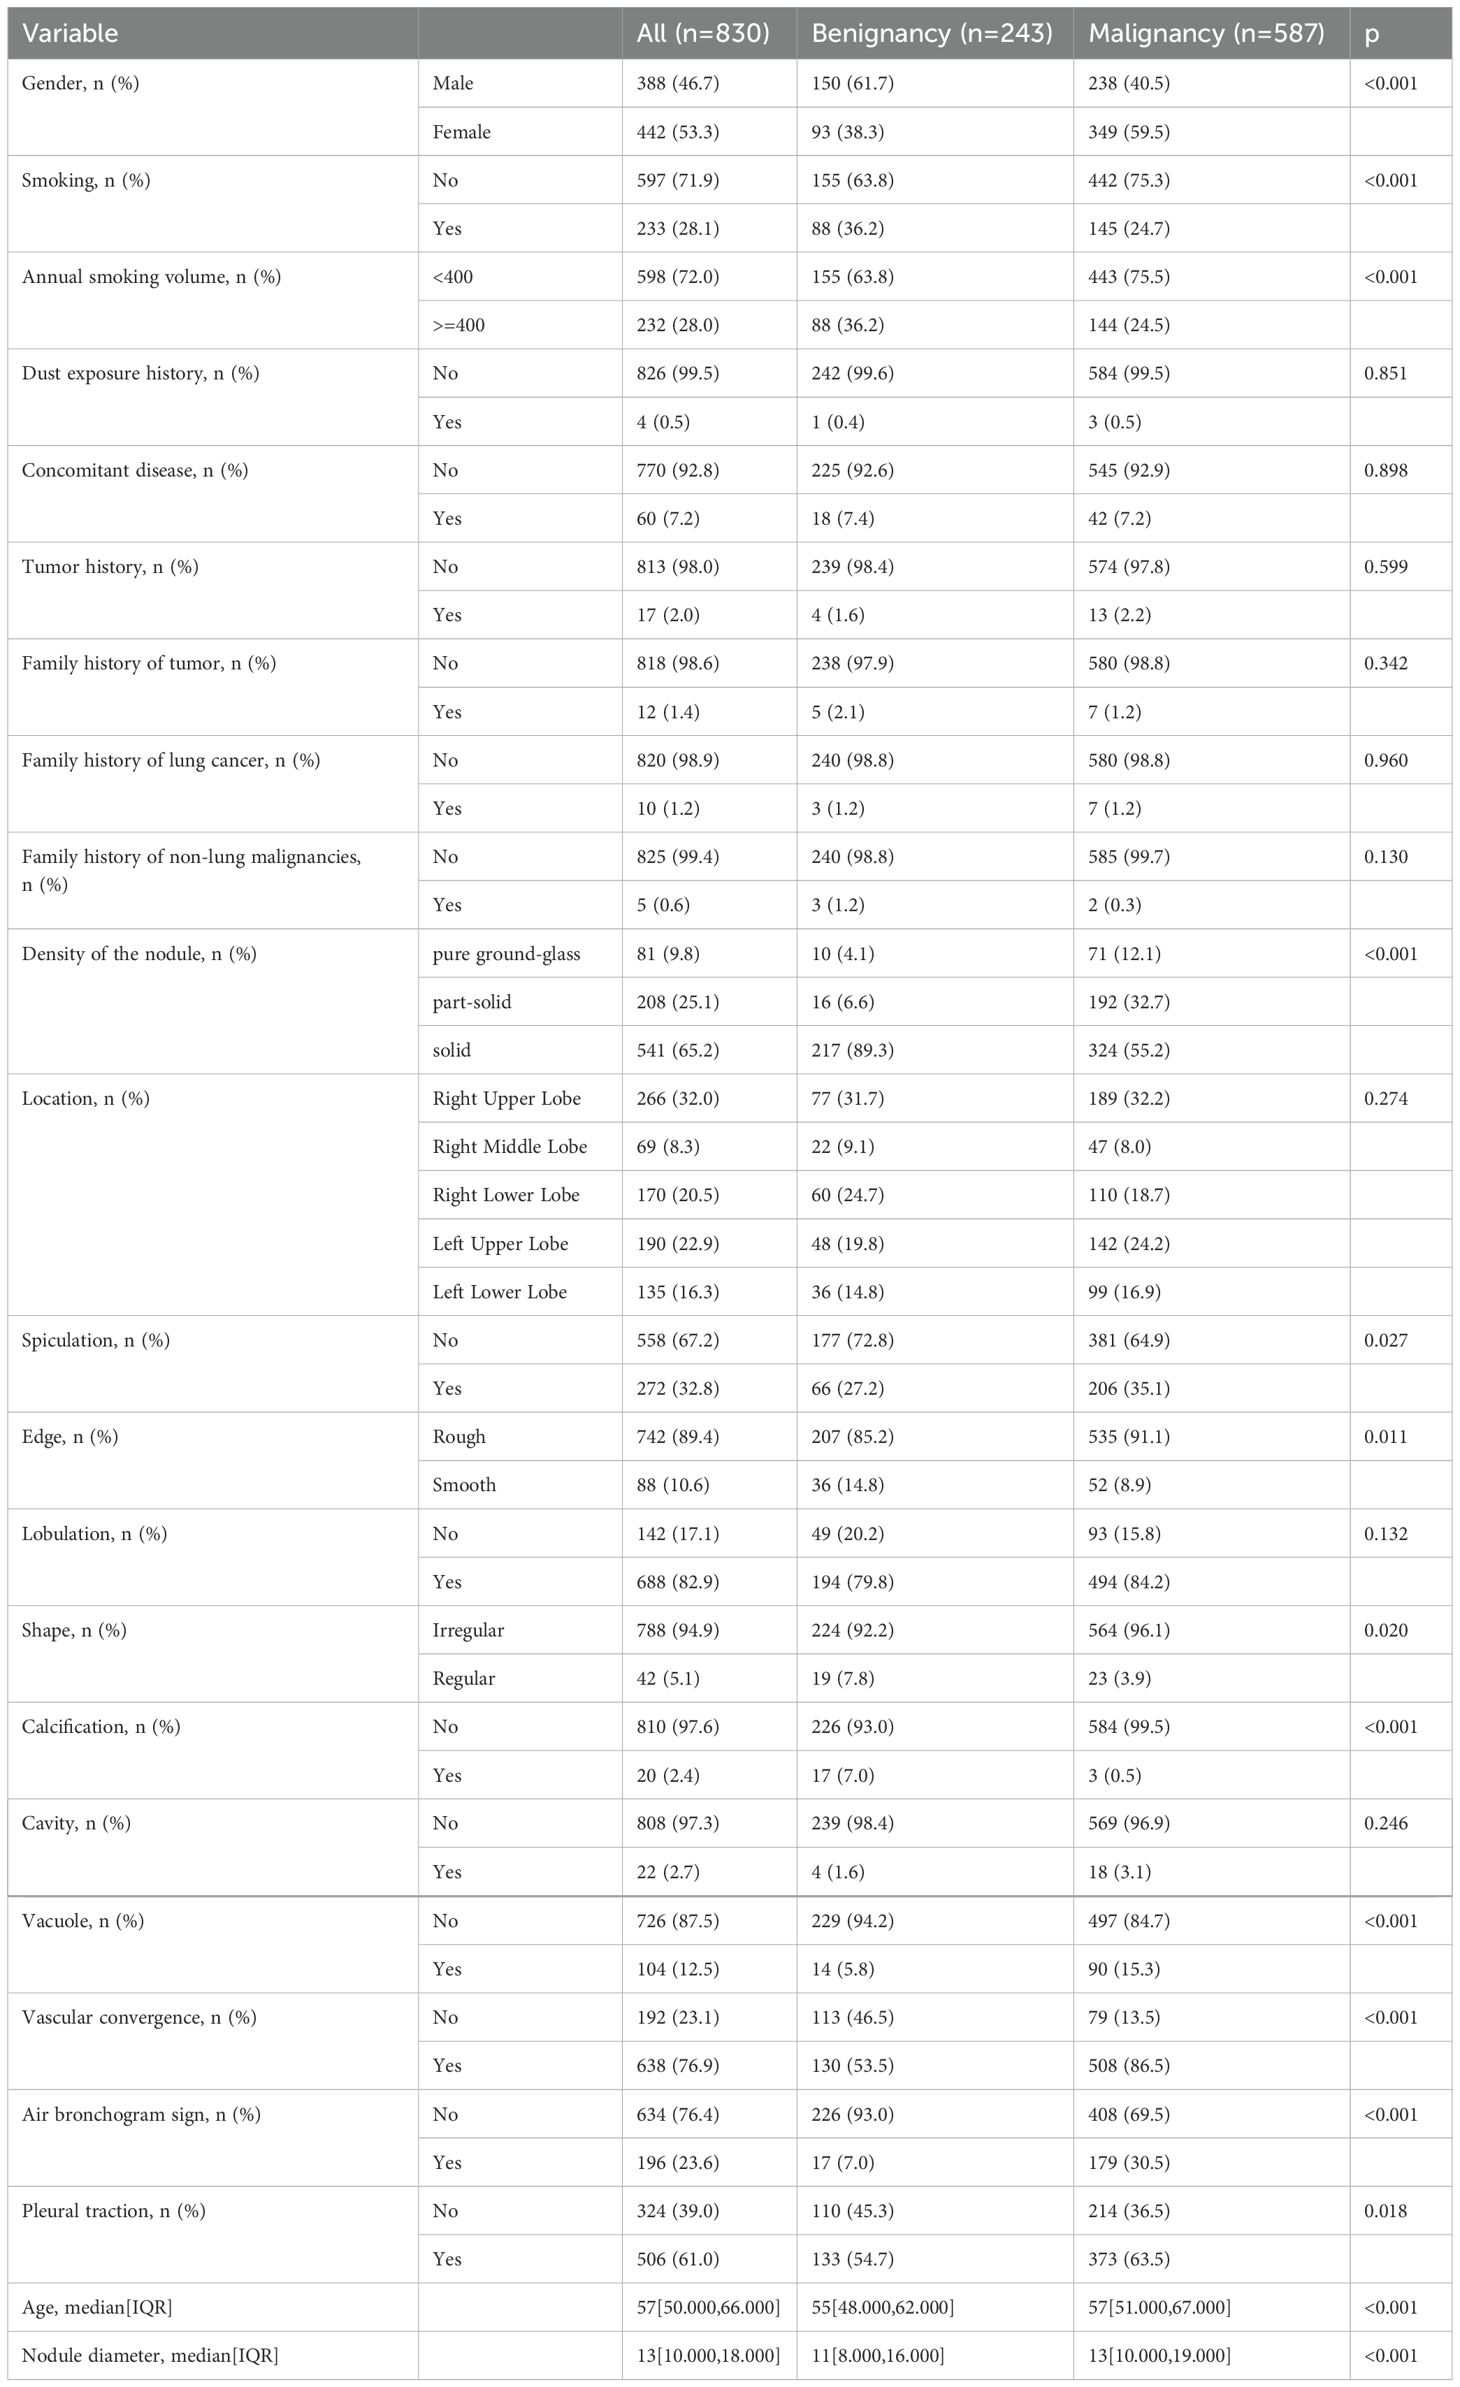
Table 1. Baseline characteristics in dataset 1.
3.2 Screening of characteristic factors for lung cancer risk in patients with pulmonary nodules
Perform LASSO regression analysis on the independent variables, with malignant nodules as the dependent variable (Figure 2). The results showed that 16 independent variables were selected (with lambda = 0.008 corresponding to the minimum mean squared error), including spiculation, lobulation, calcification, cavity, vacuole, vascular convergence sign, air bronchogram sign, pleural traction, dust exposure history, tumor history, family history of tumor, family history of non-lung malignancies, density of the nodule, gender, age, and nodule diameter. Then, multivariable logistic regression analysis was used to analyze the aforementioned 16 independent variables. We identified 11 characteristic factors, including age, gender, nodule diameter, spiculation, lobulation, calcification, vacuole, vascular convergence sign, air bronchogram sign, pleural traction, density of the nodule (p < 0.05), as Table 2.
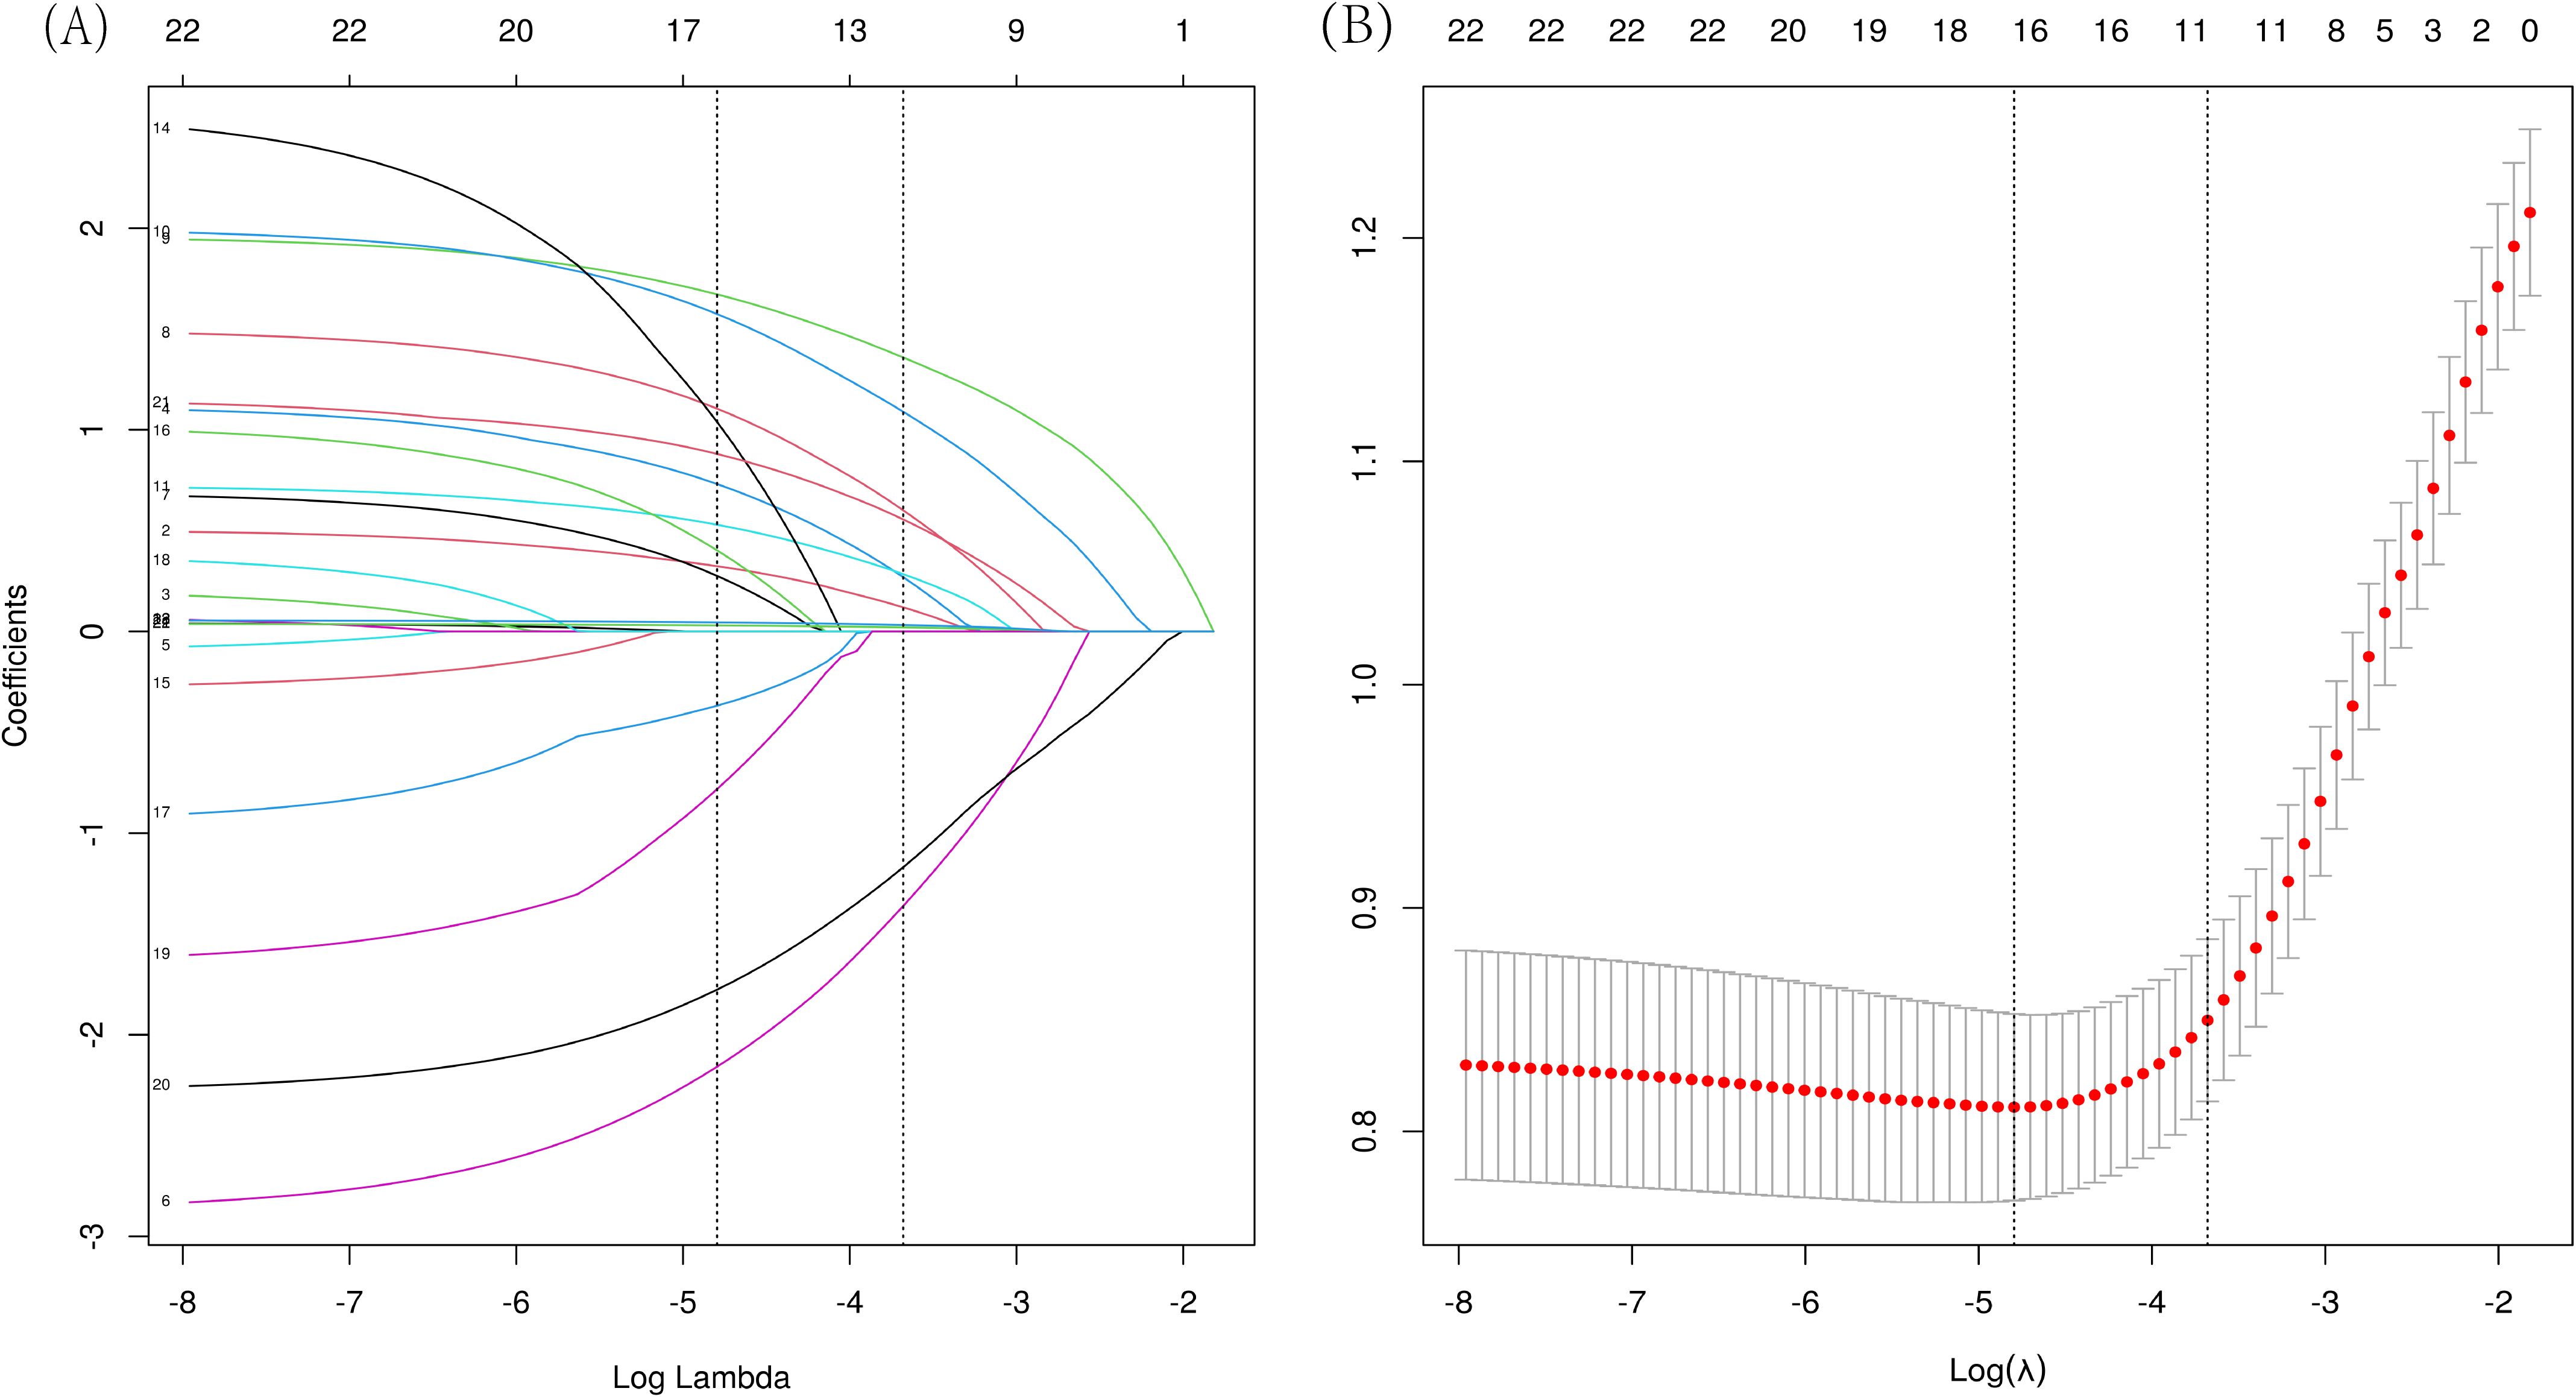
Figure 2. LASSO regression analysis was used to select characteristic factors. (A) The use of 10‐fold cross-validation to draw vertical lines at selected values, where the optimal lambda produces eleven nonzero coefficients. (B) In the LASSO model, the coefficient profiles of 23 texture features were extracted from logarithmic (λ) sequences. The vertical dashed line is plotted with the minimum mean square error (λ = 0.008) and the error of the minimum distance (λ = 0.025).
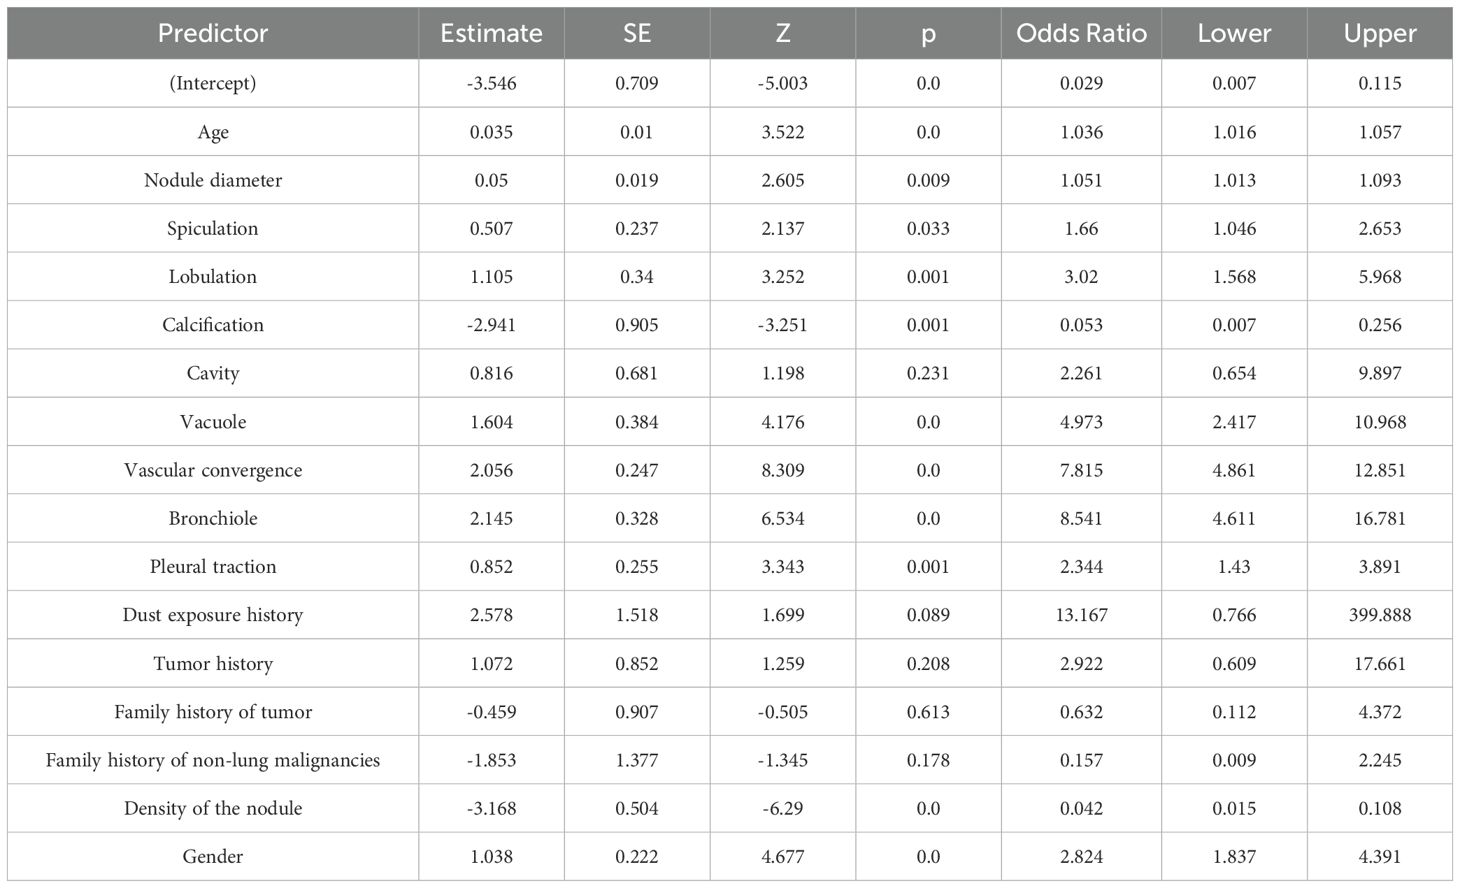
Table 2. Multivariate logistic regression analysis.
3.3 Analysis of multiple machine learning methods
XGBoost, Logistic regression, RandomForest, GBDT, SVM, and KNN were trained and repeated 10 times. The evaluation using Area Under the Curve (AUC) values showed that XGBoost and RandomForest achieved the highest scores in the training set, while GBDT attained the highest performance in the validation set (Figures 3A, B). The DCA evaluated GBDT with better clinical applicability (Figure 3C). The calibration curve indicates better agreement between the predicted probabilities and actual probabilities for both the GBDT and Logistic regression models (Figure 3D). The GBDT model demonstrated the best performance in both the training and validation sets, while achieving the highest AP value in the validation set (Figures 3E, F). The comprehensive analysis indicated that GBDT could be the optimal model.
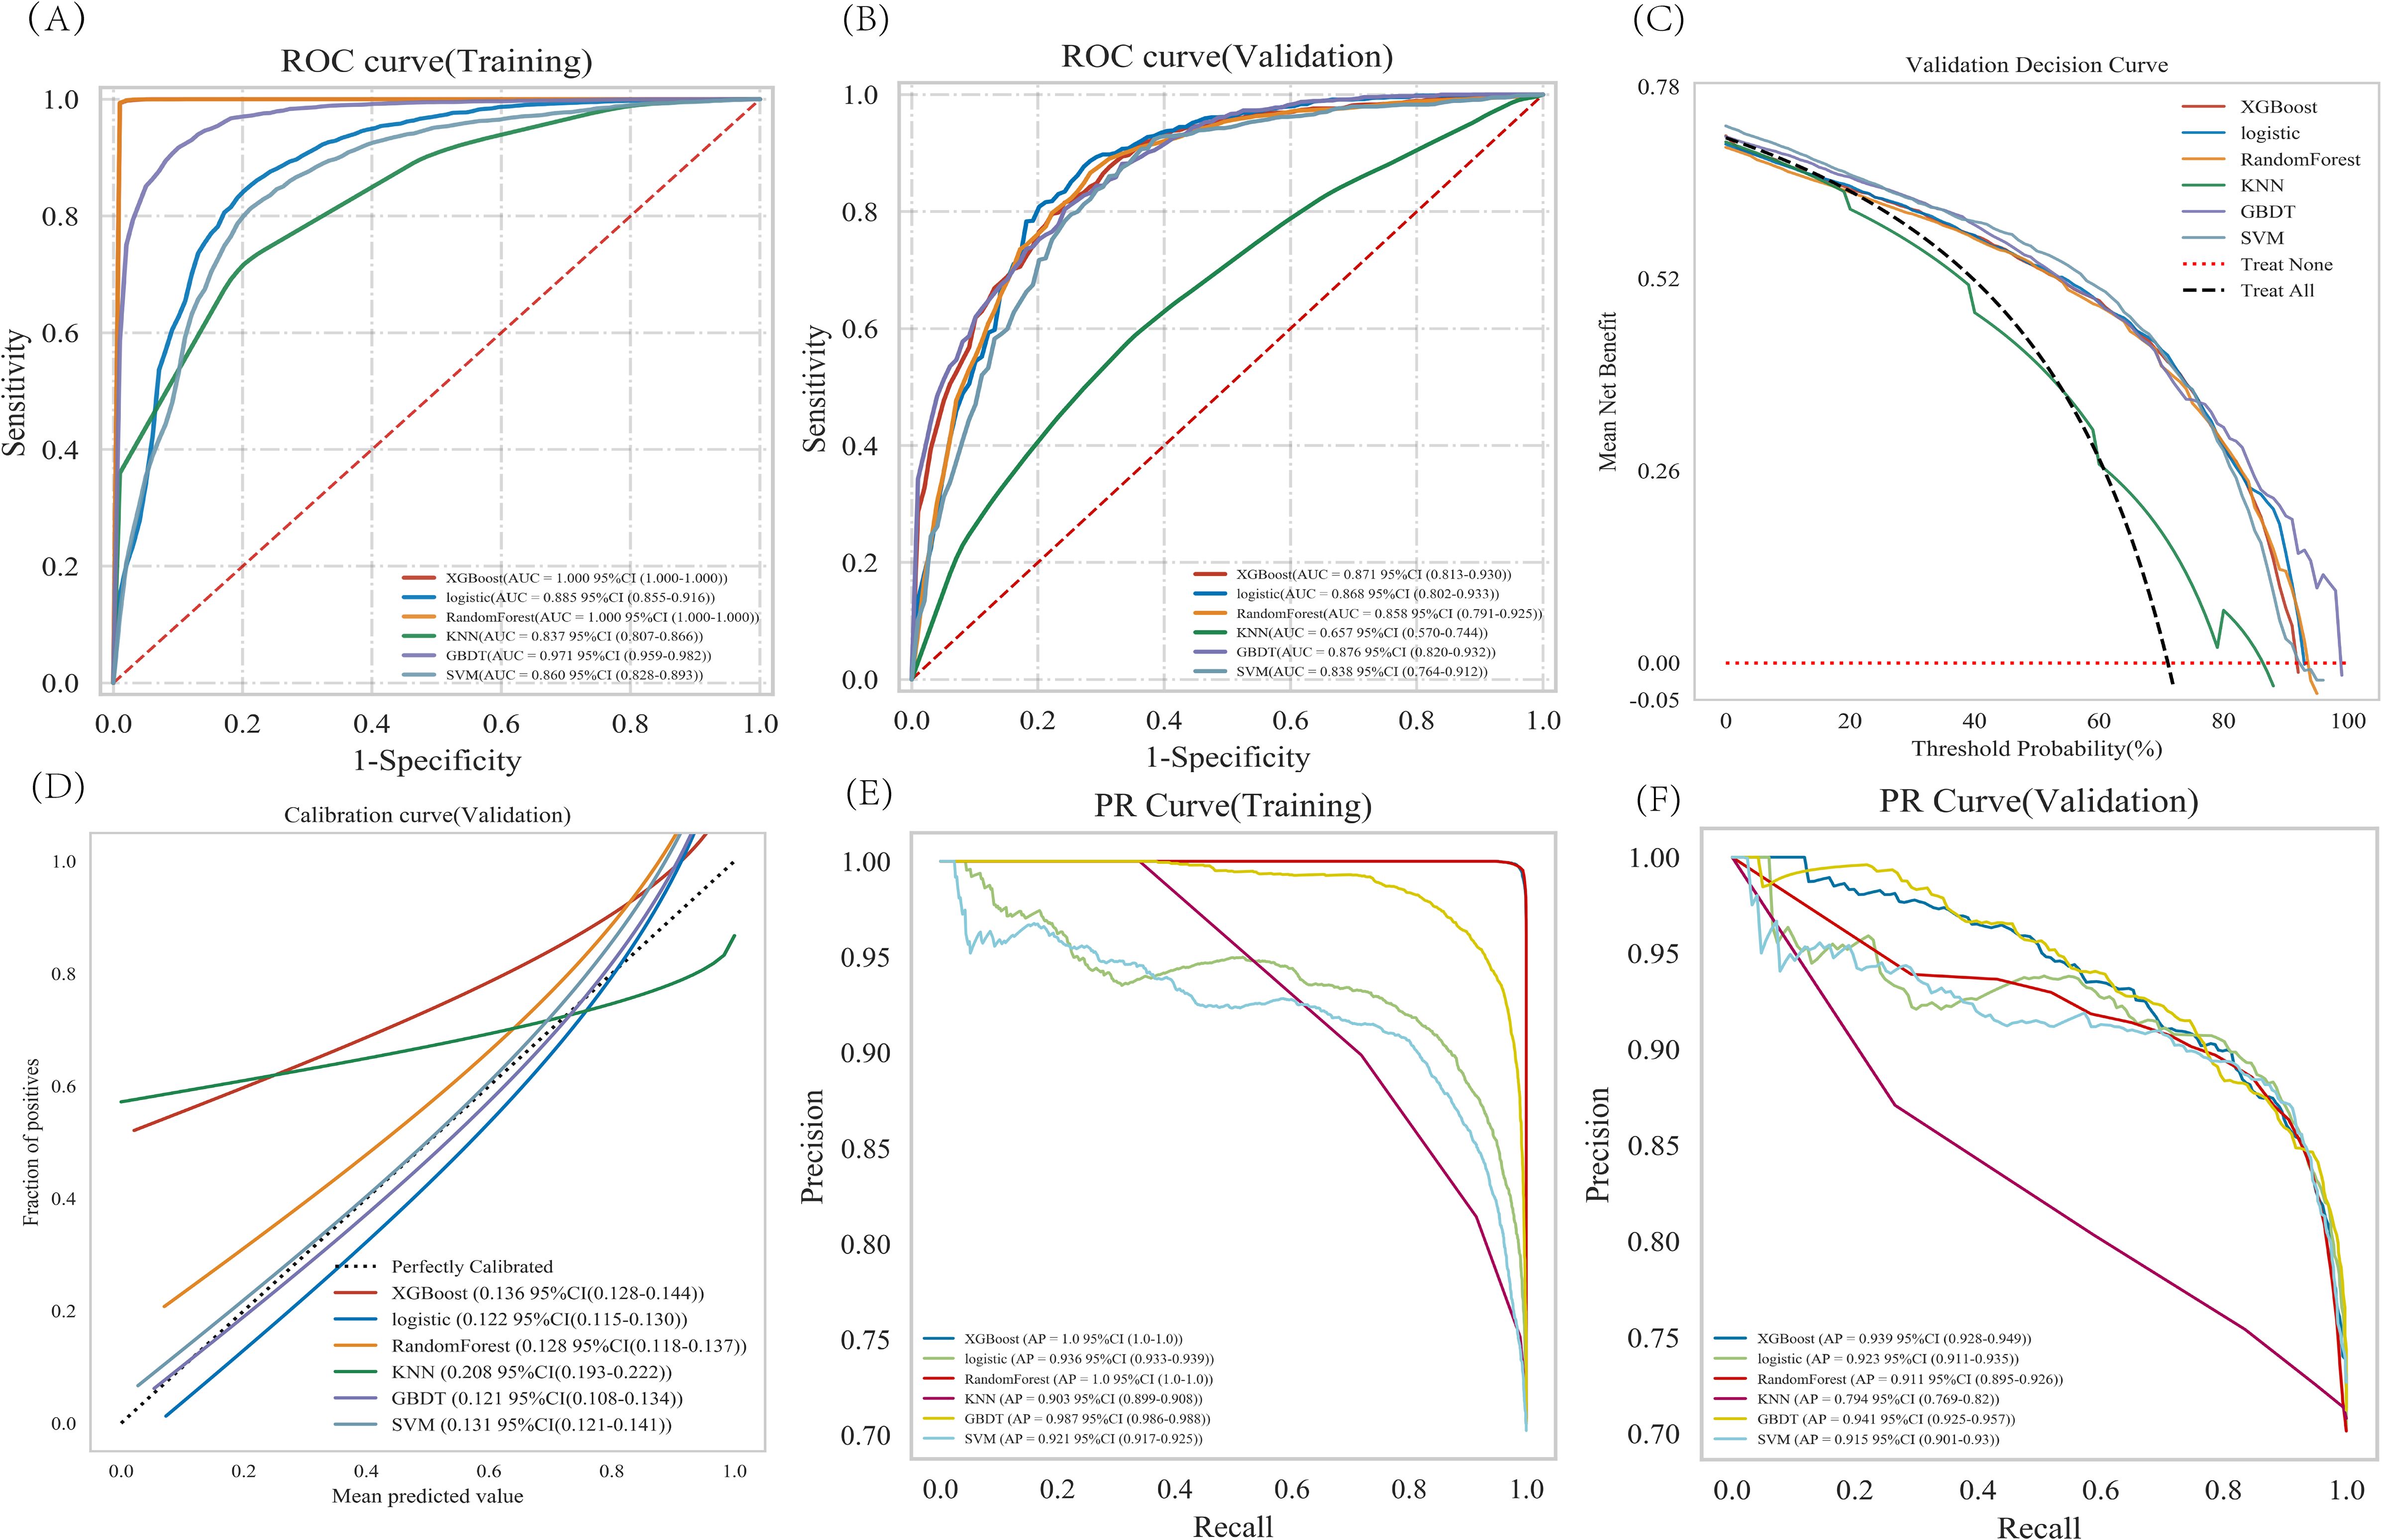
Figure 3. Analysis of multiple machine learning methods. (A, B) Training set and validation set ROC and AUC. (C) In the validation set DCA, the black dashed line indicates the hypothesis that all patients have pulmonary malignant nodules, while the red dashed line represents the alternative hypothesis that none of the patients have malignant nodules. The solid lines correspond to different predictive models. (D) For the calibration curve of the validation set, the horizontal axis represents the average predicted probability, the vertical axis denotes the actual probability of the event. The dashed diagonal line serves as a reference, while other smoothed solid lines correspond to the fitting curves of different models. The closer a fitted line is to the reference line (with smaller value in parentheses), the more accurate the model’s prediction is. (E, F) Training set and validation set PR curve and AP. The y-axis is precision and the x-axis is recall. The higher the AP value, the better the model performance. Different colors in the image represent corresponding models.
3.4 Optimal model construction and evaluation
The training set was subjected to GBDT analysis with 10-fold cross-validation. The results show that the validation set had an average AUC of 0.8157 (0.604-0.9789), and the test set achieved an AUC of 0.8727 (0.840-0.906) (Figures 4A–C). The model could be deemed successfully fitted as the validation set’s performance under the AUC metric does not exceed that of the test set, or the margin of exceedance was less than 10%. The learning curve indicated that both the training set and validation set demonstrated good stability and fitting (Figure 4D). These results indicated that the GBDT model can be applied to our dataset for classification modeling tasks.
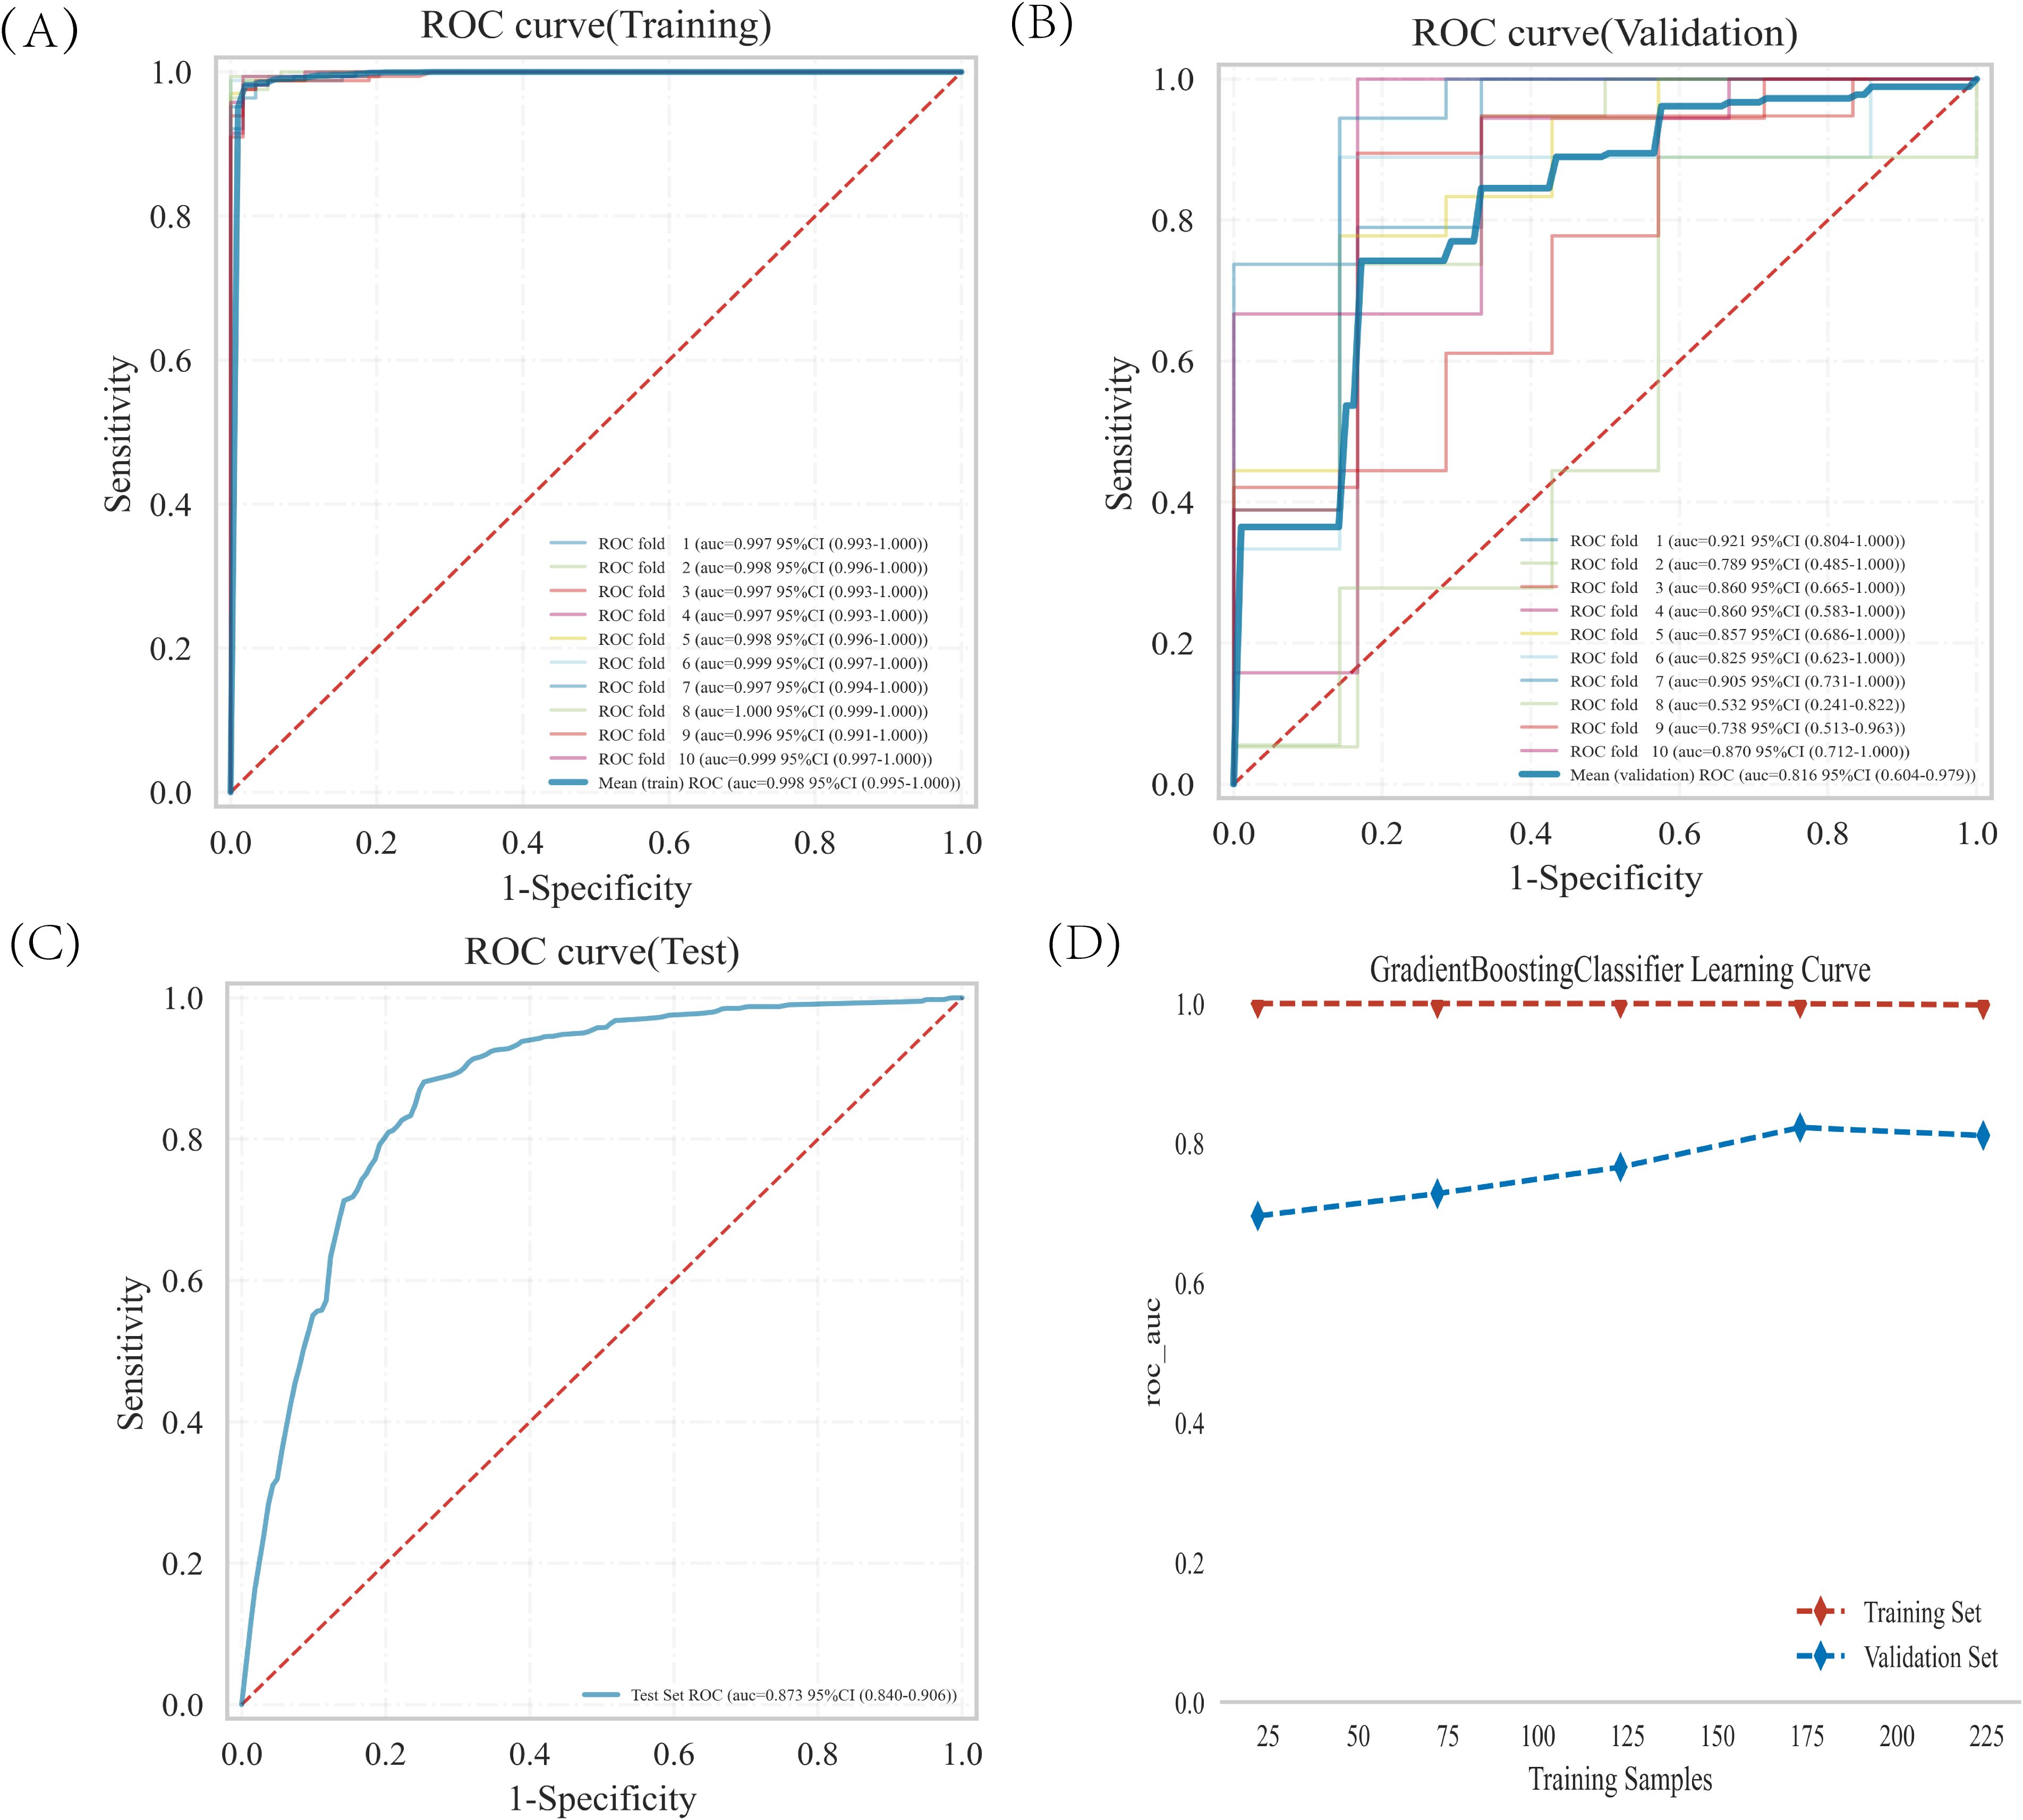
Figure 4. GBDT model training, validation, and testing. (A, B) Training sets and validation sets ROC and AUC. Different-colored solid lines represent 10 distinct results. (C) Test set ROC and AUC. (D) Learning curves. The red dashed line represent the training set, and the blue dashed line represent the validation set.
3.5 Interpretation of the model by SHAP
Figure 5A displays the 11 characteristic factors in our model, which are associated with the malignant risk in patients with pulmonary nodules. Each line corresponding to a feature factor is plotted with dots of different colors; blue dots indicate low risk, while red dots represent high risk. Figure 5B shows the ranking of 11 feature factors assessed by the mean absolute SHAP values, where the x-axis SHAP values indicate the importance of the feature factors in the model. We also provide two examples to illustrate the interpretability of the model: one patient with benign pulmonary nodules received a low SHAP prediction score (0.07)(Figure 5C), while another patient with malignant pulmonary nodules obtained a significantly higher SHAP score (0.94)(Figure 5D).
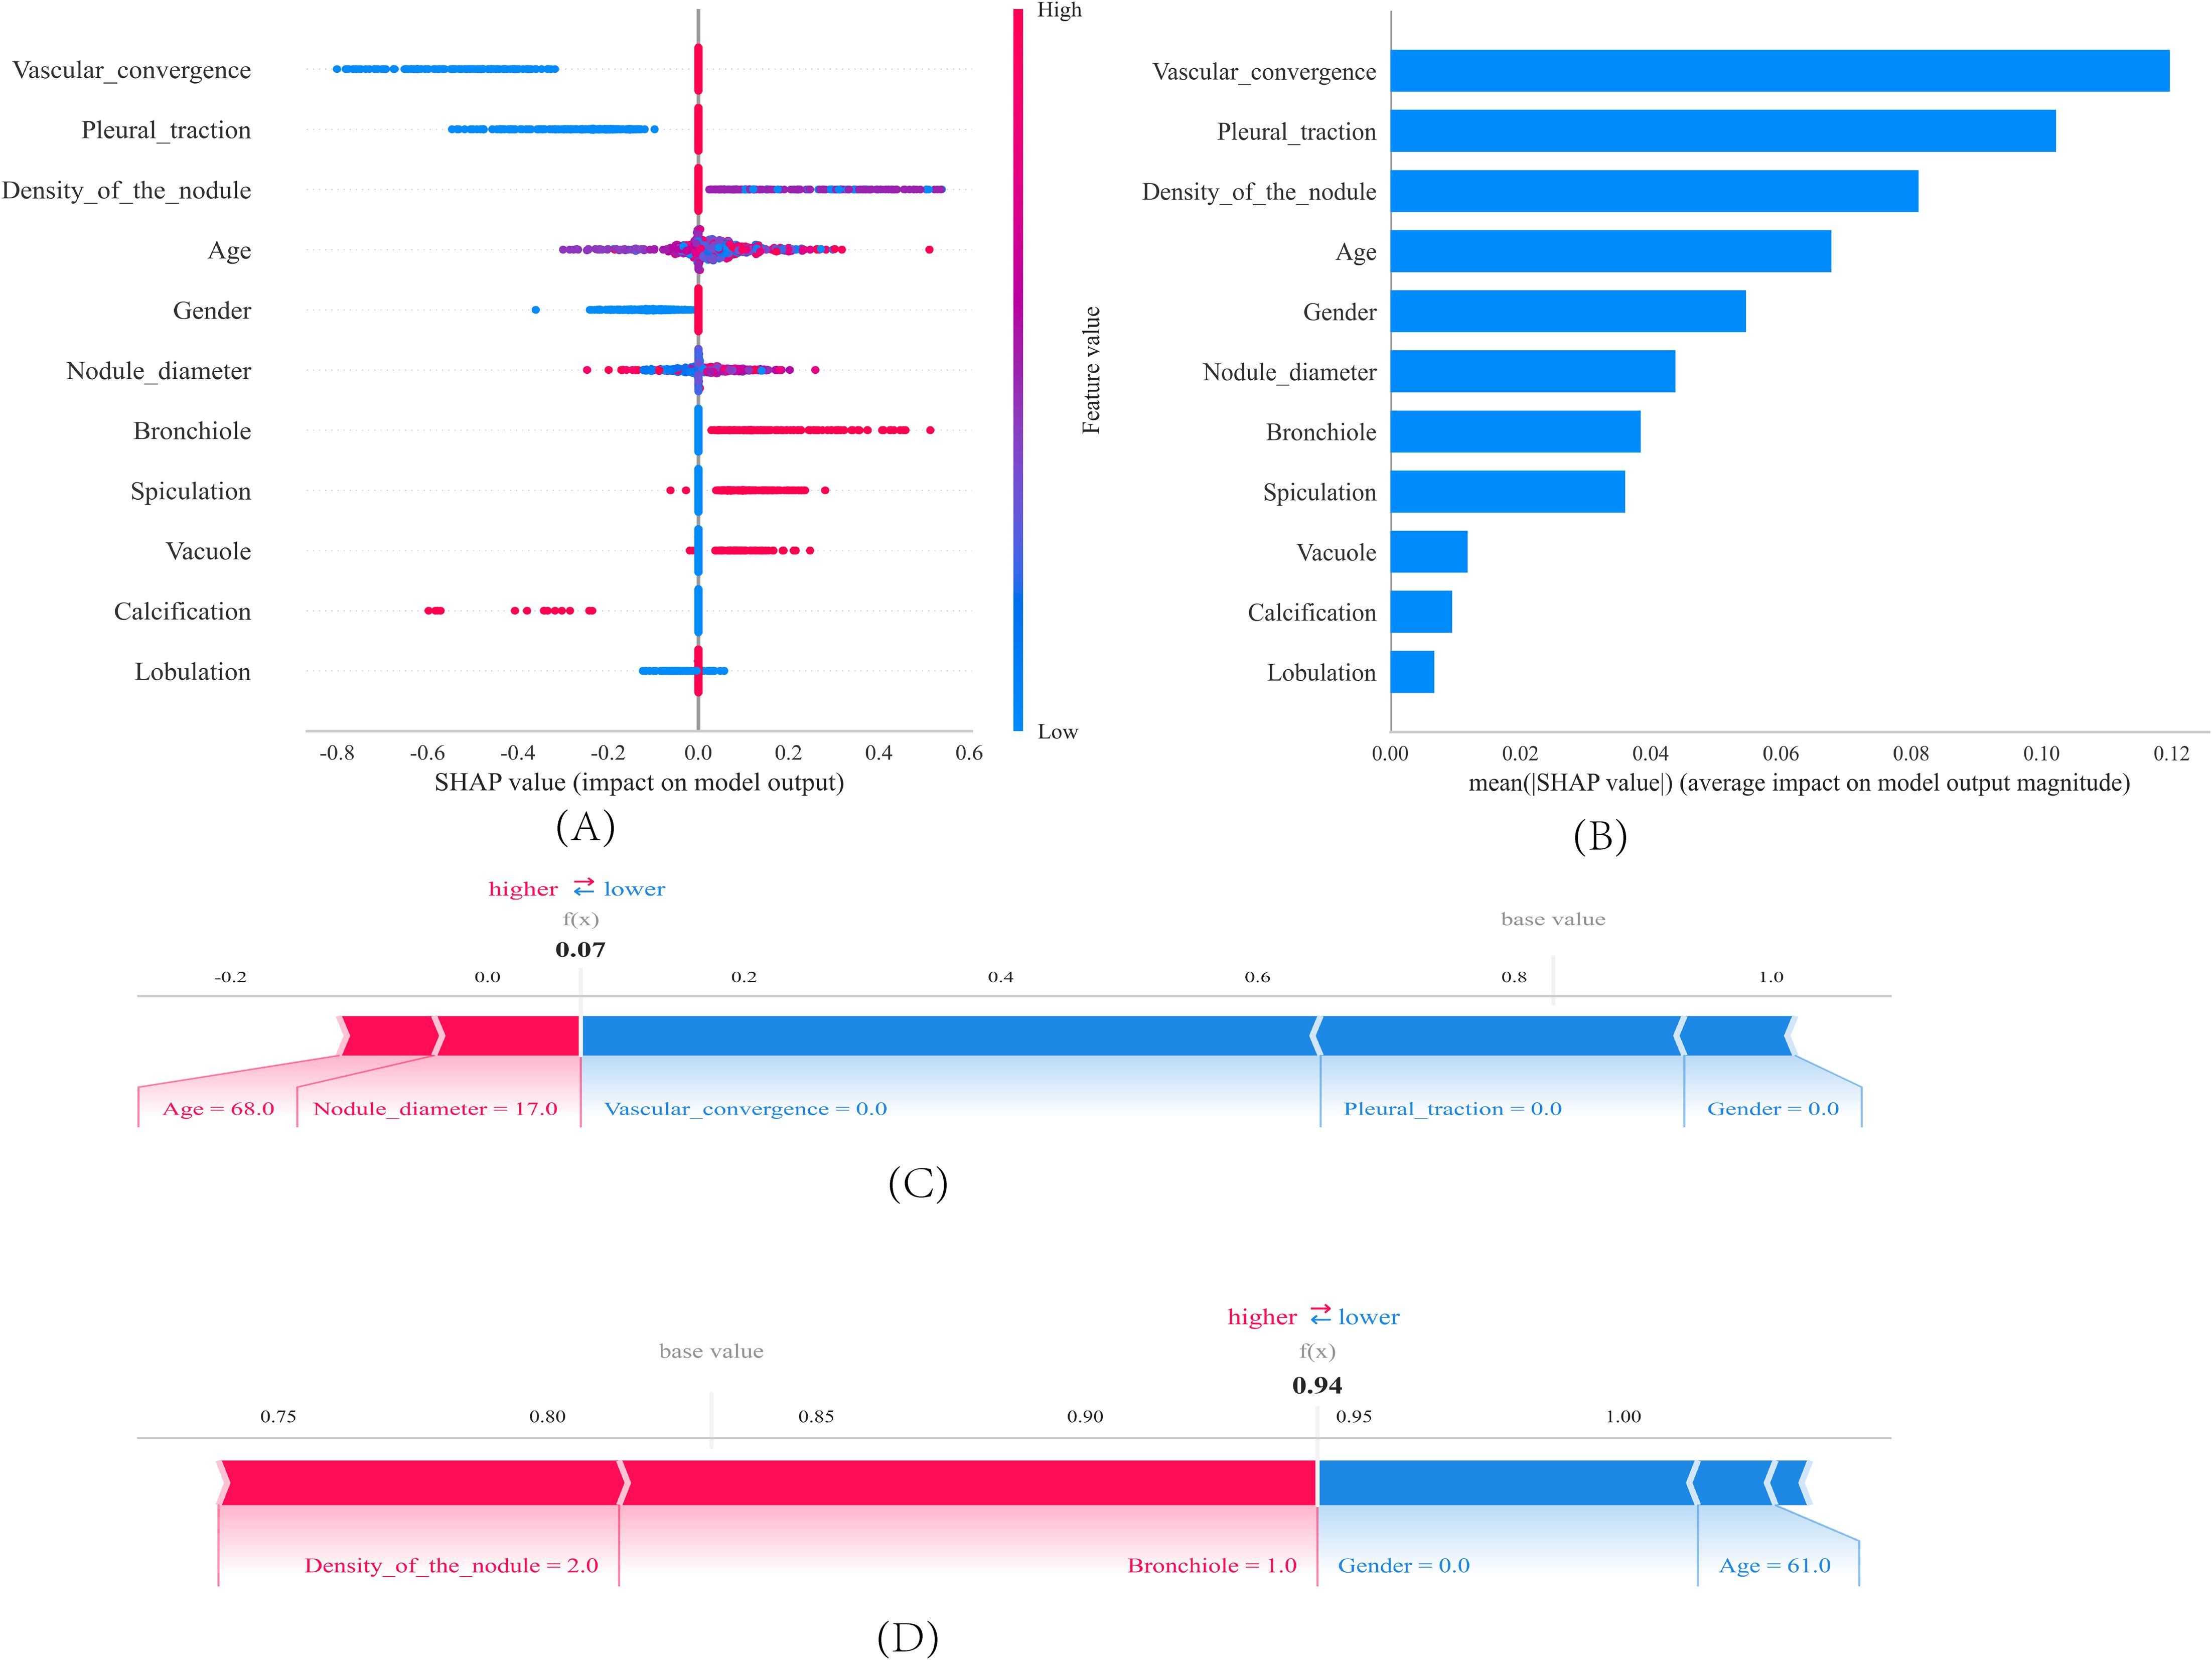
Figure 5. SHAP interprets the model. (A) Feature contributions in SHAP. Each line represents a feature, with the x-axis indicating SHAP values. Red dots denote higher feature values, while blue dots indicate lower feature values. (B) SHAP-indicated feature importance ranking. The matrix plot illustrates the importance of each covariate in the development of the final predictive model. (C, D) SHAP Scores in Patients with Benign and Malignant Pulmonary Nodules. SHAP values indicate the contribution of individual patients’ predictive features to the predicted probability. Red features indicate increased risk, while blue features represent reduced risk. The length of the arrows helps visualize the extent to which the prediction is influenced. A longer arrow corresponds to a more significant effect.
3.6 External testing of the model
The GBDT analysis conducted on the external test set demonstrated an AUC of 0.726 (Figure 6A). The decision curve analysis (DCA) (Figure 6C) performed on the external test set demonstrated that implementing interventions within a reasonable range of threshold probabilities might offer greater clinical benefits compared to intervening in all patients or none. The calibration curve of the developed model was evaluated in an external testing cohort, and the results demonstrated a good model fit (Figure 6B).
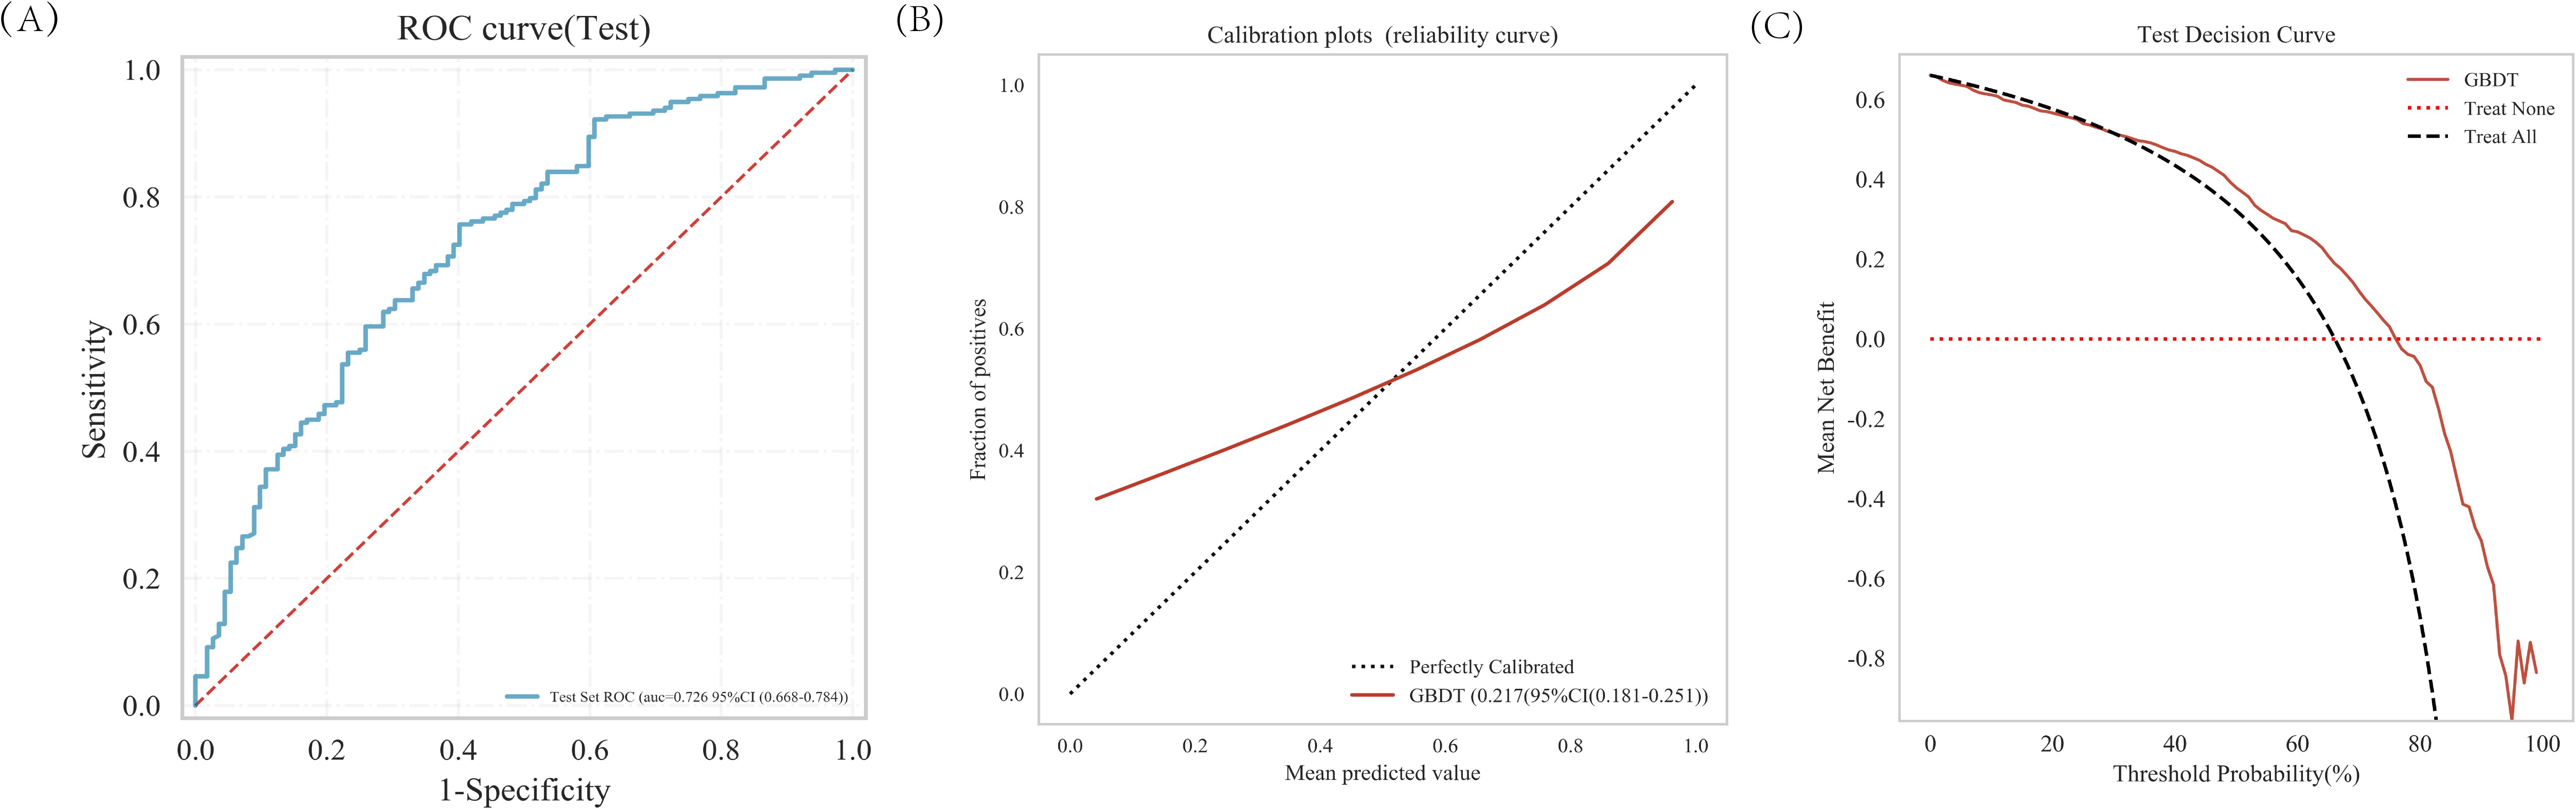
Figure 6. The predictive value and clinical application of the GBDT model in the external test set. (A) The ROC curve and AUC of external test set. (B) Calibration of the external test set. (C) Decision curve analysis of the external test set.
4 Discussion
In this study, we included patients with pulmonary nodules measuring 5–30 mm in diameter, and excluded patients with completely calcified nodules. It is very low of the prevalence of malignant pulmonary nodules measuring <5 mm (13). In the NELSON study, malignancy risk in patients with pulmonary nodules measuring <5 mm was similar to subjects without the nodules (14). In addition, the nodule diameter threshold for the need of follow-up has been decided as 5 mm for BTS guidelines (15). So we included nodules of the diameter ≥5 mm for our research objects. Unlike partially calcified nodule is unclear benign or malignant, completely calcified nodule is benign lesion. Research by Zhou Y et al. (16) showing that 0.90% of partially calcified nodules were diagnosed as malignant and two cases of calcified nodules were benign. Calcification is usually relate to the healing of old lesions and represents stable, benign lesions (17). In particular, diffuse calcifications is highly indicate benign lesions (18).
Our results show that eleven characteristic variables (age, gender, nodule diameter, spiculation, lobulation, calcification, vacuole, vascular convergence, bronchiole, pleural traction, density of the nodule) were screened by LASSO and multivariate logistic regression analysis from 23 clinical and CT variables to assess the risk of lung cancer in patients. These findings align with existing literature on malignant pulmonary nodule assessment. For example, in a large retrospective study, development, and external and internal validation of the model to predict the risk of lung cancer, using data from 19.67 million people has shown that the predictors included age and sex (19).Han DH et al. reported increased age was associated with participants who developed lung cancer (20). A nationwide, prospective cohort, multicenter study have demonstrated that female sex and age older than 60 years were related to an increased risk of invasive lung cancer (21). A recent study reported that the size of pulmonary nodule is the key factor to assess malignancy. The probability of malignant nodules was positively correlated with their diameter (22). Spiculation occurs as tumor cell infiltrate into the adjacent bronchial vascular sheath or local lymphatic vessels, or as tumor-associated fibrous bands stimulate connective tissue formation (23).A new scoring system for predicting malignant pulmonary nodules suggested that spiculation was an independent risk factor. A recent study indicated that features such as spiculation, lobulation had significant predictive value for the malignant nodule (24). Research by Liu et al. (25) supports our finding, showing that lobulation was the Imaging characteristics suggesting malignancy.
The calcification, particularly central and layered calcifications are highly indicative of benign lesions (26, 27). Our study also identified calcification as a protective factor. Vacuoles are areas of low attenuation due to small air within the nodule containing the bronchi. The appearance of vacuole has also been reported to be associated with malignant lung nodules (28). Vascular signs are important indicators of malignant tumors, and tumor growth and metastasis depend on new blood vessels. consistent with previous studies (29), vascular convergence was also identified as independent risk factor for lung nodule in our study. Our study showed that the density of pulmonary nodules is associated with their risk of malignancy. Previous study has demonstrated that, compared to solid nodules, part-solid nodules carry a higher risk of malignancy, while pure ground-glass nodules have the lowest malignant potential (30). Their corresponding malignancy rates were 7%, 63%, and 18%, respectively (31). Pleural traction is typically caused by the traction force exerted on the pleura due to tumor growth around a pulmonary nodule. This traction force may result from tumor cells invading surrounding tissues and extending to the pleural membrane. Bronchiolar signs refers to the presence of lucent shadows resembling bronchial structures within pulmonary nodules on CT scans. This phenomenon is typically caused by either the preservation of partial airway structures within the tumor or the compression of surrounding airways by the tumor. Our findings also indicated that pleural traction and bronchiolar signs were characteristic manifestations of malignant pulmonary nodules, which aligns with previous research findings (32, 33).
In our study, we employed multiple machine learning classification models to construct predictive models. The analysis revealed that the Gradient Boosting Decision Tree (GBDT) model outperformed other models. We applied the SHAP method to the GBDT model, which provided both a more comprehensive interpretation of the predictive model and a more intuitive visualization of prediction outcomes. The results demonstrate that features including lobulation, calcification, vacuole, spiculation, bronchiole, nodule diameter, gender, age, density of the nodule, pleural traction and vascular convergence exhibit a progressively increasing contribution to the model, indicating their gradually enhanced diagnostic value in assessing the malignancy risk of pulmonary nodules. The data for this research were sourced from two independent research centers, and our study incorporated both internal validation, testing and independent external testing components, which has enhanced the generalizability of our research findings.
Our study has several limitations. First, this is a retrospective study, and future prospective studies are needed to further validate its performance. Second, external testing of the model in this research was conducted only at a single medical center; additional data from multiple centers are still required for external testing. Furthermore, due to the extremely low probability of malignancy in nodules smaller than 5 mm in diameter, such cases were not included in our dataset. Future studies are necessary to verify the applicability of our model to nodules with diameters less than 5 mm.
5 Conclusions
This study constructed a predictive model based on multiple machine learning classification models, among which the GBDT model demonstrated superior performance. External testing further supported the robustness of our model. We provided personalized risk assessment for early-stage lung cancer development in patients with pulmonary nodules, interpreted through the SHAP method. This computer-aided approach exhibits potential value in the management of pulmonary nodules.
Data availability statement
The original contributions presented in the study are included in the article/supplementary material. Further inquiries can be directed to the corresponding author.
Ethics statement
This study was approved by the Medical Ethics Committee of North Sichuan Medical College Affiliated Hospital (File Number: 2022ER234-1). The studies were conducted in accordance with the local legislation and institutional requirements. The ethics committee/institutional review board waived the requirement of written informed consent for participation from the participants or the participants’ legal guardians/next of kin because this was a retrospective analysis.
Author contributions
YH: Conceptualization, Data curation, Formal Analysis, Investigation, Methodology, Project administration, Resources, Supervision, Validation, Visualization, Writing – original draft, Writing – review & editing. YC: Conceptualization, Data curation, Formal Analysis, Investigation, Methodology, Project administration, Software, Supervision, Validation, Visualization, Writing – original draft, Writing – review & editing. FH: Conceptualization, Data curation, Formal Analysis, Methodology, Resources, Writing – review & editing. LJ: Conceptualization, Data curation, Funding acquisition, Investigation, Project administration, Resources, Supervision, Visualization, Writing – review & editing.
Funding
The author(s) declare that financial support was received for the research and/or publication of this article. This study was supported by the Basic, Clinical, and Translational Research Project on Lung Cancer (Grant No. 23JCYJPT0035) from the Nanchong Municipal Bureau of Science and Technology, as well as the National Science and Technology Major Projects of China: “Cutting-Edge Technology Development for Prevention and Treatment of Respiratory Chronic Diseases and Establishment of Collaborative Diagnosis and Treatment Systems” (Project No. 2023ZD0506106).
Acknowledgments
Thanks to https://www.xsmartanalysis.com/model/index/ for technical support.
Conflict of interest
The authors declare that the research was conducted in the absence of any commercial or financial relationships that could be construed as a potential conflict of interest.
Generative AI statement
The author(s) declare that no Generative AI was used in the creation of this manuscript.
Publisher’s note
All claims expressed in this article are solely those of the authors and do not necessarily represent those of their affiliated organizations, or those of the publisher, the editors and the reviewers. Any product that may be evaluated in this article, or claim that may be made by its manufacturer, is not guaranteed or endorsed by the publisher.
References
1. Hendrix W, Rutten M, Hendrix N, van Ginneken B, Schaefer-Prokop C, Scholten ET, et al. Trends in the incidence of pulmonary nodules in chest computed tomography: 10-year results from two Dutch hospitals. Eur Radiol. (2023) 33:8279–88. doi: 10.1007/s00330-023-09826-3
2. Bray F, Laversanne M, Sung H, Ferlay J, Siegel RL, Soerjomataram I, et al. Global cancer statistics 2022: GLOBOCAN estimates of incidence and mortality worldwide for 36 cancers in 185 countries. CA Cancer J Clin. (2024) 74:229–63. doi: 10.3322/caac.21834
3. Chen S, Cao Z, Prettner K, Kuhn M, Yang J, Jiao L, et al. Estimates and projections of the global economic cost of 29 cancers in 204 countries and territories from 2020 to 2050. JAMA Oncol. (2023) 9:465–72. doi: 10.1001/jamaoncol.2022.7826
4. Rami-Porta R, Nishimura KK, Giroux DJ, Detterbeck F, Cardillo G, Edwards JG, et al. The international association for the study of lung cancer lung cancer staging project: proposals for revision of the TNM stage groups in the forthcoming (Ninth) edition of the TNM classification for lung cancer. J Thorac Oncol. (2024) 19:1007–27. doi: 10.1016/j.jtho.2024.02.011
5. He X, Xue N, Liu X, Tang X, Peng S, Qu Y, et al. A novel clinical model for predicting Malignancy of solitary pulmonary nodules: a multicenter study in chinese population. Cancer Cell Int. (2021) 21:115. doi: 10.1186/s12935-021-01810-5
6. Greener JG, Kandathil SM, Moffat L, and Jones DT. A guide to machine learning for biologists. Nat Rev Mol Cell Biol. (2022) 23:40–55. doi: 10.1038/s41580-021-00407-0
7. Handelman GS, Kok HK, Chandra RV, Razavi AH, Lee MJ, and Asadi H. eDoctor: Machine learning and the future of medicine. J Intern Med. (2018) 284:603–19. doi: 10.1111/joim.12822
8. Obuchowski NA and Bullen JA. Receiver operating characteristic (ROC) curves: review of methods with applications in diagnostic medicine. Phys Med Biol. (2018) 63(7):07TR01. doi: 10.1088/1361-6560/aab4b1
9. Vickers AJ and Elkin EB. Decision curve analysis: a novel method for evaluating prediction models. Med Decis Making. (2006) 26:565–74. doi: 10.1177/0272989X06295361
10. Fenlon C, O’Grady L, Doherty ML, and Dunnion J. A discussion of calibration techniques for evaluating binary and categorical predictive models. Prev Vet Med. (2018) 149:107–14. doi: 10.1016/j.prevetmed.2017.11.018
11. Li W and Guo Q. Plotting receiver operating characteristic and precision-recall curves from presence and background data. Ecol Evol. (2021) 11:10192–206. doi: 10.1002/ece3.7826
12. Belkin M, Hsu D, Ma S, and Mandal S. Reconciling modern machine-learning practice and the classical bias-variance trade-off. Proc Natl Acad Sci U S A. (2019) 116:15849–54. doi: 10.1073/pnas.1903070116
13. Bifarin OO. Interpretab le machine learning with tree-based shapley additive explanations: Application to metabolomics datasets for binary classification. PloS One. (2023) 18:e0284315. doi: 10.1371/journal.pone.0284315
14. Larici AR, Farchione A, Franchi P, Ciliberto M, Cicchetti G, Calandriello L, et al. Lung nodules: size still matters. Eur Respir Rev. (2017) 26:170025. doi: 10.1183/16000617.0025-2017
15. Horeweg N, van Rosmalen J, Heuvelmans MA, van der Aalst CM, Vliegenthart R, Scholten ET, et al. Lung cancer probability in patients with CT-detected pulmonary nodules: a prespecified analysis of data from the NELSON trial of low-dose CT screening. Lancet Oncol. (2014) 15:1332–41. doi: 10.1016/S1470-2045(14)70389-4
16. Callister ME, Baldwin DR, Akram AR, Barnard S, Cane P, Draffan J, et al. British Thoracic Society guidelines for the investigation and management of pulmonary nodules. Thorax. (2015) 70 Suppl 2:ii1–ii54. doi: 10.1136/thoraxjnl-2015-207168
17. Zhou Y, Gong G, Wang H, Habibabady ZA, Lang P, Hales R, et al. Transthoracic fine-needle aspiration diagnosis of solid, subsolid, and partially calcified lung nodules: A retrospective study from a single academic center. Cytojournal. (2019) 16:16. doi: 10.4103/cytojournal.cytojournal_43_18
18. Gorospe L, Ajuria-Illarramendi O, Cdela P-B, GM M-M, Cabanero-Sanchez A, Moreno-Mata N, et al. PET/CT findings of granulomatosis with polyangiitis presenting as a solitary pulmonary nodule and mimicking lung cancer. J Clin Rheumatol. (2020) 26:e122–3. doi: 10.1097/RHU.0000000000000994
19. Zhou C, Liu XB, Gan XJ, and Li X. Calcification sign for prediction of benignity in pulmonary nodules: a meta-analysis. Clin Respiratory J. (2021) 15:1073–80. doi: 10.1111/crj.13410
20. Liao W, Coupland CAC, Burchardt J, Baldwin DR, DART initiative, Gleeson FV, et al. Predicting the future risk of lung cancer: development, and internal and external validation of the CanPredict (lung) model in 19·67 million people and evaluation of model performance against seven other risk prediction models. Lancet Respir Med. (2023) 11:685–97. doi: 10.1016/S2213-2600(23)00050-4
21. Han DH, Duan F, Wu Y, Goo JM, Kim HY, and Patz EF Jr. Clinical significance of lung-RADS category 3 lesions in the national lung screening trial. J Thorac Oncol. (2021) 16:1118–26. doi: 10.1016/j.jtho.2021.02.025
22. Chang GC, Chiu CH, Yu CJ, Chang YC, Chang YH, Hsu KH, et al. Low-dose CT screening among never-smokers with or without a family history of lung cancer in Taiwan: a prospective cohort study. Lancet Respir Med. (2024) 12:141–52. doi: 10.1016/S2213-2600(23)00338-7
23. Yu T, Zhao X, Leader JK, Wang J, Meng X, Herman J, et al. Vascular biomarkers for pulmonary nodule Malignancy: arteries vs. Veins. Cancers (Basel). (2024) 16:3274. doi: 10.3390/cancers16193274
24. Li W, Zheng X, and Huang J. Value of CT diagnostic techniques based on imaging post-processing systems in the early diagnosis and treatment of lung cancer. Am J Transl Res. (2024) 16:7396–404. doi: 10.62347/VJSR2965
25. Liu Y, Chen M, Guo C, Zhong W, Ye Q, Zhao J, et al. Clinical-radiological-pathological characteristics of 297 cases of surgical pathology confirmed benign pulmonary lesions in which Malignancy could not be excluded in preoperative assessment: A retrospective cohort analysis in a single chinese hospital. Zhongguo Fei Ai Za Zhi. (2020) 23:792–9. doi: 10.3779/j.issn.1009-3419.2020.104.24
26. Tang G, Du L, Ling S, Che Y, and Chen X. Multi-type classification of lung nodules based on CT radiomics and ensemble learning for diversity weighting. Quant Imaging Med Surg. (2024) 14:8942–65. doi: 10.21037/qims-24-1315
27. Zhou C, Liu XB, Gan XJ, and Li X. Calcification sign for prediction of benignity in pulmonary nodules: A meta-analysis. Clin Respir J. (2021) 15:1073–80. doi: 10.1111/crj.13410
28. Hou H, Yu S, Xu Z, Zhang H, Liu J, and Zhang W. Prediction of Malignancy for solitary pulmonary nodules based on imaging, clinical characteristics and tumor marker levels. Eur J Cancer Prev. (2021) 30:382–8. doi: 10.1097/CEJ.0000000000000637
29. Zhou L, Zhou Z, Liu F, Sun H, Zhou B, Dai L, et al. Establishment and validation of a clinical model for diagnosing solitary pulmonary nodules. J Surg Oncol. (2022) 126:1316–29. doi: 10.1002/jso.27041
30. Cruickshank A, Stieler G, and Ameer F. Evaluation of the solitary pulmonary nodule. Intern Med J. (2019) 49:306–15. doi: 10.1111/imj.14219
31. Henschke CI, Yankelevitz DF, Mirtcheva R, McGuinness G, McCauley D, Miettinen OS, et al. CT screening for lung cancer: frequency and significance of part-solid and nonsolid nodules. AJR Am J Roentgenol. (2002) 178:1053–7. doi: 10.2214/ajr.178.5.1781053
32. Zhao HC, Xu QS, Shi YB, and Ma XJ. Clinical-radiological predictive model in differential diagnosis of small (≤ 20 mm) solitary pulmonary nodules. BMC Pulm Med. (2021) 21:281. doi: 10.1186/s12890-021-01651-y
Keywords: pulmonary nodules, malignancy, machine learning, prediction model, external test
Citation: Huang Y, Chen Y, He F and Jiang L (2025) Predictive model of malignancy probability in pulmonary nodules based on multicenter data. Front. Oncol. 15:1588147. doi: 10.3389/fonc.2025.1588147
Received: 05 March 2025; Accepted: 12 May 2025;
Published: 28 May 2025.
Edited by:
Yeon Wook Kim, Seoul National University, Republic of KoreaReviewed by:
Andrea Cimini, Ospedale Regionale San Salvatore dell’Aquila, ItalyJianqing Wang, Zhejiang Chinese Medical University, China
Copyright © 2025 Huang, Chen, He and Jiang. This is an open-access article distributed under the terms of the Creative Commons Attribution License (CC BY). The use, distribution or reproduction in other forums is permitted, provided the original author(s) and the copyright owner(s) are credited and that the original publication in this journal is cited, in accordance with accepted academic practice. No use, distribution or reproduction is permitted which does not comply with these terms.
*Correspondence: Li Jiang, bGFucWlsaWx5QDE2My5jb20=
†These authors have contributed equally to this work