 Xiaobo Wen1,2,3†
 Yutao Zhao2†Wen Dong2†Congbo Yang2Jinzhi Li2
 Li Sun3Yutao Xiu3
 Chang’e Gao4*Ming Zhang2*
- 1School of Pharmacy, Qingdao University, Qingdao, China
- 2Department of Radiotherapy, Yunnan Cancer Hospital, the Third Affiliated Hospital of Kunming Medical University, Kunming, Yunnan, China
- 3Cancer Institute of The Affiliated Hospital of Qingdao University and Qingdao Cancer Institute, Qingdao, China
- 4Department of Medical Oncology, The First Affiliated Hospital of Kunming Medical University, Kunming, China
Objective: This study aimed to identify CT‐based radiomic alterations associated with radiation pneumonitis (RP) and to evaluate the feasibility of machine learning classifiers for personalized RP diagnosis in breast cancer patients using these radiomic signatures.
Methods: A total of 146 planning CT scans (pre- and post-radiotherapy) from 73 breast cancer patients with confirmed RP were retrospectively analyzed. The entire lung was delineated as the region of interest (ROI), and 1,834 radiomic features were extracted using PyRadiomics. Feature selection was performed sequentially using the Mann–Whitney U-test (p < 0.05), Spearman’s rank correlation (|ρ| < 0.9), and least absolute shrinkage and selection operator (LASSO). Eight classifiers [logistic regression (LR), support vector machine (SVM), K-nearest neighbor (KNN), random forest (RF), Extra Tree (ET), XGBoost, LightGBM, and multilayer perceptron (MLP)] were trained and evaluated using accuracy, area under the receiver operating characteristic curve (AUC) with 95% confidence intervals, sensitivity, and specificity.
Results: In the independent test cohort, LR achieved the highest performance [accuracy 0.897, AUC 0.929 (95% CI, 0.838–1.000), sensitivity 0.786, and specificity 1.000]. LightGBM and MLP also exhibited robust discrimination with AUC values of 0.855 (95% CI, 0.719–0.990) and 0.848 (95% CI, 0.705–0.991), respectively. Five texture-oriented and four first-order features were retained, underscoring the importance of texture-focused extractors [wavelet and local binary pattern (LBP)].
Conclusion: CT-derived radiomic signatures combined with machine learning classifiers enable the accurate detection of RP in breast cancer patients. Texture-oriented feature selection enhances model discrimination, providing potential for the personalized diagnosis of RP in breast cancer patients and adaptive treatment planning.
1 Introduction
The 2020 Global Cancer Statistics found 2.26 million new cases of breast cancer, making it the most common cancer globally, surpassing lung cancer (1). Radiotherapy has become a critical component in treating breast cancer using high-energy rays to prevent the growth or kill cancer cells, leading to reduced recurrence rate and improved quality of life for patients (2–9). However, patients may experience different side effects during the radiation treatment due to the tumor’s location and anatomical structures. Radiation pneumonitis (RP), a prevalent side effect after radiation therapy for breast cancer, impacts subsequent radiation dosages and treatment strategies and significantly influences patients’ quality of life and post-treatment recovery. Therefore, the accurate diagnosis and prediction of RP occurrence can help clinical oncologists adjust treatment plans rapidly, thereby improving patients’ prognosis and quality of life.
Radiomics is a cutting-edge technology that converts region of interest (ROI) image data into high-resolution feature space data that can be easily processed through advanced data characterization algorithms (10). Through radiomics, valuable information can be extracted from image data in an efficient and automated manner, allowing for accurate diagnoses and prognoses. Therefore, radiomics is promising to provide an approach to address the diagnosis and prognosis of RP.
Currently, some studies have attempted to use radiomics to predict the occurrence and grading of RP (11–14). However, a majority of them have focused on the occurrence of RP after radiotherapy for lung cancer treatment, while fewer studies have been conducted on that after radiotherapy for breast cancer. RP after radiotherapy for lung cancer mainly appears in the lobes of the lung where the primary lesion is present. However, radiation-induced RP for breast cancer is mainly in the first to second intercostal space. This difference in location can impact the extracted radiomic features to some extent, affecting the results obtained from radiomics analysis. Therefore, the present study aimed to investigate radiomic feature changes on CT images before and after radiotherapy in breast cancer patients with RP and to assess the potential of these features for diagnosing RP, thereby facilitating improved prognosis and personalized treatment strategies for breast cancer patients.
2 Materials and methods
2.1 Patient population
This study collected a total of 146 samples, consisting of 73 breast cancer patients’ CT images before and after radiation therapy at a ratio of 1:1. The patients presented at Yunnan Cancer Hospital between September 2019 and March 2023 and were complicated with radiation pneumonitis after radiation therapy. The CT images before radiation therapy were used as negative samples, while the CT images after radiation therapy were used as positive samples. Their ages ranged from 30 to 72 years, with the median age being 48 years, and the majority of patients underwent modified radical mastectomy, while a minority received breast-conserving surgery, with all of the patients having no smoking history. Their TNM clinical stages ranged from I to III, with Stage II and Stage III accounting for the majority. The molecular subtypes were predominantly Luminal A and Luminal B, and all patients received intensity-modulated radiation therapy (IMRT). Patients meeting the following criteria were included in the study: 1) patients who had pathologically confirmed breast cancer, 2) patients whose diagnosis of radiation pneumonitis followed the GBZ110–2002 guidelines, 3) patients with complete pre- and post-radiotherapy imaging and clinical data, and 4) patients without severe cardiac or pulmonary disease and other contraindications to radiotherapy. The dataset was randomly divided into a training set (n = 117) and a test set (n = 29) at a ratio of 8:2.
2.2 CT images and ROI acquisition
In this study, a Siemens (Somatom Force) third-generation dual-source CT system was utilized for image scanning of patients with breast cancer with a layer thickness of 1–2 mm, a tube voltage of 120 kV, a tube current of 30 mAs, an image size of 512 × 512 pixels, and image reconstruction algorithm(s) using Filtered Back Projection. The scanning range included complete and clear lung organs. The ROI was delineated by two clinical oncologists using the 3D slicer 4.11 software (15) with the whole lung delineated layer by layer, and the required ROI was reviewed and corrected by a senior radiologist (as shown in Figure 1).
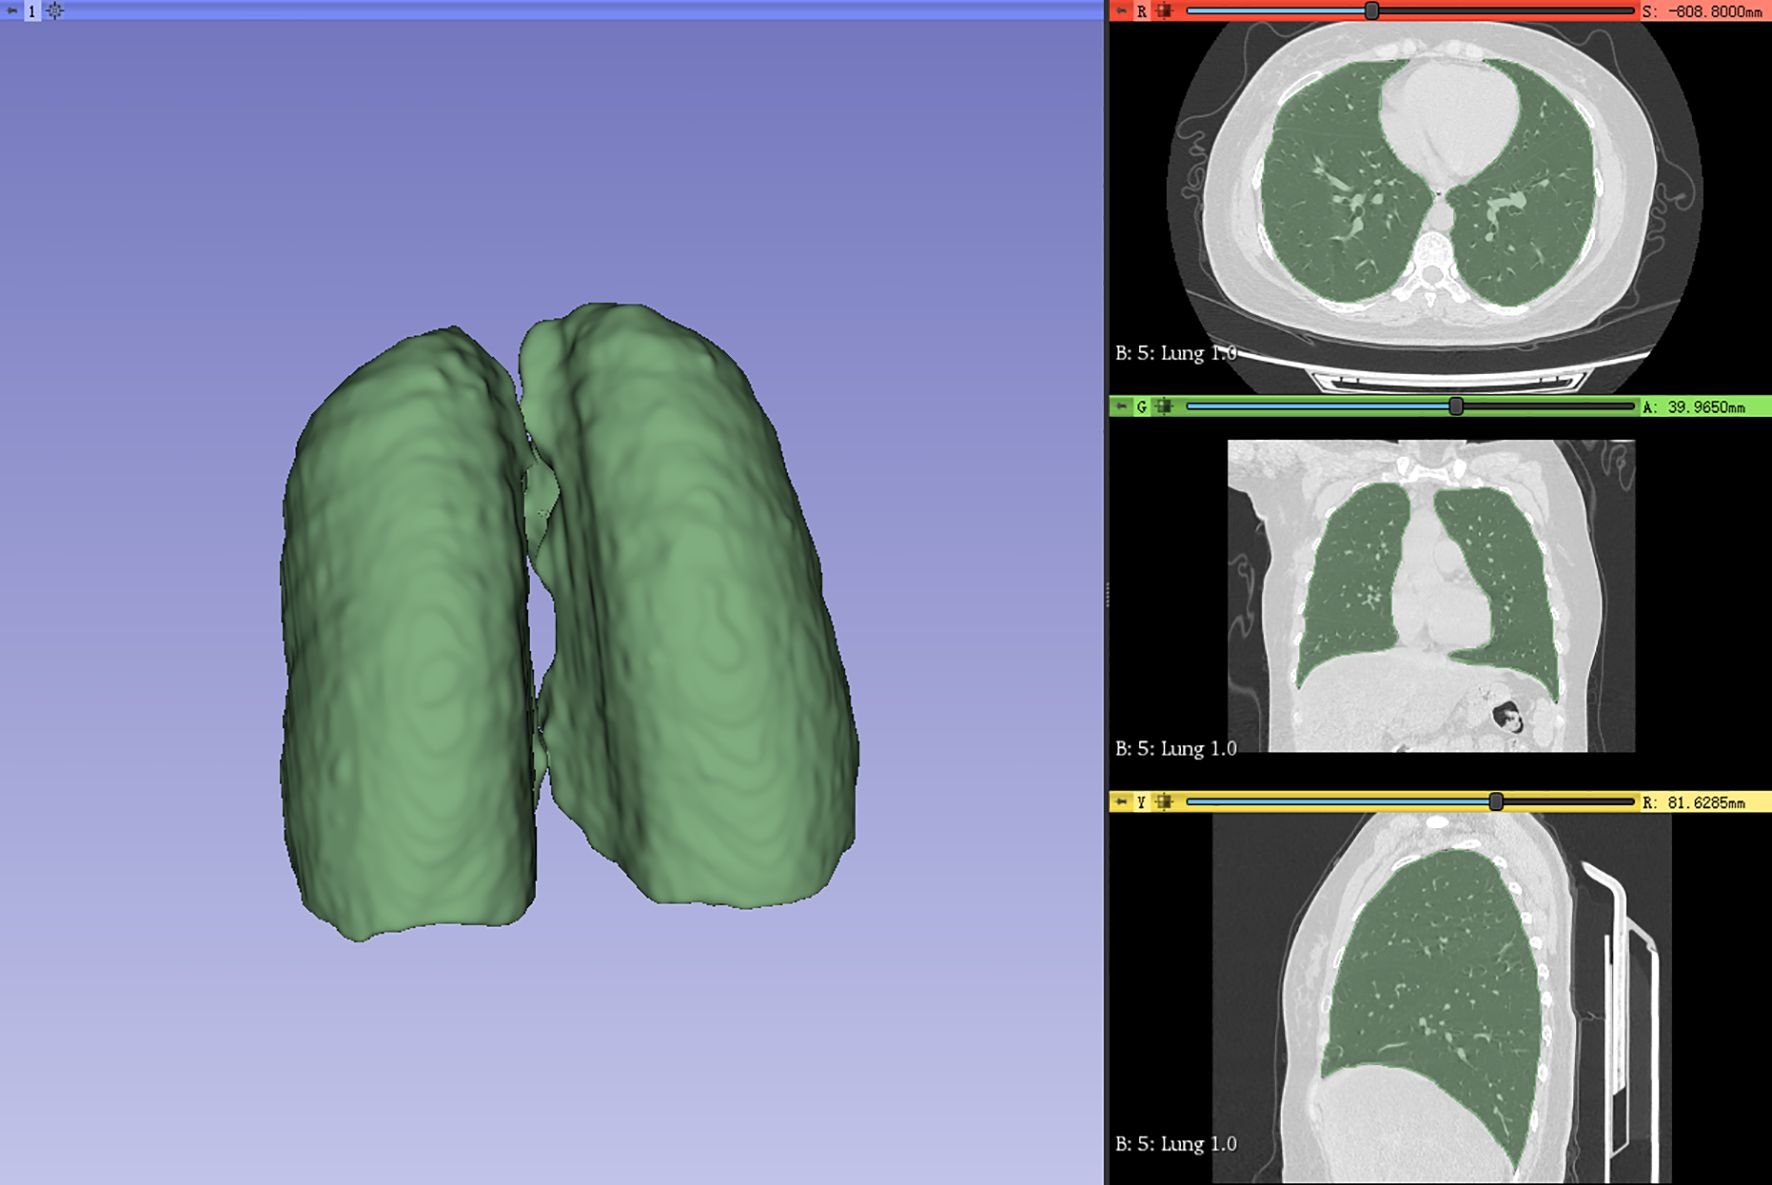
Figure 1. Whole lung (ROI) outlined by physicians. ROI, region of interest.
2.3 Radiomic feature extraction
To eliminate the influence of image voxel size variation as much as possible, the images were resampled to 3 * 3 * 3 mm before extracting features in this study. The Radiomics package (http://pyradiomics.readthedocs.io) extracted radiomic features from the ROI (16). Nine image types were used for feature extraction: original, Laplacian of Gaussian (LoG), wavelet, LBP3D, exponential, square, square root, logarithm, and gradient. The sigma values of LoG were 1, 2, and 3. Wavelet included eight filters: wavelet-LLH, wavelet-LHL, wavelet-LHH, wavelet-HLL, wavelet-HLH, wavelet-HHL, wavelet-HHH, and wavelet-LLL. A total of 1,834 radiomic features were obtained, including 14 shape features (shape), 360 first-order features, 440 gray-level co-occurrence matrix (GLCM) features, 280 gray-level dependence matrix (GLDM) features, 320 gray-level run length matrix (GLRLM) features, 320 gray-level size zone matrix (GLSZM) features, and 100 neighboring gray tone difference matrix (NGTDM) features, as shown in Figure 2. The details of the features can be found in Supplementary File S1.
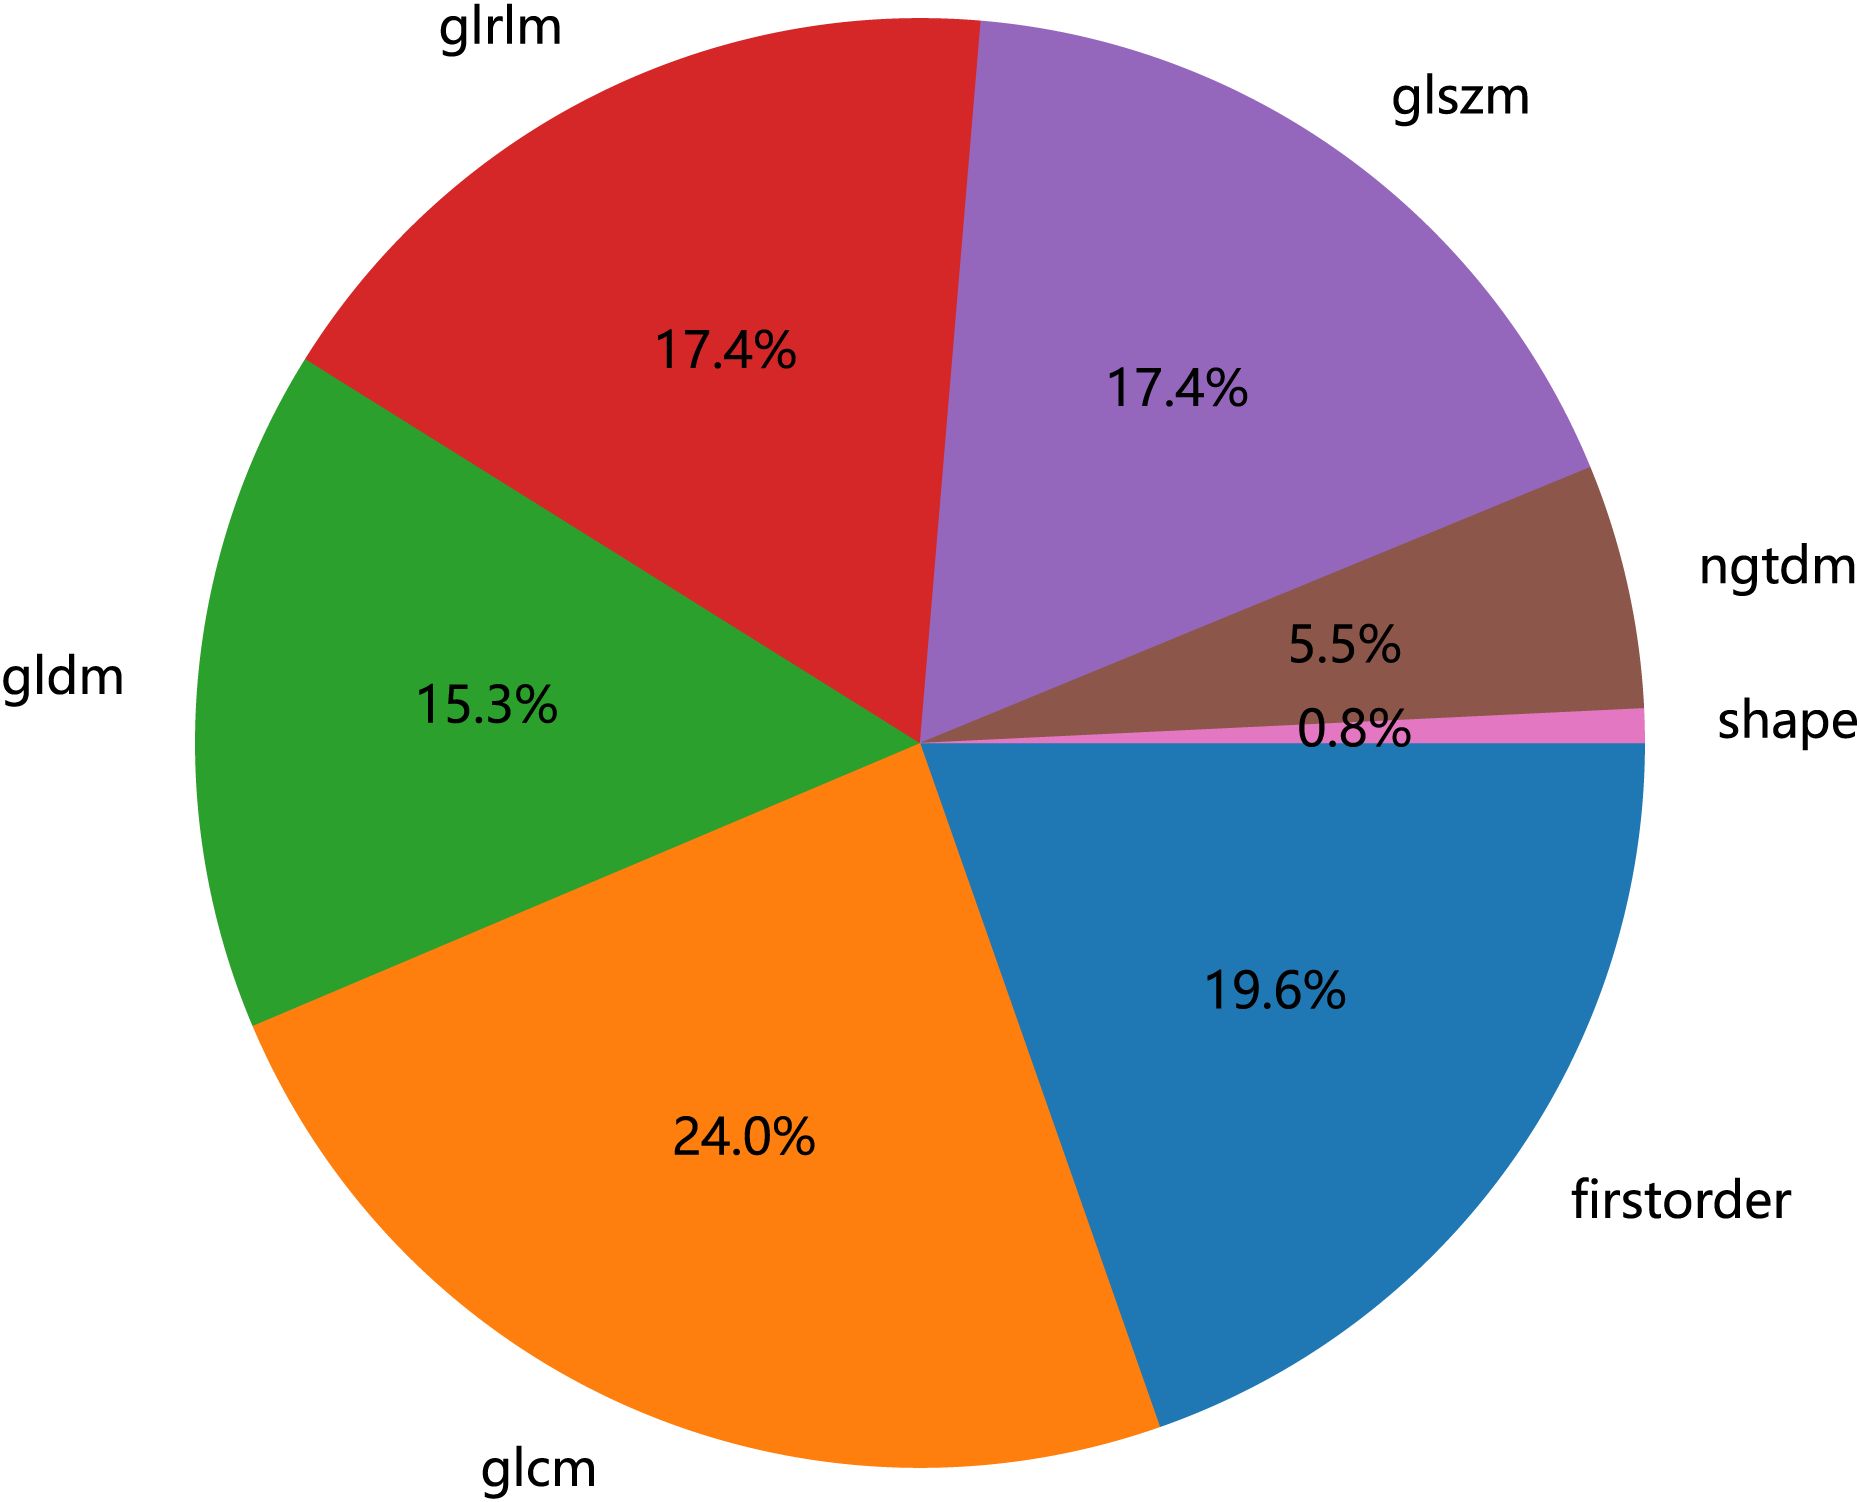
Figure 2. Number and ratio of handcrafted features, among which first-order stands for first-order features, shape for shape features, glcm for gray-level co-occurrence matrix features, glszm for gray-level size zone matrix features, glrlm for gray-level run length matrix features, ngtdm for neighboring gray tone difference matrix features, and gldm for gray-level dependence matrix features.
2.4 Feature selection
We used Z-score to standardize the extracted features and performed data screening in three ways: statistical analysis, correlation analysis, and least absolute shrinkage and selection operator (LASSO) on the standardized data. First, we used the Mann–Whitney U-test statistical test for radiomic feature selection and retained 328 radiomic features with the p-value < 0.05. Second, we performed Spearman’s rank correlation analysis on the 328 radiomic features to eliminate redundant features with high repeatability, as shown in Supplementary Material Figure 1, and retained one of the two features with a correlation coefficient greater than 0.9, yielding a total of 82 features. Finally, we constructed the 82 obtained features using the LASSO model, which compressed the coefficients of the features by adjusting the weights λ and changed the coefficients of some of the features to zero to achieve feature selection. Our study performed a 10-fold cross-validation to find the optimal values, as shown in Figures 3 and 4, and we retained the features with non-zero coefficients for fitting the regression model and combined them into a radiomic signature. The optimal value of λ in this study was 0.0391.
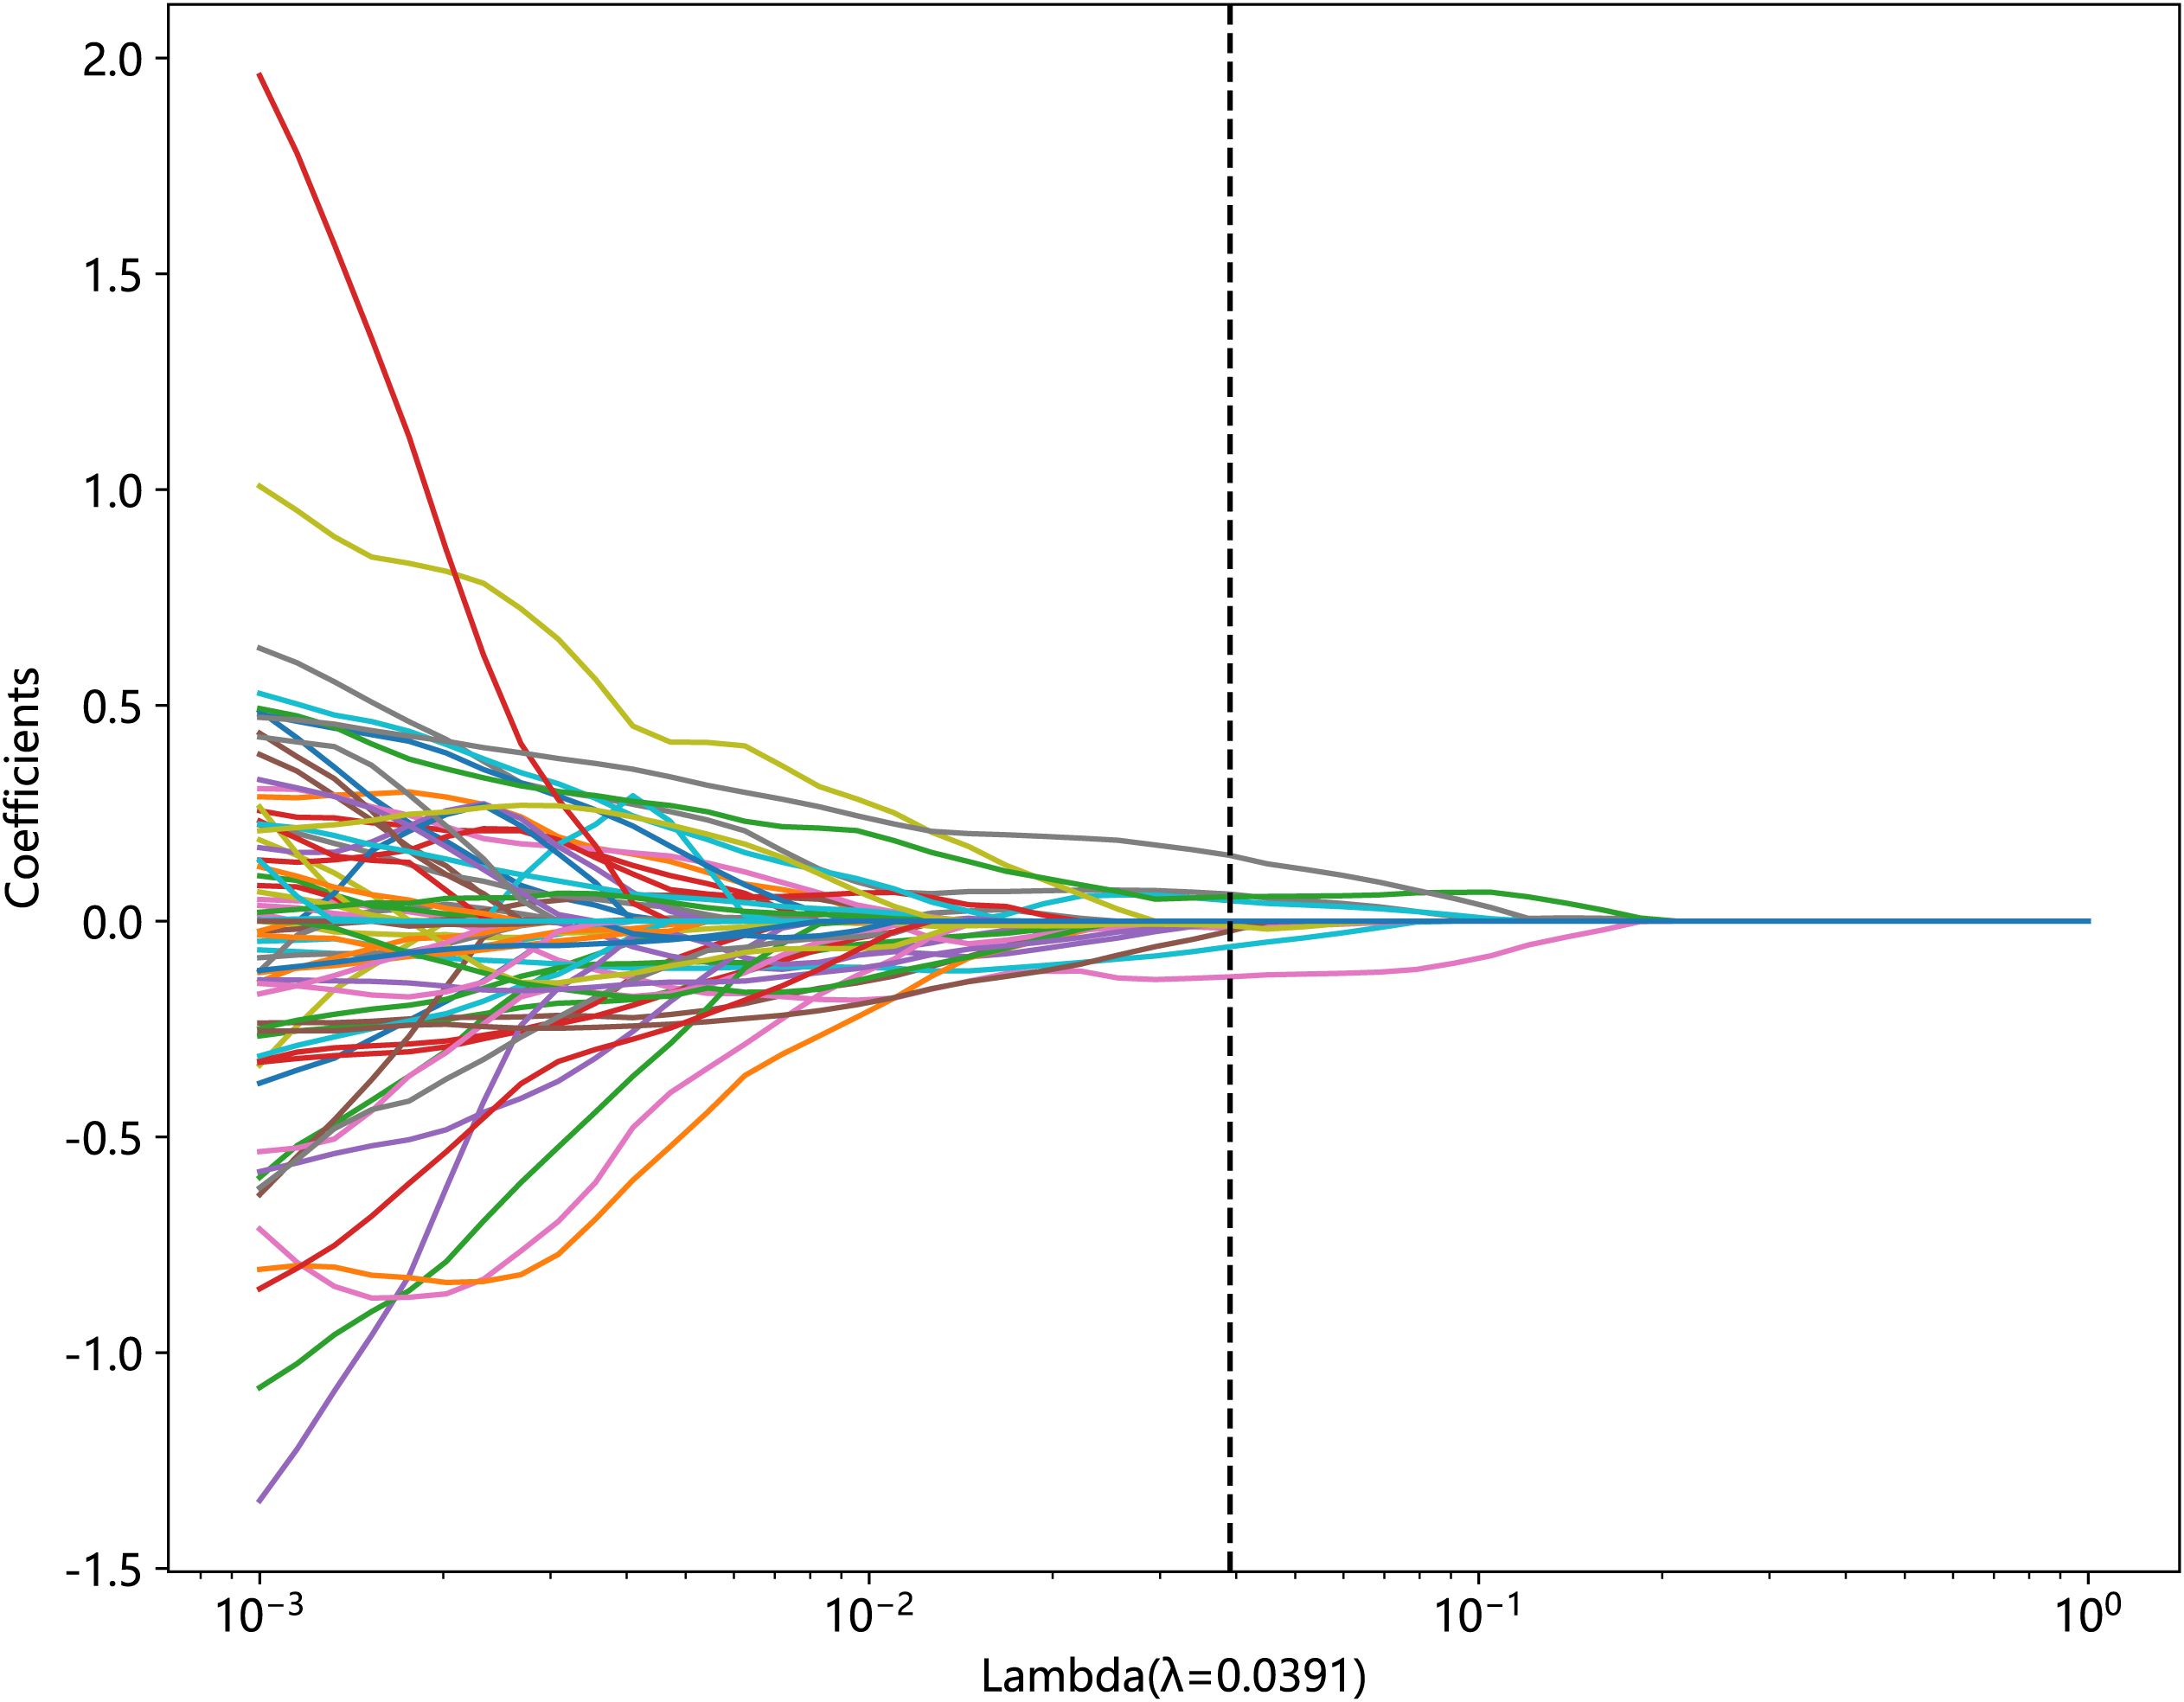
Figure 3. Relationship between lambda and regression coefficients (the optimal value of lambda is 0.0391).
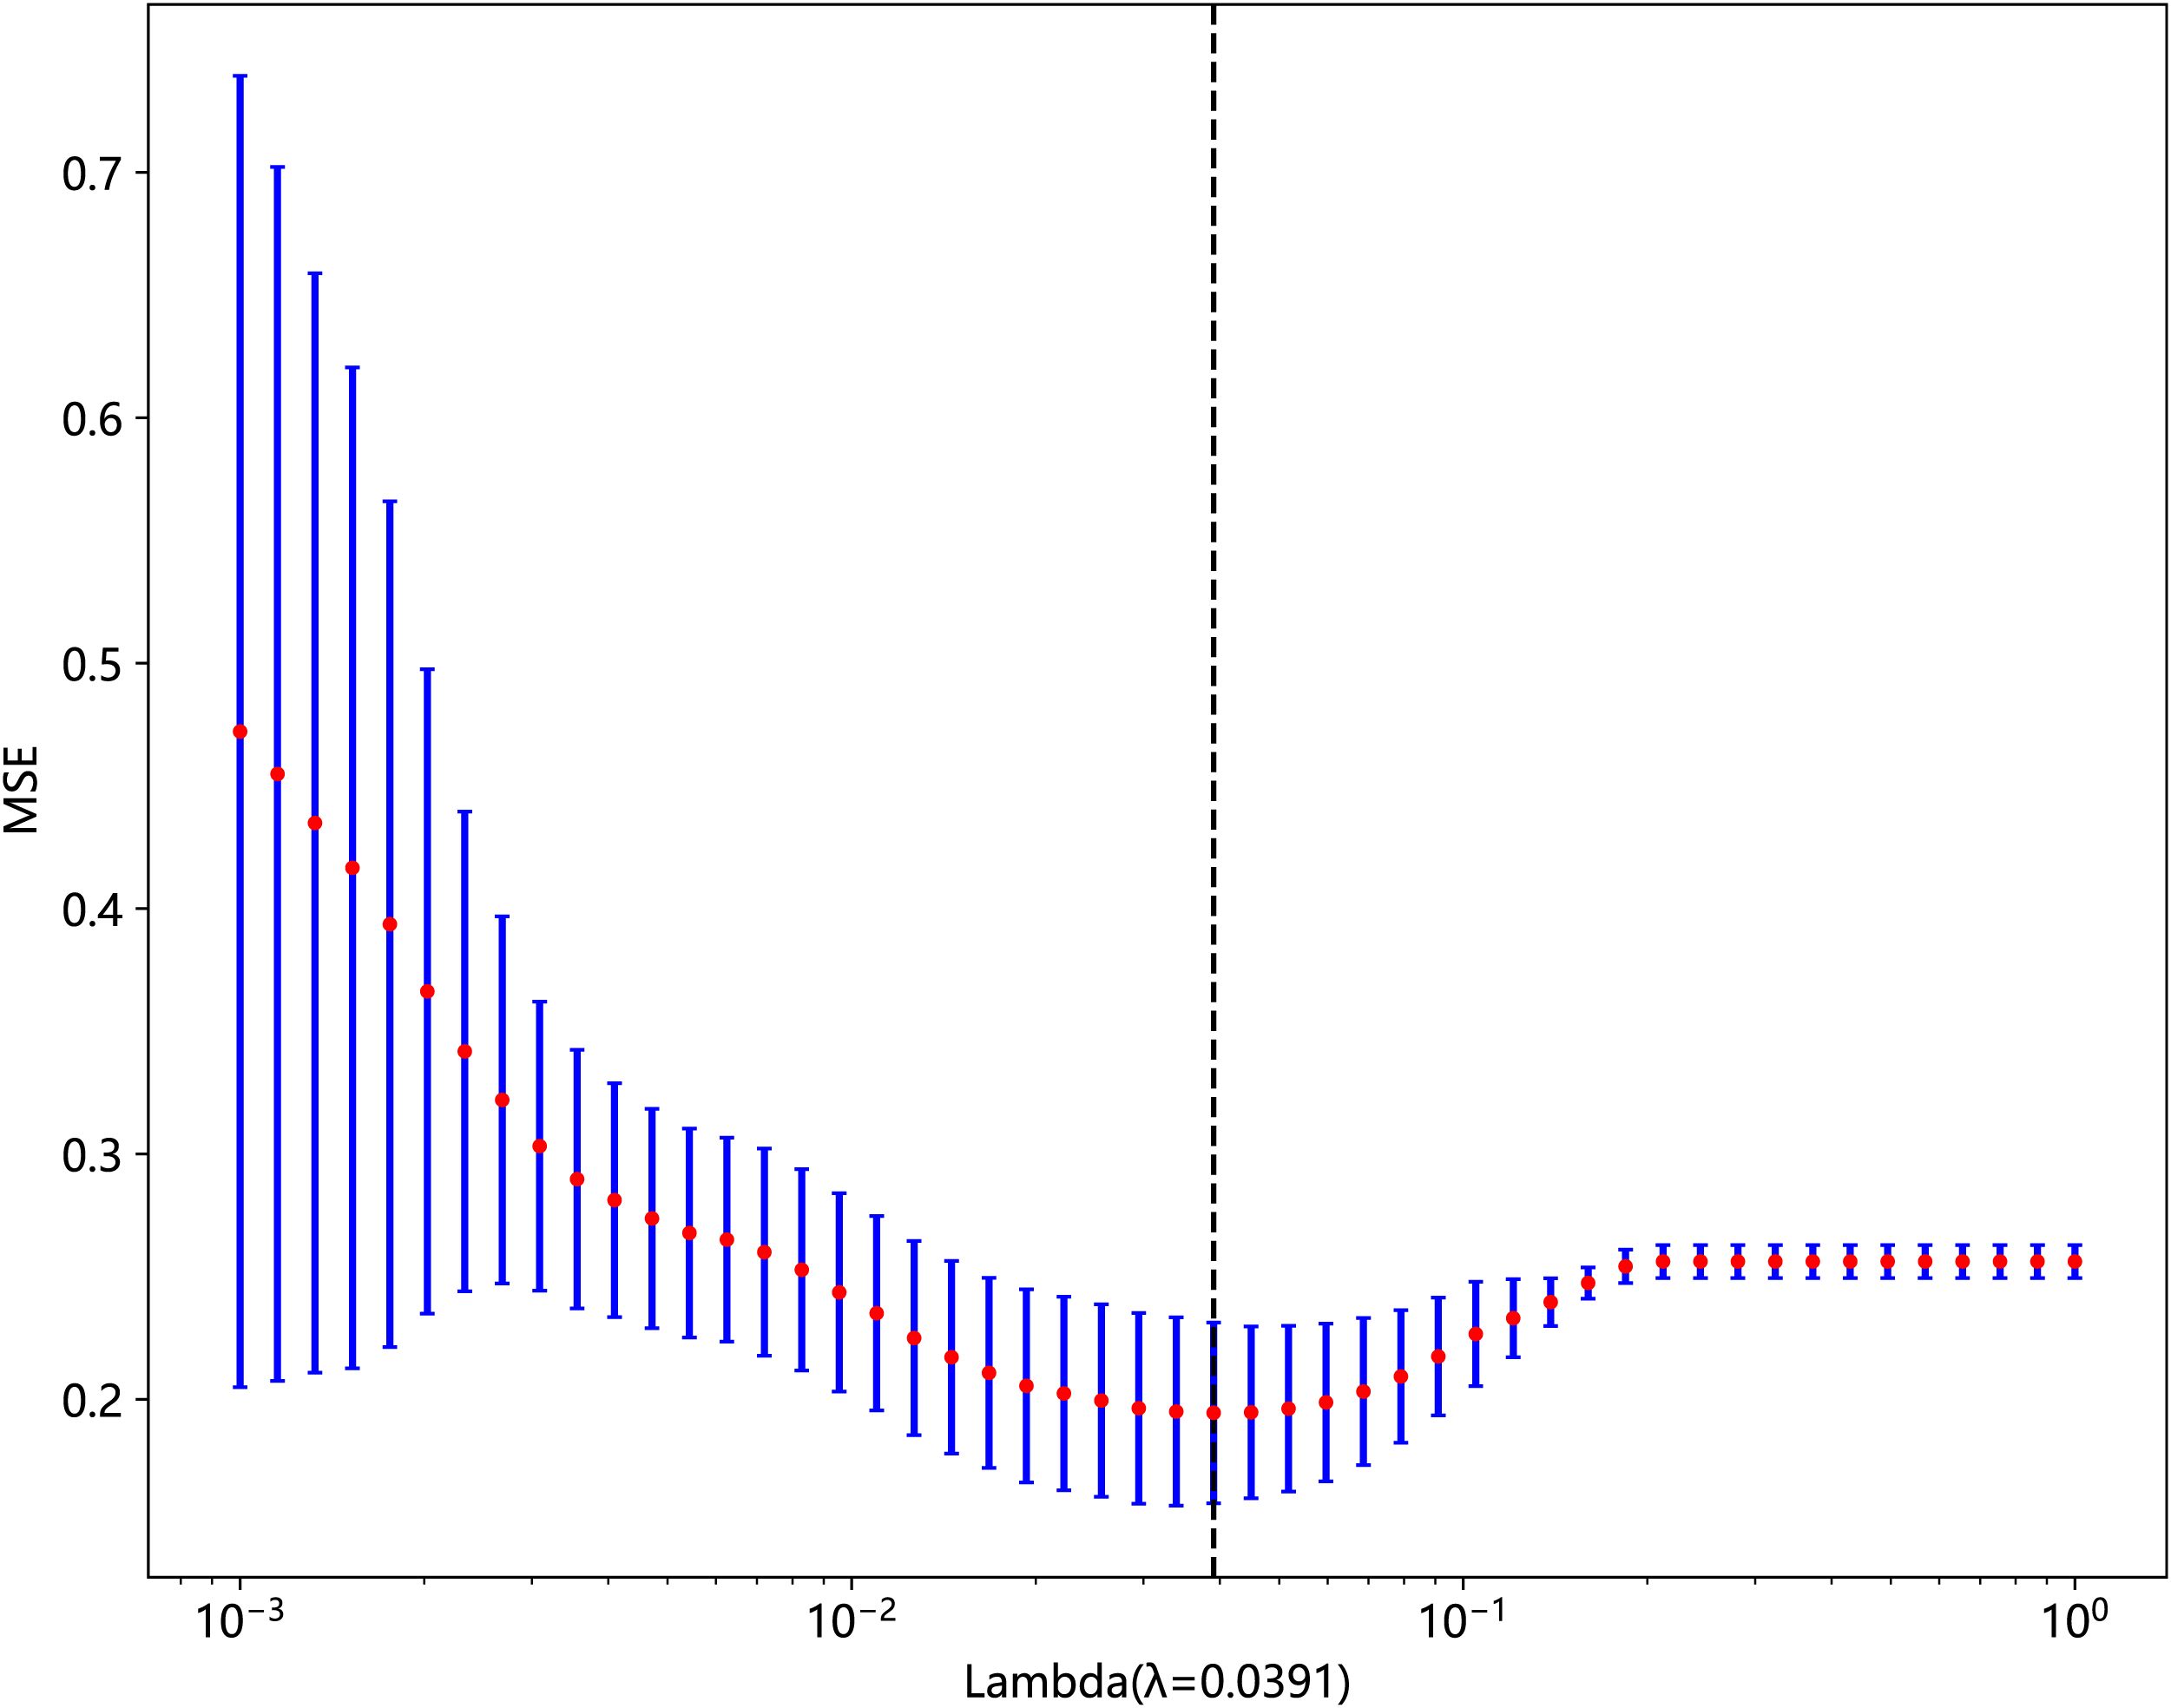
Figure 4. The MSE of LASSO regression.
2.5 Model construction and evaluation metrics
Our study utilized the sklearn package in Python 3 to build machine learning models. Specifically, we applied eight different algorithms: logistic regression (LR), support vector machine (SVM), K-nearest neighbors (KNN), random forest (RF), Extra Tree (ET), XGBoost, LightGBM, and multilayer perceptron (MLP). All of them were employed to discriminate RP, using four different metrics—accuracy, the area under the receiver operating characteristic curve (AUC), sensitivity, and specificity—and ROC curves to further assess their effectiveness.
3 Results
3.1 Radiomic feature filtering
In this study, the 1,834 features extracted from the ROI were filtered through several steps, with nine retained radiomic features for the training and testing of the machine learning models, including four first-order features, two GLSZM features, and three GLCM features, as shown in Table 1. In order to show the weight of each feature more visually, the weight histogram and Rad score of the nine features were plotted, as shown in Figures 5 and 6.
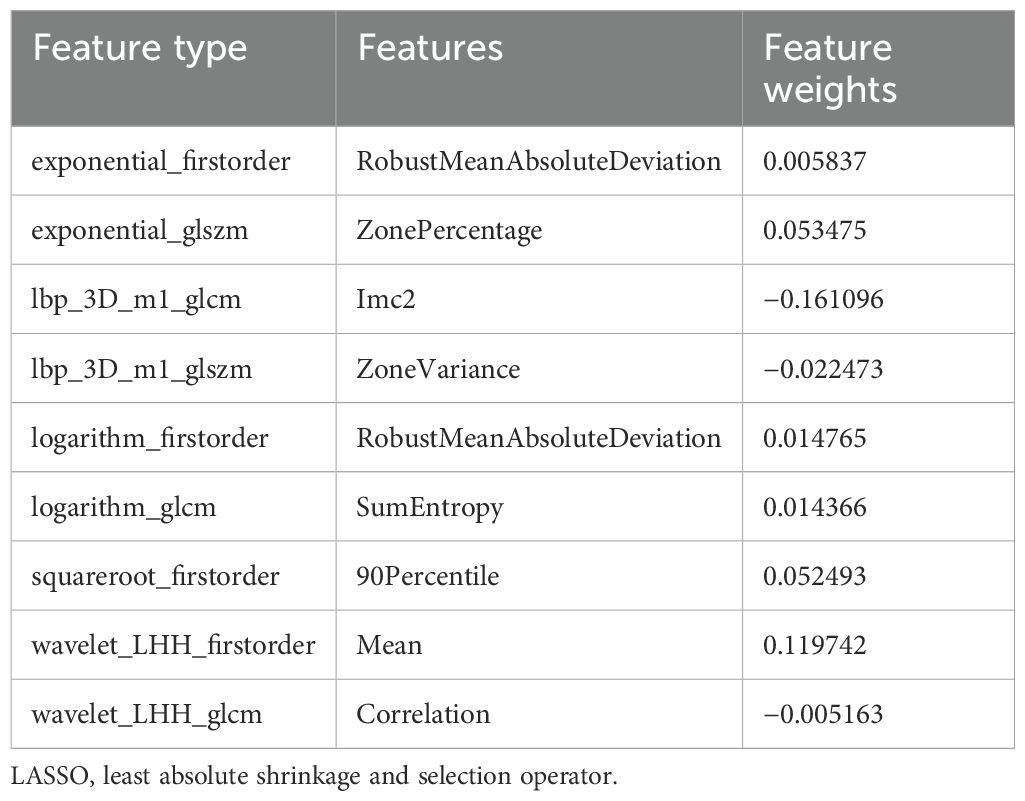
Table 1. Radiomic features obtained after LASSO dimensionality reduction.
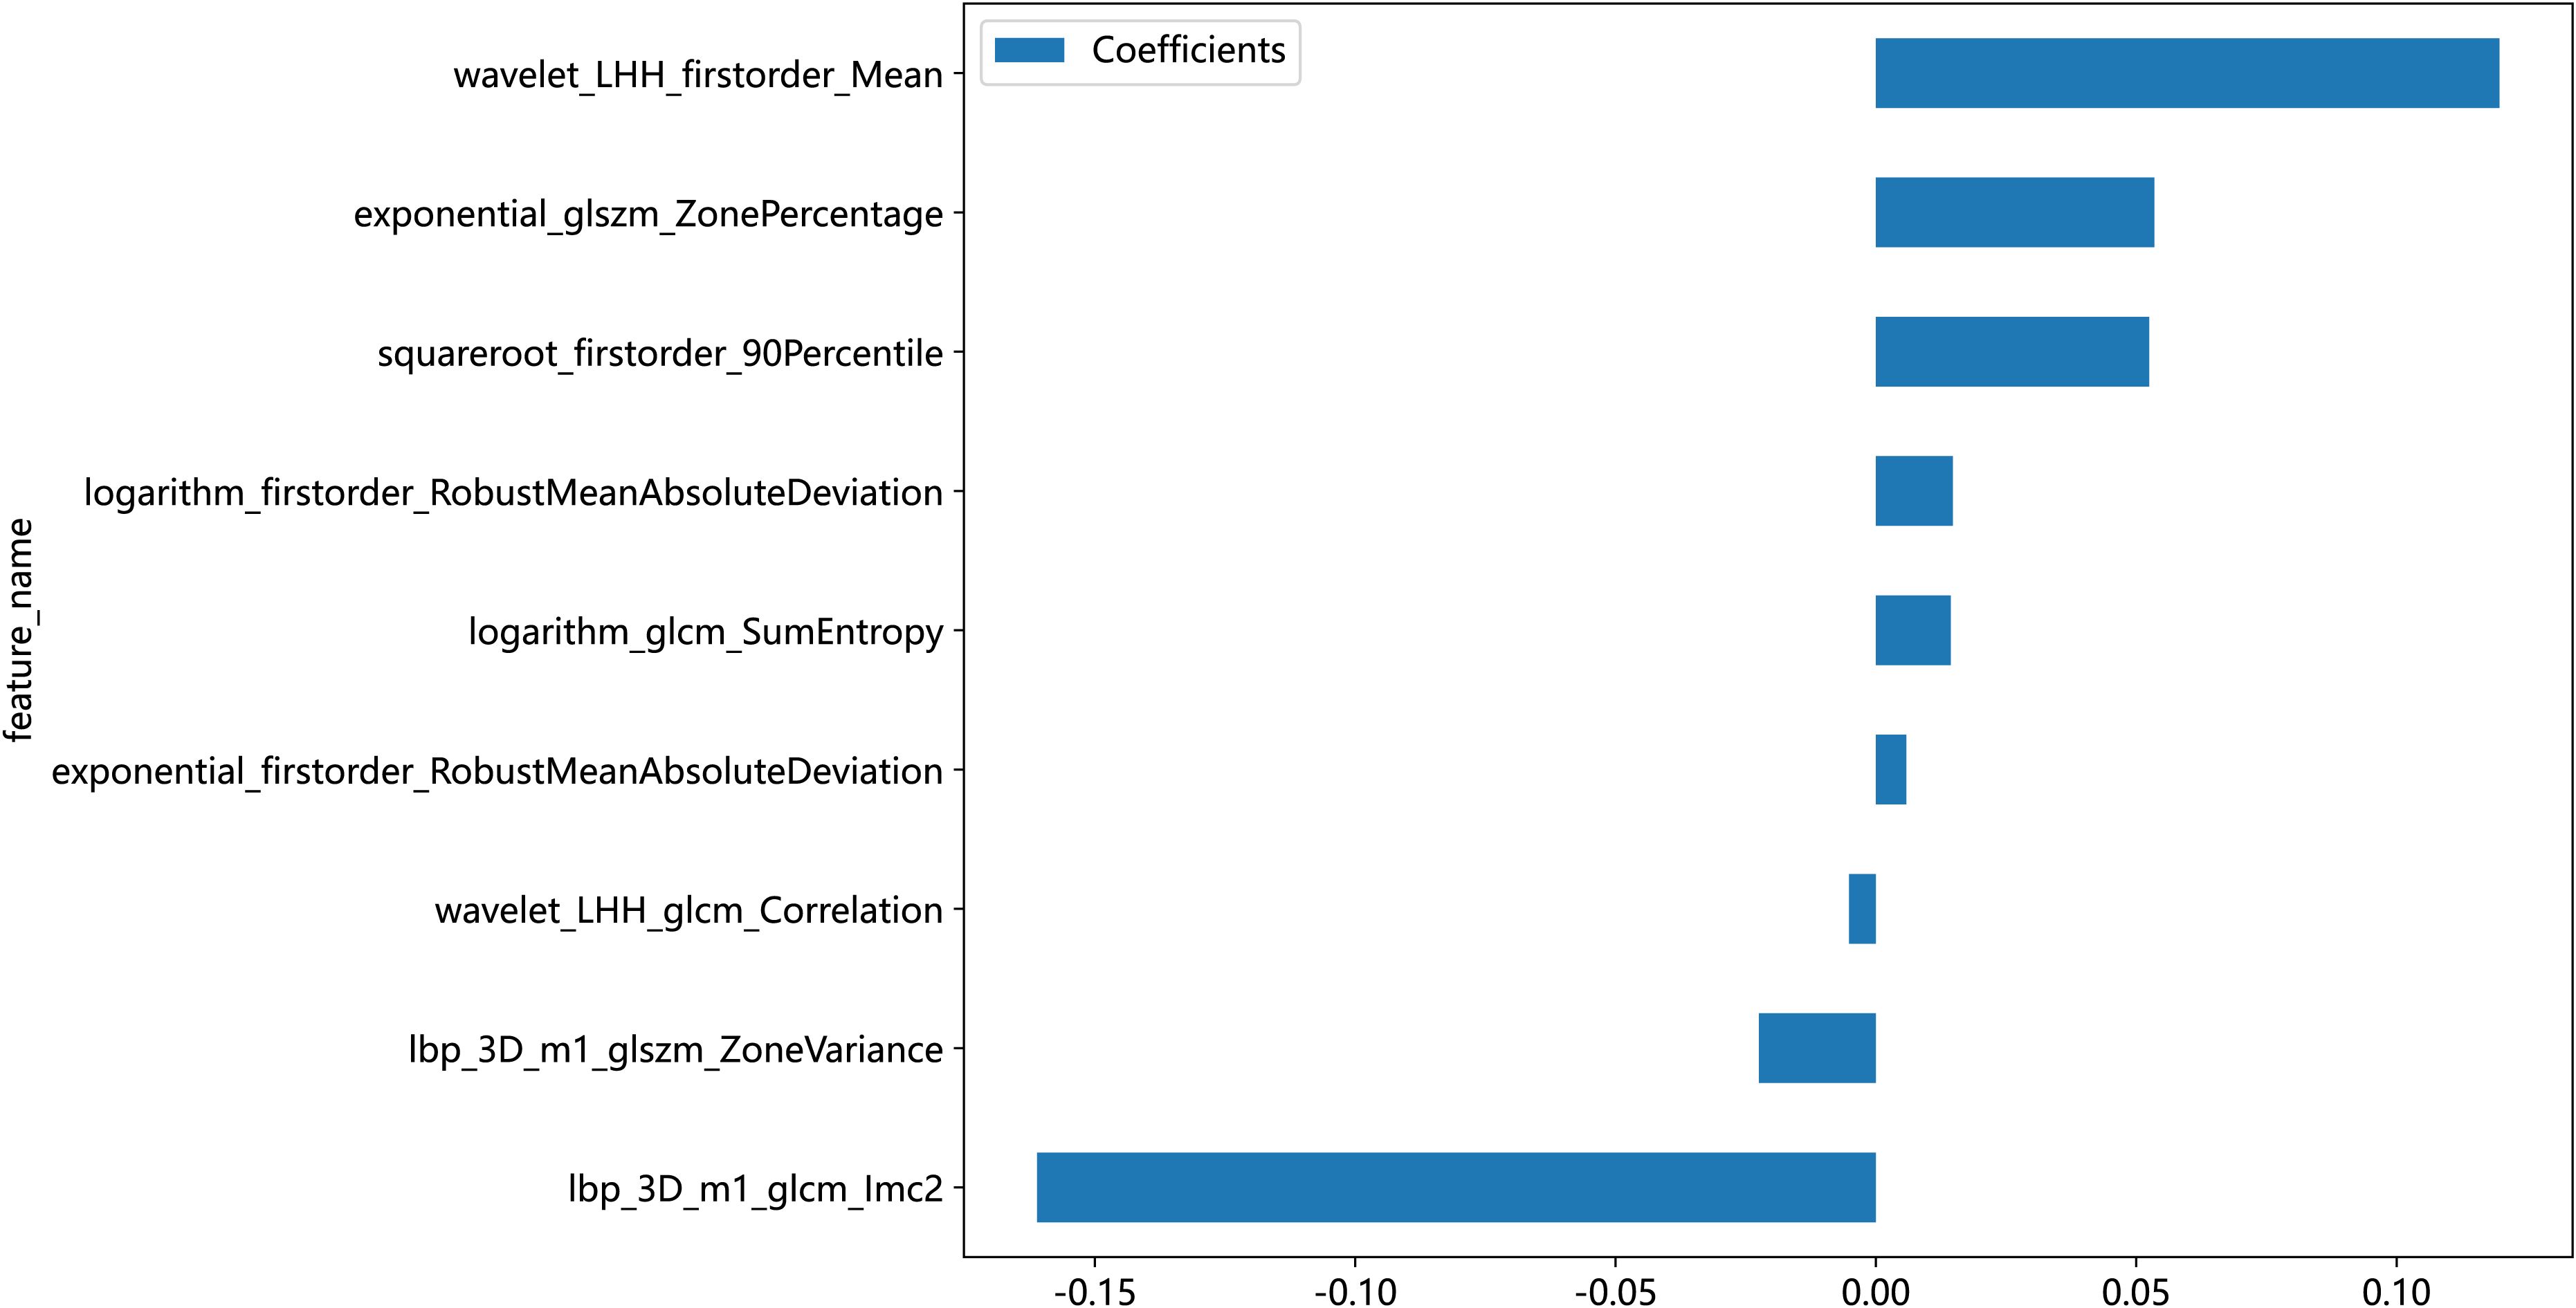
Figure 5. Weights of the nine radiomic features.

Figure 6. Graph of Rad-score results.
3.2 Radiomics model prediction
We developed eight machine learning models to predict radiation pneumonitis based on selected radiomic features, as shown in Table 2. The SVM model demonstrated the highest accuracy on the test set, while the LR model achieved the best overall predictive performance, indicated by the highest AUC and specificity. Most of the models, except the ET model, showed robust diagnostic potential with AUC scores exceeding 0.7, confirming that radiomics-based machine learning can effectively identify radiation pneumonitis in breast cancer patients. ROC curves for these models further illustrate their comparative performances (Figure 7).
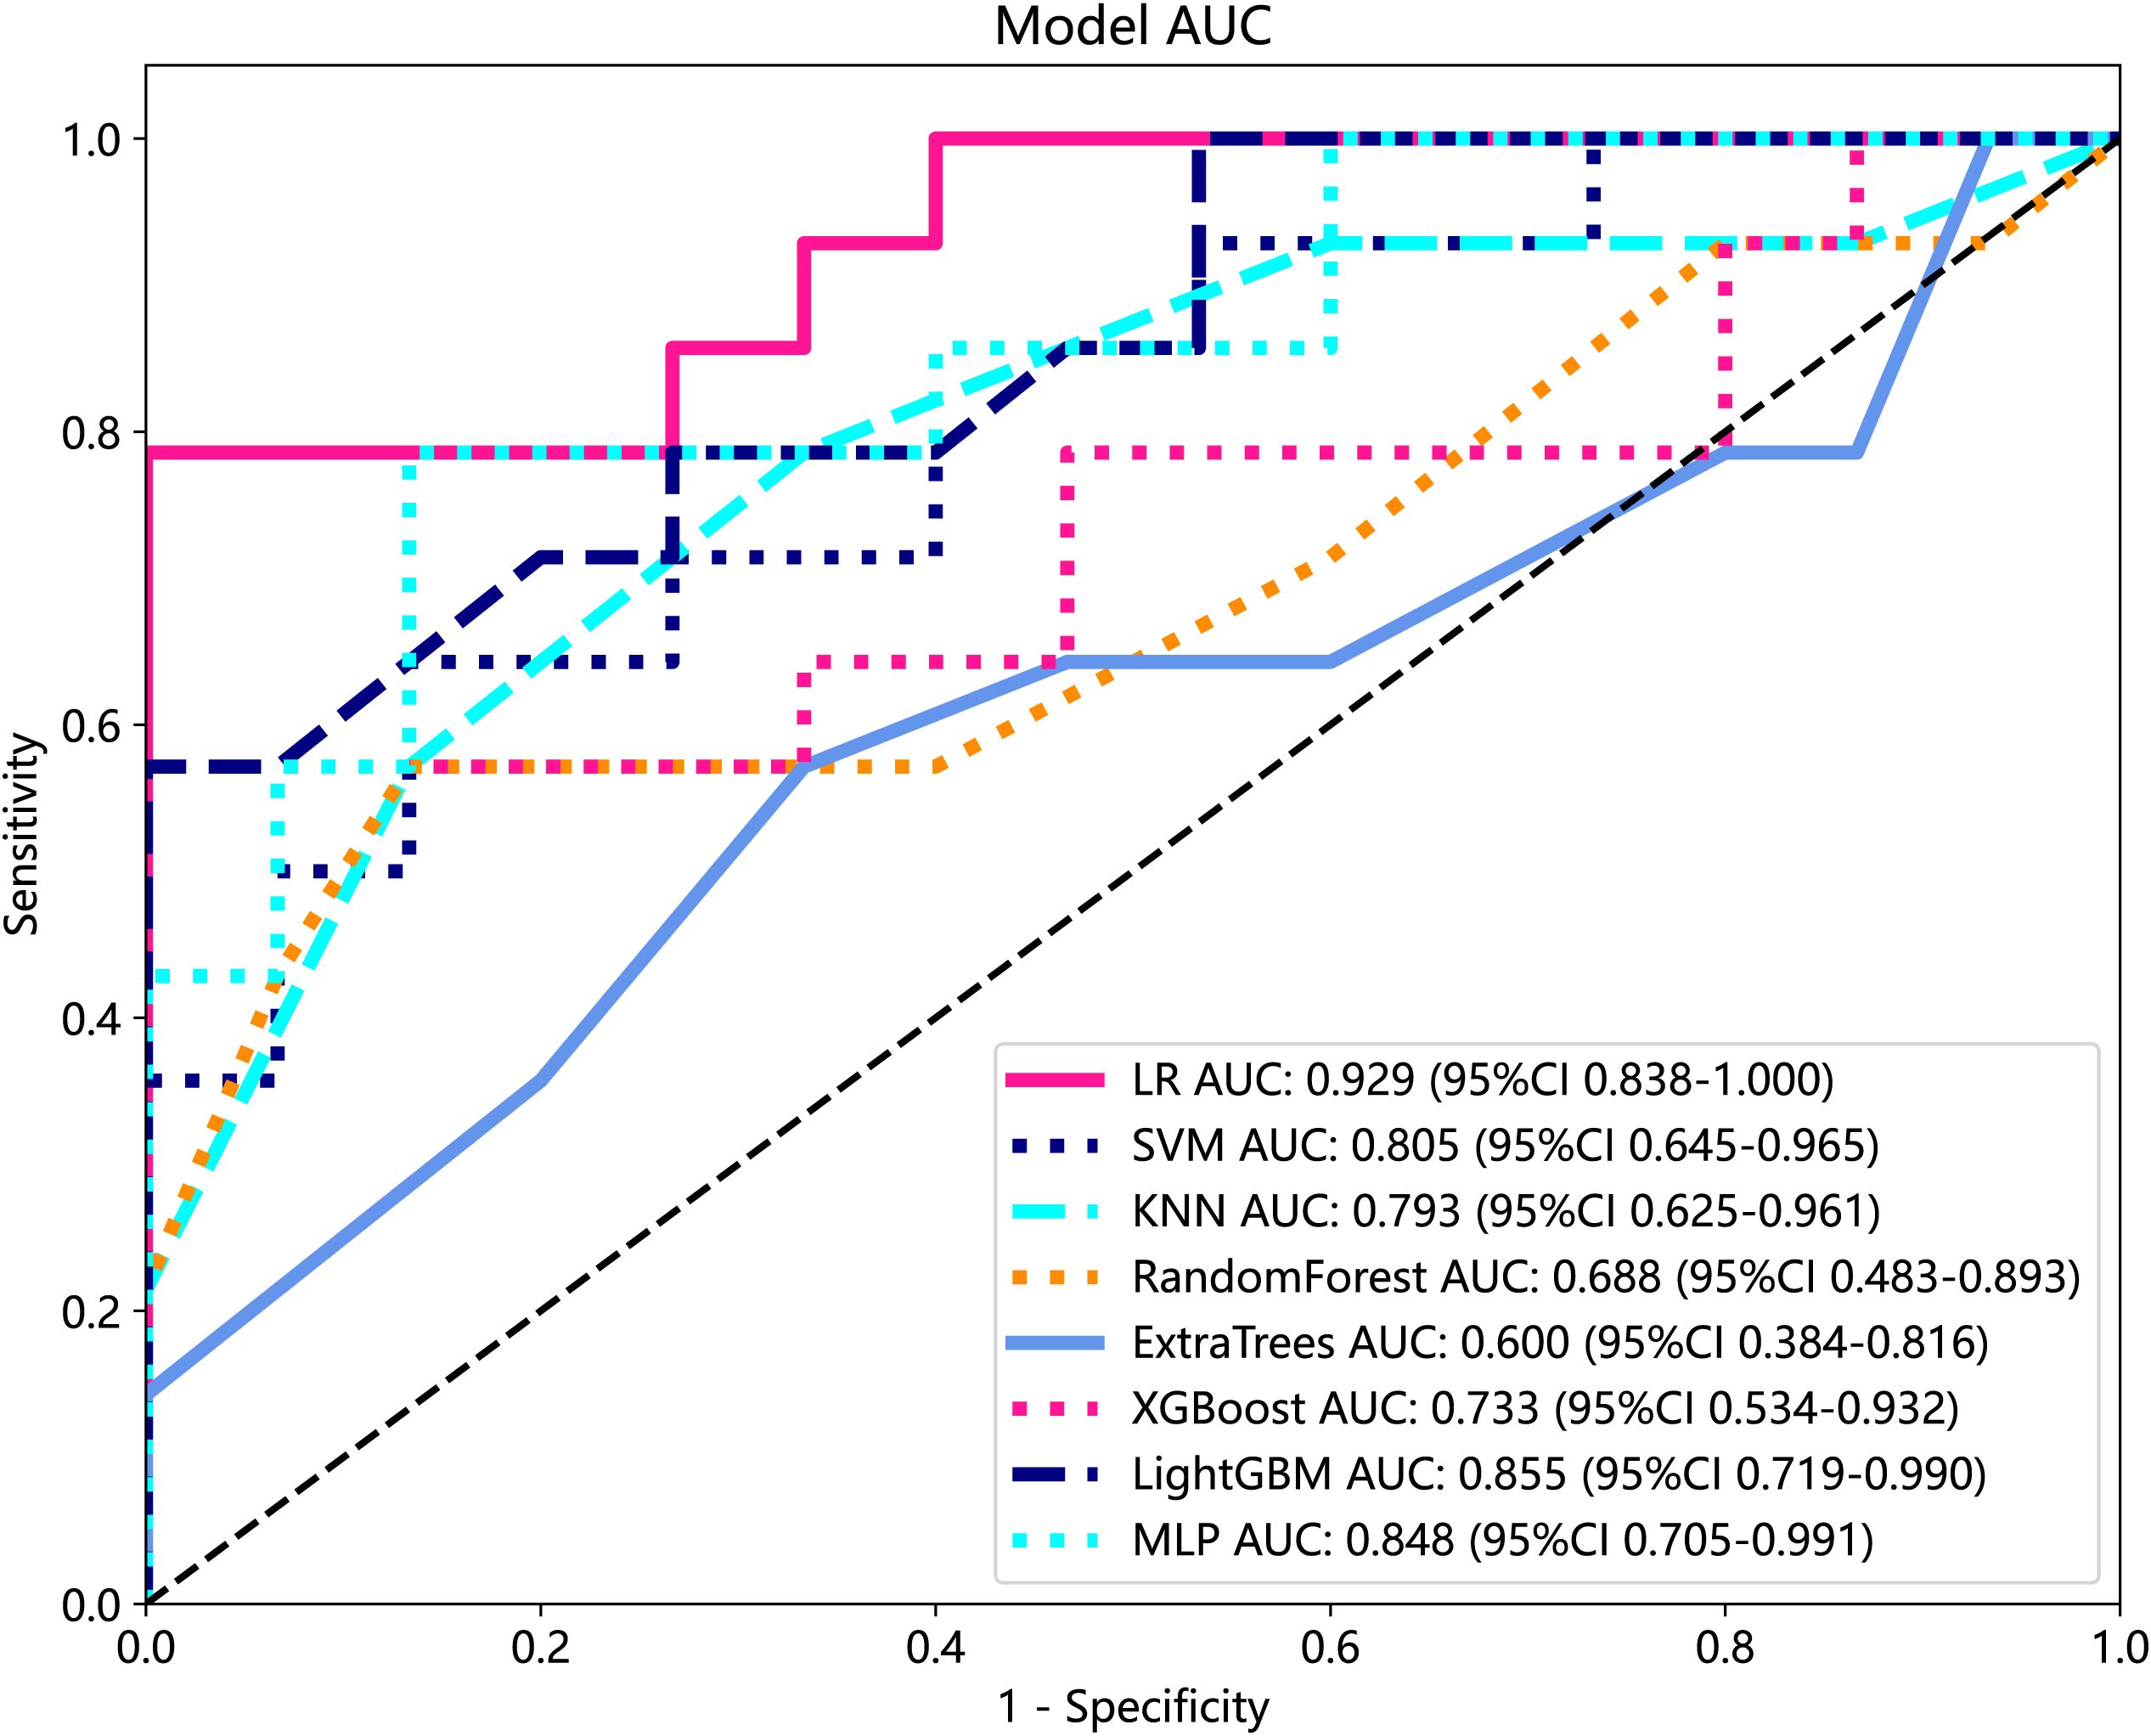
Figure 7. ROC analysis of different models on Rad signature. ROC, receiver operating characteristic.
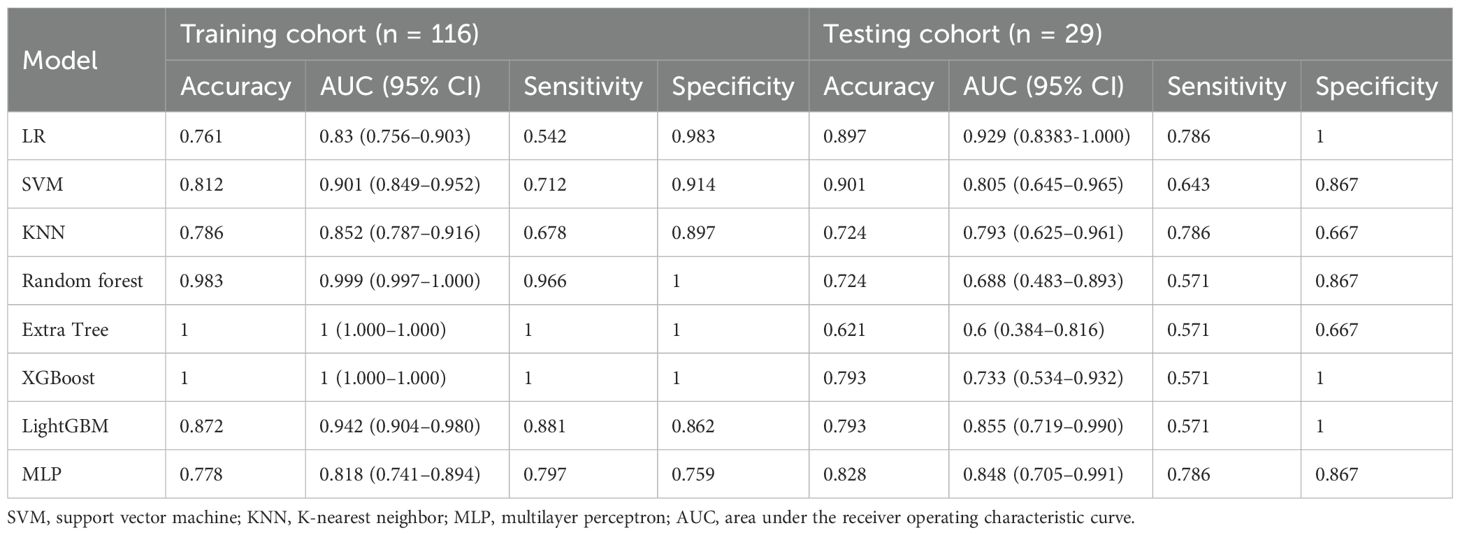
Table 2. Predictive performance of eight models in the training cohort and test cohort.
4 Discussions
Previous studies on RP have mainly focused on its prediction and diagnosis using dosimetric parameters, pulmonary metabolic activity, etc. (17, 18). However, this predictive approach’s precision and robustness still need to be improved. With the development of artificial intelligence, radiomics provides a novel approach for diagnosis and prognosis in clinical practice.
Numerous studies have confirmed that radiomics-based models exhibit robust and superior performance across multiple cancer-related prediction and classification tasks (19, 20). Therefore, radiomics can non-invasively extract imaging information and analyze its potential clinical value in a high-throughput manner to establish a practical model for prognosis and discrimination in clinical applications, thus potentially enabling the development of non-invasive differential models for the diagnosis of RP (11, 21).
Current studies have demonstrated that the integration of radiomic features with machine learning algorithms substantially improves predictive accuracy for RP differentiation in radiotherapy settings, thereby establishing a foundation for developing clinically applicable RP diagnostic models (21, 22). However, most of these radiomics studies focused on lung cancer, where the tumors’ anatomical location and adjacent structures may present radiomic feature alterations in the lung, affecting the prediction results and the validity of the extracted features for radiolucency after radiotherapy for lung cancer. RP after the radiotherapy for breast cancer is mainly in the first to second intercostal space, and the lung is less affected by the tumor. Consequently, the generalizability and robustness of the extracted features based on lung cancer may be affected to different degrees. Therefore, there is a need to personalize the diagnosis and prognosis of RP for breast cancer patients.
Our study aimed to detect radiomics changes on CT images before and after radiotherapy and explore the feasibility of employing them to discriminate the occurrence of RP in patients with breast cancer after radiotherapy. We utilized various machine learning models to diagnose the occurrence of RP after radiotherapy. It is noteworthy that we initially personalize the diagnosis of RP by comparing radiomics changes on CT images before and after radiation therapy in breast cancer patients who develop RP.
Currently, the investigators’ selection of deep learning models or classification algorithms in their study is usually determined by their experience, or they consider factors such as the frequency of being cited in the literature, data characteristics and quality, and the availability of simple implementation (23). Parmar et al. (24) found that the choice of different classification methods had a significant impact on the model performance (34.21% of the total variance of the models). Therefore, the appropriate choice of machine learning model is crucial for the prediction. In this study, eight machine learning models were constructed for prediction, and the results showed that, except for the Extra Tree model, the seven other machine learning models presented AUC values higher than 0.7 in the test cohort. The LR model was optimal for AUC, sensitivity, and specificity metrics in the test set, with an AUC value of 0.929, which indicated that the radiomic features obtained from CT images could effectively individualize the diagnosis of RP in breast cancer patients. It can assist clinical oncologists in rapid diagnosis and the adjustment of treatment plans. A total of nine radiomic features were selected in this study, including five textural features, which may be explained by the fact that lung texture is altered to varying degrees in the presence of RP, which is consistent with the assumption that textural features are more suitable for detecting tissue structural heterogeneity on imaging (25). Mean, 90Percentile, and RobustMeanAbsoluteDeviation were selected as the first-order features, probably because of the significant grayscale changes in the lungs in the presence of RP, which may lead to changes in the mean grayscale values and 90Percentile and RobustMeanAbsoluteDeviation. Cunliffe et al. (26) explored the correlation of radiomic features with radiotherapy dose and the occurrence of RP based on CT images of patients undergoing radiotherapy for lung cancer. Similarly, they found that there was a statistically significant relationship between MEAN features in first-order features and the occurrence of RP (p < 0.0025), which is similar to the results of the present study. It is worth noting that most of the radiomic features extracted in this study were features obtained by the wavelet extractor and local binary pattern (LBP) extractor, and the wavelet transform can extract features from the frequency domain and effectively enhance the texture features of CT. Also, LBP is an operator used to describe local texture features of images. Jiang et al. (27) used a CT-based wavelet transform radiomics method to grade lung lesions caused by COVID-19, and the results showed that wavelet transform could enhance CT texture features, and wavelet transform radiomics based on CT images can be used to assess the grading of COVID-19-induced lung lesions effectively. Additionally, similar findings have proved that all radiomic features with wavelet filters that were selected using LASSO regression were important predictors for the prediction of RP grade (21). Therefore, combined with the results of this study, it can be inferred that texture features are an important component for the diagnosis of RP in breast cancer patients and that feature extractors such as LBP and wavelet that can enhance or amplify texture features may be more advantageous, and it is recommended that extractors that can focus on texture features should be added when performing radiomic feature extraction for RP in breast cancer.
There is still some room for improvement in this study. This study only used radiomic features for diagnosing RP. In future studies, it is necessary to consider the influence of patients’ clinical traits, such as age, gender, smoking status, and lung disease (28). Dose parameters during treatment planning can affect the incidence rate of RP and should also be used as a reference (29–32).
Furthermore, future research should implement clinical stage stratification to identify stage-specific radiomic signature alterations. Other approaches, such as visual assessment systems (e.g., radiological scoring scales), should be incorporated to augment the feature pool. Also, this study is a single-center study with limited samples, and the models’ robustness and generalization will be somewhat challenged; additional datasets and multi-center studies should be conducted in the future.
5 Conclusions
When RP occurs, radiomics is more likely to exhibit changes in texture features and first-order characteristics, and feature extractors that can focus on or amplify texture features, such as wavelets and LBP, may be more advantageous in discriminating the RP occurrence. Meanwhile, machine learning models based on radiomic features can effectively predict the RP occurrence.
Data availability statement
The original contributions presented in the study are included in the article/Supplementary Material. Further inquiries can be directed to the corresponding authors.
Ethics statement
This study was approved by the Ethics Committee of Yunnan Cancer Hospital (KYLX2022187). Given that this is a retrospective study and all images involved in the study have been processed to eliminate any identifiable subject information, the Ethics Committee approved a waiver of informed consent for this research.
Author contributions
XW: Software, Writing – original draft, Writing – review & editing. YZ: Data curation, Investigation, Writing – original draft. WD: Data curation, Writing – original draft. CY: Data curation, Writing – original draft. JL: Data curation, Writing – original draft. LS: Data curation, Writing – original draft. YX: Data curation, Writing – original draft. CG: Methodology, Supervision, Writing – review & editing. MZ: Data curation, Funding acquisition, Writing – original draft, Writing – review & editing.
Funding
The author(s) declare that financial support was received for the research and/or publication of this article. This work was supported by the National Natural Science Foundation of China (grant number 81860537), Yunnan provincial health commission medical discipline leader training project (grant number D-2019031), and Reserve Talents of Young and Middle-aged Academic and Technological Leaders Plan of Yunnan Provincial Department of Science and Technology (grant number 202105AC160026).
Acknowledgments
We are thankful for the data support provided by Yunnan Cancer Hospital.
Conflict of interest
The authors declare that the research was conducted in the absence of any commercial or financial relationships that could be construed as a potential conflict of interest.
Correction note
A correction has been made to this article. Details can be found at: 10.3389/fonc.2025.1674168.
Generative AI statement
The author(s) declare that no Generative AI was used in the creation of this manuscript.
Publisher’s note
All claims expressed in this article are solely those of the authors and do not necessarily represent those of their affiliated organizations, or those of the publisher, the editors and the reviewers. Any product that may be evaluated in this article, or claim that may be made by its manufacturer, is not guaranteed or endorsed by the publisher.
Supplementary material
The Supplementary Material for this article can be found online at: https://www.frontiersin.org/articles/10.3389/fonc.2025.1609421/full#supplementary-material
Supplementary File S1 | Radiomics features.
Supplementary Figure 1 | Cluster analysis of radiomics features (Darker colors represent more positive correlations between features, and lighter colors represent more negative correlations).
Abbreviations
AUC, area under the curve; ET, Extra Tree; GLCM, gray-level co-occurrence matrix; GLDM, gray-level dependence matrix; GLRLM, gray-level run length matrix; GLSZM, gray-level size zone matrix; KNN, K-nearest neighbors; LASSO, least absolute shrinkage and selection operator; LBP, local binary pattern; LoG, Laplacian of Gaussian; LR, logistic regression; MLP, multilayer perceptron; ROC, receiver operating characteristic; ROI, region of interest; RP, radiation pneumonitis; SVM, support vector machine.
References
1. Sung H, Ferlay J, Siegel RL, Laversanne M, Soerjomataram I, Jemal A, et al. Global cancer statistics 2020: globocan estimates of incidence and mortality worldwide for 36 cancers in 185 countries. CA Cancer J Clin. (2021) 71:209–49. doi: 10.3322/caac.21660
2. Zhang Y, Xu Z, Chen H, Sun X, and Zhang Z. Survival comparison between postoperative and preoperative radiotherapy for stage I-iii non-inflammatory breast cancer. Sci Rep. (2022) 12:14288. doi: 10.1038/s41598-022-18251-3
3. Bernier J. Post-mastectomy radiotherapy after neodjuvant chemotherapy in breast cancer patients: A review. Crit Rev Oncol Hematol. (2015) 93:180–9. doi: 10.1016/j.critrevonc.2014.10.011
4. Fu W, Sun H, Zhao Y, Chen M, Yang L, Gao S, et al. Trends and outcomes of neoadjuvant radiotherapy compared with postoperative radiotherapy for Malignant breast cancer. Oncotarget. (2018) 9:24525–36. doi: 10.18632/oncotarget.24313
5. Cassidy RJ, Liu Y, Kahn ST, Jegadeesh NK, Liu X, Subhedar PD, et al. The role of postmastectomy radiotherapy in women with pathologic T3n0m0 breast cancer. Cancer. (2017) 123:2829–39. doi: 10.1002/cncr.30675
6. OH N, McVeigh T, Martin J, Keane M, Lowery A, and Kerin M. Neoadjuvant chemoradiation and breast reconstruction: the potential for improved outcomes in the treatment of breast cancer. Ir J Med Sci. (2019) 188:75–83. doi: 10.1007/s11845-018-1846-6
7. Mandilaras V, Bouganim N, Spayne J, Dent R, Arnaout A, Boileau JF, et al. Concurrent chemoradiotherapy for locally advanced breast cancer-time for a new paradigm? Curr Oncol. (2015) 22:25–32. doi: 10.3747/co.21.2043
8. Shaughnessy JN, Meena RA, Dunlap NE, Jain D, Riley EC, Quillo AR, et al. Efficacy of concurrent chemoradiotherapy for patients with locally recurrent or advanced inoperable breast cancer. Clin Breast Cancer. (2015) 15:135–42. doi: 10.1016/j.clbc.2014.10.007
9. Iyer P, Radhakrishnan V, Balasubramanian A, Sridevi V, Krishnamurthy A, Dhanushkodi M, et al. Study of pathological complete response rate with neoadjuvant concurrent chemoradiation with paclitaxel in locally advanced breast cancer. Indian J Cancer. (2020) 57:428–34. doi: 10.4103/ijc.IJC_524_19
10. Lambin P, Rios-Velazquez E, Leijenaar R, Carvalho S, van Stiphout RG, Granton P, et al. Radiomics: extracting more information from medical images using advanced feature analysis. Eur J Cancer. (2012) 48:441–6. doi: 10.1016/j.ejca.2011.11.036
11. Krafft SP, Rao A, Stingo F, Briere TM, Court LE, Liao Z, et al. The utility of quantitative ct radiomics features for improved prediction of radiation pneumonitis. Med Phys. (2018) 45:5317–24. doi: 10.1002/mp.13150
12. Zhang Z, Wang Z, Yan M, Yu J, Dekker A, Zhao L, et al. Radiomics and dosiomics signature from whole lung predicts radiation pneumonitis: A model development study with prospective external validation and decision-curve analysis. Int J Radiat Oncol Biol Phys. (2022) 115:746–58. doi: 10.1016/j.ijrobp.2022.08.047
13. Du F, Tang N, Cui Y, Wang W, Zhang Y, Li Z, et al. A novel nomogram model based on cone-beam ct radiomics analysis technology for predicting radiation pneumonitis in esophageal cancer patients undergoing radiotherapy. Front Oncol. (2020) 10:596013. doi: 10.3389/fonc.2020.596013
14. Qiu Q, Xing L, Wang Y, Feng A, and Wen Q. Development and validation of a radiomics nomogram using computed tomography for differentiating immune checkpoint inhibitor-related pneumonitis from radiation pneumonitis for patients with non-small cell lung cancer. Front Immunol. (2022) 13:870842. doi: 10.3389/fimmu.2022.870842
15. Fedorov A, Beichel R, Kalpathy-Cramer J, Finet J, Fillion-Robin JC, Pujol S, et al. 3d slicer as an image computing platform for the quantitative imaging network. Magn Reson Imaging. (2012) 30:1323–41. doi: 10.1016/j.mri.2012.05.001
16. van Griethuysen JJM, Fedorov A, Parmar C, Hosny A, Aucoin N, Narayan V, et al. Computational radiomics system to decode the radiographic phenotype. Cancer Res. (2017) 77:e104–e7. doi: 10.1158/0008-5472.Can-17-0339
17. Giridhar P, Mallick S, Rath GK, and Julka PK. Radiation induced lung injury: prediction, assessment and management. Asian Pac J Cancer Prev. (2015) 16:2613–7. doi: 10.7314/apjcp.2015.16.7.2613
18. Kong FM, Ao X, Wang L, and Lawrence TS. The use of blood biomarkers to predict radiation lung toxicity: A potential strategy to individualize thoracic radiation therapy. Cancer Control. (2008) 15:140–50. doi: 10.1177/107327480801500206
19. Xiong L, Chen H, Tang X, Chen B, Jiang X, Liu L, et al. Ultrasound-based radiomics analysis for predicting disease-free survival of invasive breast cancer. Front Oncol. (2021) 11:621993. doi: 10.3389/fonc.2021.621993
20. Zheng Y, Zhou D, Liu H, and Wen M. Ct-based radiomics analysis of different machine learning models for differentiating benign and Malignant parotid tumors. Eur Radiol. (2022) 32:6953–64. doi: 10.1007/s00330-022-08830-3
21. Kawahara D, Imano N, Nishioka R, Ogawa K, Kimura T, Nakashima T, et al. Prediction of radiation pneumonitis after definitive radiotherapy for locally advanced non-small cell lung cancer using multi-region radiomics analysis. Sci Rep. (2021) 11:16232. doi: 10.1038/s41598-021-95643-x
22. Sheen H, Cho W, Kim C, Han MC, Kim H, Lee H, et al. Radiomics-based hybrid model for predicting radiation pneumonitis: A systematic review and meta-analysis. Physica Med. (2024) 123:103414. doi: 10.1016/j.ejmp.2024.103414
23. Deist TM, Dankers FJWM, Valdes G, Wijsman R, Hsu I-C, Oberije C, et al. Machine learning algorithms for outcome prediction in (Chemo)Radiotherapy: an empirical comparison of classifiers. Medical physics (2018) 45:3449–59. doi: 10.1002/mp.12967
24. Parmar C, Grossmann P, Bussink J, Lambin P, and Aerts H. Machine learning methods for quantitative radiomic biomarkers. Sci Rep. (2015) 5:13087. doi: 10.1038/srep13087
25. Prasanna P, Tiwari P, and Madabhushi A. Co-occurrence of local anisotropic gradient orientations (Collage): A new radiomics descriptor. Sci Rep. (2016) 6:37241. doi: 10.1038/srep37241
26. Cunliffe A, Armato SG 3rd, Castillo R, Pham N, Guerrero T, and Al-Hallaq HA. Lung texture in serial thoracic computed tomography scans: correlation of radiomics-based features with radiation therapy dose and radiation pneumonitis development. Int J Radiat Oncol Biol Phys. (2015) 91:1048–56. doi: 10.1016/j.ijrobp.2014.11.030
27. Jiang Z, Yin J, Han P, Chen N, Kang Q, Qiu Y, et al. Wavelet transformation can enhance computed tomography texture features: A multicenter radiomics study for grade assessment of covid-19 pulmonary lesions. Quant Imaging Med Surg. (2022) 12:4758–70. doi: 10.21037/qims-22-252
28. Vogelius IR and Bentzen SM. A literature-based meta-analysis of clinical risk factors for development of radiation induced pneumonitis. Acta Oncol. (2012) 51:975–83. doi: 10.3109/0284186x.2012.718093
29. Tucker SL, Liao Z, Dinh J, Bian SX, Mohan R, Martel MK, et al. Is there an impact of heart exposure on the incidence of radiation pneumonitis? Analysis of data from a large clinical cohort. Acta Oncol. (2014) 53:590–6. doi: 10.3109/0284186X.2013.831185
30. Takahashi S, Go T, Kasai Y, Yokomise H, and Shibata T. Relationship between Dose-Volume Parameters and Pulmonary Complications after Neoadjuvant Chemoradiotherapy Followed By surgery for Lung Cancer. Strahlenther Onkol. (2016) 192:658–67. doi: 10.1007/s00066-016-1021-9
31. Katsui K, Ogata T, Watanabe K, Katayama N, Soh J, Kuroda M, et al. Dose-volume parameters predict radiation pneumonitis after induction chemoradiotherapy followed by surgery for non-small cell lung cancer: A retrospective analysis. BMC Cancer. (2019) 19:1144. doi: 10.1186/s12885-019-6359-9
Keywords: breast cancer, radiomics, radiation pneumonitis, machine learning, artificial intelligence
Citation: Wen X, Zhao Y, Dong W, Yang C, Li J, Sun L, Xiu Y, Gao C and Zhang M (2025) Personalized diagnosis of radiation pneumonitis in breast cancer patients based on radiomics. Front. Oncol. 15:1609421. doi: 10.3389/fonc.2025.1609421
Received: 10 April 2025; Accepted: 30 June 2025;
Published: 22 July 2025; Corrected: 26 August 2025.
Edited by:
Han Wang, Shanghai Jiao Tong University School Medicine, ChinaCopyright © 2025 Wen, Zhao, Dong, Yang, Li, Sun, Xiu, Gao and Zhang. This is an open-access article distributed under the terms of the Creative Commons Attribution License (CC BY). The use, distribution or reproduction in other forums is permitted, provided the original author(s) and the copyright owner(s) are credited and that the original publication in this journal is cited, in accordance with accepted academic practice. No use, distribution or reproduction is permitted which does not comply with these terms.
*Correspondence: Ming Zhang, emhhbmdtaW5nMUBrbW11LmVkdS5jbg==; Chang’e Gao, Z2FvY2hhbmdlQGttbXUuZWR1LmNu
†These authors have contributed equally to this work