 Yimin Guo
 Haixiang Yin2,3†
 Pan Liang
 Jianbo Gao
 Ming Cheng
- 1Department of Radiology, The First Affiliated Hospital of Zhengzhou University, Zhengzhou, Henan, China
- 2Henan Key Laboratory of Image Diagnosis and Treatment for Digestive System Tumor, The First Affiliated Hospital of Zhengzhou University, Zhengzhou, Henan, China
- 3Department of Medical Information, The First Affiliated Hospital of Zhengzhou University, Zhengzhou, Henan, China
- 4Institute of Interconnected Intelligent Health Management of Henan Province, The First Affiliated Hospital of Zhengzhou University, Zhengzhou, Henan, China
Objective: Our study aimed to explore the potential of deep learning (DL) radiomics features from CT images of primary gastric cancer (GC) in predicting gastric cancer liver metastasis (GCLM) by establishing and verifying a prediction model based on clinical factors, classical radiomics and DL features.
Methods: We retrospectively analyzed 1001 pathologically confirmed GC patients from June 2014 to May 2024, divided into non-LM (n=689) and LM groups (n=312). CT-based classic radiomics and DL features were extracted and screened to construct a DL-radiomics score. This score, along with statistically significant clinical factors, was used to build a fused model which visualized as a nomogram. The model’s predictive performance, calibration, and clinical utility were assessed and compared against a clinical model. Additionally, the DL-radiomics score’s role in distinguishing between synchronous and metachronous GCLM was evaluated.
Results: The fused model showed good predictive performance [AUC: 0.796 (95% CI: 0.766-0.826) in training cohort and 0.787 (95% CI: 0.741-0.834) in test cohort], outperforming the clinical model, radiomics score and DL score (P<0.05). In addition, the decision curve confirmed that the model provided the largest clinical net benefit compared with all other models in the relevant threshold. DL-radiomics score showed moderate predictive performance in distinguishing between synchronous GCLM and metachronous GCLM, with an AUC of 0.665 (95% CI, 0.613-0.718).
Conclusion: The CT-based fused model has demonstrated significant value in predicting the occurrence of GCLM, and can provide a reference for the personalized follow-up and treatment of patients.
1 Introduction
As the fifth most common cancer diagnosis and the leading cause of cancer-related death in the world, poor prognosis of gastric cancer (GC) poses a serious challenge to human health (1). One primary contributor to this adverse outcome is the tendency of GC to metastasize distantly with common sites include liver, peritoneum, and bone (2). Among these, the liver stands out as the primary target organ for hematogenous metastasis of GC. The overall incidence of gastric cancer liver metastases (GCLM) is about 9.9%~18.7%, of which synchronous GCLM accounts for about 80% and metachronous GCLM accounts for about 20%. A number of studies have shown that the overall survival of patients with synchronous GCLM is worse than that of patients with metachronous GCLM (3).
At present, the predominant imaging methods employed for detecting liver metastasis (LM) in patients with GC are computed tomography (CT) and magnetic resonance imaging (MRI). Among them, CT is more widely used due to its reasonable price, convenience and less contraindications (4). However, it is difficult to detect early micro-lesions or micro-metastasis by traditional CT, and the LM after GC surgery, i.e., metachronous GCLM, cannot be predicted early, which may lead to missing the best time for treatment (5). The accuracy and sensitivity of MRI in the diagnosis of LM are higher than CT. However, due to its high price and long examination time, it is usually used as a supplementary test in clinical practice only when other examination methods have found suspicious LM. Based on the above reasons, it is particularly important to find a CT-based method to predict the occurrence of GCLM and screen out high-risk patients with GCLM.
In recent years, artificial intelligence has gradually penetrated into the field of medical research, especially in medical imaging, so radiomics came into being (6). It can be used as a non-invasive visualization tool to extract tumor features and reveal tumor heterogeneity. Classical radiomics feature extraction relies on predefined statistical descriptors, such as shape, pixel intensity, and texture. Some scholars have applied this method to the prediction of colon cancer liver metastases (CCLM), and achieved good results, which confirmed the feasibility of this method (7–10). Deep learning (DL), based on deep neural networks, can automatically learn and extract valuable features from original medical images without pre-definition (11–13). The features extracted by the two methods reflect abstract information at different levels of tumor imaging, and reveal the imaging features of tumors more comprehensively. To the best of our knowledge, existing studies predicting the occurrence of GCLM have relied solely on clinical characteristics or visually assessable CT image features (4, 5, 14, 15) and no research has used mixing of classic radiomics features and DL features to predict the occurrence of GCLM, and this study may be the first attempt.
Our study aimed to explore the potential of radiomics features from CT images of primary GC in predicting GCLM, and to establish and verify a prediction model based on clinical factors, classical radiomics features and DL features. In addition, we further evaluated the ability of the DL-radiomics score constructed by the selected classical radiomics features and DL features to distinguish between synchronous GCLM and metachronous GCLM.
2 Materials and methods
2.1 Patients
The Institutional Review Board of the First Affiliated Hospital of Zhengzhou University approved our research (Ethical review number: 2021-KY-1070-002) and waived the requirement of written informed consent. We retrospectively collected patients with GC confirmed by pathology in the First Affiliated Hospital of Zhengzhou University from June 2014 to May 2024, and screened patients based on the following inclusion and exclusion criteria.
The inclusion criteria were:
Non-LM Group: (1) Patients were followed up regularly for at least two years in our hospital and there was no evidence of liver metastasis during the follow-up period; (2) Patients had complete clinical data.
LM Group: (1) Patients found liver metastases that could be confirmed by pathology or imaging examination during the follow-up period; (2) Patients had complete clinical data.
And the common exclusion criteria were: (1) The patient had primary malignant tumors in other organs; (2) The patient had a history of gastric cancer treatment; (3) CT image quality is poor or insufficient stomach distension.
Finally, we included a total of 1001 patients. According to whether the patients had LM during the follow-up period, we divided them into two groups, including non-LM group (n=689) and LM group (n=312). A flowchart detailing the procedure of patient selection is displayed in Figure 1. Baseline clinical information of patients was collected, including sex, age, tumor location, tumor thickness, clinical T stage, clinical N stage, degree of differentiation, Lauren type, Her-2 lever, CEA, CA199. Based on the computer-generated random numbers, patients were randomly divided into the training cohort and the test cohort at a ratio of 7: 3.
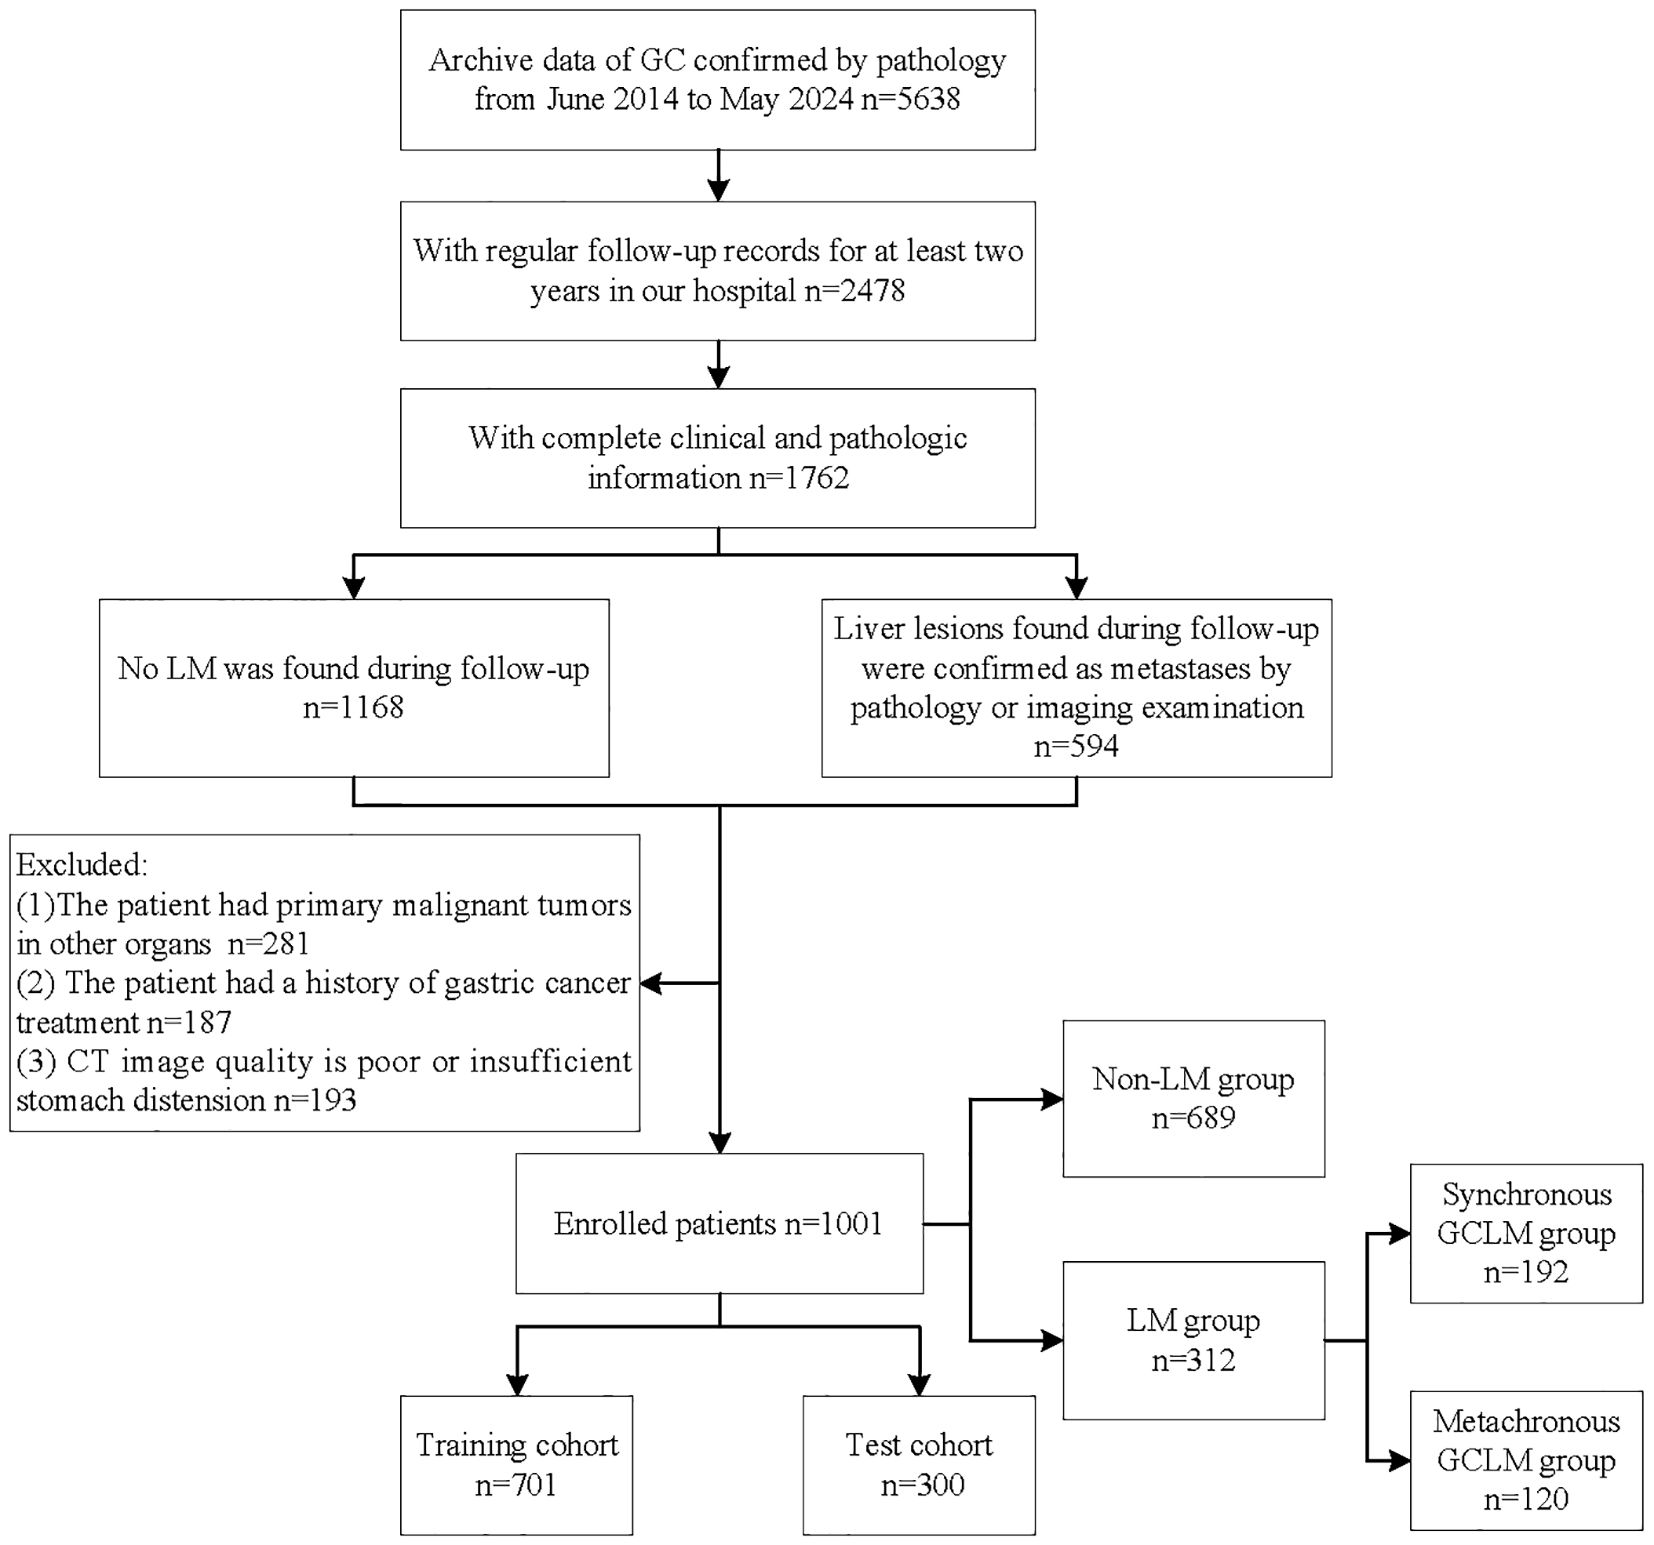
Figure 1. Flowchart of patient selection process. GC, gastric cancer; LM, liver metastases; GCLM, gastric cancer liver metastases.
2.2 CT image acquisition and image preprocessing
All patients underwent abdominal enhanced CT examination before receiving GC treatment. The venous phase cross-sectional CT image with a thickness of 5 mm was selected to delineate the region of interest (ROI). The CT examination method is shown in detail in the Supplemetary Appendix S1. A radiologist (Reader 1), with over eight years of experience in interpreting medical films, utilized 3D Slicer software to outline ROI along the tumor’s edge in all CT scans capable of displaying gastric malignancies. After a month, Reader 1 was reassigned, and a second radiologist (Reader 2), also possessing more than eight years of experience, was chosen for the task. CT images from 100 patients diagnosed with GC were randomly chosen from the study cohort. Both Reader 1 and Reader 2 then independently repeated the segmentation of ROIs to assess intra- and inter-observer reproducibility. Intraclass and interclass correlation coefficients (ICCs) were computed to quantify agreement. Reliability was deemed satisfactory when ICC values exceeded 0.8.
Before segmentation and feature extraction, image preprocessing is performed to improve the stability of radiological features. In order to standardize CT images from different CT scanning equipment, two steps are used: (a) all CT images were resampled to a voxel size of 1× 1 × 1 mm³ using cubic spline interpolation; and (b) the pixel intensity was normalized to transform the images to standardized inputs, which had the intensity range from -1024 to 1024 HU and the unified abdomen window (window-level [WL] of 50 and window-width [WW] of 350).
2.3 DL radiomics features extraction
An autoencoder (AE), constructed based on a deep convolutional neural network (DCNN), was employed to DL features. The AE comprised two primary components: a 3D encoder and a 3D decoder. The 3D encoder functioned to automatically extract latent-space vectors from 3D ROI. Subsequently, the decoder reconstructed CT slices from these latent-space vectors, ensuring that the reconstructed slices closely matched the original input to the encoder. In this study, these latent-space vectors were referred to as DL features. In addition, classical radiomics features were extracted using Pyradiomics (http://pyradiomics.readthedocs.io) and included shape features, first-order features, second-order features, high-order features. All the feature extraction methods were further explained in the Supplemetary Appendix S2.
2.4 Feature selection and model construction
The feature screening process was carried out according to the following steps in the training cohort. Firstly, we applied the variance threshold method to filter out features with a variance not exceeding 1.0. Then, Spearman correlation analysis was performed to remove features that had an average correlation coefficient greater than 0.7. Next, we used the independent sample t-test to select features that exhibited significant differences (P < 0.05) with the target variable. Ultimately, the least absolute shrinkage and selection operator (LASSO) algorithm was applied to was utilized to further refine the selection of features highly correlated with GCLM. LASSO regression operates by introducing an L1 regularization term with parameter λ to the loss function, so that the weights of irrelevant features are 0, thereby achieving feature selection and preventing overfitting. We performed a 10-fold cross-validation to determine the optimal λ value, and the optimal λ defined as the largest value within one standard error of the minimum binomial deviance. Consequently, multivariable logistic regression analysis was used to build two types of scores, radiomics and DL, reflecting the different phenotypic characteristics of the tumors. The DL-radiomics score combining the DL and classical radiomics features were also constructed.
Univariable analysis was performed to identify statistically significant clinical factors (P < 0.05). Subsequently, multivariable logistic regression analysis was employed to develop a fused model by combining the DL-radiomics score and the significant clinical factors. Then, a fused nomogram was generated to provide the clinician with an applicable tool to estimate the probability of future LM in patients with GC. The model construction process is shown in Figure 2. Additionally, a clinical model containing only clinical variables was built for comparison.
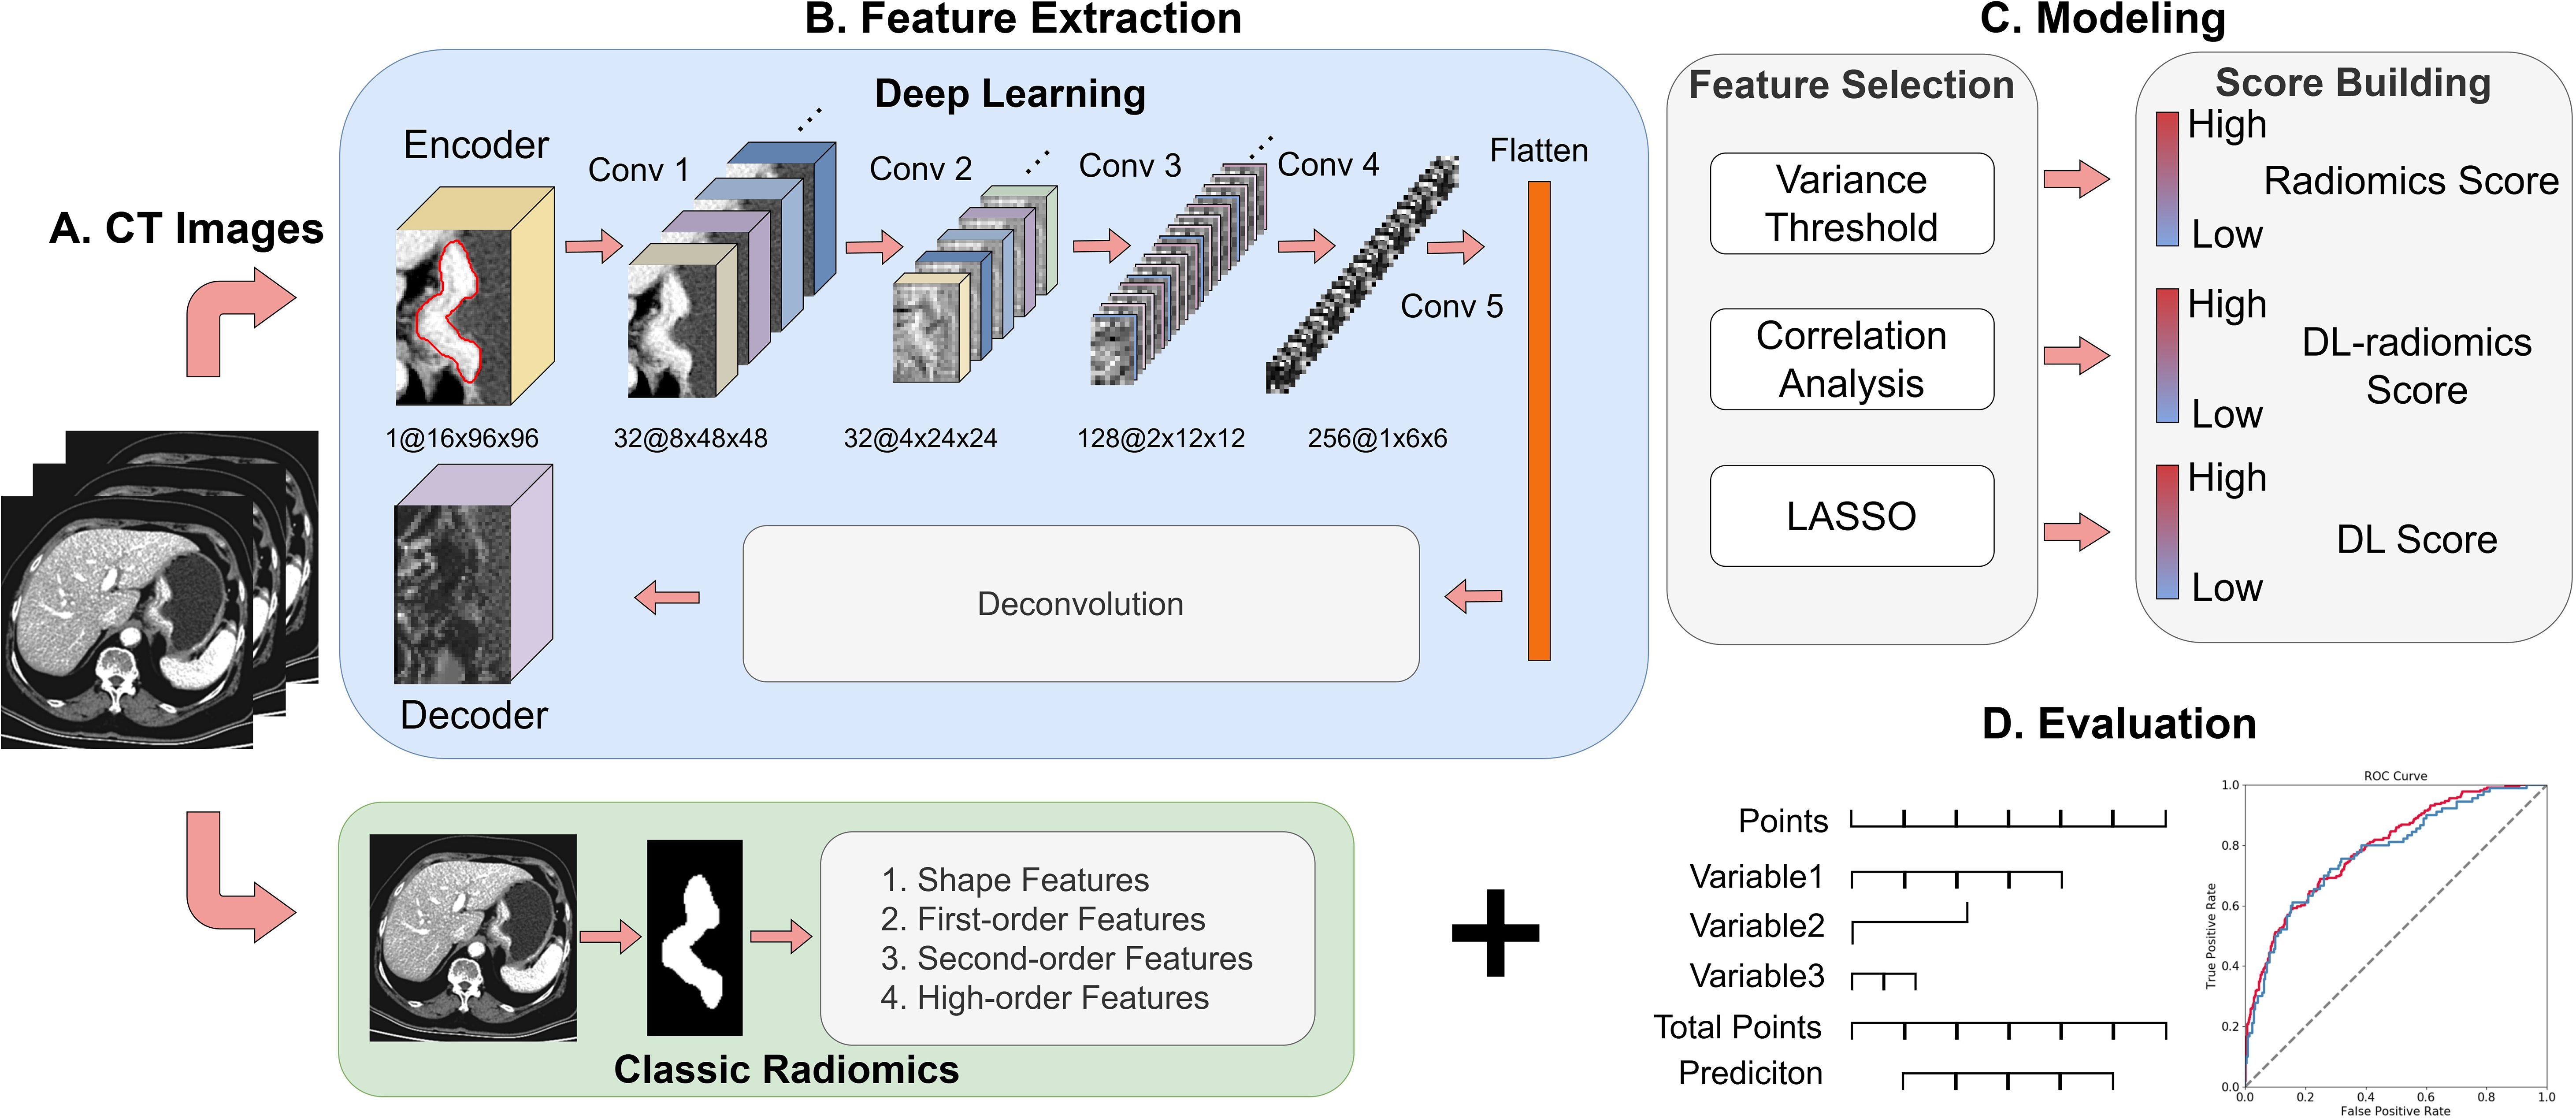
Figure 2. Overview of the study design. (A) Collection of 5mm venous phase CT Images; (B) Extraction of DL features and classical radiomics features; (C) Feature selection and model construction; (D) Model visualization and evaluation. DL, deep learning.
2.5 Performance evaluation
The receiver operator characteristic (ROC) curves of each model were drawn respectively to obtain the area under the curve (AUC) value and 95% confidence interval (CI). Then DeLong ‘s test was used to compare whether the differences between different ROC curves were statistically significant. Then we applied the confused matrix to further evaluate other performance indicators of the models, including accuracy (ACC), sensitivity (SENS), specificity (SPEC), positive predictive value (PPV), and negative predictive value (NPV). In addition, we plotted the calibration curves to evaluate the consistency between the predicted probability of the models and the actual probability. The decision curve was used to evaluate the clinical application value of the models, thereby judging the net benefit of the models in practical application.
We collected the interval time of LM patients from the diagnosis of GC to the diagnosis of LM. Patients with an interval time of less than 6 months were included in the synchronous GCLM group (n=192), while those with an interval time exceeding 6 months were placed in the metachronous GCLM group (n=120). We further explored the ability of the DL-radiomics score to distinguish patients with synchronous GCLM from patients with metachronous GCLM.
2.6 Statistical analysis
We used Python 3.6, R software 4.0.3 (R project for statistical computing, https://www.r-project.org) to analyze baseline clinical information. Categorical variables were manifested as numbers or percentages, and Chi-square analysis was performed to analyze categorical data. Means and SDs were used to present continuous variables. Differences between the two groups were assessed using t-tests if the data conformed to a normal distribution and had equal variance; otherwise, Mann-Whitney U tests were applied. Statistical significance was set at P < 0.05.
3 Results
3.1 Patient characteristics
The clinical information of the 1001 patients (77.82% males; mean age, 59.46 ± 10.40; range, 20–88 years) we finally included is shown in Supplementary Table S1. According to the ratio of 7:3, we randomly divided all samples into training cohort (n=701, 79.50% males; mean age, 59.60 ± 10.35; range, 20–86 years) and test cohort (n=300, 74.00% males; mean age, 59.12 ± 10.54; range, 23–88 years). There was no significant difference in clinical characteristics between the training cohort and the test cohort (Supplementary Table S2, P>0.05). In addition, the clinical characteristics of non-LM group and LM group in different cohorts were compared and the detailed results are shown in Table 1. The results revealed tumor thickness, CEA and CA199 showed significant variations in training cohort and test cohort between non-LM group and LM group (P<0.05).

Table 1. The clinical characteristics of patients in the training and test cohorts.
Then, tumor thickness, CEA and CA199 were used to construct a clinical model. ROC curves of the model were plotted in the two cohorts (Figures 3A, C). The AUCs were 0.686 (95% CI, 0.652-0.721) in the training cohort and 0.658 (95% CI, 0.605-0.712) in the test cohort, respectively, showing a moderate ability to predict the occurrence of GCLM. The results are specifically outlined in Table 2.
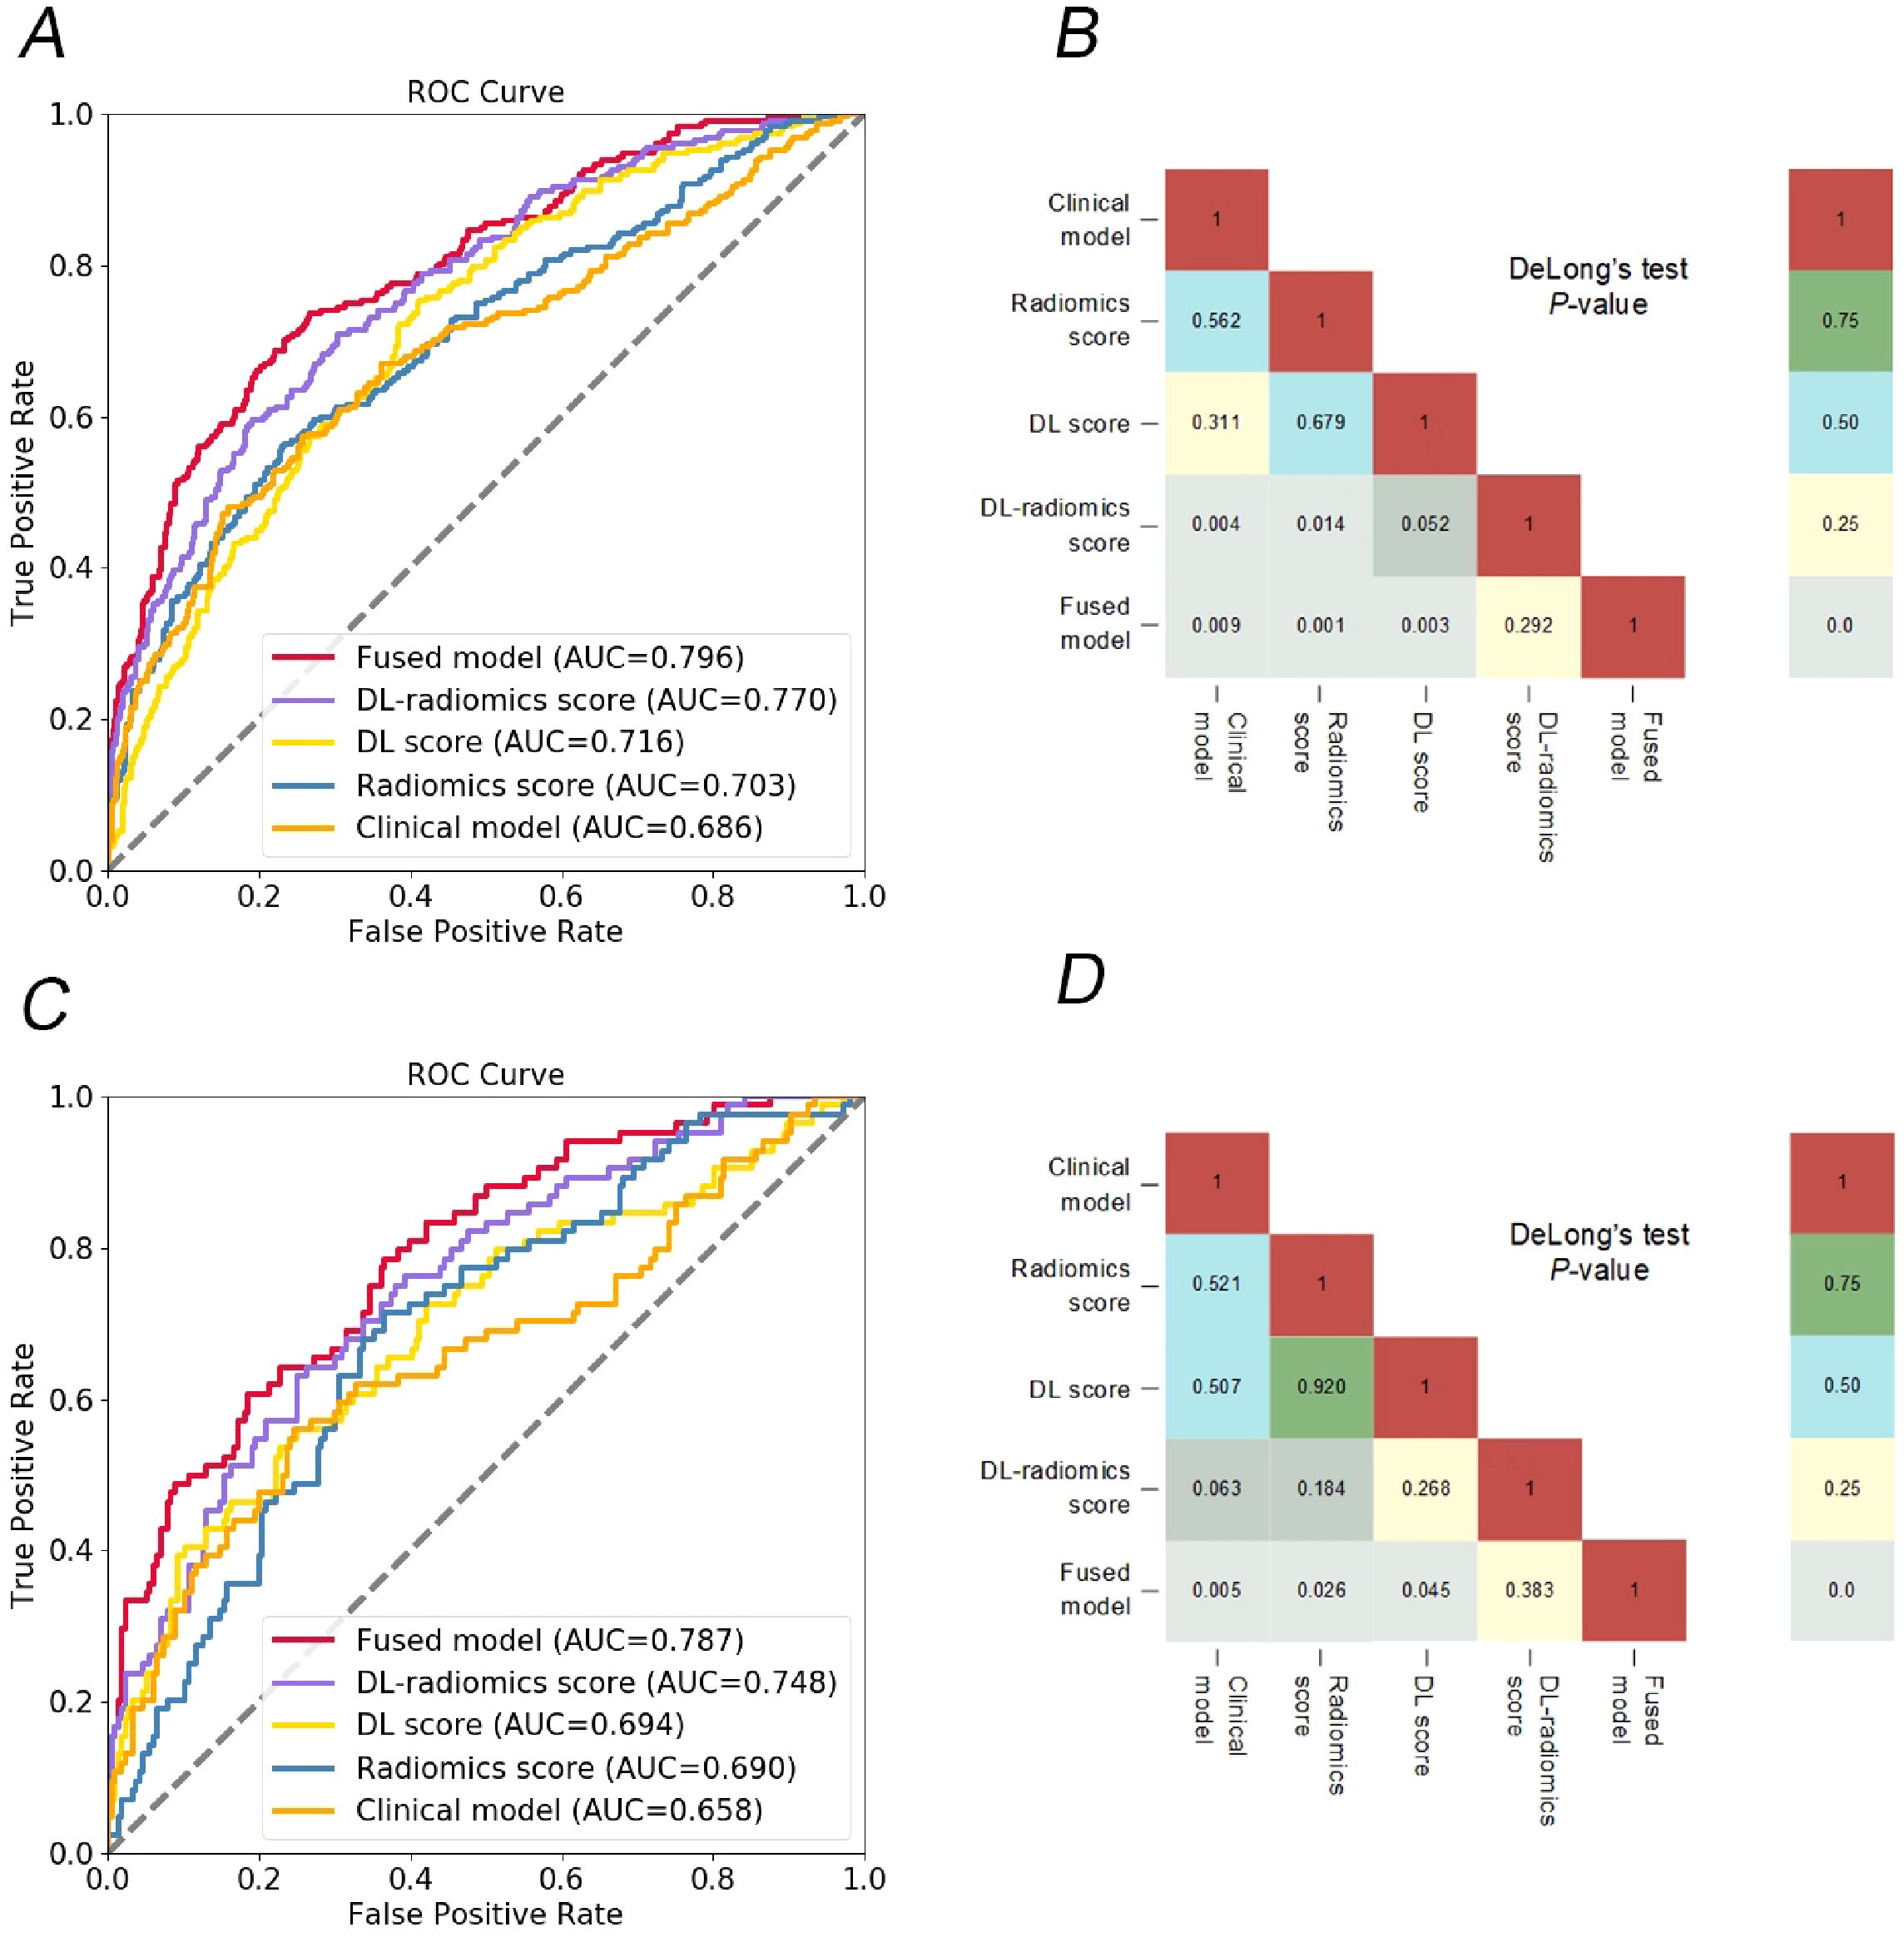
Figure 3. Comparison of different models. ROC curves of different models to predict the occurrence of GCLM, in training cohort (A) and test cohort (C); the heat map shows that the DeLong test compares the statistical results of the AUC values of different models, in training cohort (B) and test cohort (D). DL, deep learning; ROC, receiver operator characteristic; GCLM, gastric cancer liver metastases.
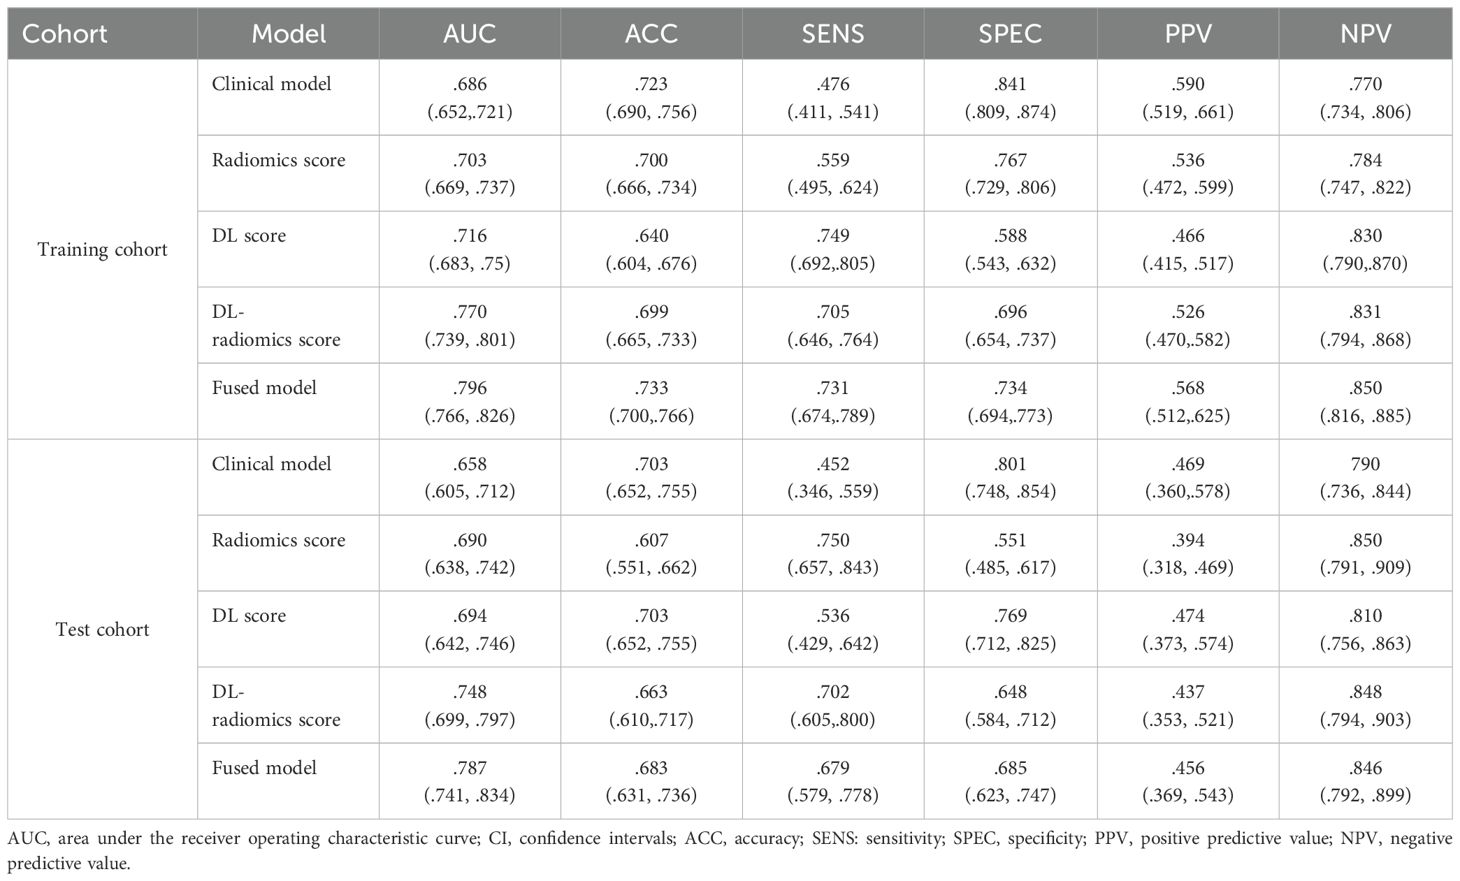
Table 2. Performance of different models.
3.2 DL radiomics score construction
In the training cohort, we extracted 2437 features from the 3D ROI of GC, including 1925 classic radiomics features and 512 DL features. We screened the features separately to remove irrelevant features and reduce feature redundancy. Finally, 39 classic radiomics and 29 DL features were retained, which were used to construct radiomics and DL score, respectively. Furthermore, same features screening process was conducted on two types of radiomics features, ultimately retaining 57 radiomics features, which was used to construct a DL-radiomics score. Please refer to Supplemetary Appendix S3 for detailed results of feature screening and scores construction methods. Figure 4 illustrated that the distribution of different scores between non-LM group and LM group exhibited statistically significant differences, and the score of LM group is generally higher than that of non-LM group (P<0.05).
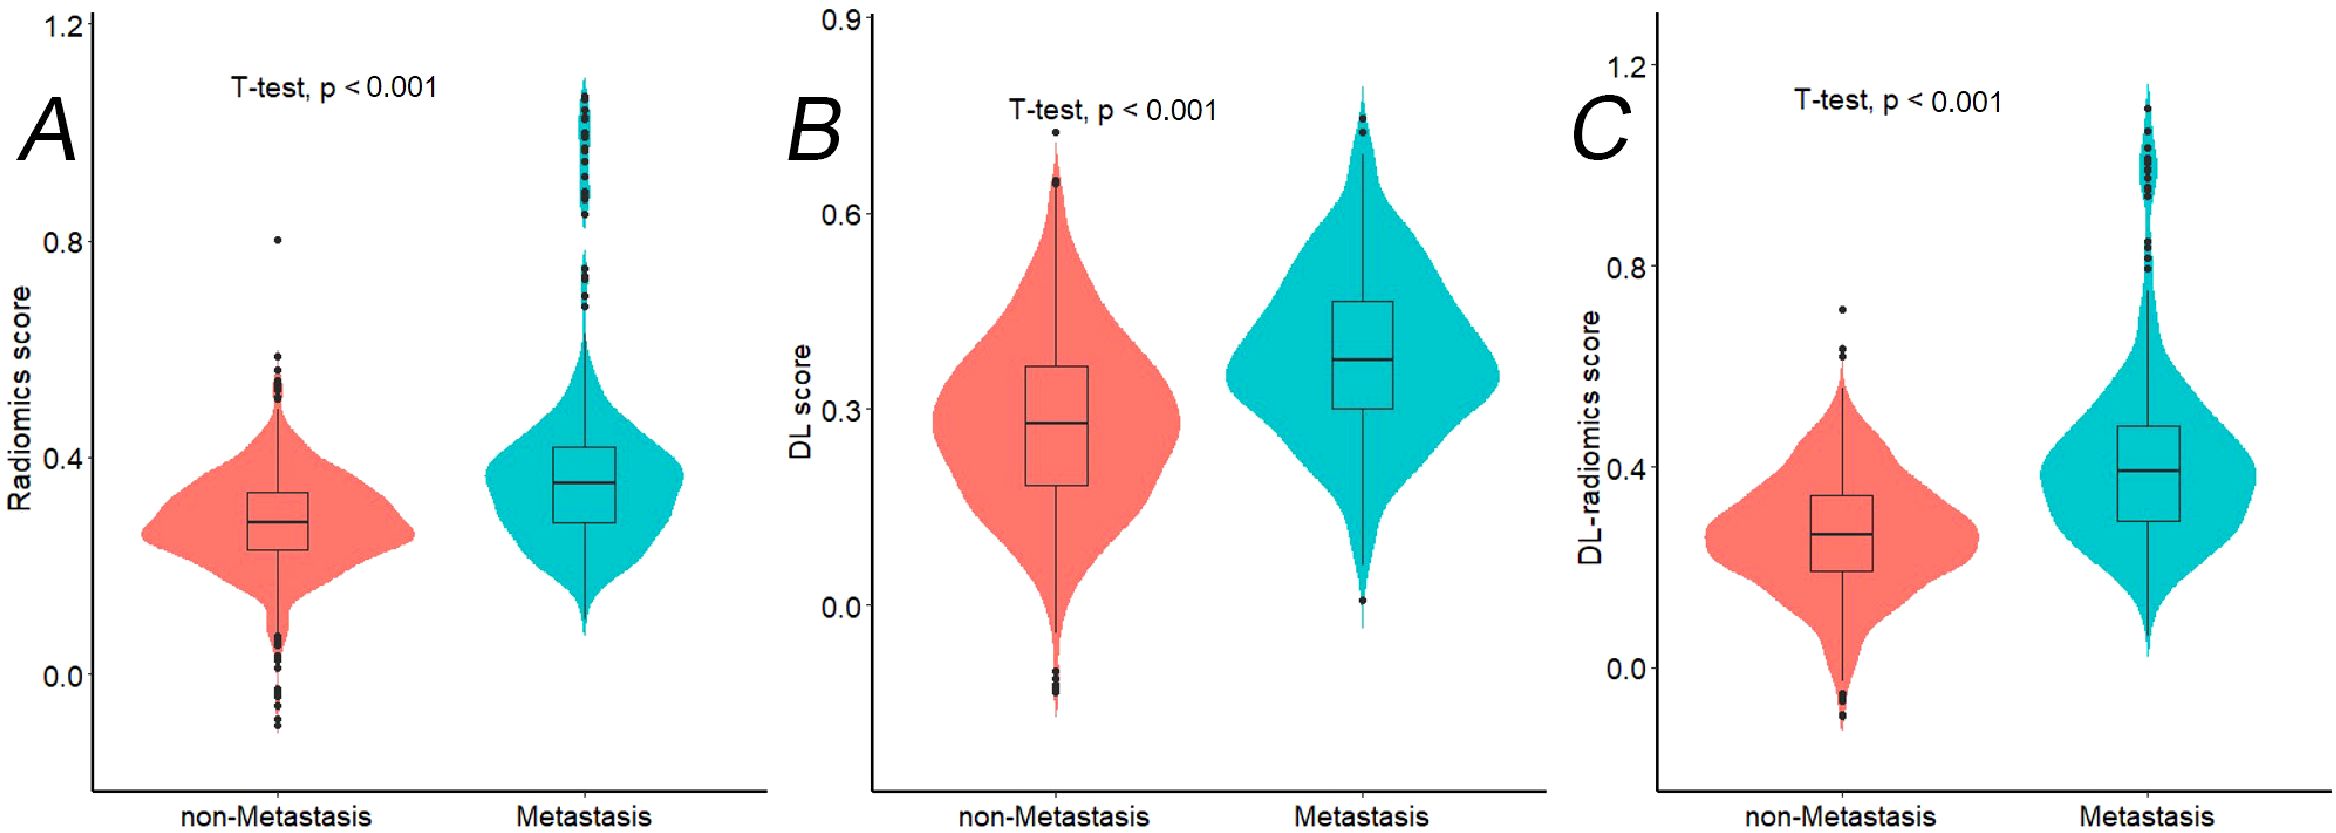
Figure 4. The violin plots showing distribution of different radiomics scores between Non-LM group and LM group in training cohort. (A) Radiomics score; (B) DL score; (C) DL-radiomics score. LM, liver metastases; DL: deep learning; LM: liver metastases.
3.3 Performance and validation of different models
We evaluated the predictive ability of scores for predicting GCLM. The results showed that in the training cohort, the AUC of the radiomics score, the DL score and the DL-radiomics score were 0.703 (95% CI, 0.669-0.737), 0.716 (95% CI, 0.683-0.75) and 0.770 (95% CI, 0.739-0.801), respectively. In the test cohort, the AUC of the three scores were 0.690 (95% CI, 0.638-0.742), 0.694 (95% CI, 0.642-0.746) and 0.748 (95% CI, 0.699-0.797), respectively. In all cohorts, the AUC of the DL-radiomics score combined with the two types of features both was significantly higher than that of the radiomics score and the DL score, the difference was statistically significant with the DeLong test (P < 0.05), indicating that it had better predictive performance (Table 2, Figure 3).
Multivariable logistic regression analysis results showed that DL-radiomics score and tumor thickness, CEA and CA199 were independent predictors of LM (Supplementary Table S3). Therefore, we combine them to construct a fused model and a fused nomogram generated based on fused model was displayed in Figure 5. Fused model showed good predictive performance in both cohorts, with AUC values greater than 0.78 [0.796 (95% CI, 0.766-0.826) in the training cohort, 0.787 (95% CI, 0.741-0.834) in the test cohort]. Compared with any other model constructed in our study, the AUC value of the fused model is the highest, which indicated that the fused model has good discrimination between the LM group and the non-LM group. The DeLong test confirmed the AUC value of the fused model was higher than that of other models (P < 0.05) except DL-radiomics score (P > 0.05), which also indicated that the model combining classical radiomics and DL features achieved better performance than any of them alone (Table 2, Figure 3). As shown in the decision curve (Figure 6), the fused model demonstrated a significant net benefit compared to other models across the relevant threshold range for the whole cohorts. Meanwhile, we observed within almost all threshold ranges, the fused model consistently outperformed both treat-all and treat-none strategies. In addition, the calibration curve showed a good calibration of the fused model, as shown in the Figure 7.
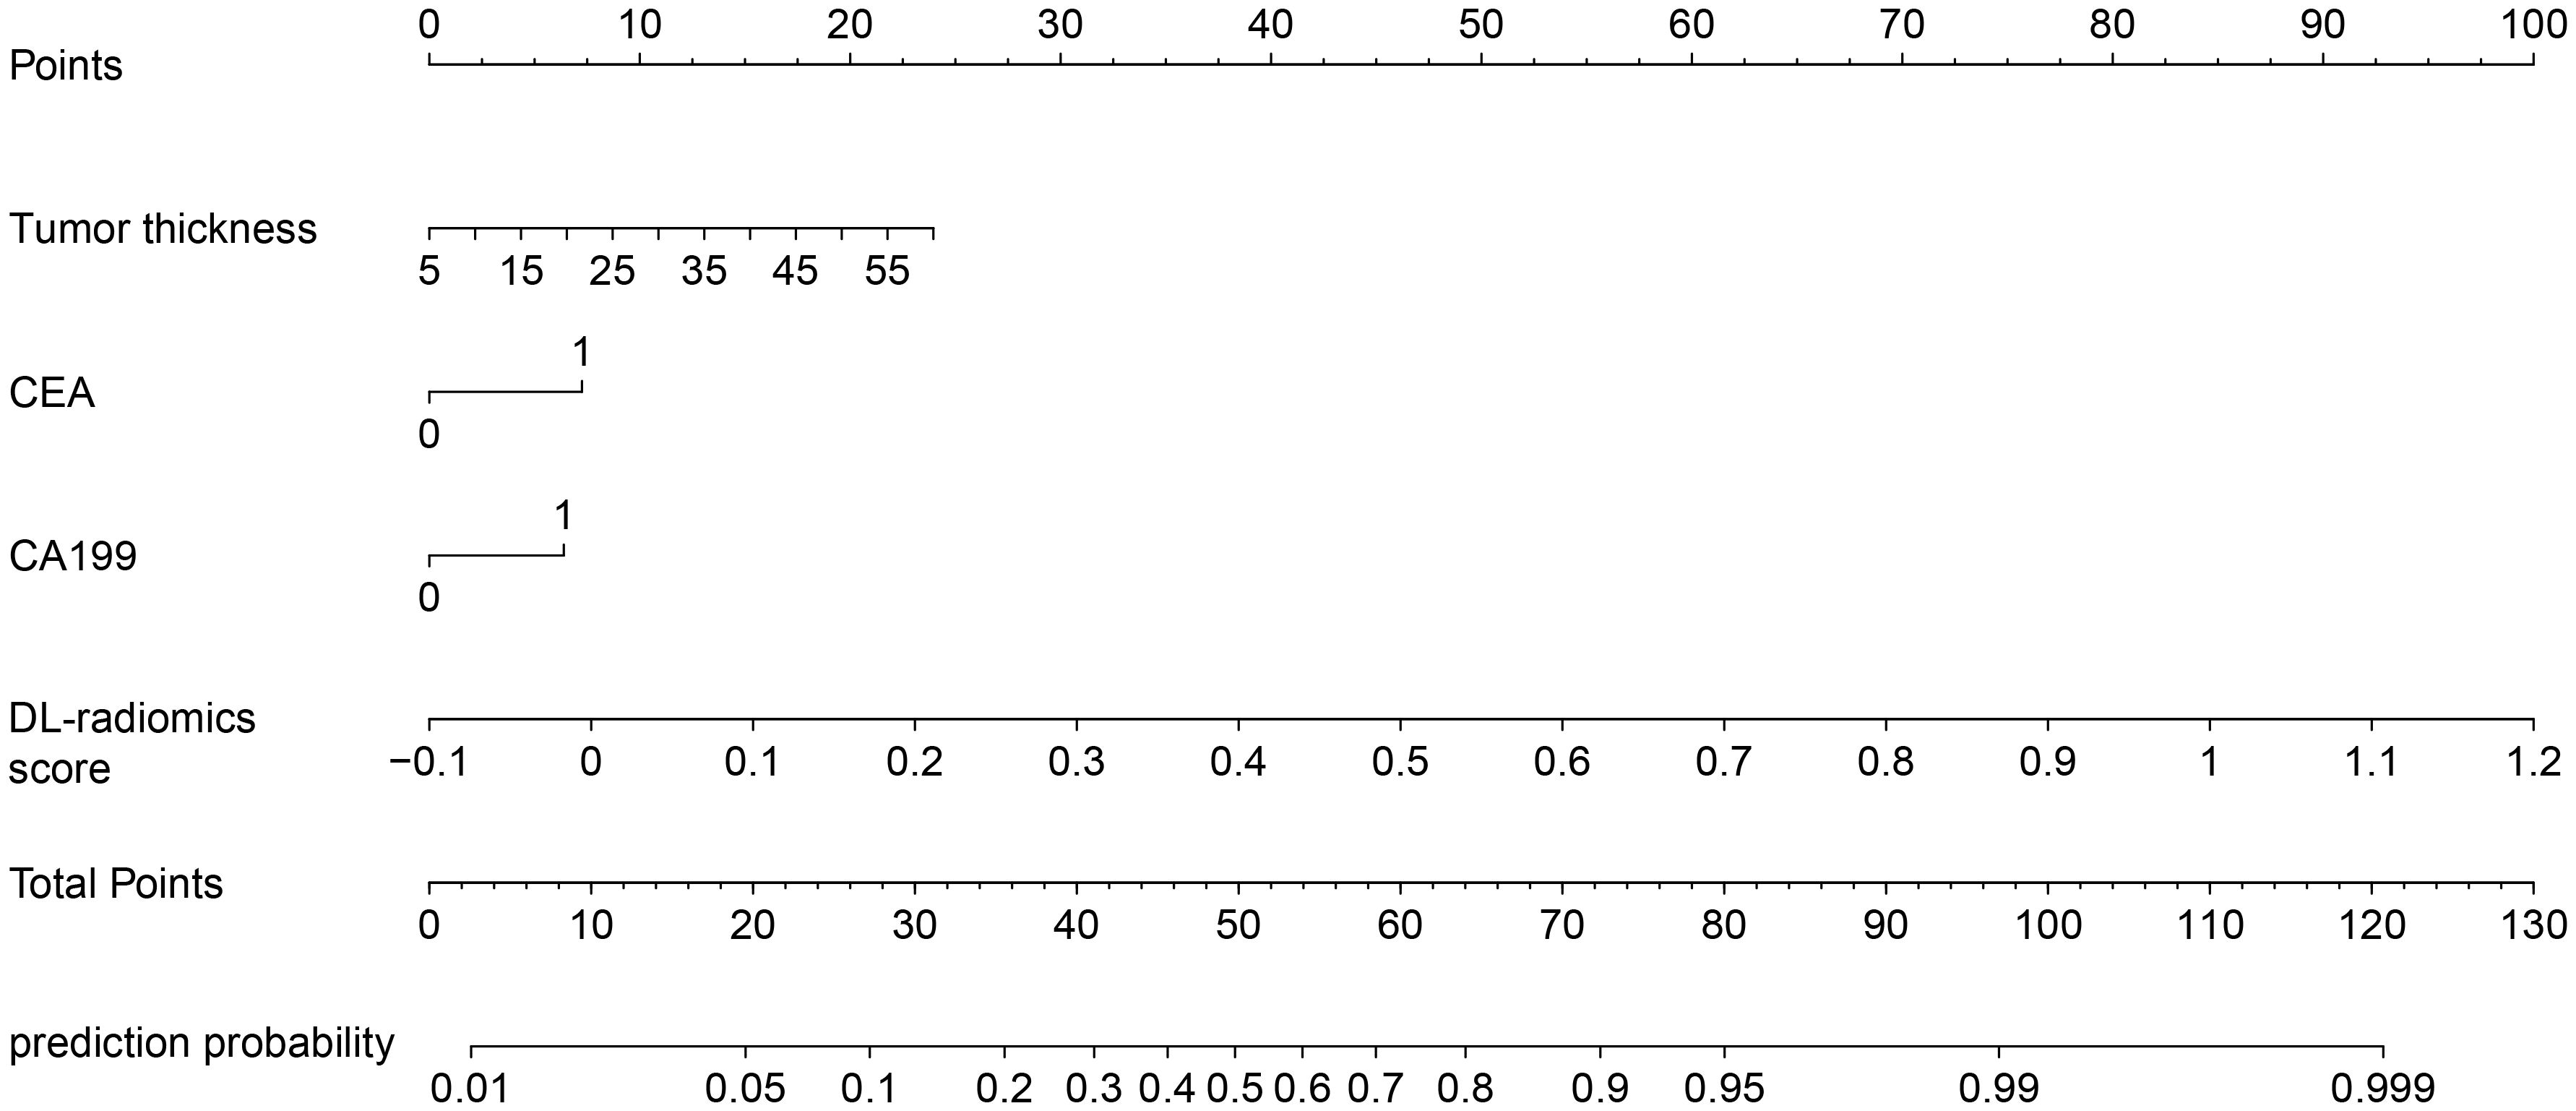
Figure 5. Fused nomogram with the DL-radiomics score and clinical factors (tumor thickness, CEA and CA199). DL, deep learning; CEA, carcinoembryonic antigen; CA199, Carbohydrate antigen199.
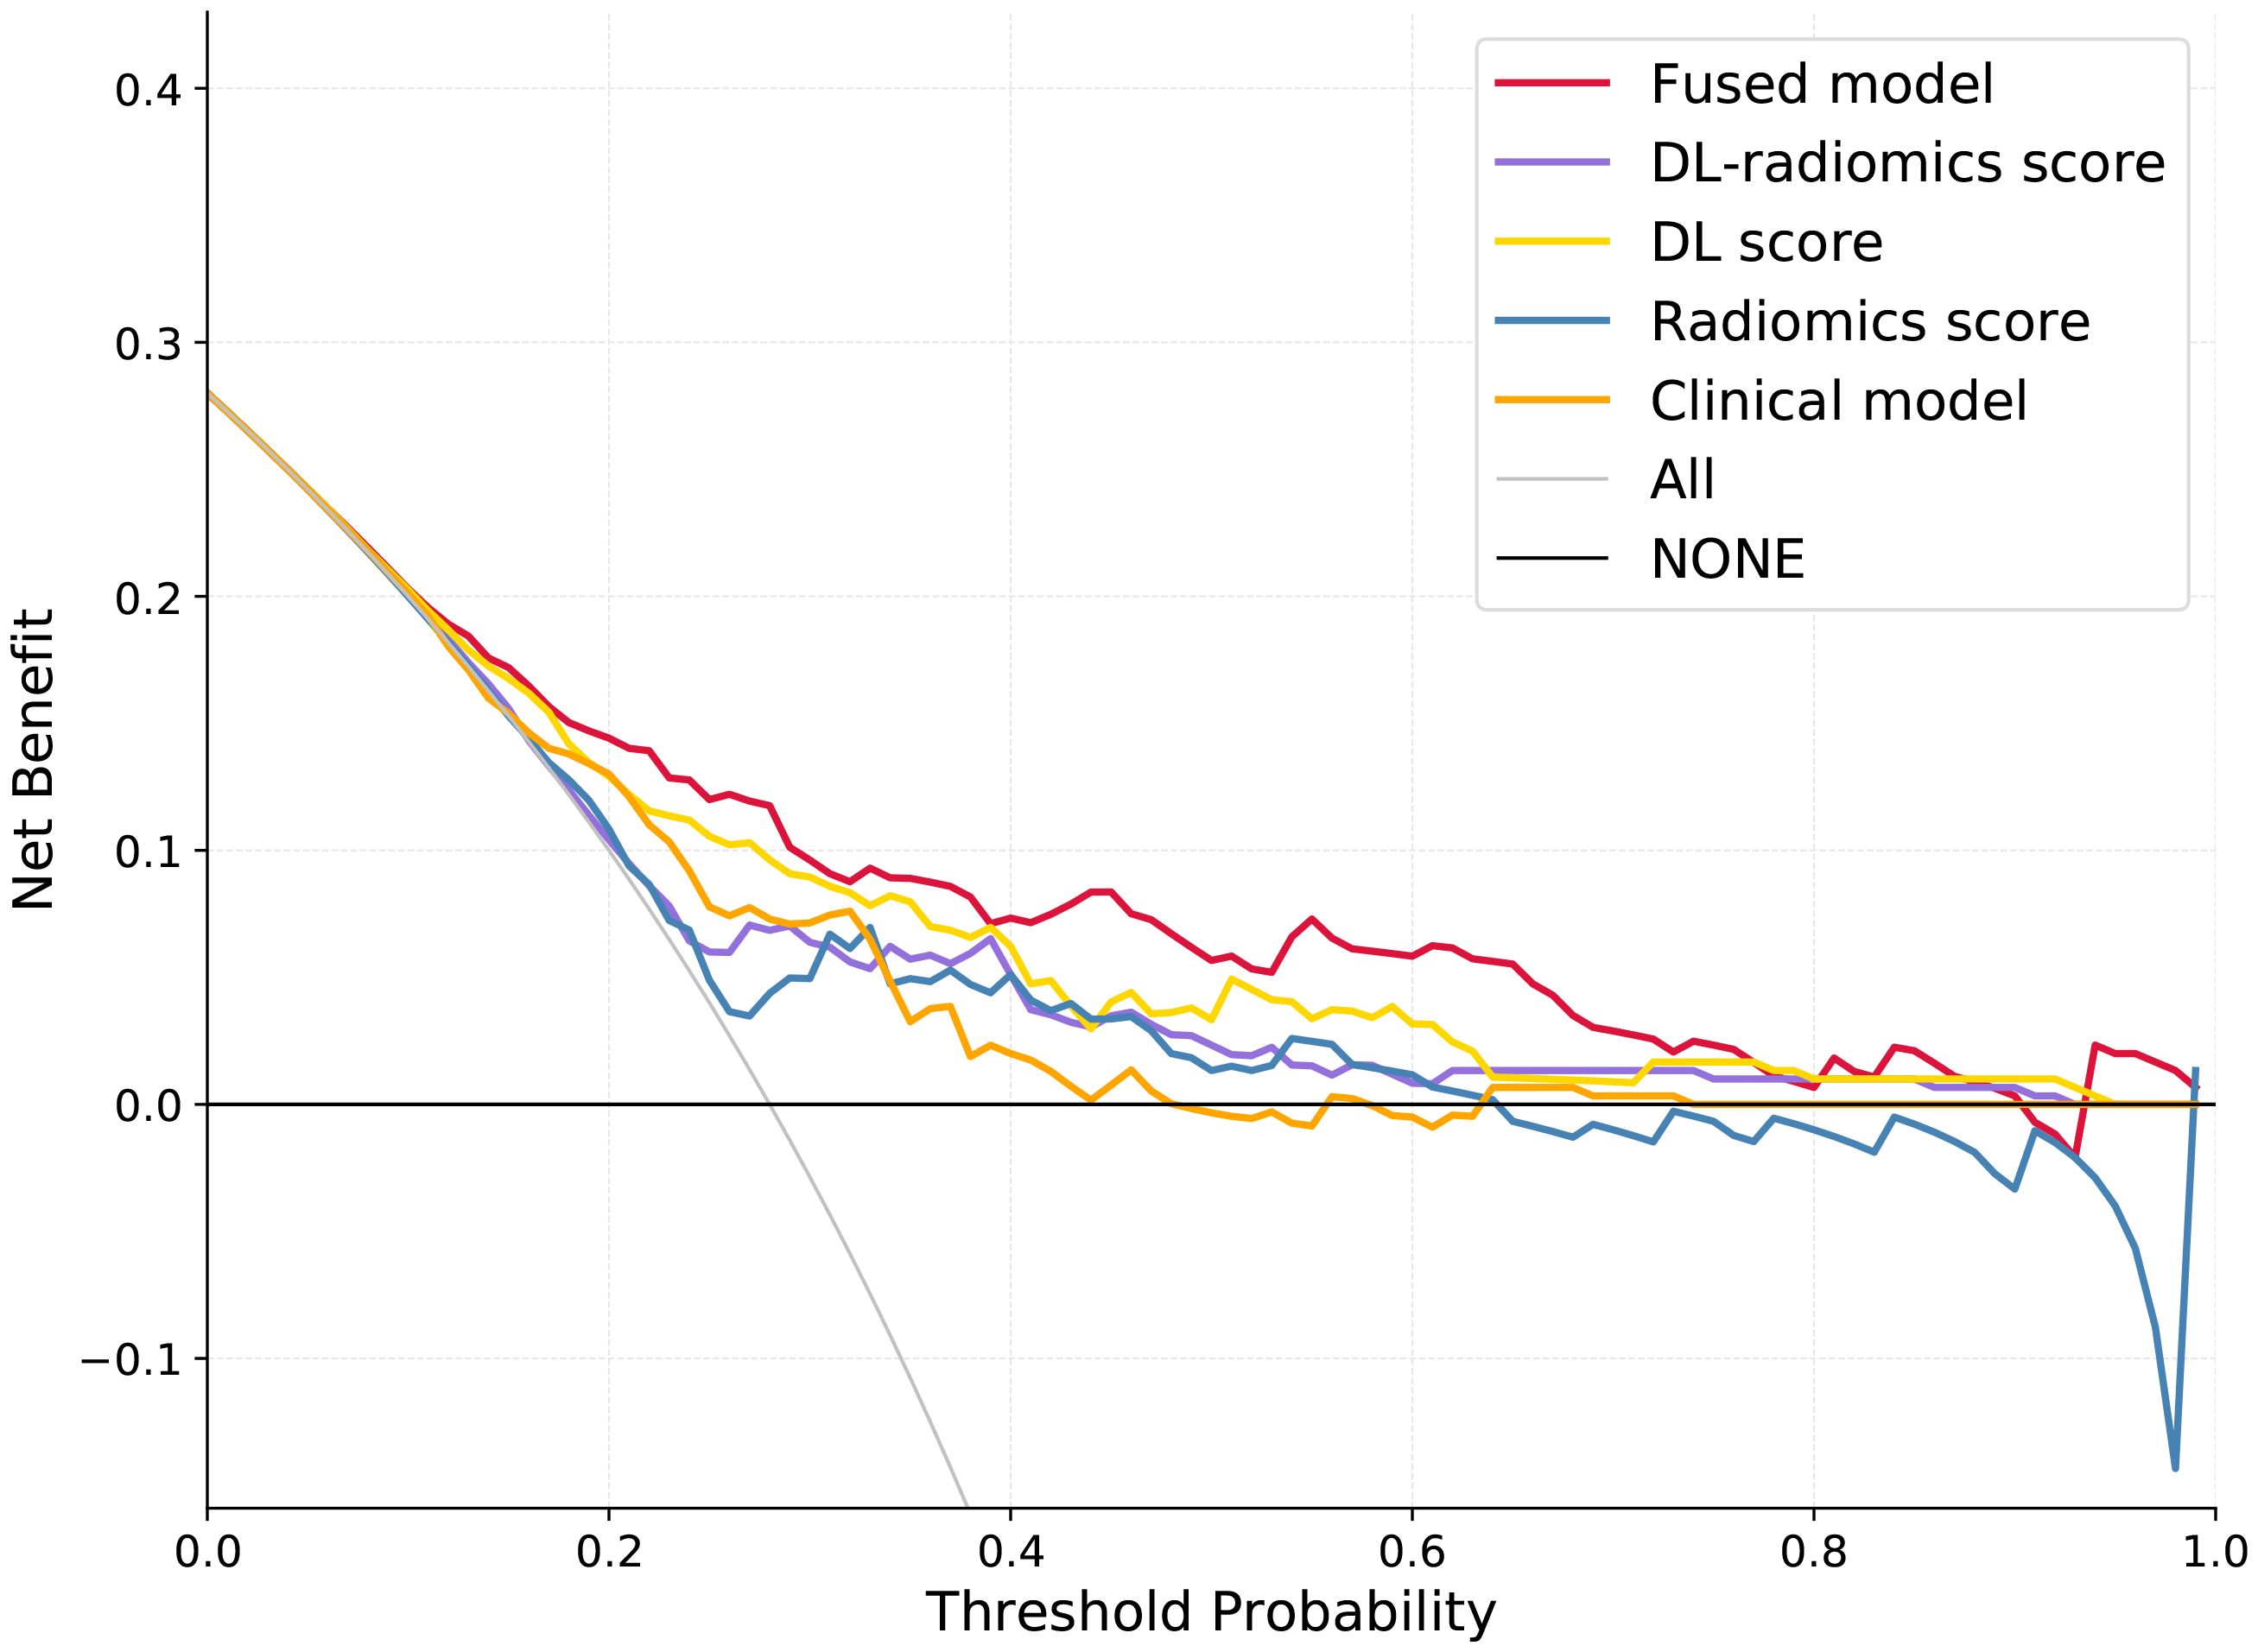
Figure 6. Decision curves analysis for different models. DL, deep learning.
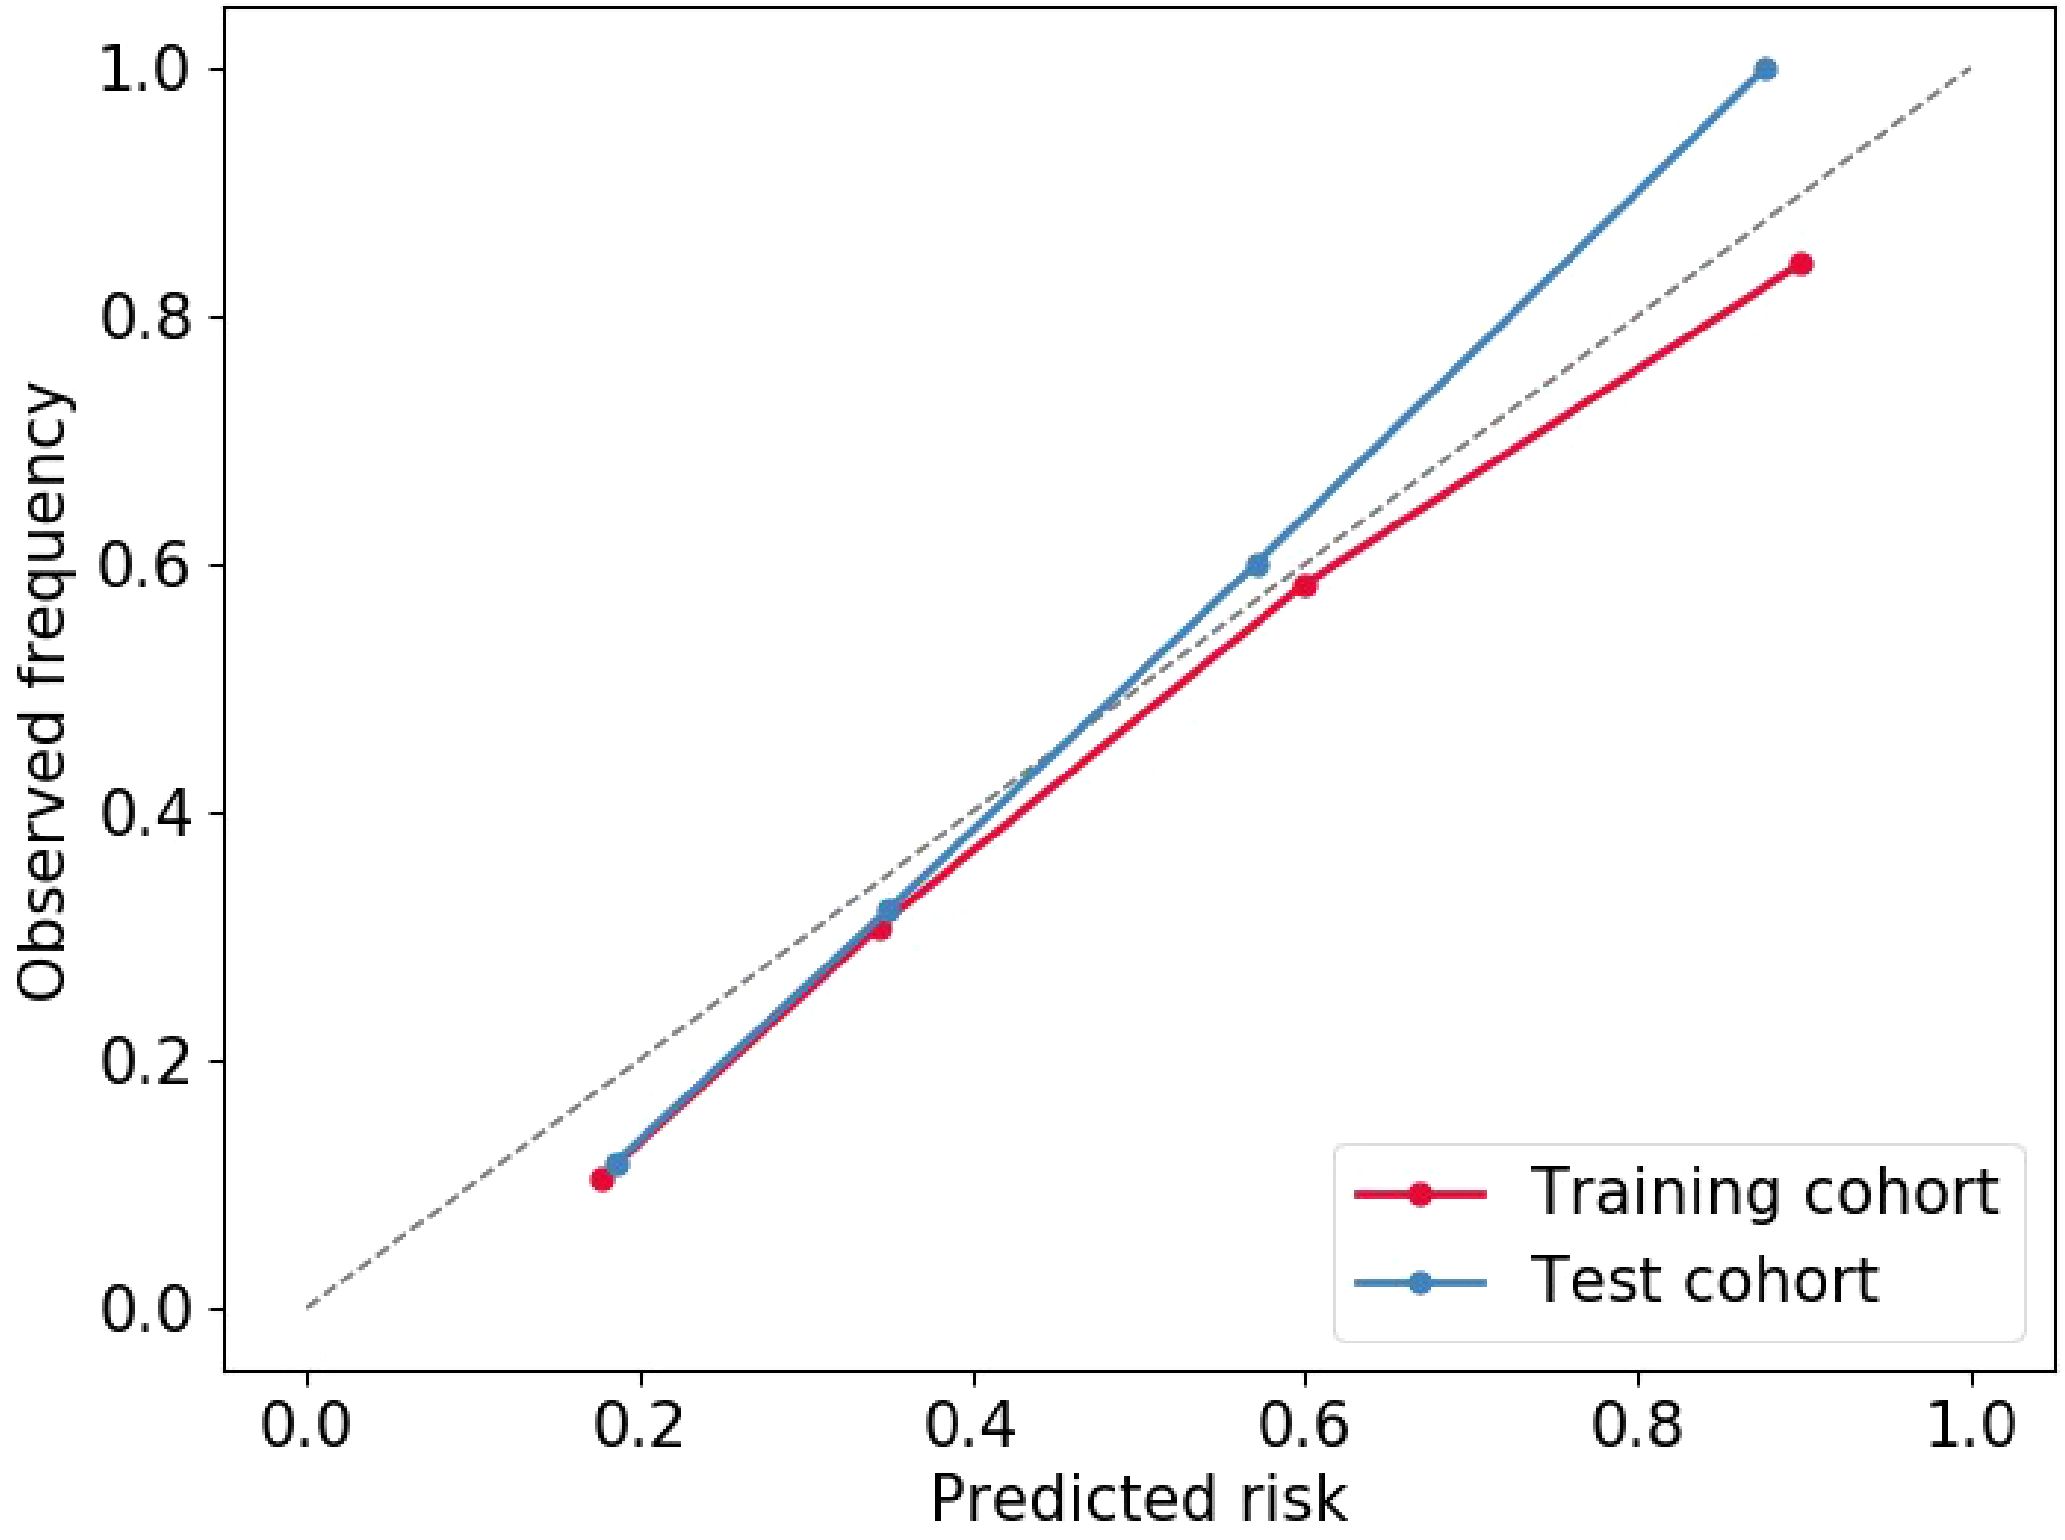
Figure 7. Calibration curve of Fused model to predict the of GCLM occurrence. GCLM, gastric cancer liver metastases.
3.4 Synchronous GCLM and metachronous GCLM
Figure 8 illustrated the distribution of DL-radiomics score between patients with synchronous GCLM and metachronous GCLM. DL-radiomics scores are higher in patients with synchronous GCLM (P < 0.05), indicating that patients with high radiomics scores were more likely to have early LM. The discriminatory capacity of the DL-radiomics score was further evaluated using ROC curves (Supplementary Figure S1), with an AUC of 0.665 (95% CI, 0.613-0.718) (Table 3), indicating a moderate ability of DL-radiomics score to differentiate between patients with synchronous GCLM and metachronous GCLM. In addition, we also evaluated the ability of other scores to distinguish patients with synchronous GCLM and metachronous GCLM. The detailed results were shown in Supplementary Table S4 and Supplementary Figure S1.
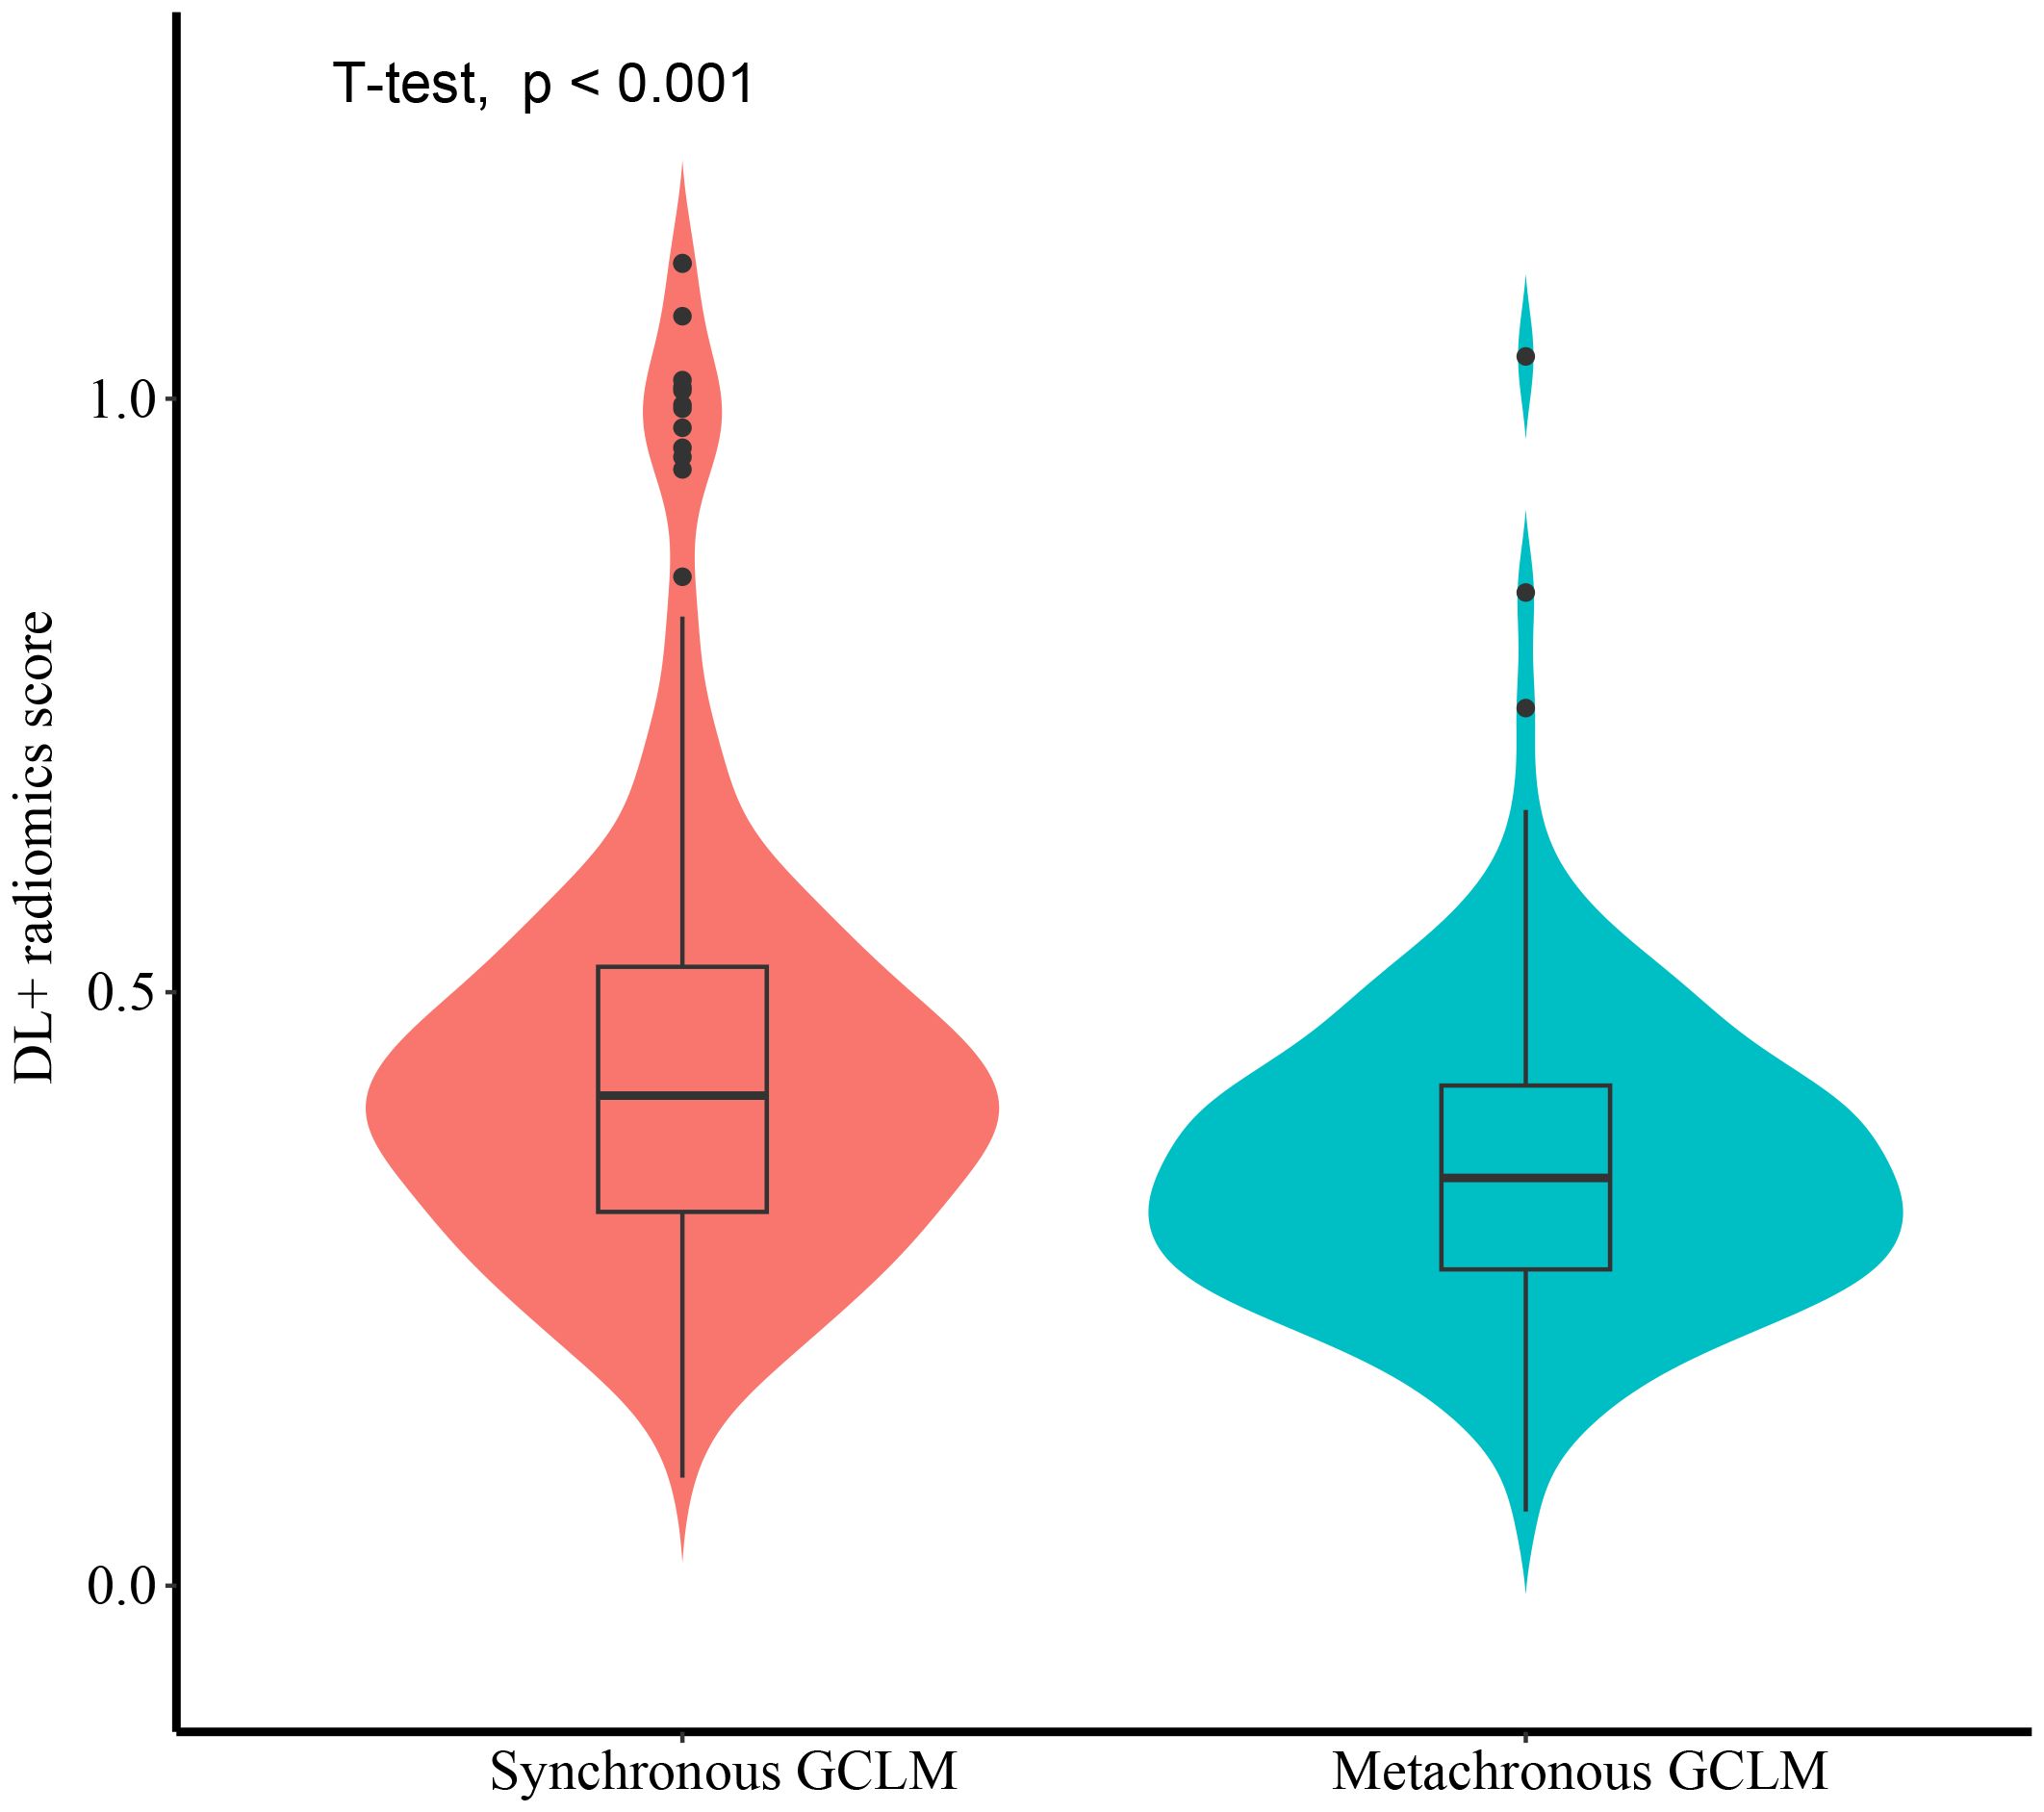
Figure 8. The violin plot illustrating the distribution of DL-Radiomics score for both synchronous GCLM and metachronous GCLM. DL, deep learning; GCLM, gastric cancer liver metastases.

Table 3. The performance of DL-radiomics score in distinguishing synchronous GCLM from metachronous GCLM.
4 Discussion
As a stage IV b disease (16), GCLM is one of the important reasons for the poor prognosis of GC. However, CT is less sensitive to detect early micro-metastases of LM and cannot predict metachronous GCLM, which may lead to treatment delay. At present, many scholars have made many attempts to predict the occurrence of GCLM. Yang et al. established and validated a model containing clinical and radiological features to predict LM after resection in patients with GC before surgery (4). Similarly, She et al. retrospectively analyzed the clinical and spectral CT data of 80 patients with GC who underwent surgical resection, and constructed a clinical indicator-spectral CT iodine concentration model to explore its value in predicting GCLM (14). Unlike them, our study integrates classical radiomics and DL features to deeply mine the deep information hidden in CT images, and combines them with patients’ clinical characteristics to establish a fused model for GCLM. This model achieved optimal predictive performance among all models constructed.
We analyzed the baseline clinical information of the two groups of patients, and found that tumor thickness, CEA level and CA199 level were independent predictors of GCLM, which was consistent with some previous related research results (5, 17–19). The occurrence of LM may be caused by the gradual progression of GC. GC progresses from the innermost mucosal layer of the stomach wall outward. As tumor thickness increases, cancer cells are more likely to detach from the gastric wall, leading to an elevated risk of LM (15, 18, 20). Serum tumor markers, such as CEA and CA19-9, serve as valuable indicators for the recurrence or metastasis of gastrointestinal cancers. The elevation of serum tumor markers may precede the detection of abnormalities by imaging examination, thereby aiding clinicians in the earlier identification of diseases or postoperative recurrences (21–23). Similarly, our study found that the abnormal proportion of CEA and CA199 in patients with GCLM was higher than that in patients non-LM, and were independent risk factors for LM.
Radiomics enables the extraction of numerous quantitative features from medical images to describe the heterogeneity, morphology and texture of tumors (24). These features can be used to predict the biological behavior of tumors (25), treatment response (26, 27) and prognosis of patients (28, 29). In our study, image-based features were computed with classical radiomics and DL, respectively, which were then utilized to construct three scores: radiomics score, DL score and DL-radiomics score. Each score demonstrated a certain predictive capacity for GCLM [AUC of radiomics score: 0.690 (95% CI, 0.638-0.742); AUC of DL score: 0.694 (95% CI, 0.642-0.746) and AUC of DL-radiomics score: 0.748 (95% CI, 0.699-0.797)]. Among them, the performance of the DL score is comparable to that of the radiomics score, and DL does not show its advantages (P > 0.05). However, the DL-radiomics score performs best among them (P < 0.05), likely due to its combination of low-level (classical radiomics) and high-level (DL) image abstractions for capturing texture patterns (30, 31). Previous studies have similarly confirmed that model trained with multiple types of features exhibit superior performance than any of them alone (32–34).
To improve the predictive performance of CT-based radiomics for GCLM, multivariable logistic regression was used to create a fused model by combining DL-radiomics score and significant clinical factors. Its AUC value was significantly higher than that of all other models (P < 0.05) except the DL-radiomics score (P > 0.05) [0.796 (95% CI, 0.766-0.826) in the training cohort, 0.787 (95% CI, 0.741-0.834) in the test cohort]. However, it provided a largest clinical net benefit over the relevant threshold range than any other model, indicating that it can make better predictions in various situations. Other models perform well under certain thresholds, but are not as stable as the fused model. At the same time, within a wide range of threshold probability, the fused model consistently outperformed both treat-all and treat-none strategies, suggesting its robustness in balancing overtreatment risks and missed diagnoses. These all substantiated the high predictive accuracy and wide applicability of the fused model, while also demonstrating that the comprehensive inclusion of meaningful features can enhance the model’s ability to learn from a broader dataset, thereby improving its precision, robustness, and generalizability. The calibration curve confirms that the GCLM positive probability value predicted by the fused model is in good agreement with the actual probability value, avoiding the risk of model overfitting (35). Then, we visualized the fused model into a nomogram, which serves as an intuitive tool that provides personalized risk assessments in the form of scores, based on specific clinical factors and imaging data of patients (36). This aids clinician determining the likelihood of LM, enabling early identification of high-risk patients and thereby facilitating the formulation of more appropriate treatment plans.
Furthermore, we validated that DL-radiomics score can be employed to distinguish between patients with synchronous and metachronous GCLM. A number of studies have shown that the overall survival of patients with synchronous GCLM is worse than that of patients with metachronous GCLM (3). In the field of CCLM, many scholars have made studies to prove the difference between the synchronous and metachronous CCLM. They believed that the pathological differences between the two led to the treatment effect and prognosis of synchronous CCLM are worse than those of metachronous CCLM, and synchronous CCLM may be a more invasive disease (37, 38). Therefore, the management of synchronous and asynchronous CCLM needs to be personalized to meet the needs of each patient and achieve better therapeutic effect. Similarly, our results showed that DL-radiomics score has moderate ability to distinguish synchronous GCLM and metachronous GCLM patients. This finding suggests that there are differences between the two types of metastasis at the imaging phenotype level, and its potential biological heterogeneity may result in different overall survival rates.
There are still some limitations in our research. First of all, this is a single-center retrospective study, and no external validation has been established. The limitations of sample sources may affect the representativeness of the model results. Secondly, CT images come from different devices, which may have some minor effects on the results. Finally, our model was only based on CT images in the venous phase, and images in the plain and arterial phases were not included in the study.
5 Conclusion
In summary, we developed a CT-based fused model achieved better predictive performance and stability than models based only on clinical factors or one type of radiomics features. The results of model can predict the risk of LM in GC patients. At the same time, the DL-radiomics score combining classical radiomics features and DL features also showed moderate ability to distinguish synchronous GCLM and metachronous GCLM, which provided a reference for personalized follow-up and timely treatment of patients.
Data availability statement
The original contributions presented in the study are included in the article/Supplementary Material. Further inquiries can be directed to the corresponding author.
Ethics statement
The studies involving humans were approved by The Institutional Review Board of the First Affiliated Hospital of Zhengzhou University. The studies were conducted in accordance with the local legislation and institutional requirements. As our study is retrospective, the ethics committee/institutional review board waived the requirement for written informed consent from participants or their legal guardians/next of kin.
Author contributions
YG: Validation, Conceptualization, Writing – original draft, Visualization, Investigation, Data curation. HY: Formal Analysis, Validation, Methodology, Writing – original draft. HZ: Data curation, Writing – review & editing, Investigation. PL: Resources, Writing – review & editing, Conceptualization. JG: Writing – review & editing, Funding acquisition. MC: Conceptualization, Funding acquisition, Project administration, Writing – review & editing, Formal Analysis, Software.
Funding
The author(s) declare that financial support was received for the research and/or publication of this article. This work was supported by the Key Research Projects of Higher Education Institutions in Henan Province (No. 25A520031), the Key Project of Science and Technology Research of Henan Province (No. 222102210112), the National Natural and Science Fund of China (No. 82472069).
Conflict of interest
The authors declare that the research was conducted in the absence of any commercial or financial relationships that could be construed as a potential conflict of interest.
Generative AI statement
The author(s) declare that no Generative AI was used in the creation of this manuscript.
Publisher’s note
All claims expressed in this article are solely those of the authors and do not necessarily represent those of their affiliated organizations, or those of the publisher, the editors and the reviewers. Any product that may be evaluated in this article, or claim that may be made by its manufacturer, is not guaranteed or endorsed by the publisher.
Supplementary material
The Supplementary Material for this article can be found online at: https://www.frontiersin.org/articles/10.3389/fonc.2025.1613972/full#supplementary-material
References
1. Bray F, Laversanne M, Sung H, Ferlay J, Siegel RL, Soerjomataram I, et al. Global cancer statistics 2022: GLOBOCAN estimates of incidence and mortality worldwide for 36 cancers in 185 countries. CA Cancer J Clin. (2024) 74:229–63. doi: 10.3322/caac.21834
2. Wang C, Zhang Y, Zhang Y, and Li B. A bibliometric analysis of gastric cancer liver metastases: advances in mechanisms of occurrence and treatment options. Int J Surg. (2024) 110:2288–99. doi: 10.1097/js9.0000000000001068
3. Conde Monroy D, Ibañez-Pinilla M, Sabogal JC, Rey Chaves C, Isaza-Restrepo A, Girón F, et al. Survival outcomes of hepatectomy in gastric cancer liver metastasis: A systematic review and meta-analysis. J Clin Med. (2023) 12(2):704. doi: 10.3390/jcm12020704
4. Yang H, Sun J, Liu H, Liu X, She Y, Zhang W, et al. Clinico-radiological nomogram for preoperatively predicting post-resection hepatic metastasis in patients with gastric adenocarcinoma. Br J Radiol. (2022) 95:20220488. doi: 10.1259/bjr.20220488
5. Tsurumaru D, Nishimuta Y, Muraki T, Asayama Y, Nishie A, Oki E, et al. Gastric cancer with synchronous and metachronous hepatic metastasis predicted by enhancement pattern on multiphasic contrast-enhanced CT. Eur J Radiol. (2018) 108:165–71. doi: 10.1016/j.ejrad.2018.09.030
6. Scapicchio C, Gabelloni M, Barucci A, Cioni D, Saba L, and Neri E. A deep look into radiomics. Radiol Med. (2021) 126:1296–311. doi: 10.1007/s11547-021-01389-x
7. Li M, Li X, Guo Y, Miao Z, Liu X, Guo S, et al. Development and assessment of an individualized nomogram to predict colorectal cancer liver metastases. Quant Imaging Med Surg. (2020) 10:397–414. doi: 10.21037/qims.2019.12.16
8. Seow-En I, Koh YX, Zhao Y, Ang BH, Tan IE, Chok AY, et al. Predictive modeling algorithms for liver metastasis in colorectal cancer: A systematic review of the current literature. Ann Hepatobiliary Pancreat Surg. (2004) 28(1):14–24. doi: 10.14701/ahbps.23-078
9. Li ZF, Kang LQ, Liu FH, Zhao M, Guo SY, Lu S, et al. Radiomics based on preoperative rectal cancer MRI to predict the metachronous liver metastasis. Abdom Radiol (NY). (2023) 48:833–43. doi: 10.1007/s00261-022-03773-1
10. Taghavi M, Trebeschi S, Simões R, Meek DB, Beckers RCJ, Lambregts DMJ, et al. Machine learning-based analysis of CT radiomics model for prediction of colorectal metachronous liver metastases. Abdom Radiol (NY). (2021) 46:249–56. doi: 10.1007/s00261-020-02624-1
11. Chen X, Wang X, Zhang K, Fung KM, Thai TC, Moore K, et al. Recent advances and clinical applications of deep learning in medical image analysis. Med Image Anal. (2022) 79:102444. doi: 10.1016/j.media.2022.102444
12. Berbís MA, Aneiros-Fernández J, Mendoza Olivares FJ, Nava E, and Luna A. Role of artificial intelligence in multidisciplinary imaging diagnosis of gastrointestinal diseases. World J Gastroenterol. (2021) 27:4395–412. doi: 10.3748/wjg.v27.i27.4395
13. Zhang AQ, Zhao HP, Li F, Liang P, Gao JB, and Cheng M. Computed tomography-based deep-learning prediction of lymph node metastasis risk in locally advanced gastric cancer. Front Oncol. (2022) 12:969707. doi: 10.3389/fonc.2022.969707
14. She Y, Liu X, Liu H, Yang H, Zhang W, Han Y, et al. Combination of clinical and spectral-CT iodine concentration for predicting liver metastasis in gastric cancer: a preliminary study. Abdom Radiol (NY). (2024) 49(10):3438–49. doi: 10.1007/s00261-024-04346-0
15. Song JC, Ding XL, Zhang Y, Zhang X, and Sun XH. Prospective and prognostic factors for hepatic metastasis of gastric carcinoma: A retrospective analysis. J Cancer Res Ther. (2019) 15:298–304. doi: 10.4103/jcrt.JCRT_576_17
16. Ajani JA, D’Amico TA, Bentrem DJ, Chao J, Cooke D, Corvera C, et al. Gastric cancer, version 2.2022, NCCN clinical practice guidelines in oncology. J Natl Compr Canc Netw. (2022) 20:167–92. doi: 10.6004/jnccn.2022.0008
17. Tian H, Liu Z, Liu J, Zong Z, Chen Y, Zhang Z, et al. Application of machine learning algorithm in predicting distant metastasis of T1 gastric cancer. Sci Rep. (2023) 13(1):5741. doi: 10.1038/s41598-023-31880-6
18. Talebi A, Celis-Morales CA, Borumandnia N, Abbasi S, Pourhoseingholi MA, Akbari A, et al. Predicting metastasis in gastric cancer patients: machine learning-based approaches. Sci Rep. (2023) 13:4163. doi: 10.1038/s41598-023-31272-w
19. Yu H, Jiang H, Lu X, Bai C, Song P, Sun F, et al. Analysis of risk factors for liver metastasis in patients with gastric cancer and construction of prediction model: A multicenter study. Discov Oncol. (2024) 15:363. doi: 10.1007/s12672-024-01246-z
20. Zhou C, Wang Y, Ji MH, Tong J, Yang JJ, and Xia H. Predicting peritoneal metastasis of gastric cancer patients based on machine learning. Cancer Control. (2020) 27:1073274820968900. doi: 10.1177/1073274820968900
21. Wang R, Xu B, Sun M, Pang X, Wang X, Zhu J, et al. Dynamic monitoring of serum CEA and CA19–9 predicts the prognosis of postoperative stage II colon cancer. Eur J Surg Oncol. (2023) 49:107138. doi: 10.1016/j.ejso.2023.107138
22. Rao H, Wu H, Huang Q, Yu Z, and Zhong Z. Clinical value of serum CEA, CA24–2 and CA19–9 in patients with colorectal cancer. Clin Lab. (2021) 67(42):1079–89. doi: 10.7754/Clin.Lab.2020.200828
23. Liu HN, Yao C, Wang XF, Zhang NP, Chen YJ, Pan D, et al. Diagnostic and economic value of carcinoembryonic antigen, carbohydrate antigen 19-9, and carbohydrate antigen 72–4 in gastrointestinal cancers. World J Gastroenterol. (2023) 29:706–30. doi: 10.3748/wjg.v29.i4.706
24. Cheng M, Zhang H, Huang W, Li F, and Gao J. Deep learning radiomics analysis of CT imaging for differentiating between Crohn’s disease and intestinal tuberculosis. J Imaging Inform Med. (2024) 37:1516–28. doi: 10.1007/s10278-024-01059-0
25. Sohn JH and Fields BKK. Radiomics and deep learning to predict pulmonary nodule metastasis at CT. Radiology. (2024) 311:e233356. doi: 10.1148/radiol.233356
26. Shen LL, Zheng HL, Ding FH, Lu J, Chen QY, Xu BB, et al. Delta computed tomography radiomics features-based nomogram predicts long-term efficacy after neoadjuvant chemotherapy in advanced gastric cancer. Radiol Med. (2023) 128:402–14. doi: 10.1007/s11547-023-01617-6
27. Zhong H, Wang T, Hou M, Liu X, Tian Y, Cao S, et al. Deep learning radiomics nomogram based on enhanced CT to predict the response of metastatic lymph nodes to neoadjuvant chemotherapy in locally advanced gastric cancer. Ann Surg Oncol. (2024) 31:421–32. doi: 10.1245/s10434-023-14424-0
28. Hu C, Chen W, Li F, Zhang Y, Yu P, Yang L, et al. Deep learning radio-clinical signatures for predicting neoadjuvant chemotherapy response and prognosis from pretreatment CT images of locally advanced gastric cancer patients. Int J Surg. (2023) 109:1980–92. doi: 10.1097/js9.0000000000000432
29. Yang Z, Han Y, Li F, Zhang A, Cheng M, and Gao J. Deep learning radiomics analysis based on computed tomography for survival prediction in gastric neuroendocrine neoplasm: a multicenter study. Quant Imaging Med Surg. (2023) 13:8190–203. doi: 10.21037/qims-23-577
30. Magnuska ZA, Roy R, Palmowski M, Kohlen M, Winkler BS, Pfeil T, et al. Combining radiomics and autoencoders to distinguish benign and Malignant breast tumors on US images. Radiology. (2024) 312:e232554. doi: 10.1148/radiol.232554
31. Lafata KJ, Wang Y, Konkel B, Yin FF, and Bashir MR. Radiomics: a primer on high-throughput image phenotyping. Abdom Radiol (NY). (2022) 47:2986–3002. doi: 10.1007/s00261-021-03254-x
32. Cui Y, Zhang J, Li Z, Wei K, Lei Y, Ren J, et al. A CT-based deep learning radiomics nomogram for predicting the response to neoadjuvant chemotherapy in patients with locally advanced gastric cancer: A multicenter cohort study. EClinicalMedicine. (2022) 46:101348. doi: 10.1016/j.eclinm.2022.101348
33. Zhang Y, Wu C, Xiao Z, Lv F, and Liu Y. A deep learning radiomics nomogram to predict response to neoadjuvant chemotherapy for locally advanced cervical cancer: A two-center study. Diagnostics (Basel). (2023) 13(6):1073. doi: 10.3390/diagnostics13061073
34. Jiang M, Li CL, Luo XM, Chuan ZR, Lv WZ, Li X, et al. Ultrasound-based deep learning radiomics in the assessment of pathological complete response to neoadjuvant chemotherapy in locally advanced breast cancer. Eur J Cancer. (2021) 147:95–105. doi: 10.1016/j.ejca.2021.01.028
35. Huang Y, Li W, Macheret F, Gabriel RA, and Ohno-MaChado L. A tutorial on calibration measurements and calibration models for clinical prediction models. J Am Med Inform Assoc. (2020) 27:621–33. doi: 10.1093/jamia/ocz228
36. Park SY. Nomogram: An analogue tool to deliver digital knowledge. J Thorac Cardiovasc Surg. (2018) 155:1793. doi: 10.1016/j.jtcvs.2017.12.107
37. Garajova I, Balsano R, Tommasi C, Dalla Valle R, Pedrazzi G, Ravaioli M, et al. Synchronous and metachronous colorectal liver metastases: impact of primary tumor location on patterns of recurrence and survival after hepatic resection. Acta Biomed. (2020) 92:e2021061. doi: 10.23750/abm.v92i1.11050
Keywords: deep learning, radiomics nomogram, gastric cancer, liver metastasis, computed tomography
Citation: Guo Y, Yin H, Zhang H, Liang P, Gao J and Cheng M (2025) Combining radiomics and deep learning to predict liver metastasis of gastric cancer on CT image. Front. Oncol. 15:1613972. doi: 10.3389/fonc.2025.1613972
Received: 18 April 2025; Accepted: 03 June 2025;
Published: 24 June 2025.
Edited by:
Xiaofei Hu, Army Medical University, ChinaReviewed by:
Jiaojiao Zhou, Sichuan University, ChinaHuiping Zhao, Shaanxi Provincial People’s Hospital, China
Copyright © 2025 Guo, Yin, Zhang, Liang, Gao and Cheng. This is an open-access article distributed under the terms of the Creative Commons Attribution License (CC BY). The use, distribution or reproduction in other forums is permitted, provided the original author(s) and the copyright owner(s) are credited and that the original publication in this journal is cited, in accordance with accepted academic practice. No use, distribution or reproduction is permitted which does not comply with these terms.
*Correspondence: Ming Cheng, ZmNjY2hlbmdtQHp6dS5lZHUuY24=
†These authors have contributed equally to this work and share first authorship