 Hao-Yu Liang1,2†
 Chuan-ping Gao1†Meng Zhang1Shi-Feng Yang3Feng Hou4
 Li-Sha Duan5Yong-Hua Huang6
 Chen-Cui Huang7
 Jing-Xu Xu7
 Da-Peng Hao1*
 He-Xiang Wang1*
- 1Department of Radiology, The Affiliated Hospital of Qingdao University, Qingdao, China
- 2Department of Radiology and Institute of Medical Functional and Molecular Imaging, Huashan Hospital, Fudan University, Shanghai, China
- 3Department of Radiology, Shandong Provincial Hospital Affiliated to Shandong First Medical University, Jinan, China
- 4Department of Pathology, The Affiliated Hospital of Qingdao University, Qingdao, China
- 5Department of Radiology, The Third Hospital of Hebei Medical University, Shijiazhuang, China
- 6Department of Radiology, The Puyang Oilfield General Hospital, Puyang, Henan, China
- 7Department of Research Collaboration, Research and Development (R&D) center, Beijing Deepwise & League of Philosophy Doctor (PHD)Technology Co., Ltd, Beijing, China
Objective: To establish and validate a radiomics nomogram that incorporated tumor habitat and peritumor features to predict tumor progression in patients with soft tissue sarcoma (STS).
Methods: MRI data (fat-suppressed T2-weighted and contrast-enhanced fat-suppressed T1-weighted images) from 148 STS patients treated in four institutions were retrospectively enrolled. Patients were divided into a training cohort (n = 108) and validation cohort (n = 40). K-means clustering was applied to split intratumoral voxels into three habitats according to signal intensity values. A large number of radiomics features were extracted from numerous tumor-associated regions (tumor lesion, peritumor, tumor expansion, and intratumoral habitats) to construct a series of radiomics signatures. A nomogram integrating clinical predictors and radiomics signature was established and its value for predicting progression was validated.
Results: The nomogram yielded superior prediction performance and less predictive error in the validation cohort (C-index, 0.777; median area under the receiver operating characteristic curve, 0.808; integrated Brier score, 0.135). When patients were stratified according to risk of progression (low and high) based on the nomogram in both the training and validation cohorts, Kaplan–Meier survival analysis demonstrated significant differences in progression-free survival between the groups. In addition, it could attach incremental value to histopathological grade system in progression risk evaluation.
Conclusion: A nomogram based on intratumoral habitat and peritumor radiomics predicts tumor progression in STS patients and stratifies them according to risk of progression.
Introduction
Soft tissue sarcomas (STSs) are histologically heterogeneous and account for less than 1% of all malignant tumors (1). Radical resection is the standard treatment for patient with localized disease. Even after resection, the prognosis is poor, as reported recurrence rates range from 33% to 50% (2, 3) and the rate of distant metastasis is approximately 46% (4). Early identification of patients with a high risk of recurrence or metastasis after surgical resection to enable optimal use of standard or intensified neoadjuvant chemoradiotherapy might improve outcomes. This would require formulation of an accurate model for risk stratification in STS patients.
Despite their limitations, the TNM, Fédération Nationale des Centres de Lutte Contre Le Cancer (FNCLCC), and National Cancer Institute (NCI) staging systems are commonly used to guide STS prognostication and treatment (5). Several statistical models based on clinical and pathological data have been constructed and examined in previous studies to predict outcomes in STS patients (5–7). However, these models were based on low-dimensional clinical information and overlooked massive high-dimensional imaging characteristics. Therefore, their performance and generalized applicability are controversial (5, 8).
Radiomics extracts more detailed imaging features than traditional visual interpretation and can provide more data for clinical decision making (9). Radiomics-based models constructed using carefully screened features have the potential to predict STS outcomes (8, 10–13). In previous studies, radiomics data of tumor regions were analyzed as a whole and neglected intratumoral subregions (tumor habitats) with similar radiological phenotypes (14). Aggressive habitats might be crucial for tumor prognosis determination (14, 15). Several studies have demonstrated that tumor habitat analysis has high value in predicting tumor outcomes, both alone (16, 17) and in combination with radiomics analysis (18). Previous studies mainly concentrated on evaluation of the primary tumor and overlooked subtle changes in the peritumoral microenvironment (19, 20). However, the peritumoral microenvironment can explain aggressive biological behavior (21). Therefore, both tumor habitat and peritumoral environment should be evaluated to depict a tumor’s behavior and potential for invasion (14, 22).
This study aimed to establish and validate a radiomics nomogram that incorporated tumor habitat and peritumoral features to predict progression-free-survival (PFS) in patients with STS. We hypothesized that such a nomogram would show enhanced prognostic value.
Materials and methods
Patients
The study was approved by the review boards of all participating institutions. The requirement for written informed consent was waived.
We reviewed preoperative MRI data of 309 patients who underwent resection of STS from January 2007 to July 2022 in one of four participating hospitals. A diagnosis of STS was confirmed histopathologically in all. Patients were included if: (i) they had integrated medical data; (ii) STS was confirmed pathologically (with immunohistochemical examination); and (iii) MRI examination was performed within 2 weeks before surgery or preoperative neoadjuvant radiotherapy/chemotherapy, and included FS-T2WI and CE-T1WI. Patients were excluded if medical or imaging data was inadequate or imaging was of poor quality (signal-to-noise ratio<1.0). We also excluded those with a second malignancy and patients who lacked follow-up data.
After applying criteria, 148 patients (average age ± standard deviation, 54 years ± 17) were included for analysis. The training cohort comprised 108 patients from the Affiliated Hospital of Qingdao University and the Puyang Oilfield General Hospital. The validation cohort comprised 40 patients from the Shandong Provincial Hospital Affiliated to Shandong First Medical University and the Third Hospital of Hebei Medical University. The process of patient enrollment is shown in Figure 1. The pathological findings are shown in Supplementary Table S1.
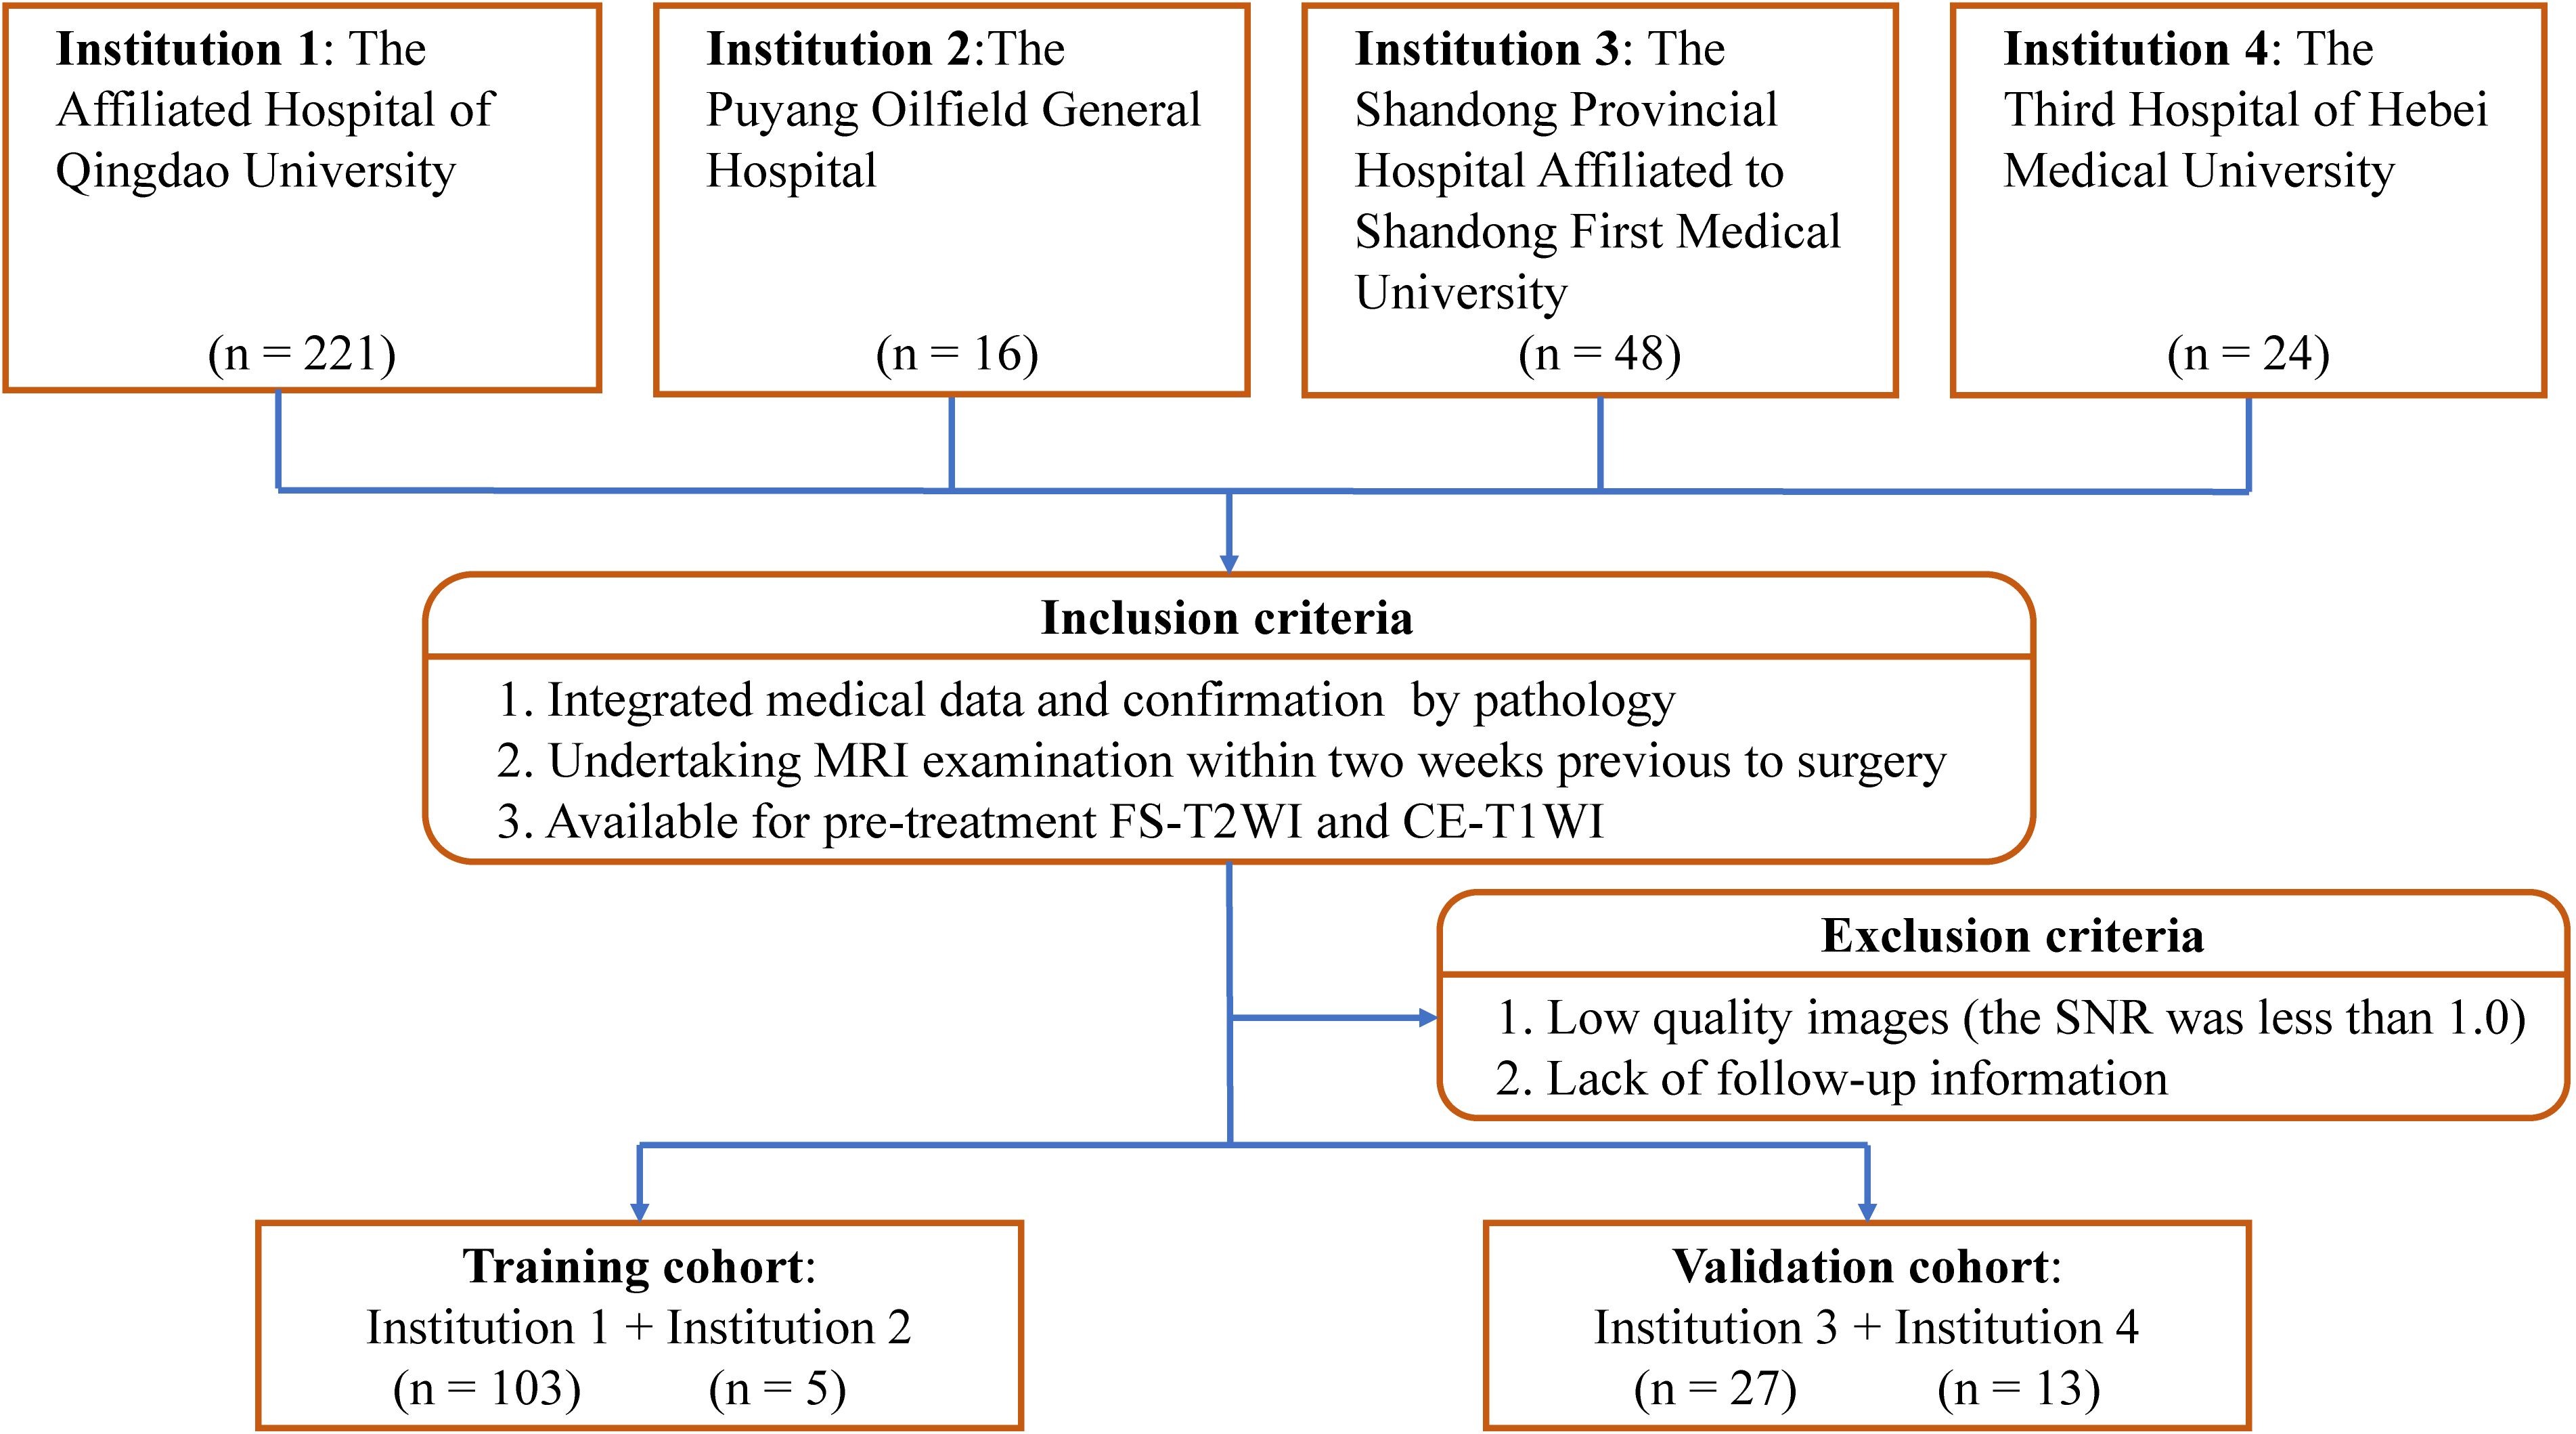
Figure 1. Study inclusion and exclusion criteria. FS-T2WI, fat-suppressed T2-weighted imaging; CE-T1WI, contrast enhanced fat-suppressed T1-weighted imaging; SNR, signal-to-noise ratio.
PFS was defined as the time from surgery to local recurrence, detection of new distant metastases on imaging, death, or last follow-up. Follow-up surveys were conducted every 3 to 6 months for the first 2 years after surgery and every 6 months thereafter. The censoring date was set as December 17, 2022.
MRI protocol
MRI included axial fat-suppressed T2-weighted imaging (FS-T2WI) and axial contrast-enhanced fat-suppressed T1-weighted imaging (CE-T1WI). Scans were performed using the following scanners: HDx 1.5 T/3.0 T (GE Healthcare, Chicago, IL, USA), Magnetom Skyra 3.0 T (Siemens, Munich, Germany), Achieva 1.5 T (Philips Healthcare, Amsterdam, Netherlands), and Prisma (Siemens). Scanner parameters are listed in Supplementary Table S2.
Clinical data collection and semantic MRI evaluation
Twenty characteristics were collected from among the clinical baseline information, postoperative histopathological indicators and semantic MRI features (Supplementary A1).
Image preprocessing and lesion segmentation
The study flowchart is shown in Figure 2. Image preprocessing and segmentation of tumor-associated regions were performed as a four-step procedure which included image registration, N4-bias-field-correction, tumor-associated region segmentation, and spatial resampling (Supplementary A2).
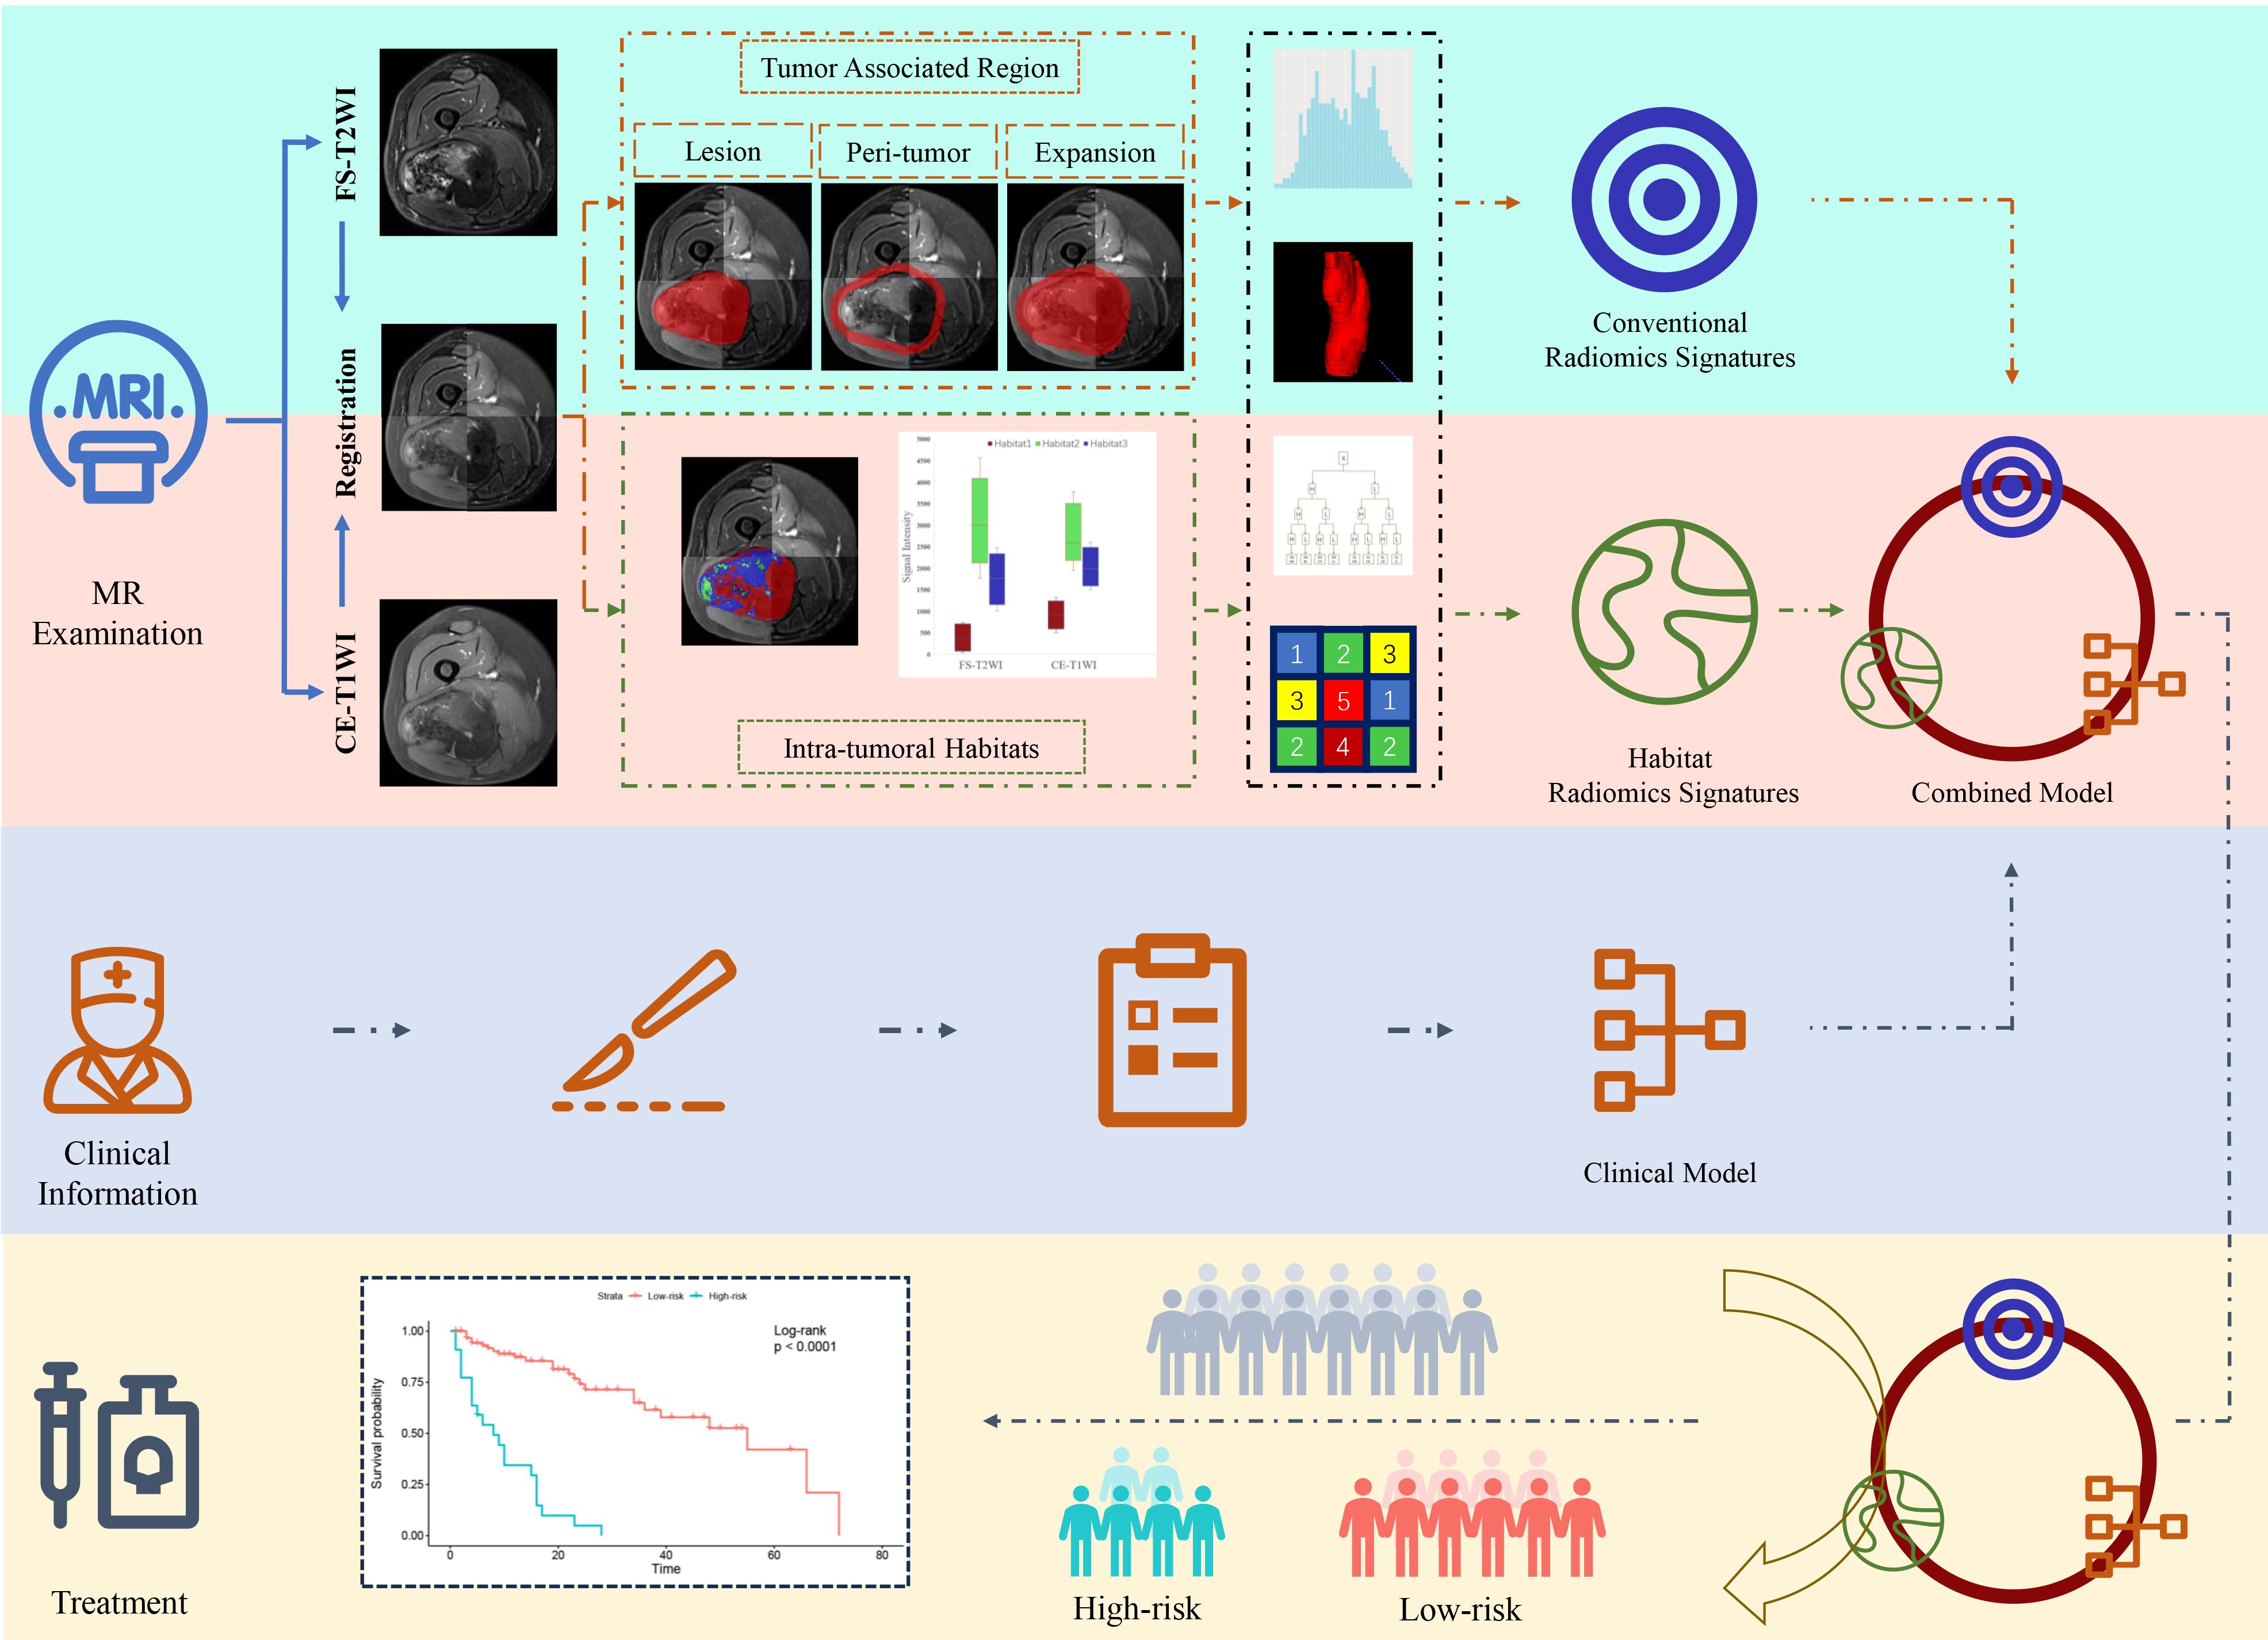
Figure 2. Flowchart of radiomics analysis.
Prior to habitat analysis of tumor regions, signal intensity on the FS-T2WI and CE-T1WI images was normalized using the histogram intensity normalization method in Python (23). After applying the K-means clustering module, the voxels in FS-T2WI and CE-T1WI images were aggregated after normalization into three clusters standing for functionally coherent tumor subregions. Two distinct signal intensity maps of the FS-T2WI and CE-T1WI sequences defined the clusters and separated the whole tumor region into 3 intratumoral habitats: habitat 1, a low-enhancing solid subregion with low CE-T1WI and FS-T2WI signal intensity; habitat 2, an enhancing viable subregion with high CE-T1WI and FS-T2WI signal intensity; and habitat 3, a hypoactive subregion with s medium CE-T1WI and FS-T2WI signal intensity.
Radiomics feature extraction
Feature extraction was processed using PyRadiomics in Python. For the tumor region, peritumoral, and tumoral expansion masks, 1906 conventional radiomics features (containing first-order, shape, textural, and wavelet features) were extracted from each sequence. For the three intratumoral habitats, 93 radiomics features (containing first-order and textural features) were extracted. In addition, voxel number and voxel fraction of each habitat for every patient were recorded as baseline habitat features.
Standardization and normalization of features
Radiomics features were standardized using combat compensation methodology, which can reduce technical inconsistencies resulting from different scanner protocols (24). Then, they were normalized into a Z-score referring to their mean value and standard deviation.
Progression predictive survival signature determination
The process of survival signatures determination was detailed in Supplementary A3. In total, 18 signatures of three sets were built: conventional radiomics signature set, habitat baseline signature set, and habitat radiomics signature set (Supplementary Table S3).
The radiomics progression risk score (RPRS) of the best performing radiomics signature was calculated using the following formula:
where N is the number of features enrolled into the signature, Vi is the value of the ith feature, and Ci is the regression coefficient in the signature.
Survival model development and validation
The process of clinical model and nomogram construction was detailed in Supplementary A4.
Statistics
Statistical analyses were performed using R software version 4.1.0 (The R Foundation, Vienna, Austria). Continuous data were compared using the t-test. Categorical data were compared using the chi-square or Fisher exact test as appropriate. For survival signatures and models, predictive performance was evaluated using the concordance index (C-index) and receiver operating characteristic curve analysis (25). Prediction errors were estimated using the integrated Brier score (IBS). The IBS was evaluated using the “Boot632plus” splitting method (26). Calibration curves and decision curve analysis were used to assess model fitting, clinical reliability, and practicability. Patients were divided into subgroups with different risks of progression based on optimal cut-off values that were determined using X-tile software version 3.6.1 (Yale University School of Medicine, New Haven, CT, USA) (27). PFS was estimated using the Kaplan–Meier method and compared using the log-rank test. Areas under the ROC curve (AUCs) were compared using the DeLong test. P<0.05 was considered significant.
Results
Median PFS overall 148 patients was 12.5 months (range, 1–88). Mean PFS in patients who experienced STS progression and those who did not was 11 months and 13 months, respectively. Patients from the training and validation cohorts had similar baseline characteristics except for age, FNCLCC grade, NCI grade, American Joint Committee on Cancer (AJCC) stage, histopathological grade, depth, heterogeneous signal intensity on T2WI, radiotherapy, chemotherapy, and tumor location (Table 1).
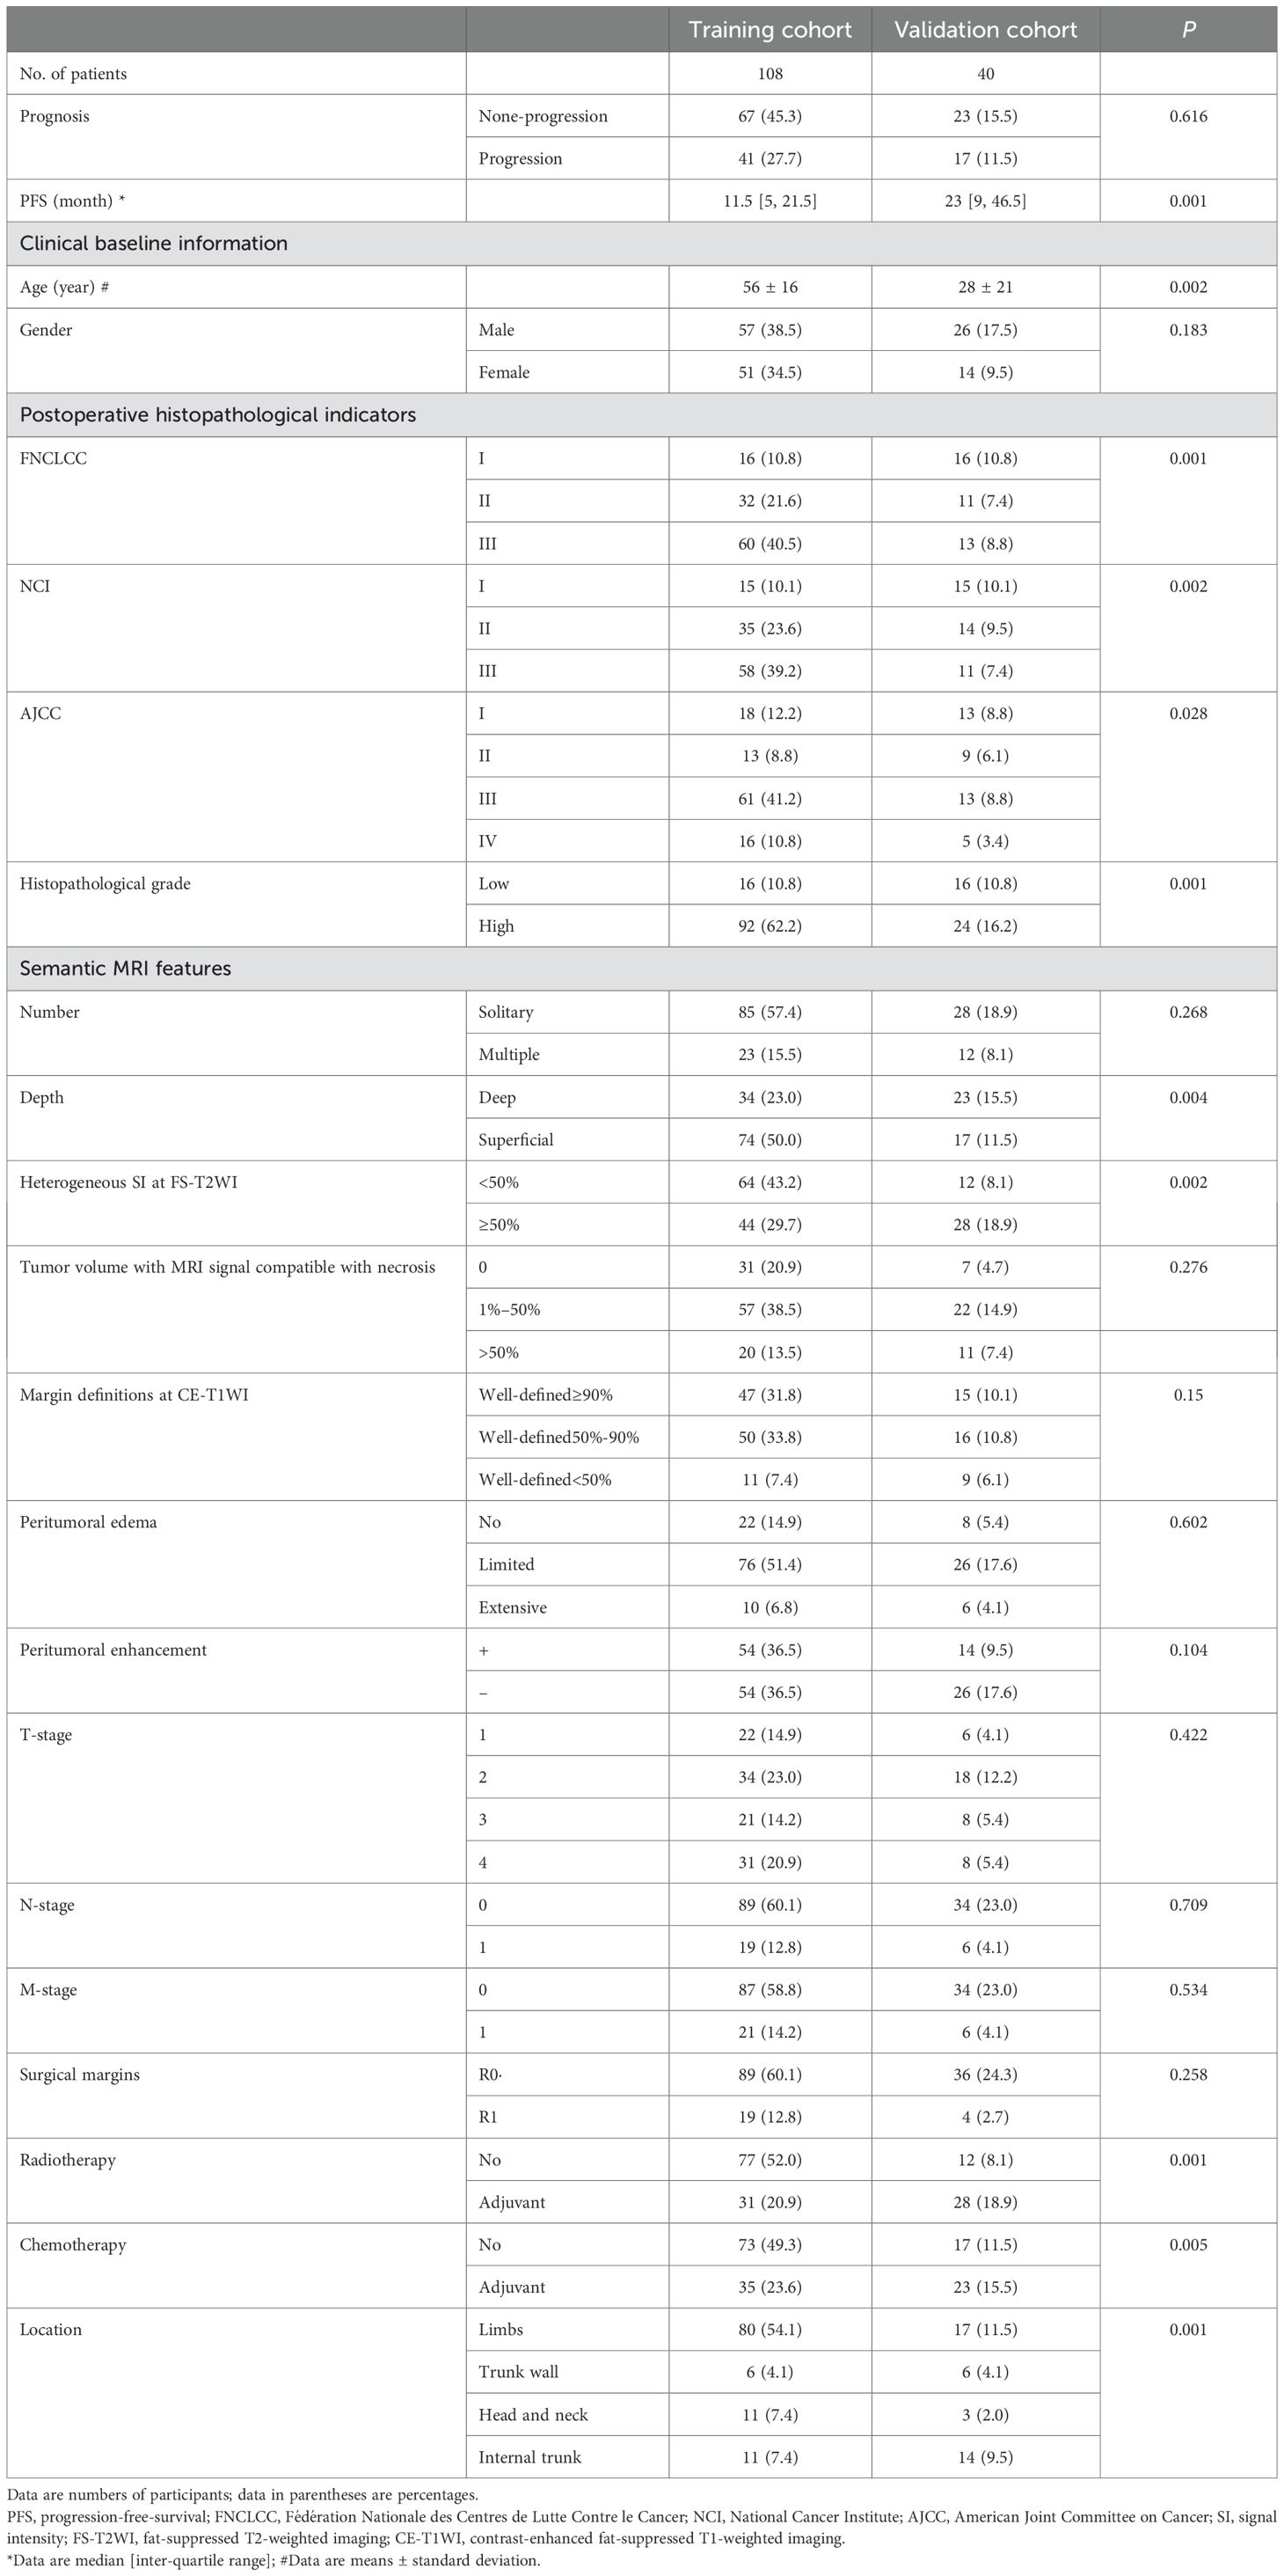
Table 1. Patient baseline characteristics.
Habitat analysis and radiomics signature development
Baseline habitat features are shown in Supplementary Table S4. Nine baseline habitat features-based predictive signatures yielded unconvincing performance in the validation cohort (Table 2). The selected radiomics features in each predictive signature are shown in Supplementary Table S5. As shown in Table 3, among all the radiomics signatures, the Peri-tumor + Habitat _combined signature yielded relatively stable and excellent performance for prediction progression: in the training cohort, the C-index was 0.868 (95% confidence interval [CI], 0.809–0.927), median AUC was 0.914, and IBS was 0.091; in the validation cohort, the C-index was 0.761 (95% CI, 0.647–0.875), median AUC was 0.775, and IBS was 0.131. As a result, this signature was identified as the best performing radiomics signature and was entered into the follow-up study. The RPRS was calculated according to the input features and corresponding regression coefficients in the Peri-tumor + Habitat _combined signature (Figure 3A).
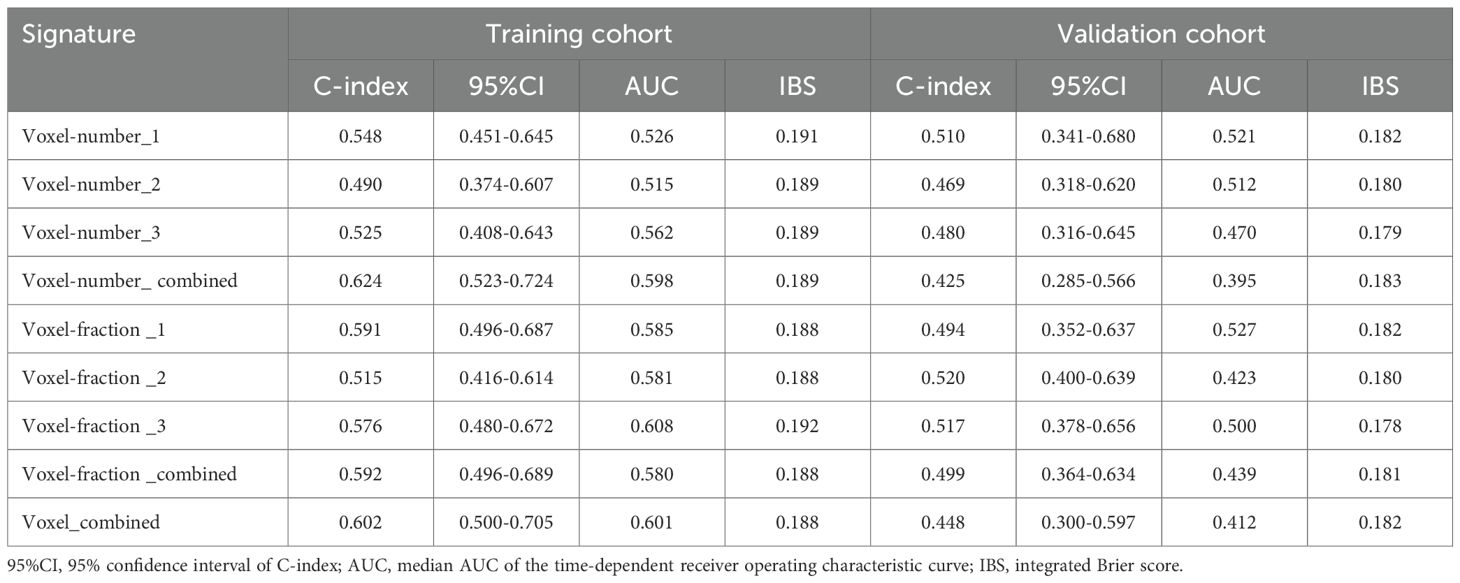
Table 2. Predictive performance of baseline habitat signatures.
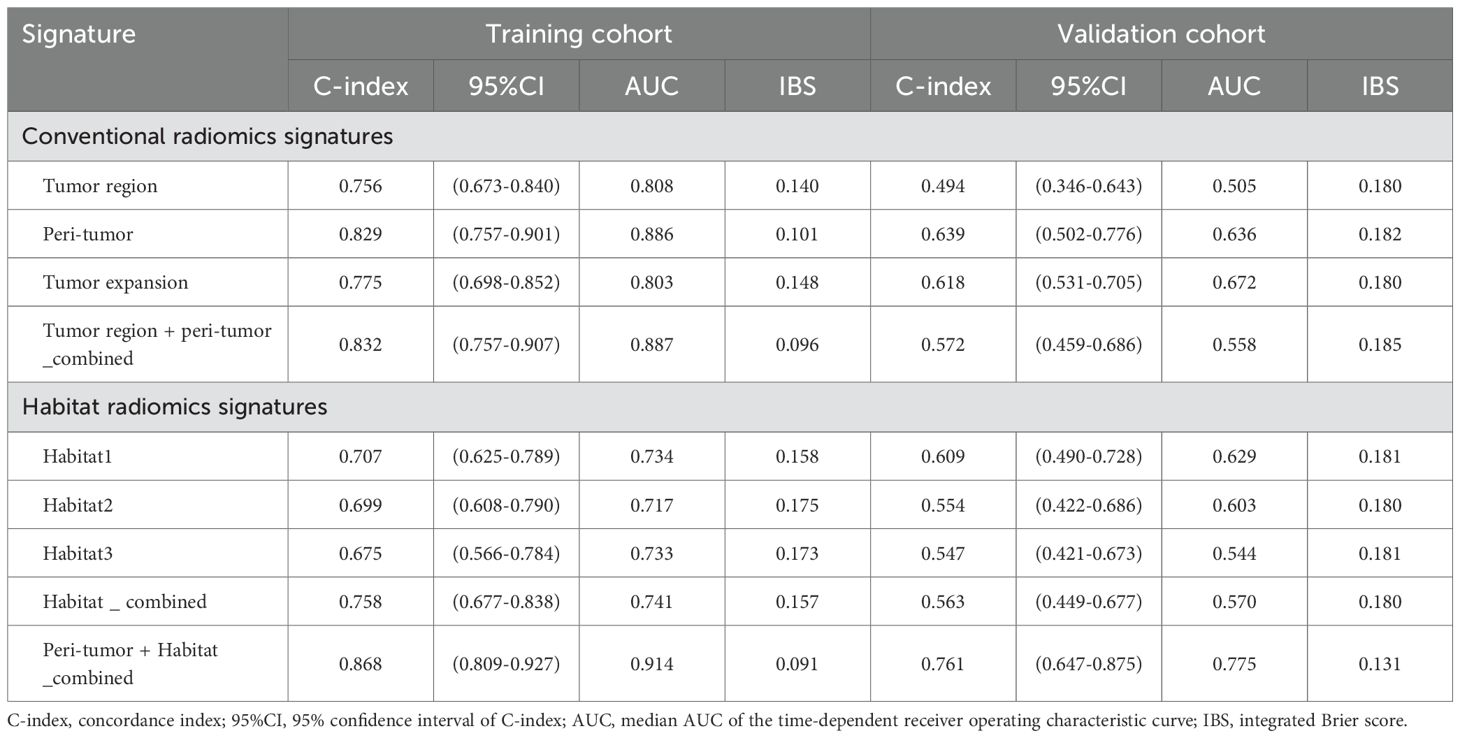
Table 3. Predictive performance of conventional radiomics signatures and habitat radiomics signatures.
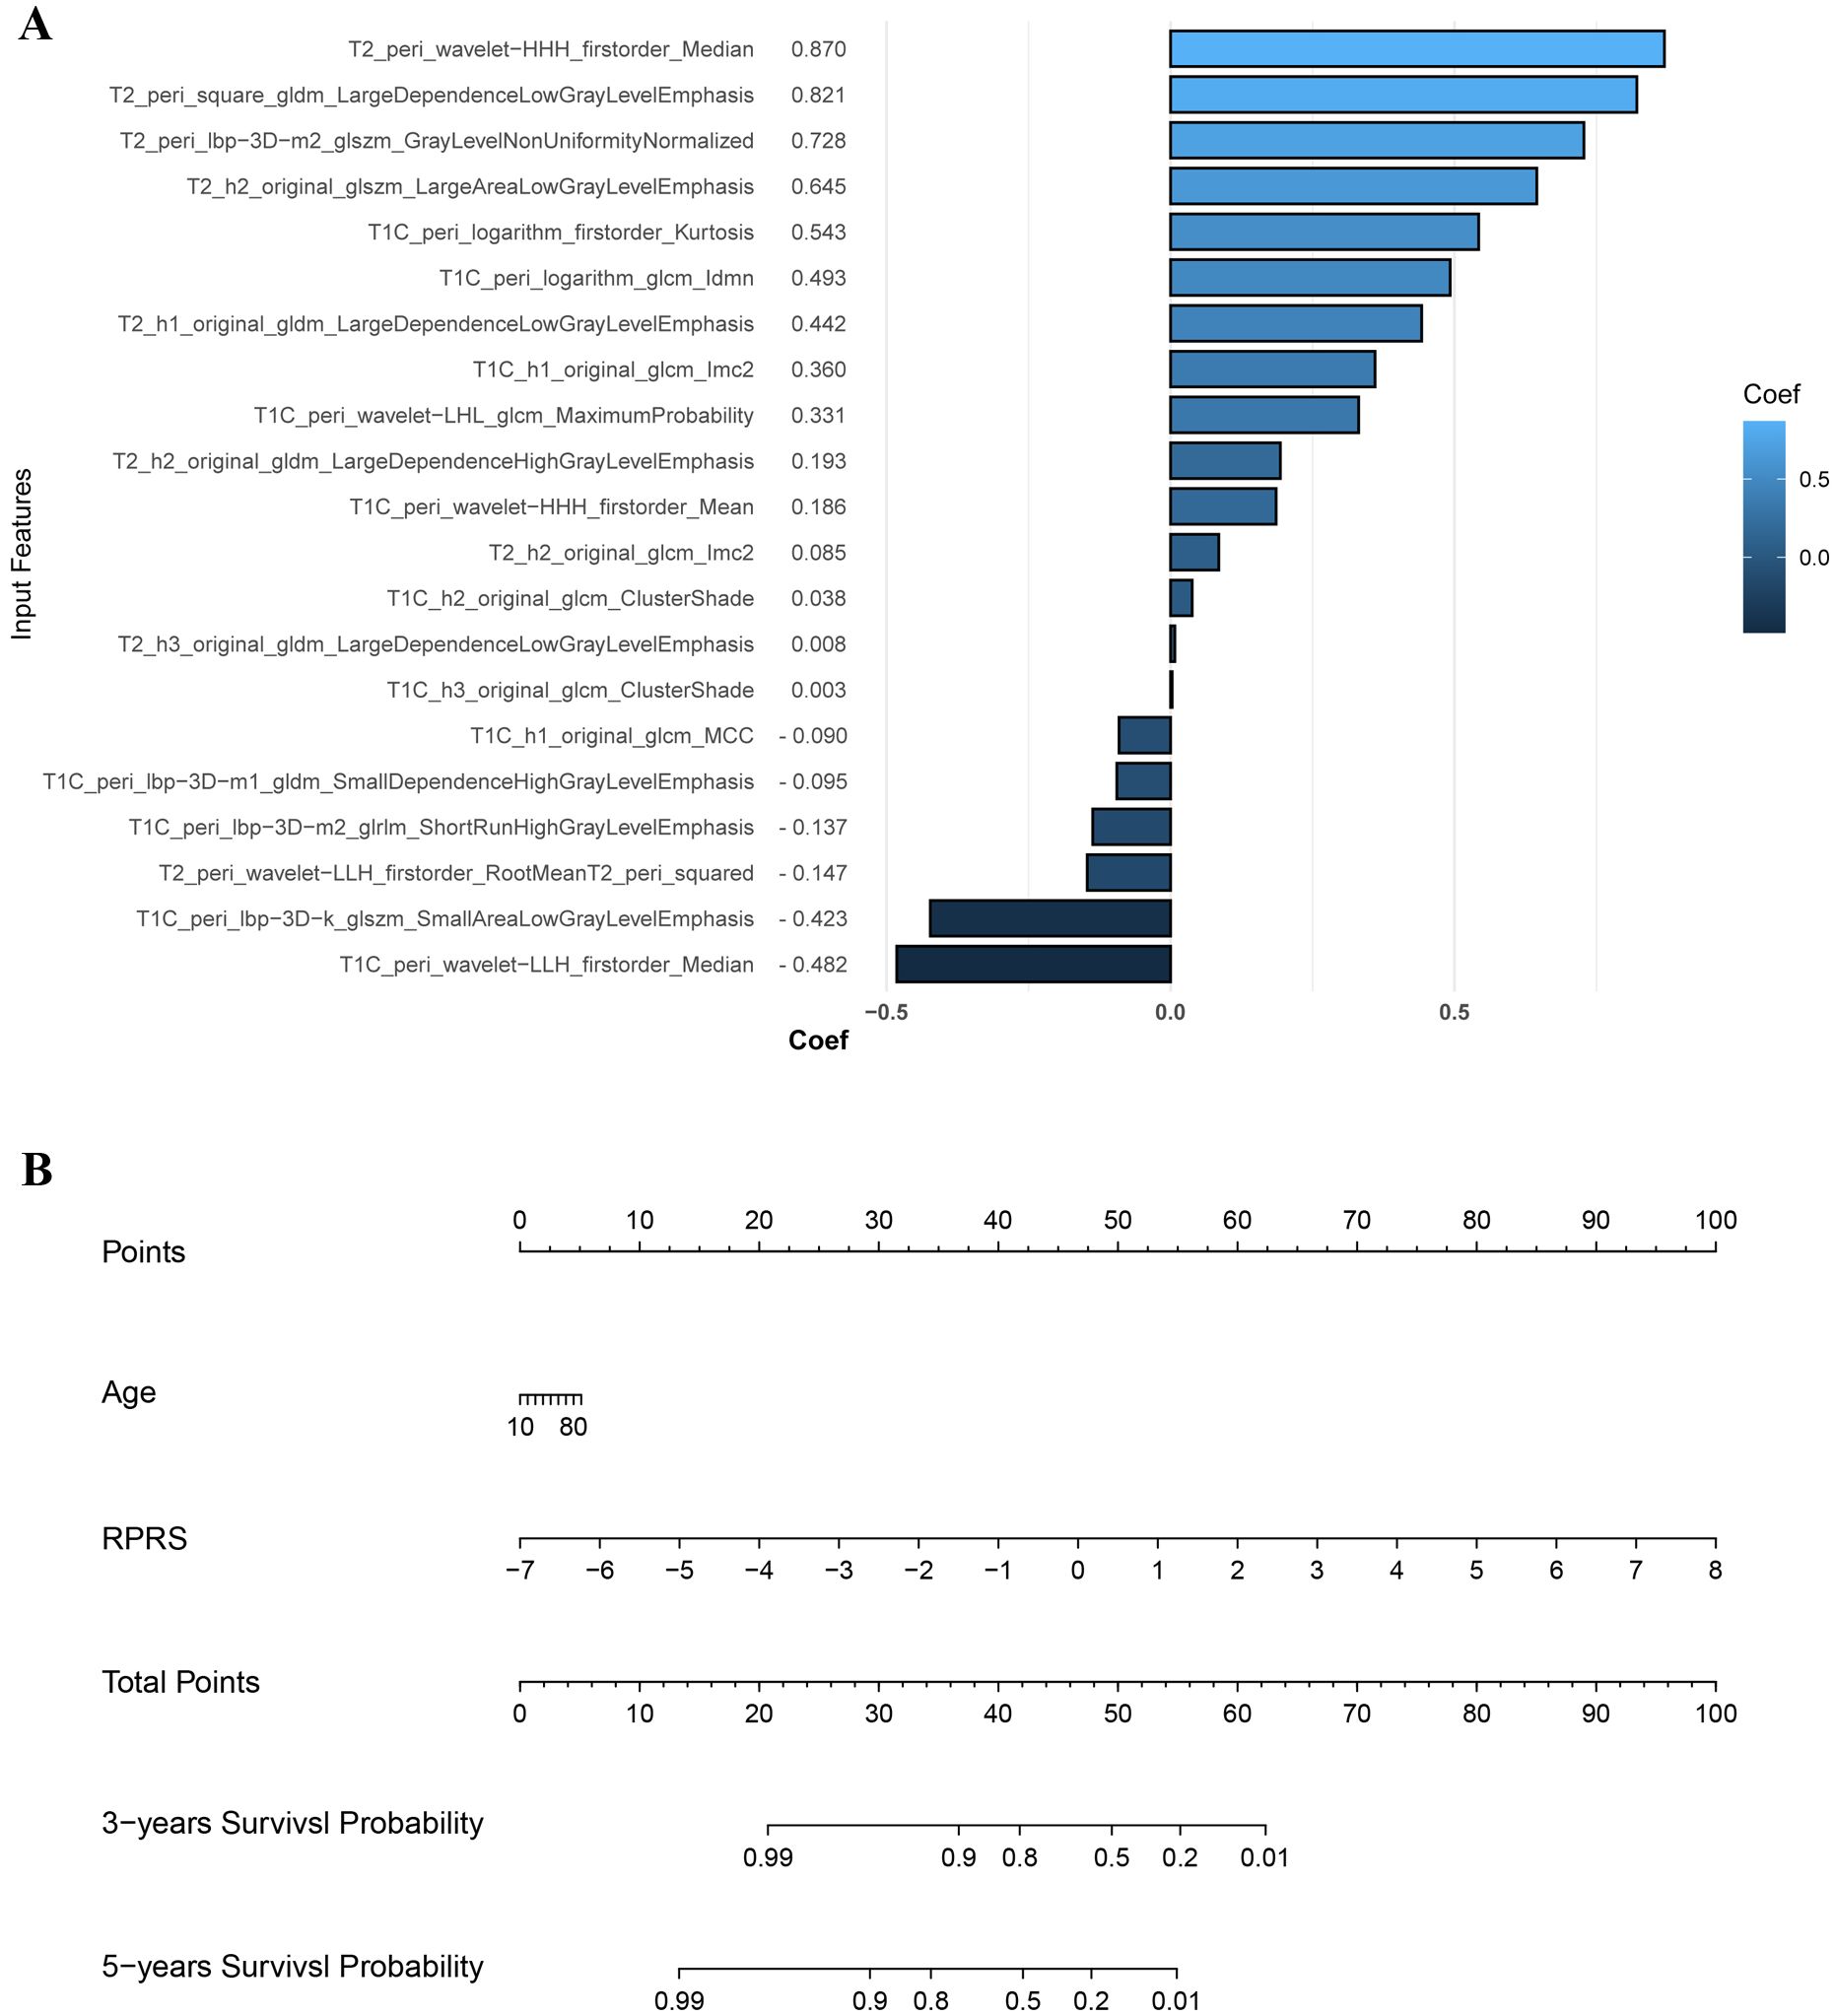
Figure 3. The input features and corresponding regression coefficients of radiomics progression risk score (RPRS) and the nomogram. (A) The features and corresponding coefficients for RPRS calculation. The feature with greatest predictive contribution was a wavelet transformed feature derived from the peritumor region on fat-suppressed T2-weighted imaging. (B) Nomogram for prediction of progression risk.
Model construction and performance evaluation
Age was the only significant clinical prognostic predictor of progression in the univariable Cox regression analysis (Supplementary Table S6) on which the clinical model was based. The nomogram for individualized risk assessment integrating the RPRS and age is shown in Figure 3B.
The predictive performance of the radiomics signature, clinical model, and nomogram is shown in Table 4. The C-index for prediction of progression in the training and validation cohorts was highest for the nomogram (0.874 [95% CI, 0.819–0.930] and 0.777 [95% CI, 0.660–0.894], respectively). In the validation cohort, the AUC was slightly higher for the nomogram (0.808) than the radiomics model (0.775, P = 0.005) and the clinical model (0.278, P = 0.293; Figures 4A, B). The predictive error of the models is shown in Figures 4C, D. In the validation cohort, the IBS for the nomogram was 0.135, which was lower than that of the clinical model (0.175); the IBS of the nomogram and radiomics model (0.131) were similar. Decision curve analysis of the nomogram showed a good clinical benefit within the full range of threshold probability (Figure 5C).
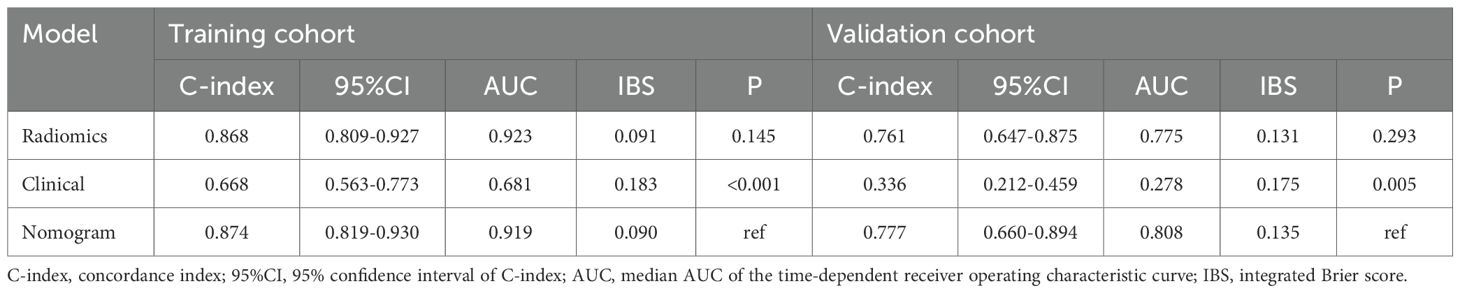
Table 4. Predictive performance of radiomics signature, clinical model, and nomogram.
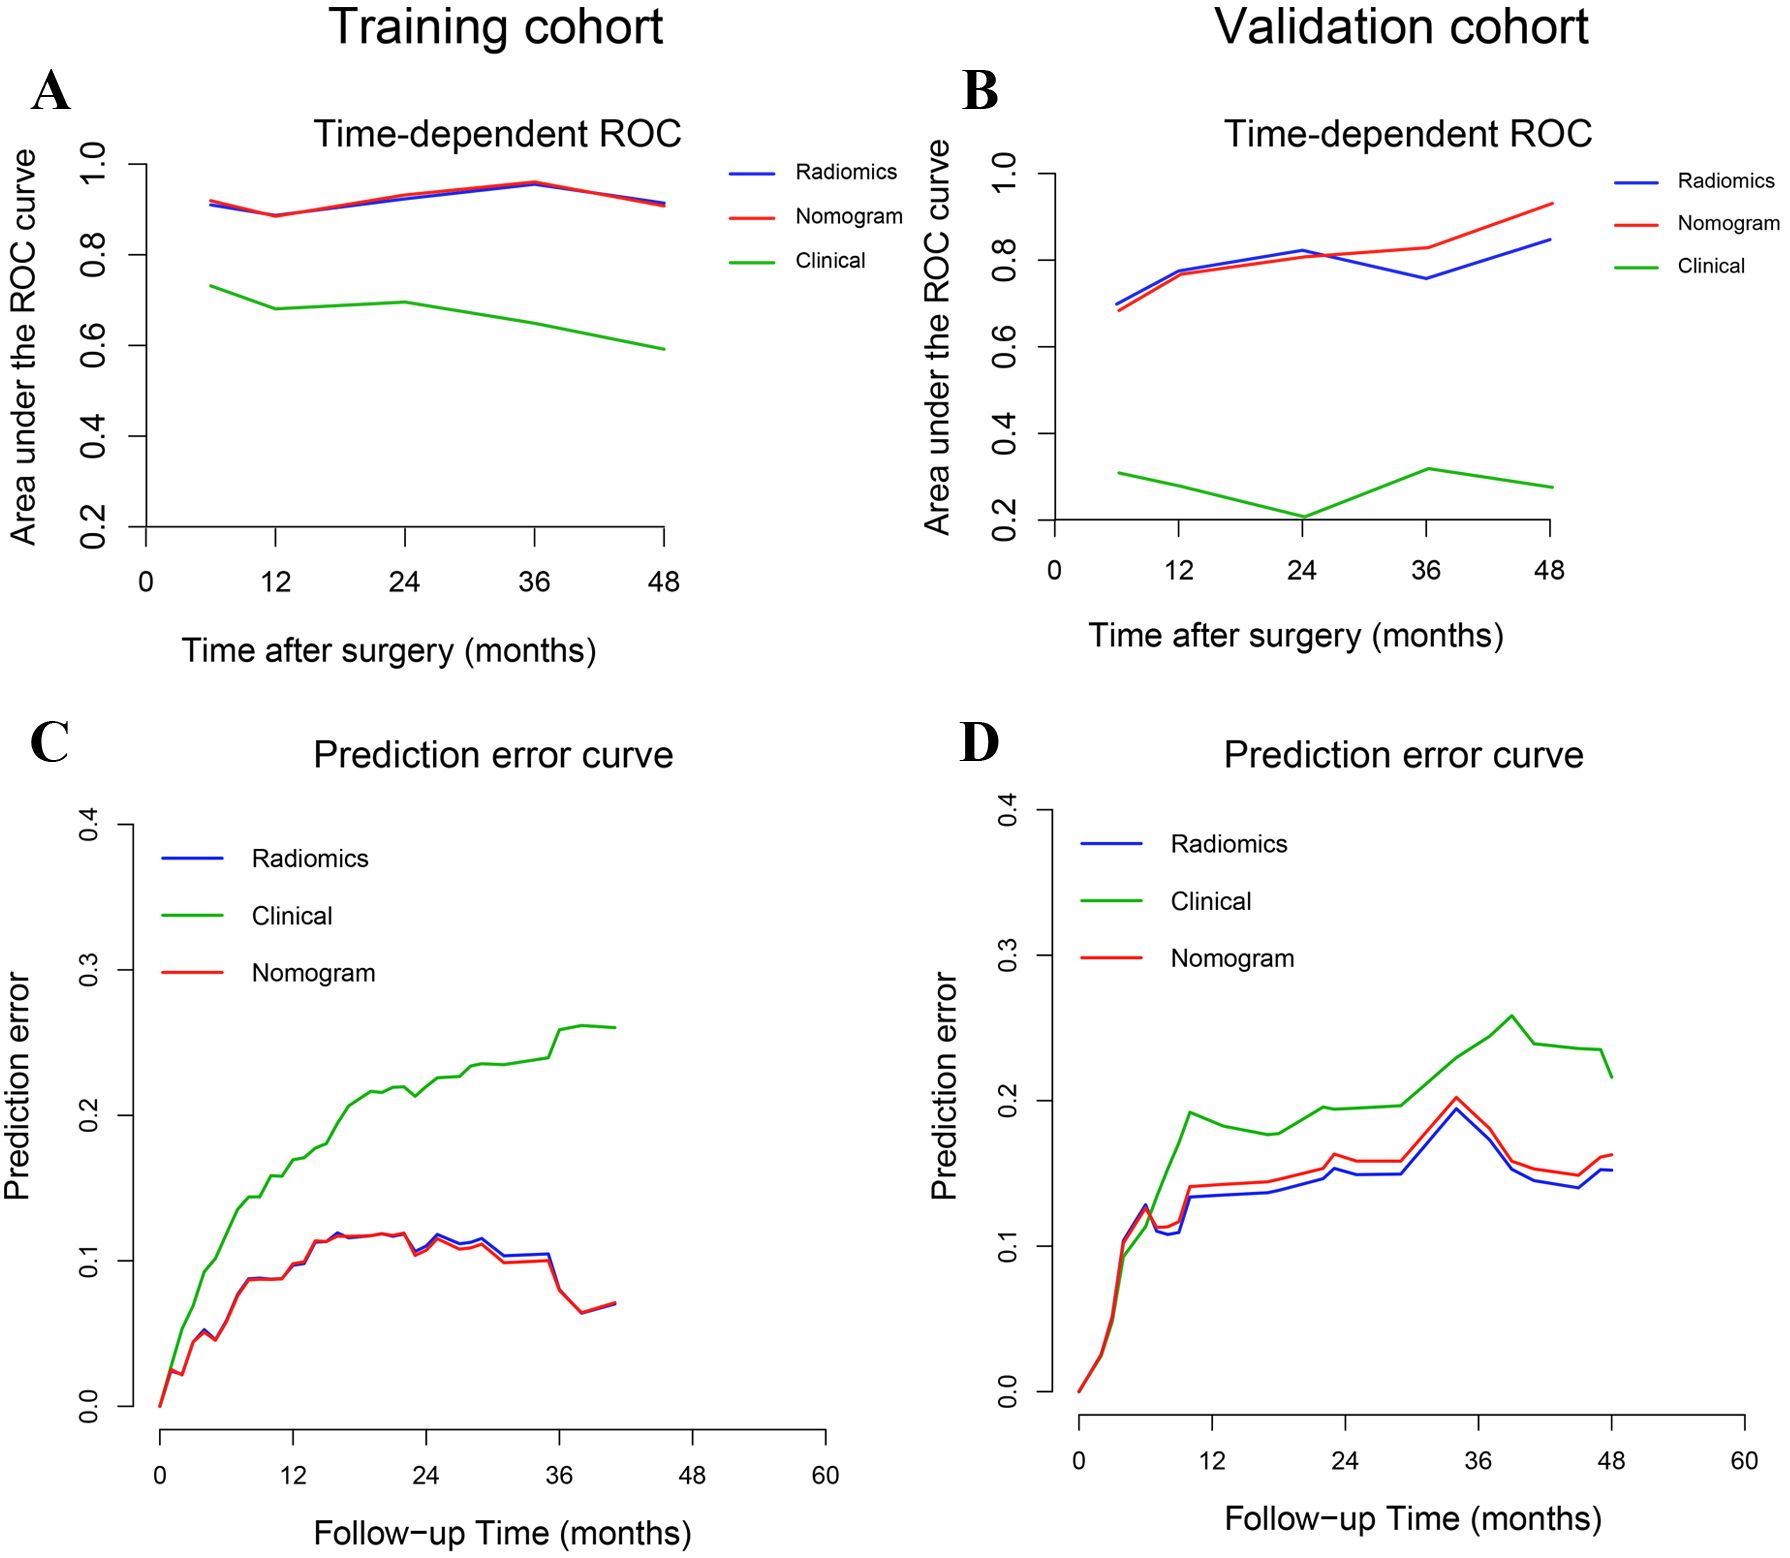
Figure 4. Time-dependent receiver operating characteristic curves and prediction error curves for the radiomics signature, nomogram, and clinical models in the training (A, C) and validation (B, D) cohorts.
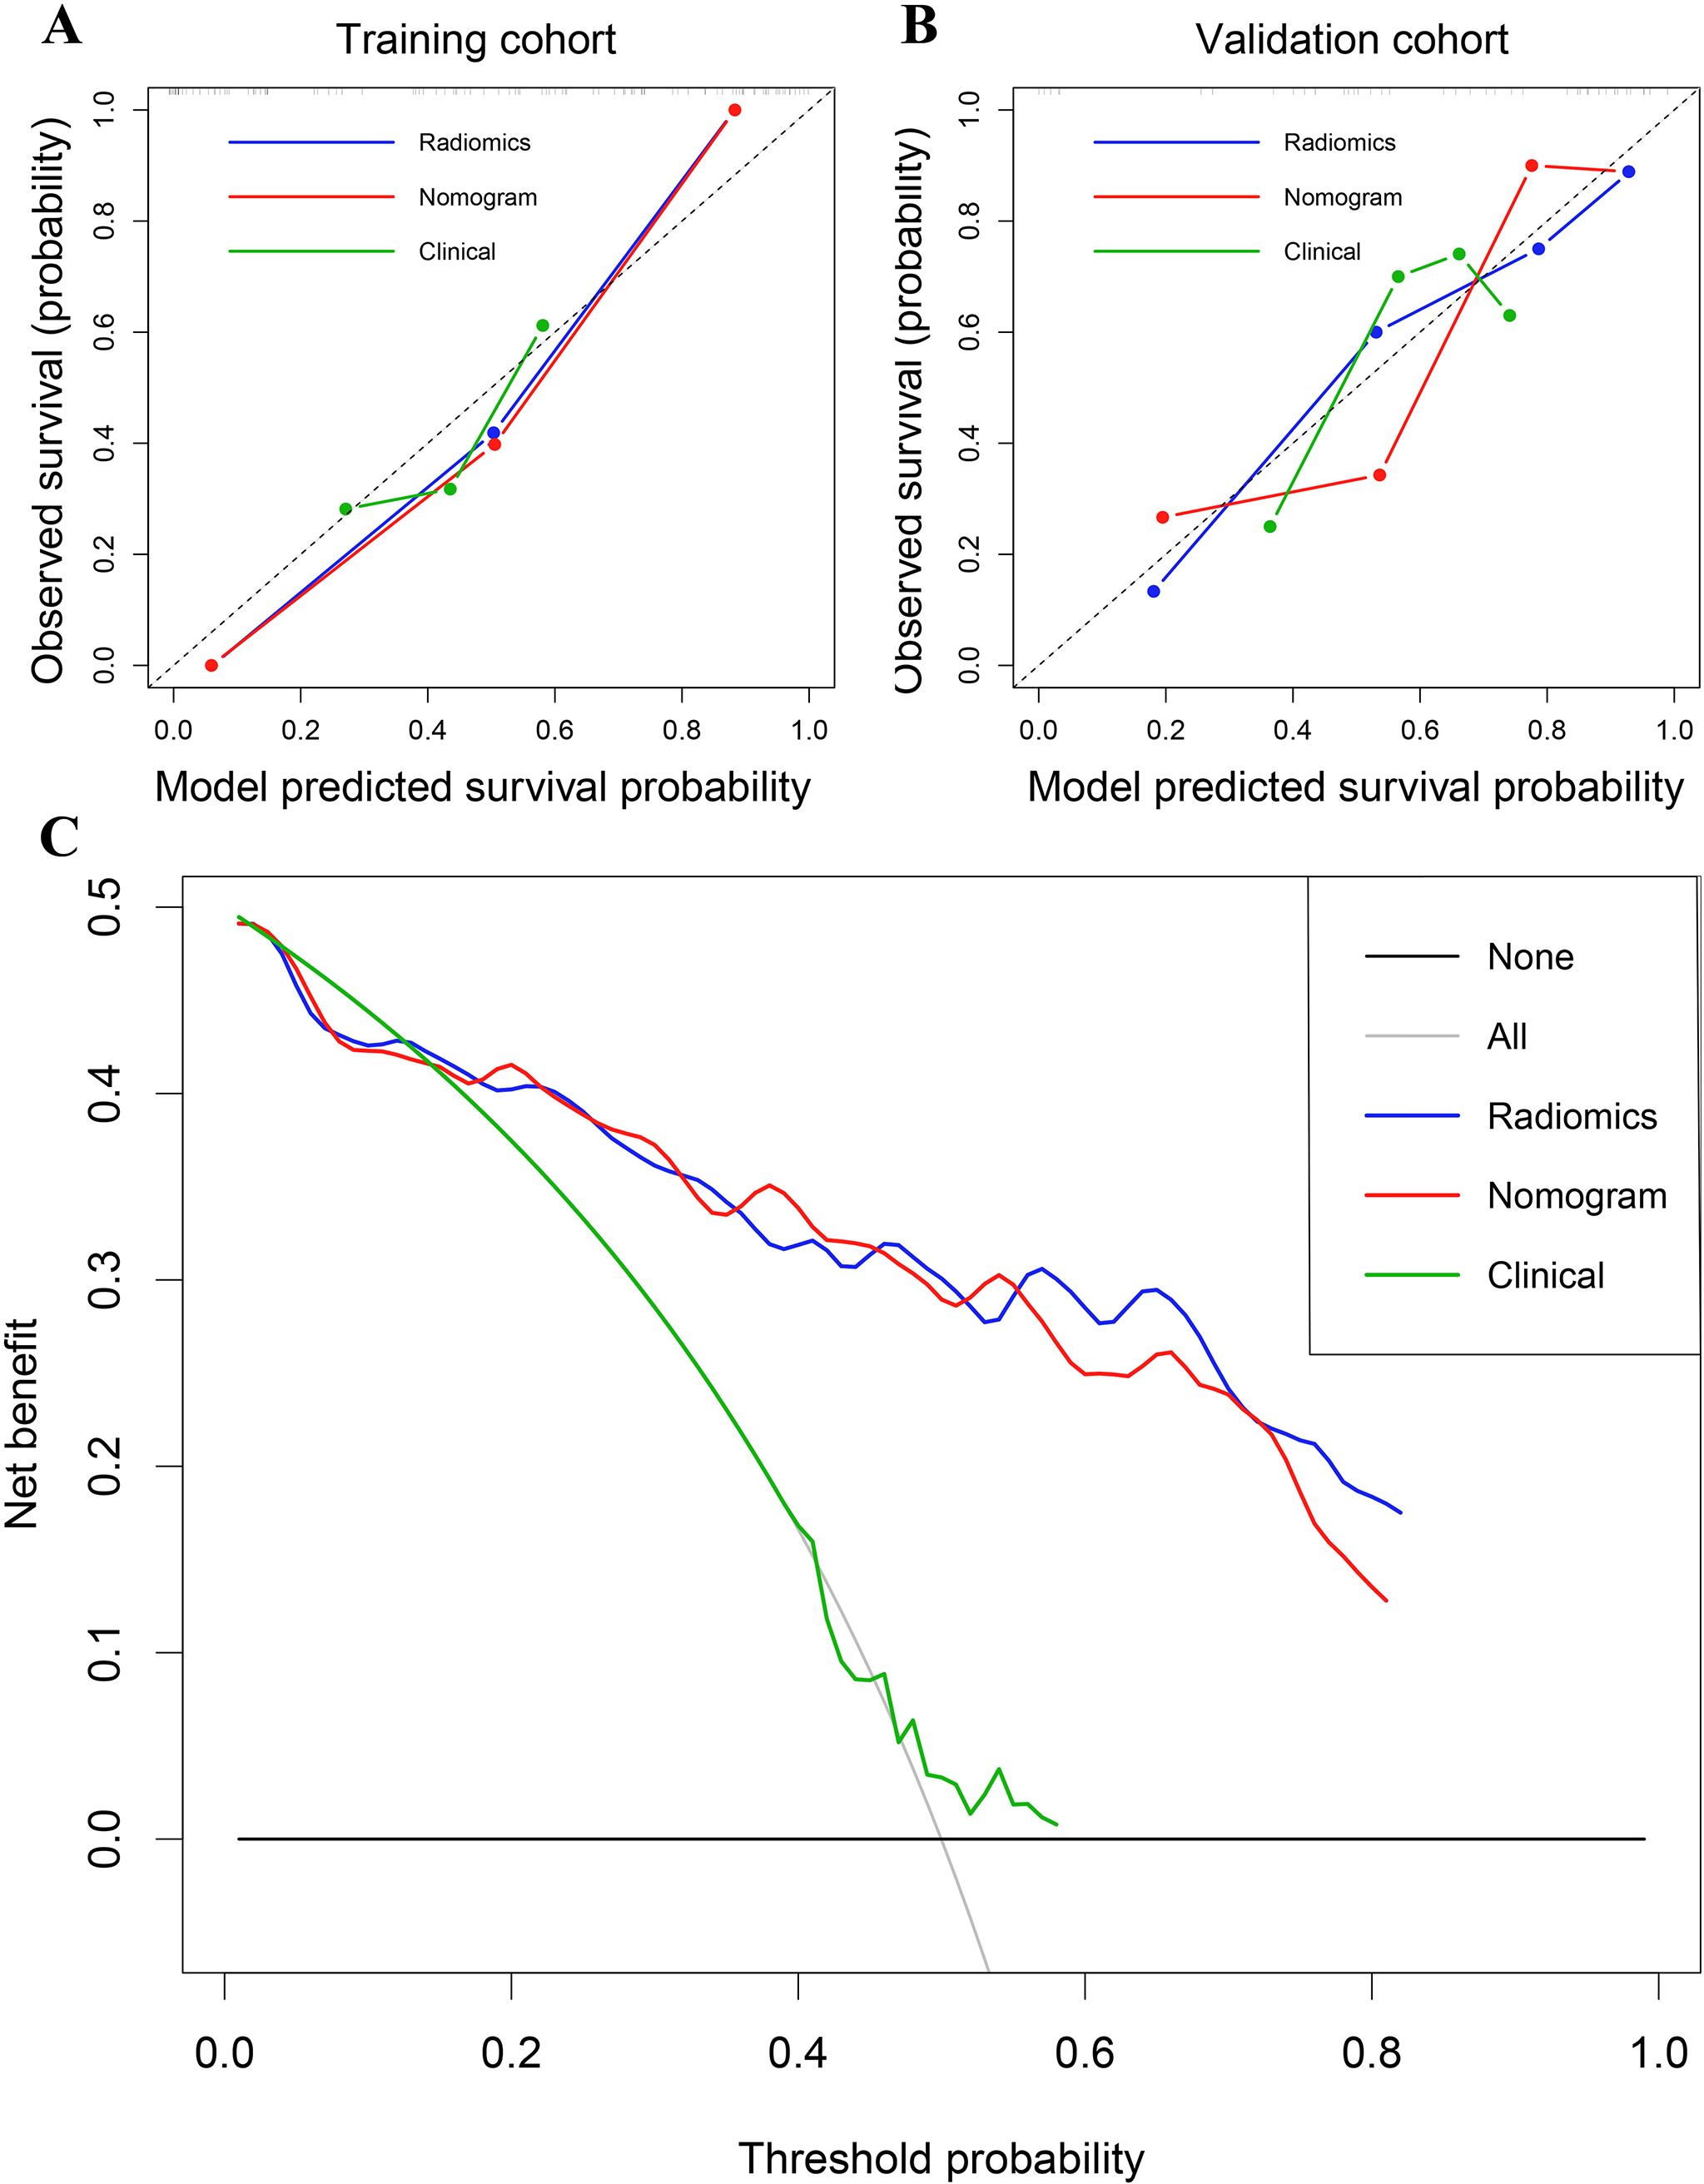
Figure 5. (A) Calibration curves of the radiomics signature, nomogram, and clinical models in the training cohort. (B) Calibration curves in the validation cohort. (C) Decision curve analysis for the entire cohort.
Progression risk stratification and survival analysis
In the training cohort, the optimal cutoff for nomogram risk score to divide patients into two risk classifications was 1.28. Kaplan–Meier curves of patients in both the training and validation cohorts grouped according to risk of progression are shown in Figures 6A, B. PFS significantly differed between the groups in both cohorts (P<0.01). In addition, the nomogram could stratify patients in the overall cohort for PFS in both low and high histopathological grade subgroup (Figures 6C, D).
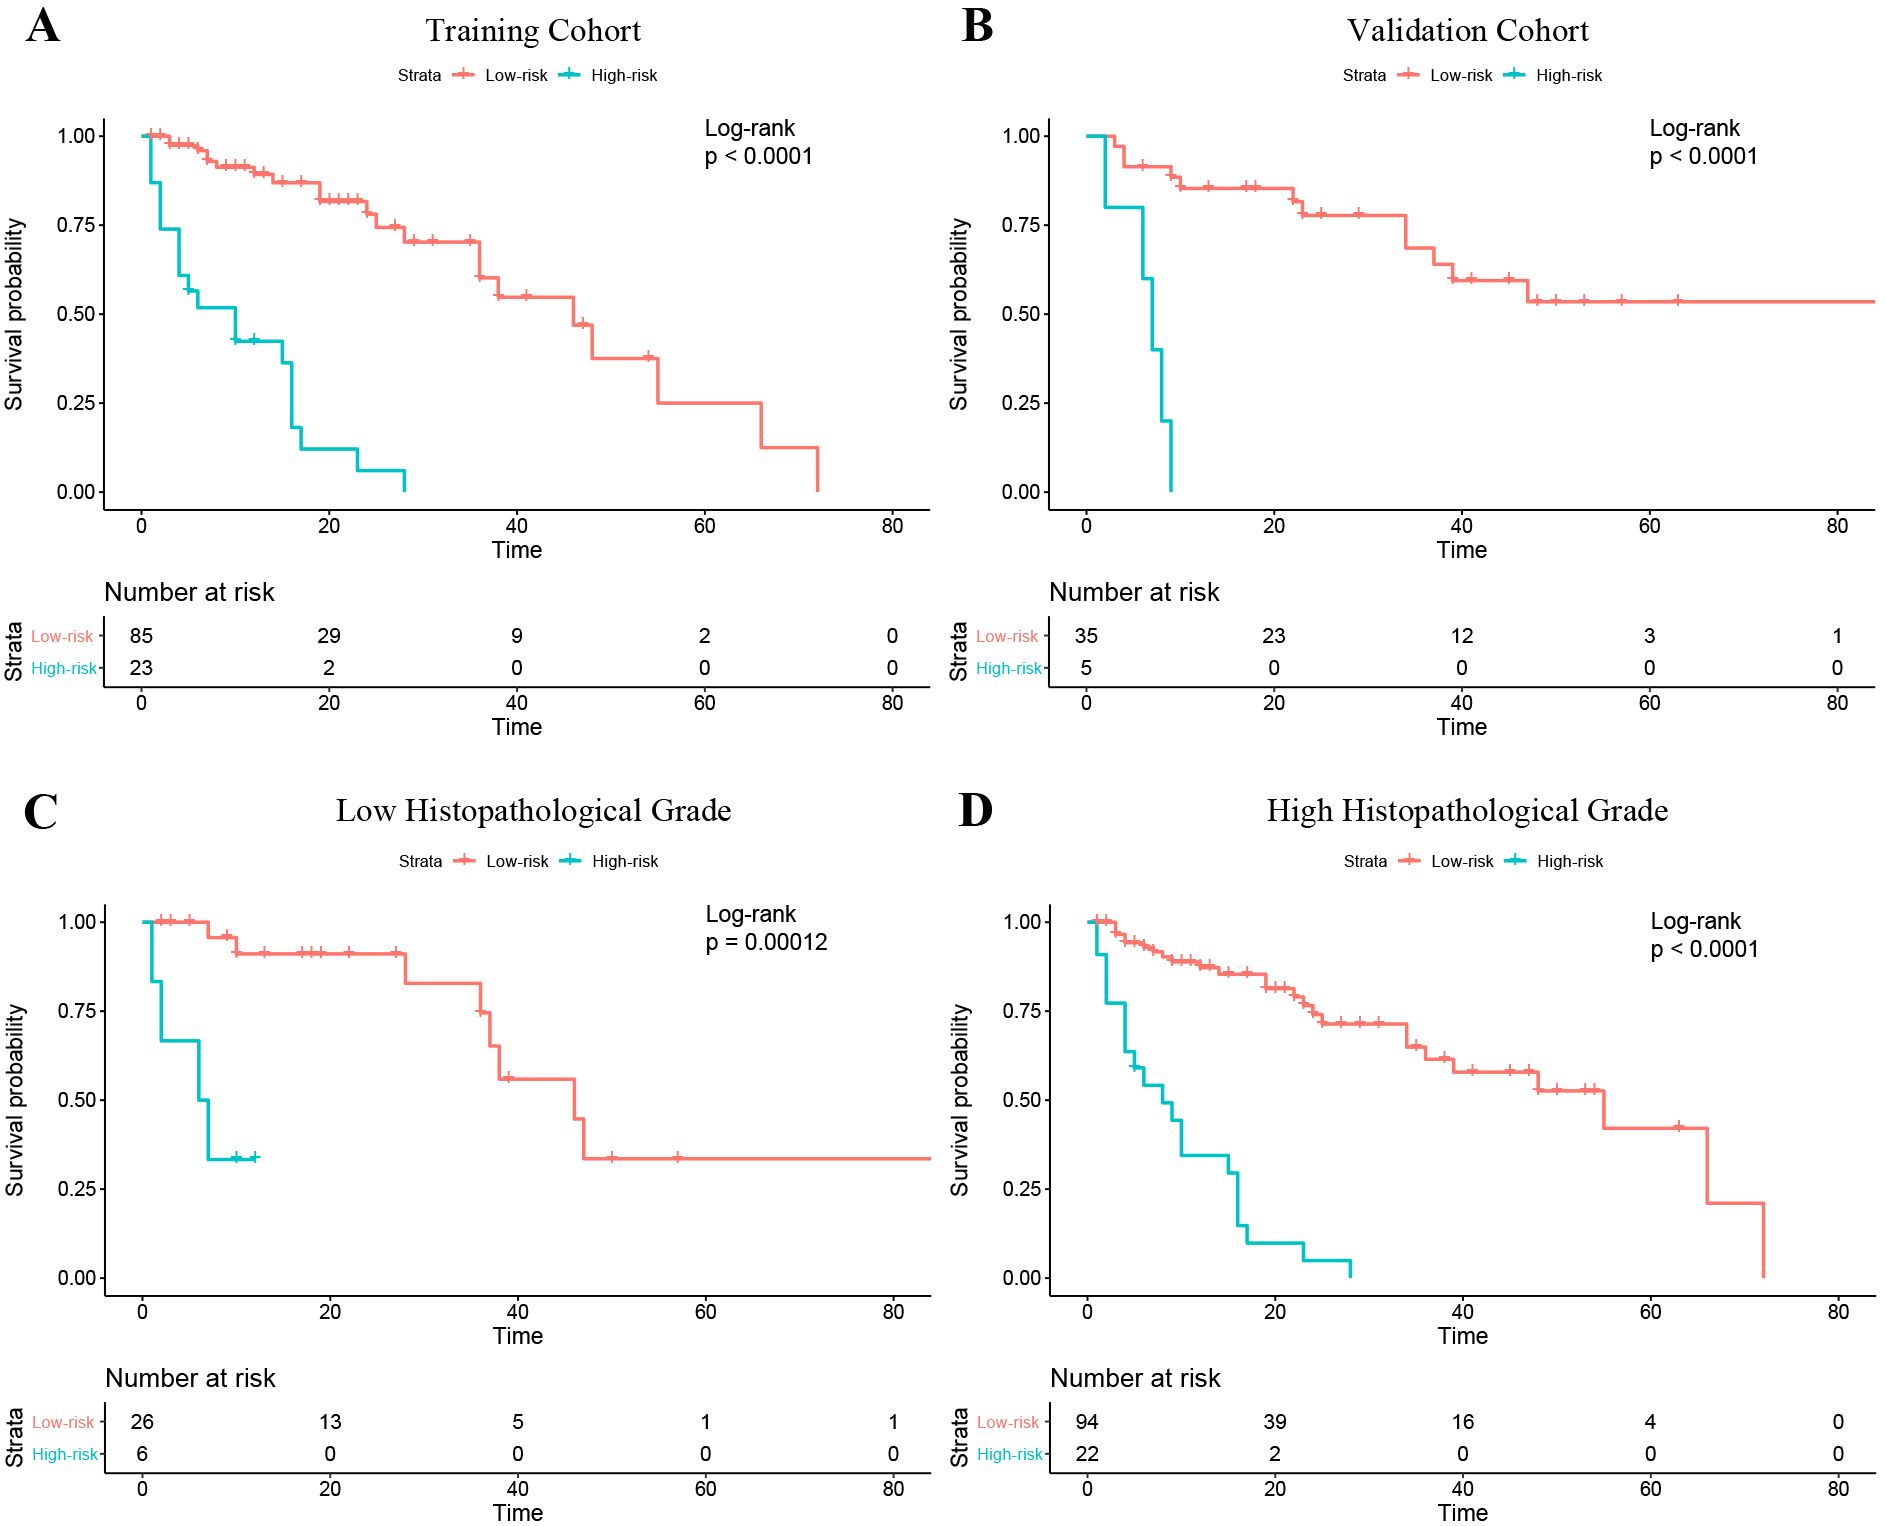
Figure 6. Kaplan–Meier curves of progression-free survival in the patients with low and high risk of progression based on the nomogram. (A) Training cohort. (B) Validation cohort. (C) The Low histopathological grade group of the entire cohort; (D) The high histopathological grade group of the entire cohort.
Discussion
In this study, we verified that a radiomics model combining intratumoral habitat features and peritumor features can predict tumor progression in patients with STS. PFS in our cohort ranged from less than 1 month (5 patients) to over 5 years (7 patients). Compared with analyzing radiomics features derived from intratumoral habitats or regions, the peritumor region, or tumoral expansion, the combined radiomics features signature yielded better predictive performance. Moreover, in the validation cohort, the nomogram showed a convincing level of performance (C-index, 0.777), less prediction error (IBS ≤0.135), good calibration, and convincing clinical usefulness.
Conventionally, radiomics has focused on analyzing the primary tumor as a whole. However, in consideration of the inherent internal heterogeneity and peritumoral aggressiveness of the tumor, it is conceivable that subregions within the tumor and regions surrounding it contain complementary useful information (28). In a previous study, the survival prediction performance of integrated features was better with integrated features than with intra- and peritumoral features alone (22). Another study suggested that a radiomics model based on tumor region habitats enabled accurate patient risk stratification (18). In our study, intra- and peritumoral features were integrally analyzed to construct a survival prediction model, which achieved a convincing performance and revealed that comprehensive analysis of multi-regional and multi-scale radiomics information can quantify tumor heterogeneity. The integrated model appears to have considerable potential in prognostication of STS patients.
Empirical evidence has shown that the tumor microenvironment might have an indispensable role in STS tumor relapse (29). Morphologic changes in the microenvironment that influence survival can be detected by peritumoral radiomics and peritumoral radiomics has potential for predicting progression (28). Dou et al. (30) analyzed radiomics features derived from a 3 to 9 mm region outside the tumor margin to predict distant metastasis of lung adenocarcinoma. Other studies have suggested that radiomics based on a region 15 mm outside of the tumor can stratify patients according to prognosis and predict the response to neoadjuvant therapy (21, 22). In a study conducted by Braman et al. (21), the peritumoral radiomics features included in the final prediction signatures were all derived from the region within 12 mm of the tumor margin; no feature from beyond 12 mm was included. In our study, the region 15 mm outside the STS lesion contained a large amount of bone, large vessels and air; therefore, we defined the peritumoral region boundary as 10 mm from the tumor margin. The peritumoral signature yielded better performance than other single-region signatures, demonstrating that the peritumoral region contains important information regarding STS progression.
Considering the significant variability observed across intratumoral regions, image-based partitioning has been used to identify relevant subregions important for prediction of tumor biological behavior (15, 16). High-throughput radiomics features can be screened for constructing quantitative models for oncology diagnostics. Verma et al. manually partitioned subregions within glioblastomas on the basis of multi-sequence MRI and analyzed the radiomics features derived from each subregion to predict tumor progression (18). However, manual partitioning is reliant on radiologist experience and can only be applied in partitioning of contiguous subregions, which may result in poor reproducibility and objectivity. The clustering of voxels in multi-sequence MRI is a data-based analysis method that enables segmentation of subregions of similar tissue at a voxel-wise level (31). Previous studies have demonstrated that voxel number or fraction of cluster-segmented habitats in functional or structural MRI is an efficient biomarker for tumor biological behavior prediction (32, 33). Nevertheless, these studies focused on analyzing a small number of habitat baseline characteristics and neglected high-dimensional radiomics features that depict tumor habitat heterogeneity. In our study, we considered the potential of integrating high-throughput radiomics feature analysis and voxel-based habitat segmentation to predict STS progression. We showed that the combination of radiomics features derived from intratumoral cluster-segmented habitats and peritumoral features yielded the best predictive performance, validating that intratumoral habitat radiomics features at the voxel level adds predictive value.
Neoadjuvant radiotherapy treatment plays a dominant role in improving prognosis in STS patients (34). Hence, it is vital to identify patients with high risk of progression and treat them accordingly. Our study demonstrated that the radiomics nomogram, which integrated voxel-based and multiregional radiomics features with clinical information, yielded favorable performance for PFS prediction and provided convincing risk stratification ability. Our nomogram generated two risk stratifications (low or high risk of progression) and should help fellow clinicians with management of individual STS patients. For patients with a low risk of progression, surgery without adjuvant therapy might be considered initially to avoid the side effects of chemoradiotherapy. For those with a high risk, postoperative systemic adjuvant chemoradiotherapy and targeted therapy should be considered. In current clinical practice, the most important prognostic indicator for STS is histopathological grade (35). According to our study, the stratification ability of the nomogram was further proved by the sub-cohort analysis in the low- and high-grade patients defined by histopathological grade system. Thus, use of our nomogram can provide incremental information to clinicians and STS patients and help guide treatment decisions.
Several study limitations should be mentioned. First, owing to its retrospective design, selection bias was probably present. Second, the radiomics generalizability and robustness across inconsistent MRI parameters and multiple institutions should be validated. Although we used standardization processes at the imaging and feature levels, more prospective data is needed to validate our findings. Finally, tumor boundaries were defined manually (first outlined by a junior radiologist and corrected by a senior one). Semi-automatic or automatic delineation should be used in future studies to minimize delineator bias.
In conclusion, we constructed a nomogram based on intratumoral habitat and peritumor radiomics that predicts tumor progression in STS patients and stratifies them according to risk of progression. Performance of the nomogram was superior to that of other habitat- and radiomics-based models.
Data availability statement
The original contributions presented in the study are included in the article/Supplementary Material. Further inquiries can be directed to the corresponding author/s.
Ethics statement
The studies involving humans were approved by the review boards of all participating institutions. The studies were conducted in accordance with the local legislation and institutional requirements. Written informed consent for participation was not required from the participants or the participants’ legal guardians/next of kin in accordance with the national legislation and institutional requirements.
Author contributions
H-YL: Writing – original draft, Data curation, Methodology, Conceptualization, Writing – review & editing, Software. C-PG: Writing – original draft, Data curation, Writing – review & editing, Supervision. MZ: Software, Writing – original draft, Writing – review & editing, Validation, Data curation, Methodology. S-FY: Writing – original draft, Data curation. FH: Writing – original draft, Validation, Methodology. L-SD: Writing – original draft, Data curation, Validation. Y-HH: Data curation, Validation, Writing – original draft. C-CH: Writing – original draft, Methodology, Software. J-XX: Software, Writing – original draft, Methodology. D-PH: Writing – review & editing, Supervision, Data curation, Methodology, Conceptualization, Investigation. H-XW: Writing – review & editing, Supervision, Funding acquisition, Writing – original draft, Conceptualization.
Funding
The author(s) declared that financial support was received for this work and/or its publication. This study was funded by the Project Grant No. ZR2021MH159 supported by the Shandong Provincial Natural Science Foundation.
Acknowledgments
We thank Onekey AI platform (http://www.medai.icu/) and its developers for providing Python technical guidance. We also thank Liwen Bianji (Edanz) (https://www.liwenbianji.cn) for editing the language of a draft of this manuscript.
Conflict of interest
C-CH, J-XX was employed by company Beijing Deepwise & League of Philosophy Doctor PHDTechnology Co., Ltd.
The remaining author(s) declared that this work was conducted in the absence of any commercial or financial relationships that could be construed as a potential conflict of interest.
Generative AI statement
The author(s) declared that generative AI was not used in the creation of this manuscript.
Any alternative text (alt text) provided alongside figures in this article has been generated by Frontiers with the support of artificial intelligence and reasonable efforts have been made to ensure accuracy, including review by the authors wherever possible. If you identify any issues, please contact us.
Publisher’s note
All claims expressed in this article are solely those of the authors and do not necessarily represent those of their affiliated organizations, or those of the publisher, the editors and the reviewers. Any product that may be evaluated in this article, or claim that may be made by its manufacturer, is not guaranteed or endorsed by the publisher.
Supplementary material
The Supplementary Material for this article can be found online at: https://www.frontiersin.org/articles/10.3389/fonc.2025.1619704/full#supplementary-material
Abbreviations
STS, soft tissue sarcoma; FNCLCC, Fédération Nationale des Centres de Lutte Contre le Cancer; NCI, National Cancer Institute; PFS, progression-free-survival; FS-T2WI, fat-suppressed T2 weighted imaging; CE-T1WI, contrast enhanced fat-suppressed T1 weighted imaging; RPRS, radiomics progression risk score; IBS, integrated Brier score; C-index, concordance index.
References
1. Siegel R, Naishadham D, and Jemal A. Cancer statistics, 2012. CA Cancer J Clin. (2012) 62:10–29. doi: 10.3322/caac.20138
2. Hansen T, Katenkamp K, Brodhun M, and Katenkamp D. Low-grade fibrosarcoma–report on 39 not otherwise specified cases and comparison with defined low-grade fibrosarcoma types. Histopathology. (2006) 49:152–60. doi: 10.1111/j.1365-2559.2006.02480.x
3. Tan MC, Brennan MF, Kuk D, Agaram NP, Antonescu CR, Qin LX, et al. Histology-based classification predicts pattern of recurrence and improves risk stratification in primary retroperitoneal sarcoma. Ann Surg. (2016) 263:593–600. doi: 10.1097/sla.0000000000001149
4. MacDermed DM, Miller LL, Peabody TD, Simon MA, Luu HH, Haydon RC, et al. Primary tumor necrosis predicts distant control in locally advanced soft-tissue sarcomas after preoperative concurrent chemoradiotherapy. Int J Radiat Oncol Biol Phys. (2010) 76:1147–53. doi: 10.1016/j.ijrobp.2009.03.015
5. Callegaro D, Miceli R, Mariani L, Raut CP, and Gronchi A. Soft tissue sarcoma nomograms and their incorporation into practice. Cancer. (2017) 123:2802–20. doi: 10.1002/cncr.30721
6. Italiano A, Le Cesne A, Mendiboure J, Blay JY, Piperno-Neumann S, Chevreau C, et al. Prognostic factors and impact of adjuvant treatments on local and metastatic relapse of soft-tissue sarcoma patients in the competing risks setting. Cancer. (2014) 120:3361–9. doi: 10.1002/cncr.28885
7. Maretty-Nielsen K, Aggerholm-Pedersen N, Safwat A, Jørgensen PH, Hansen BH, Baerentzen S, et al. Prognostic factors for local recurrence and mortality in adult soft tissue sarcoma of the extremities and trunk wall: a cohort study of 922 consecutive patients. Acta Orthop. (2014) 85:323–32. doi: 10.3109/17453674.2014.908341
8. Liu S, Sun W, Yang S, Duan L, Huang C, Xu J, et al. Deep learning radiomic nomogram to predict recurrence in soft tissue sarcoma: a multi-institutional study. Eur Radiol. (2022) 32:793–805. doi: 10.1007/s00330-021-08221-0
9. Aerts HJ. The potential of radiomic-based phenotyping in precision medicine: A review. JAMA Oncol. (2016) 2:1636–42. doi: 10.1001/jamaoncol.2016.2631
10. Tagliafico AS, Bignotti B, Rossi F, Valdora F, and Martinoli C. Local recurrence of soft tissue sarcoma: a radiomic analysis. Radiol Oncol. (2019) 53:300–6. doi: 10.2478/raon-2019-0041
11. Vallières M, Freeman CR, Skamene SR, and El Naqa I. A radiomics model from joint FDG-PET and MRI texture features for the prediction of lung metastases in soft-tissue sarcomas of the extremities. Phys Med Biol. (2015) 60:5471–96. doi: 10.1088/0031-9155/60/14/5471
12. Spraker MB, Wootton LS, Hippe DS, Ball KC, Peeken JC, Macomber MW, et al. MRI radiomic features are independently associated with overall survival in soft tissue sarcoma. Adv Radiat Oncol. (2019) 4:413–21. doi: 10.1016/j.adro.2019.02.003
13. Crombé A, Périer C, Kind M, De Senneville BD, Le Loarer F, Italiano A, et al. T(2) -based MRI Delta-radiomics improve response prediction in soft-tissue sarcomas treated by neoadjuvant chemotherapy. J Magn Reson Imaging. (2019) 50:497–510. doi: 10.1002/jmri.26589
14. Gatenby RA, Grove O, and Gillies RJ. Quantitative imaging in cancer evolution and ecology. Radiology. (2013) 269:8–15. doi: 10.1148/radiol.13122697
15. Even AJG, Reymen B, La Fontaine MD, Das M, Mottaghy FM, Belderbos JSA, et al. Clustering of multi-parametric functional imaging to identify high-risk subvolumes in non-small cell lung cancer. Radiother Oncol. (2017) 125:379–84. doi: 10.1016/j.radonc.2017.09.041
16. Zhou M, Chaudhury B, Hall LO, Goldgof DB, Gillies RJ, and Gatenby RA. Identifying spatial imaging biomarkers of glioblastoma multiforme for survival group prediction. J Magn Reson Imaging. (2017) 46:115–23. doi: 10.1002/jmri.25497
17. Rathore S, Chaddad A, Iftikhar MA, Bilello M, and Abdulkadir A. Combining MRI and histologic imaging features for predicting overall survival in patients with glioma. Radiol Imaging Cancer. (2021) 3:e200108. doi: 10.1148/rycan.2021200108
18. Verma R, Correa R, Hill VB, Statsevych V, Bera K, Beig N, et al. Tumor Habitat-derived Radiomic Features at Pretreatment MRI That Are Prognostic for Progression-free Survival in Glioblastoma Are Associated with Key Morphologic Attributes at Histopathologic Examination: A Feasibility Study. Radiol Artif Intell. (2020) 2:e190168. doi: 10.1148/ryai.2020190168
19. Gu Y, She Y, Xie D, Dai C, Ren Y, Fan Z, et al. A texture analysis-based prediction model for lymph node metastasis in stage IA lung adenocarcinoma. Ann Thorac Surg. (2018) 106:214–20. doi: 10.1016/j.athoracsur.2018.02.026
20. Zhong Y, Yuan M, Zhang T, Zhang YD, Li H, and Yu TF. Radiomics approach to prediction of occult mediastinal lymph node metastasis of lung adenocarcinoma. AJR Am J Roentgenol. (2018) 211:109–13. doi: 10.2214/ajr.17.19074
21. Braman N, Prasanna P, Whitney J, Singh S, Beig N, Etesami M, et al. Association of peritumoral radiomics with tumor biology and pathologic response to preoperative targeted therapy for HER2 (ERBB2)-positive breast cancer. JAMA Netw Open. (2019) 2:e192561. doi: 10.1001/jamanetworkopen.2019.2561
22. Wang T, She Y, Yang Y, Liu X, Chen S, Zhong Y, et al. Radiomics for survival risk stratification of clinical and pathologic stage IA pure-solid non-small cell lung cancer. Radiology. (2022) 302:425–34. doi: 10.1148/radiol.2021210109
23. Madabhushi A and Udupa JK. New methods of MR image intensity standardization via generalized scale. Med Phys. (2006) 33:3426–34. doi: 10.1118/1.2335487
24. Orlhac F, Frouin F, Nioche C, Ayache N, and Buvat I. Validation of A method to compensate multicenter effects affecting CT radiomics. Radiology. (2019) 291:53–9. doi: 10.1148/radiol.2019182023
25. Schröder MS, Culhane AC, Quackenbush J, and Haibe-Kains B. survcomp: an R/Bioconductor package for performance assessment and comparison of survival models. Bioinformatics. (2011) 27:3206–8. doi: 10.1093/bioinformatics/btr511
26. Cohen ME, Ko CY, Bilimoria KY, Zhou L, Huffman K, Wang X, et al. Optimizing ACS NSQIP modeling for evaluation of surgical quality and risk: patient risk adjustment, procedure mix adjustment, shrinkage adjustment, and surgical focus. J Am Coll Surg. (2013) 217:336–46.e1. doi: 10.1016/j.jamcollsurg.2013.02.027
27. Camp RL, Dolled-Filhart M, and Rimm DL. X-tile: a new bio-informatics tool for biomarker assessment and outcome-based cut-point optimization. Clin Cancer Res. (2004) 10:7252–9. doi: 10.1158/1078-0432.Ccr-04-0713
28. Hu Y, Xie C, Yang H, Ho JWK, Wen J, Han L, et al. Assessment of intratumoral and peritumoral computed tomography radiomics for predicting pathological complete response to neoadjuvant chemoradiation in patients with esophageal squamous cell carcinoma. JAMA Netw Open. (2020) 3:e2015927. doi: 10.1001/jamanetworkopen.2020.15927
29. Zheng B, Wang J, Cai W, Lao I, Shi Y, Luo X, et al. Changes in the tumor immune microenvironment in resected recurrent soft tissue sarcomas. Ann Transl Med. (2019) 7:387. doi: 10.21037/atm.2019.07.43
30. Dou TH, Coroller TP, van Griethuysen JJM, Mak RH, and Aerts H. Peritumoral radiomics features predict distant metastasis in locally advanced NSCLC. PloS One. (2018) 13:e0206108. doi: 10.1371/journal.pone.0206108
31. O'Connor JP, Rose CJ, Waterton JC, Carano RA, Parker GJ, and Jackson A. Imaging intratumor heterogeneity: role in therapy response, resistance, and clinical outcome. Clin Cancer Res. (2015) 21:249–57. doi: 10.1158/1078-0432.Ccr-14-0990
32. Lee DH, Park JE, Kim N, Park SY, Kim YH, Cho YH, et al. Tumor habitat analysis by magnetic resonance imaging distinguishes tumor progression from radiation necrosis in brain metastases after stereotactic radiosurgery. Eur Radiol. (2022) 32:497–507. doi: 10.1007/s00330-021-08204-1
33. Jeong SY, Park JE, Kim N, and Kim HS. Hypovascular cellular tumor in primary central nervous system lymphoma is associated with treatment resistance: tumor habitat analysis using physiologic MRI. AJNR Am J Neuroradiol. (2022) 43:40–7. doi: 10.3174/ajnr.A7351
34. Koshy M, Rich SE, and Mohiuddin MM. Improved survival with radiation therapy in high-grade soft tissue sarcomas of the extremities: a SEER analysis. Int J Radiat Oncol Biol Phys. (2010) 77:203–9. doi: 10.1016/j.ijrobp.2009.04.051
Keywords: habitat imaging, magnetic resonance imaging, progression, radiomics nomogram, soft tissue sarcoma
Citation: Liang H-Y, Gao C-p, Zhang M, Yang S-F, Hou F, Duan L-S, Huang Y-H, Huang C-C, Xu J-X, Hao D-P and Wang H-X (2026) Intratumoral habitat and peritumor radiomics for progression risk stratification of patients with soft tissue sarcoma: a multicenter study. Front. Oncol. 15:1619704. doi: 10.3389/fonc.2025.1619704
Received: 28 April 2025; Accepted: 29 December 2025; Revised: 30 November 2025;
Published: 19 January 2026.
Edited by:
Paolo Spinnato, Rizzoli Orthopedic Institute (IRCCS), ItalyReviewed by:
Balázs Bogner, University of Freiburg Medical Center, GermanyHongyu Wang, Lanzhou University Second Hospital, China
Copyright © 2026 Liang, Gao, Zhang, Yang, Hou, Duan, Huang, Huang, Xu, Hao and Wang. This is an open-access article distributed under the terms of the Creative Commons Attribution License (CC BY). The use, distribution or reproduction in other forums is permitted, provided the original author(s) and the copyright owner(s) are credited and that the original publication in this journal is cited, in accordance with accepted academic practice. No use, distribution or reproduction is permitted which does not comply with these terms.
*Correspondence: Da-Peng Hao, aGFvZHAyMDIxQHFkdS5lZHUuY24=; He-Xiang Wang, d2FuZ2hleGlhbmdAcWR1LmVkdS5jbg==
†These authors have contributed equally to this work and share first authorship