 Shulin Huang
 Xudong Hu
 Lingjuan Hu2
 Tingting Du
- 1The Second Clinical College of Guangzhou University of Chinese Medicine, Guangzhou, Guangdong, China
- 2Department of Gynecology, The Second Affiliated Hospital of Guangzhou University of Chinese Medicine, Guangzhou, Guangdong, China
- 3State Key Laboratory of Traditional Chinese Medicine Syndrome/Department of Gynecology, The Second Affiliated Hospital of Guangzhou University of Chinese Medicine, Guangzhou, Guangdong, China
Objective: To develop and validate a diagnostic nomogram model for predicting atypical endometrial hyperplasia (AEH) and endometrial carcinoma (EC) in women aged 40–60 years with abnormal uterine bleeding (AUB), incorporating detailed bleeding patterns and clinical parameters.
Methods: This retrospective cohort study included 1,920 patients aged 40–60 years with AUB who underwent hysteroscopic evaluation across four hospital branches from 2021 to 2024. Variables were screened via univariate logistic regression followed by LASSO regression. A multivariate logistic regression model was constructed using seven selected predictors, including age, family history of cancer, endometrial thickness, menstrual blood loss, abnormal menstrual duration, intermenstrual bleeding, and postmenopausal bleeding. Internal validation was performed using bootstrap resampling; external validation was conducted using an independent cohort.
Results: The final model demonstrated good discriminatory performance (AUC = 0.814 in the training cohort, 0.762 in external validation). Calibration plots and the Hosmer–Lemeshow test indicated good agreement between predicted and observed probabilities. Decision curve analysis confirmed favorable clinical utility. Patients classified as high-risk (score ≥70.362) had a significantly increased likelihood of AEH/EC (OR = 12.46, 95% CI: 7.56–21.01, P < 0.001).
Conclusion: This study presents a validated, user-friendly nomogram integrating refined AUB patterns and clinical variables to support early risk stratification for AEH/EC in women aged 40–60 years. The model demonstrates robust predictive performance and may assist in guiding individualized diagnostic strategies, particularly in resource-limited settings.
1 Introduction
Endometrial cancer is the second most common malignancy of the female reproductive tract and has become the most prevalent gynecologic cancer in developed countries, with its steadily increasing incidence (1).This disease poses a significant threat to women’s health. While some early-stage cases may be asymptomatic and clinically elusive, approximately 90% of patients present with abnormal vaginal bleeding as the initial symptom. Epidemiological data indicate that 10% to 15% of perimenopausal women presenting with abnormal uterine bleeding (AUB) are eventually diagnosed with endometrial cancer, for which AUB often serves as an early clinical manifestation (2).Given the rising disease burden, developing an efficient and accurate preoperative risk assessment strategy for women aged 40–60 years with AUB is of great clinical importance.
Transvaginal color Doppler ultrasound serves as a valuable adjunct in the diagnostic evaluation of gynecological diagnosis, offering advantages of convenience, non-invasiveness, and cost-effectiveness. However, its diagnostic accuracy for endometrial lesions remains highly operator-dependent. Currently, the definitive diagnosis of malignant endometrial lesions relies primarily on histopathological evaluation of endometrial tissue. Given the invasiveness of biopsy, early and noninvasive identification of high-risk individuals is essential to minimize unnecessary interventions in benign cases and improve clinical decision-making. Nomograms based on multivariate regression models been widely adopted in clinical practice for disease risk stratification and are increasingly recognized for their utility in oncologic diagnostics, prognostication, and personalized medicine (3). Previous studies have identified that various clinical variables—such as age, body mass index (BMI), family history of cancer, endometrial thickness (ET), and serum carbohydrate antigen 125 (CA125) levels—as independent predictors of endometrial carcinoma (4). However, most existing studies have focused on individual indicators or conventional clinical factors such as age, obesity, and menopausal status, while overlooking AUB patterns—specifically frequency, regularity, and duration—as potential risk factors.
Therefore, this study incorporated AUB patterns with laboratory findings and sonographic features, to systematically identify independent risk factors for endometrial atypical hyperplasia and endometrial cancer. We further assessed the diagnostic performance of each predictor and developed a clinically applicable diagnostic model based on refined bleeding patterns to facilitate early detection and precise management of premalignant endometrial lesions and endometrial carcinoma.
2 Materials and methods
This retrospective study analyzed data from patients hospitalized for AUB who underwent hysteroscopic examination between January 2021 and January 2024 at four campuses of Guangdong Provincial Hospital of Chinese Medicine (GPHCM), including the Da De Road Main Campus, University Town Hospital, Ersha Island Hospital, and Fangcun Hospital in Guangzhou, China. The study design and flow are illustrated in Figure 1. Given that each hospital campus operates independently with separate clinical teams and management protocols, we stratified the data by hospital. Cases from University Town, Ersha Island, and Fangcun campuses were used as the training cohort for model development, while cases from the Da De Road Main Campus served as the external validation cohort to assess the model’s applicability and generalizability. This study protocol was approved by the Ethics Committee of GPHCM (Approval to YE2025-307-01).
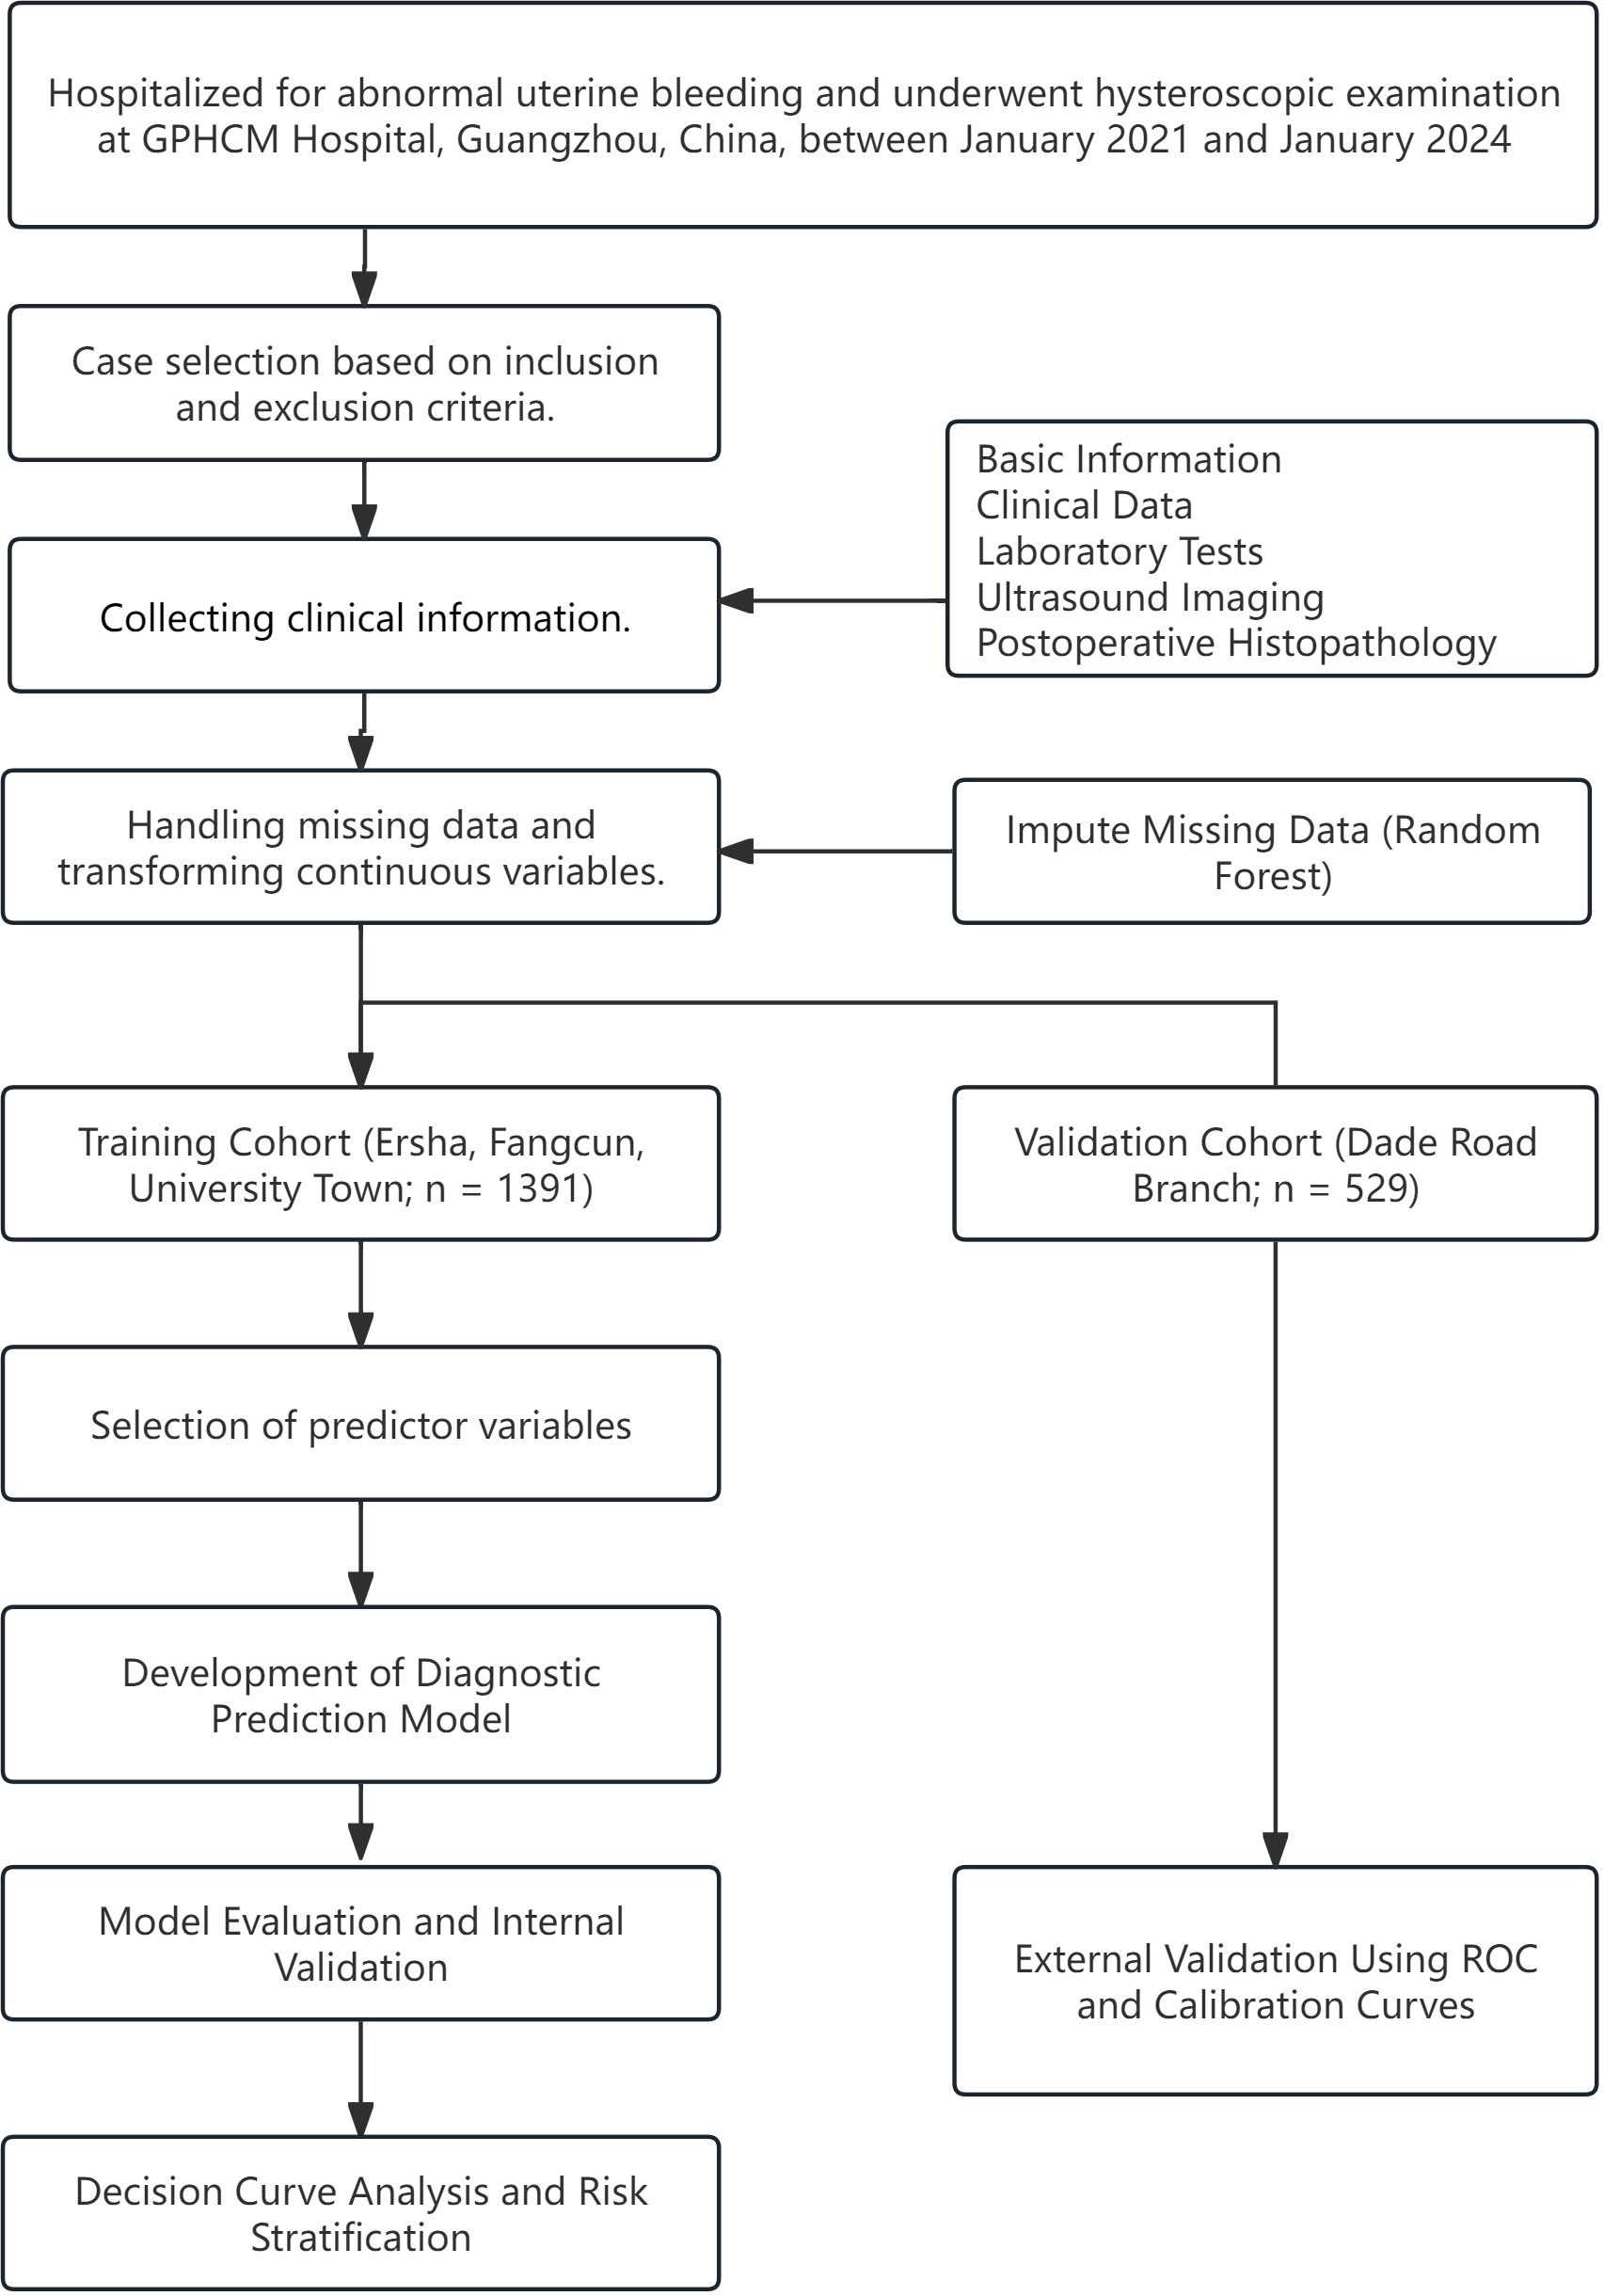
Figure 1. Flowchart of the study design.
2.1 Inclusion and exclusion criteria
Diagnostic Criteria: AUB refers to bleeding from the uterine cavity that deviates from the normal menstrual cycle in terms of frequency, regularity, duration, or volume. According to the International Federation of Gynecology and Obstetrics (FIGO), AUB etiologies are classified using the PALM-COEIN system (5). The “PALM” group represents structural abnormalities identifiable via imaging or histopathology, including endometrial polyps (P), adenomyosis (A), leiomyoma (L), and malignancy or atypical hyperplasia (M). In this study, only structural causes under the PALM category were included, specifically focusing on submucosal fibroids protruding into the uterine cavity and endometrial atypical hyperplasia or carcinoma. Non-structural causes classified under the COEIN group were excluded.
Inclusion Criteria:
1. Women aged 40 to 60 years;
2. Underwent preoperative transvaginal ultrasonography;
3. Received diagnostic curettage under hysteroscopy;
4. Had Complete surgical records and confirmed histopathological results.
Exclusion Criteria:
1. Vaginal bleeding caused by lesions of the vulva, vagina, cervix, or other non-uterine reproductive tract sources;
2. Bleeding secondary to systemic coagulopathy;
3. History of other systemic malignancies;
4. Drug-induced bleeding possibly caused by medications used within the past month;
5. Incomplete or missing medical records.
2.2 Data collection and definition
Data were independently reviewed and recorded by two researchers in a back-to-back manner. Any discrepancies were resolved through cross-verification and adjudicated by a third researcher. The collected clinical date included:
1. Basic Information: Age, Serum CA125 level, Height, Weight, BMI, Gravidity, Parity, Number of abortions, Hypertension, Hyperlipidemia, Type 2 diabetes mellitus, Family history of cancer.
2. Menstrual History: Menarche age, Menstrual blood loss(Menstrual blood loss was evaluated using the Pictorial Blood Loss Assessment Chart (6) and categorized into three groups: Heavy menstrual bleeding, Normal menstrual bleeding, Light menstrual bleeding.), Menstrual blood color, Menopause.
3. Transvaginal Ultrasonography Findings: Overall uterine volume (calculated using the prolate ellipsoid method (7), Volume=length×depth×width×0.523), Endometrial thickness, Endometrial texture, Color doppler flow imaging(CDFI) of endometrium.
4. AUB Patterns: Data on AUB patterns were collected through a standardized clinician-administered questionnaire at the time of patient evaluation. AUB patterns were categorized based on clinical data and the FIGO PALM-COEIN classification system (Table 1).
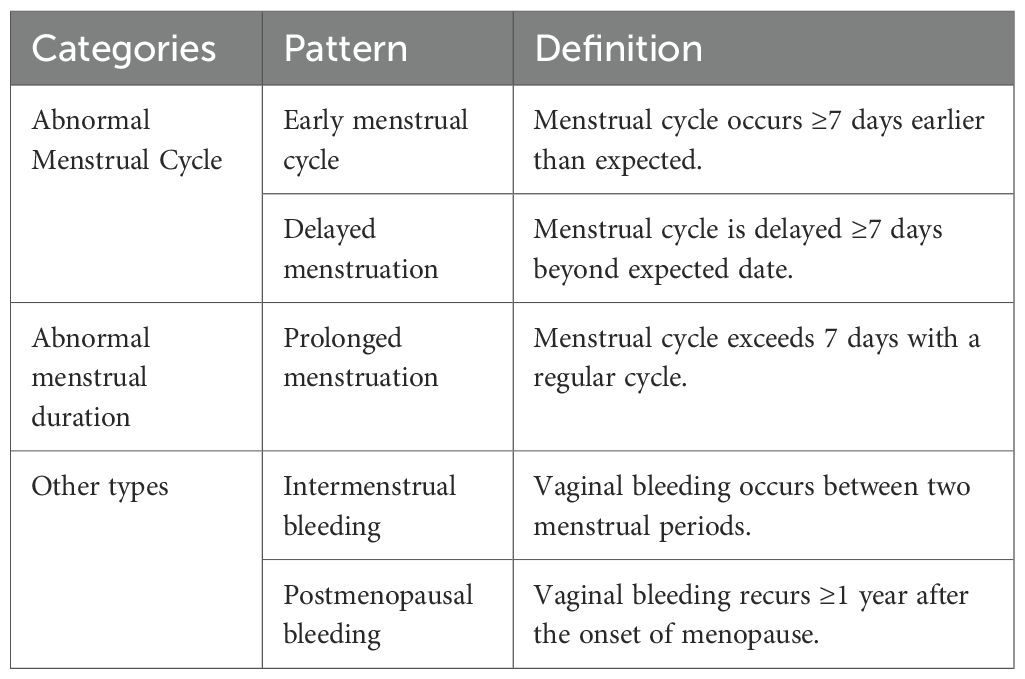
Table 1. Definition of AUB patterns.
2.3 Study grouping
Participants were classified into two groups based on the histopathological results of hysteroscopic diagnostic curettage:
Group A: Included cases with normal endometrial tissues -such as proliferative endometrium, secretory endometrium, menstrual endometrium, atrophic endometrium, and fragmented endometrial glands- endometritis, endometrial polyps, adenomyosis, submucosal uterine fibroids, and non-atypical hyperplasia.
Group B: Included cases with atypical endometrial hyperplasia (AEH) or endometrial carcinoma (EC).
2.4 Statistical analysis
Data were analyzed using R software (version 4.4.2) (8). Missing data constituted less than 0.1% and were imputed using the random forest algorithm in the “missForest” package. Categorical variables were presented as percentages and compared using the chi-square test. Normally distributed continuous variables were expressed as mean ± SD and compared using the independent samples t-test. Non-normally distributed variables were reported as medians (Q1, Q3) and compared using the Mann–Whitney U test.
2.4.1 Variable selection and nomogram construction
In the training cohort, all variables were initially considered as potential predictors using univariate logistic regression analysis. Variables with a P-value <0.1 were then subjected to least absolute shrinkage and selection operator (LASSO) regression for feature selection. The optimal penalty parameter (λ) was determined via cross-validation based on the minimum criteria to ensure an optimal balance between model complexity and predictive performance. Subsequently, a multivariable logistic regression model was constructed to develop a diagnostic nomogram for estimating the risk of AEH/EC.
2.4.2 Assessment of nomogram performance and clinical utility
The predictive performance of the nomogram was evaluated by calculating the area under the receiver operating characteristic (ROC) curve (AUC). Internal validation was conducted using the bootstrap resampling method (1,000 iterations) to estimate the 95% confidence intervals (CIs). Model calibration was assessed using the Hosmer–Lemeshow goodness-of-fit test and visualized via calibration plots. External validation was performed by applying the model to the independent validation cohort, generating ROC and calibration curves to examine generalizability. Based on the optimal cut-off value identified from the ROC analysis, patients were stratified into high- and low-risk groups. The incidence of endometrial premalignant and malignant lesions was compared between groups, and the discriminatory capability of the model in clinical stratification was further quantified using odds ratios (ORs). Finally, decision curve analysis (DCA) was conducted to evaluate the net clinical benefit and applicability of the model across a range of threshold probabilities.
3 Result
A total of 1,920 patients met the predefined inclusion and exclusion criteria and were enrolled in the study, with 1,391 allocated to the training cohort and 529 to the validation cohort. Baseline demographic and clinical characteristics of both cohorts are presented in Table 2.
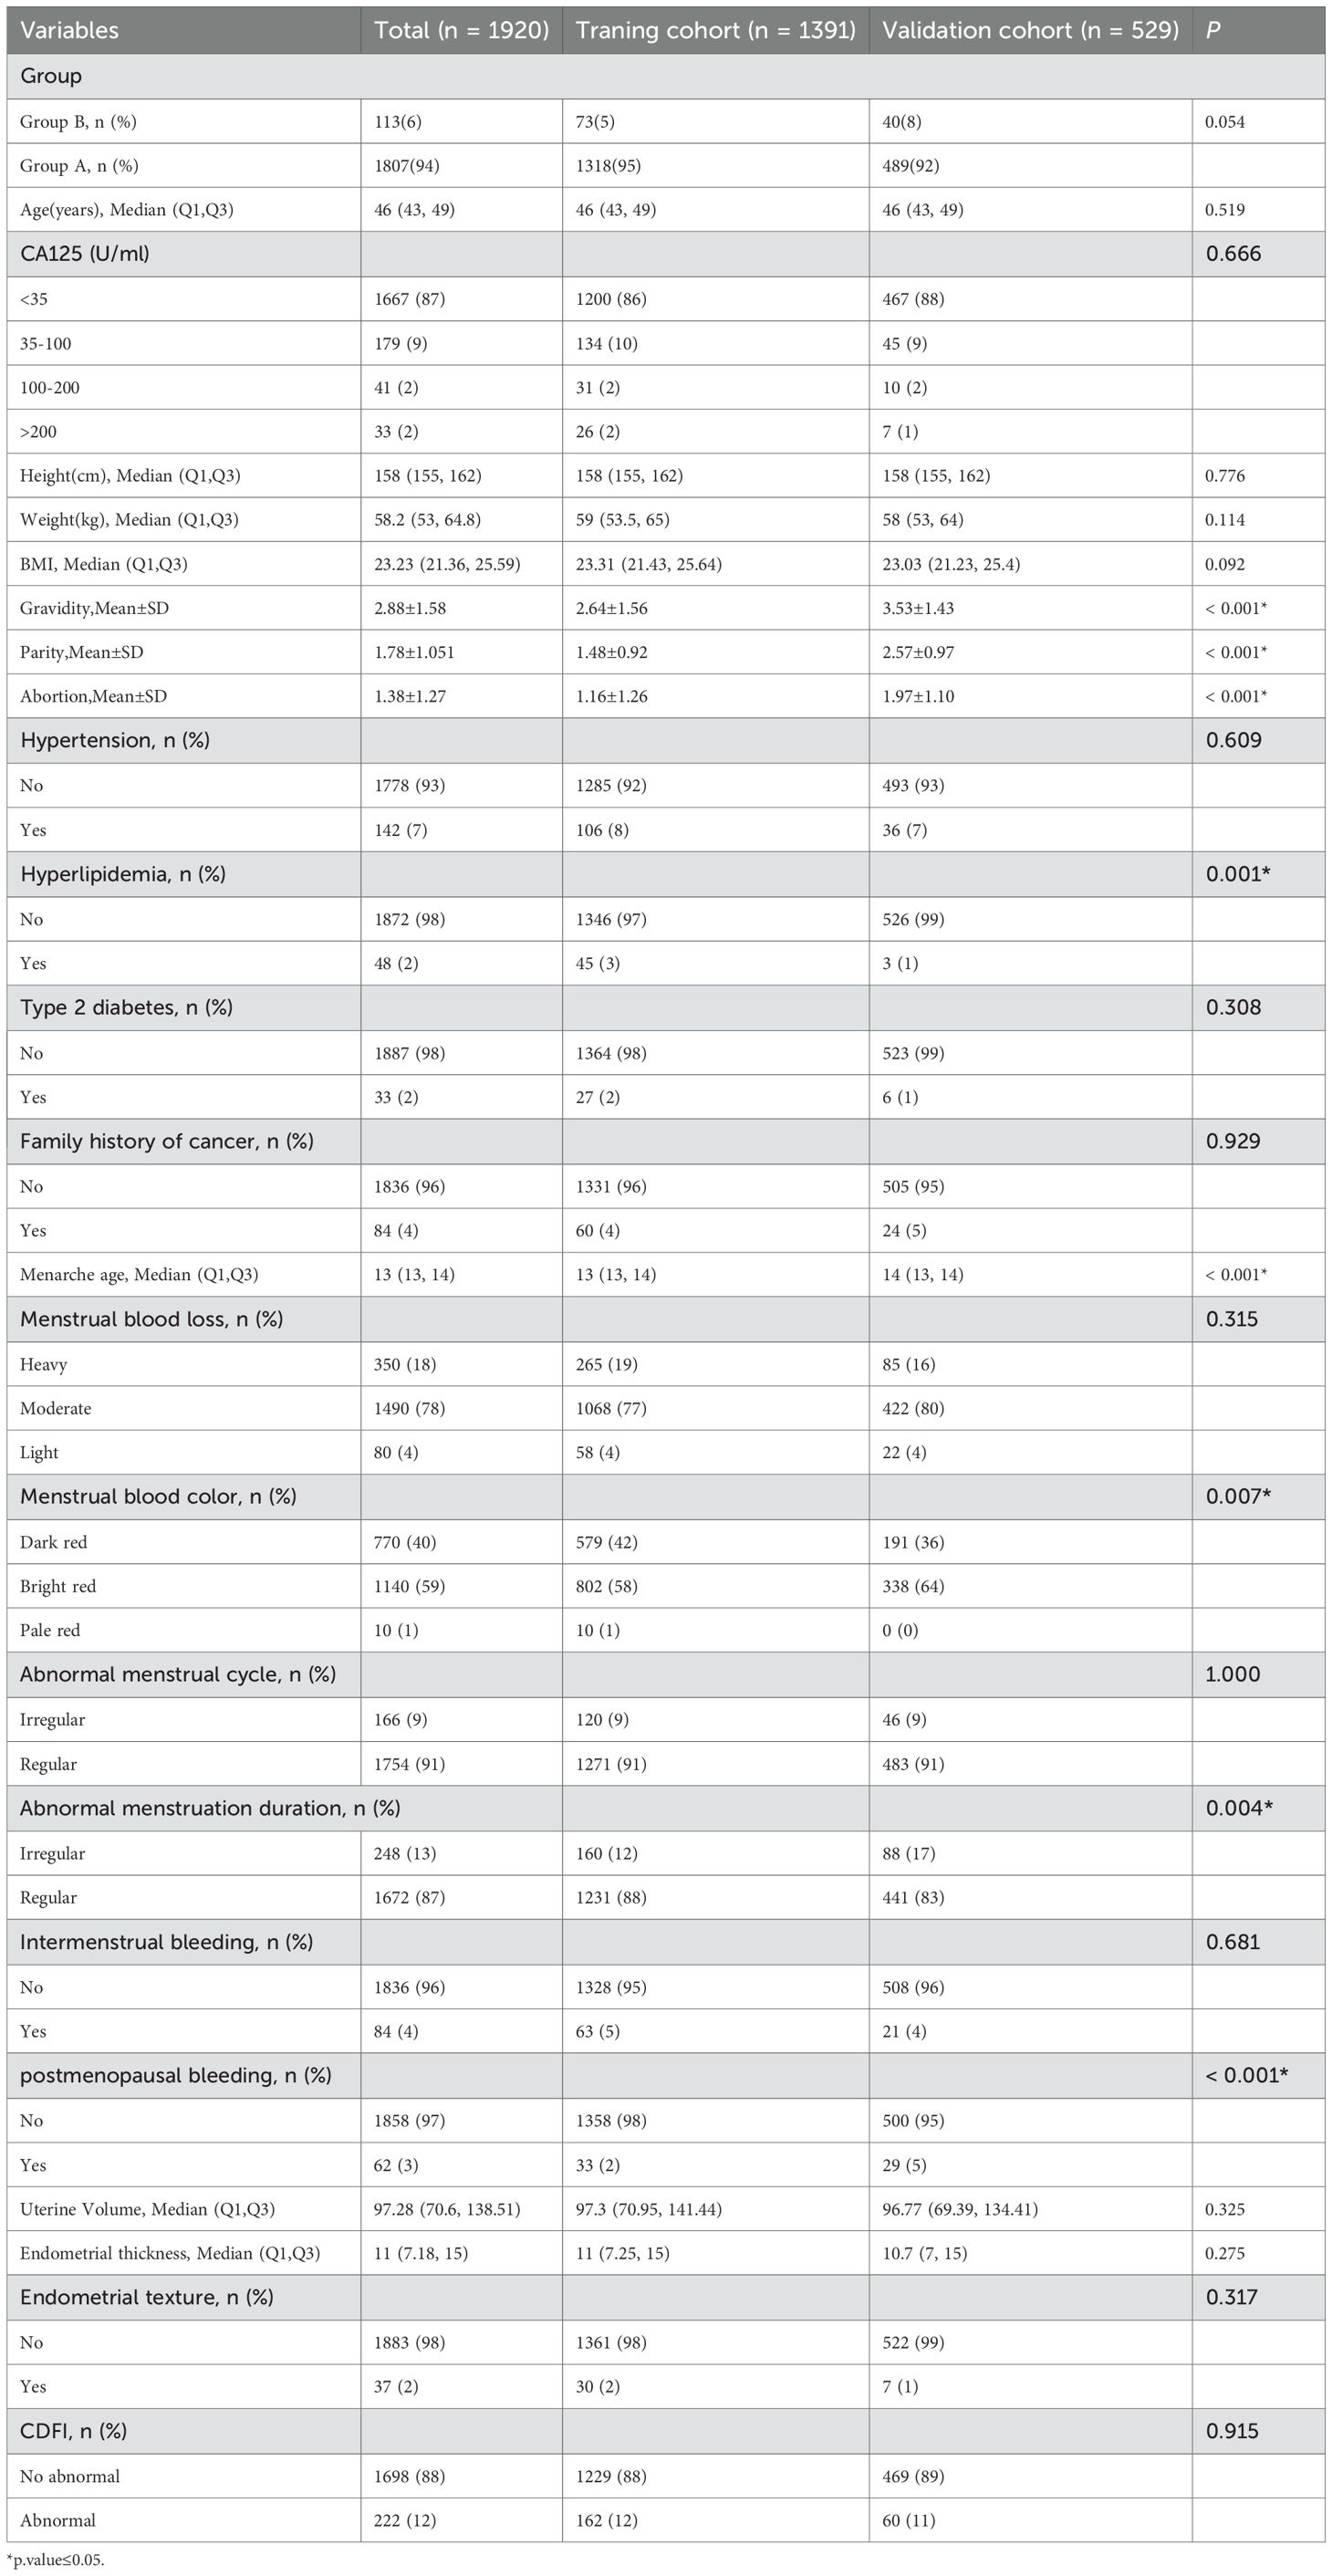
Table 2. Baseline characteristics of the training and testing cohorts.
3.1 Univariate analysis
To identify potential predictors associated with the outcome, all candidate variables were subjected to univariate logistic regression analysis (Table 3). Variables with a p-value < 0.1 were then assessed for discriminatory performance by constructing ROC curves, with corresponding AUC values calculated (Figure 2). The results indicated that none of the individual predictors demonstrated strong predictive ability for AEH/EC (0.4 < AUC < 0.7).
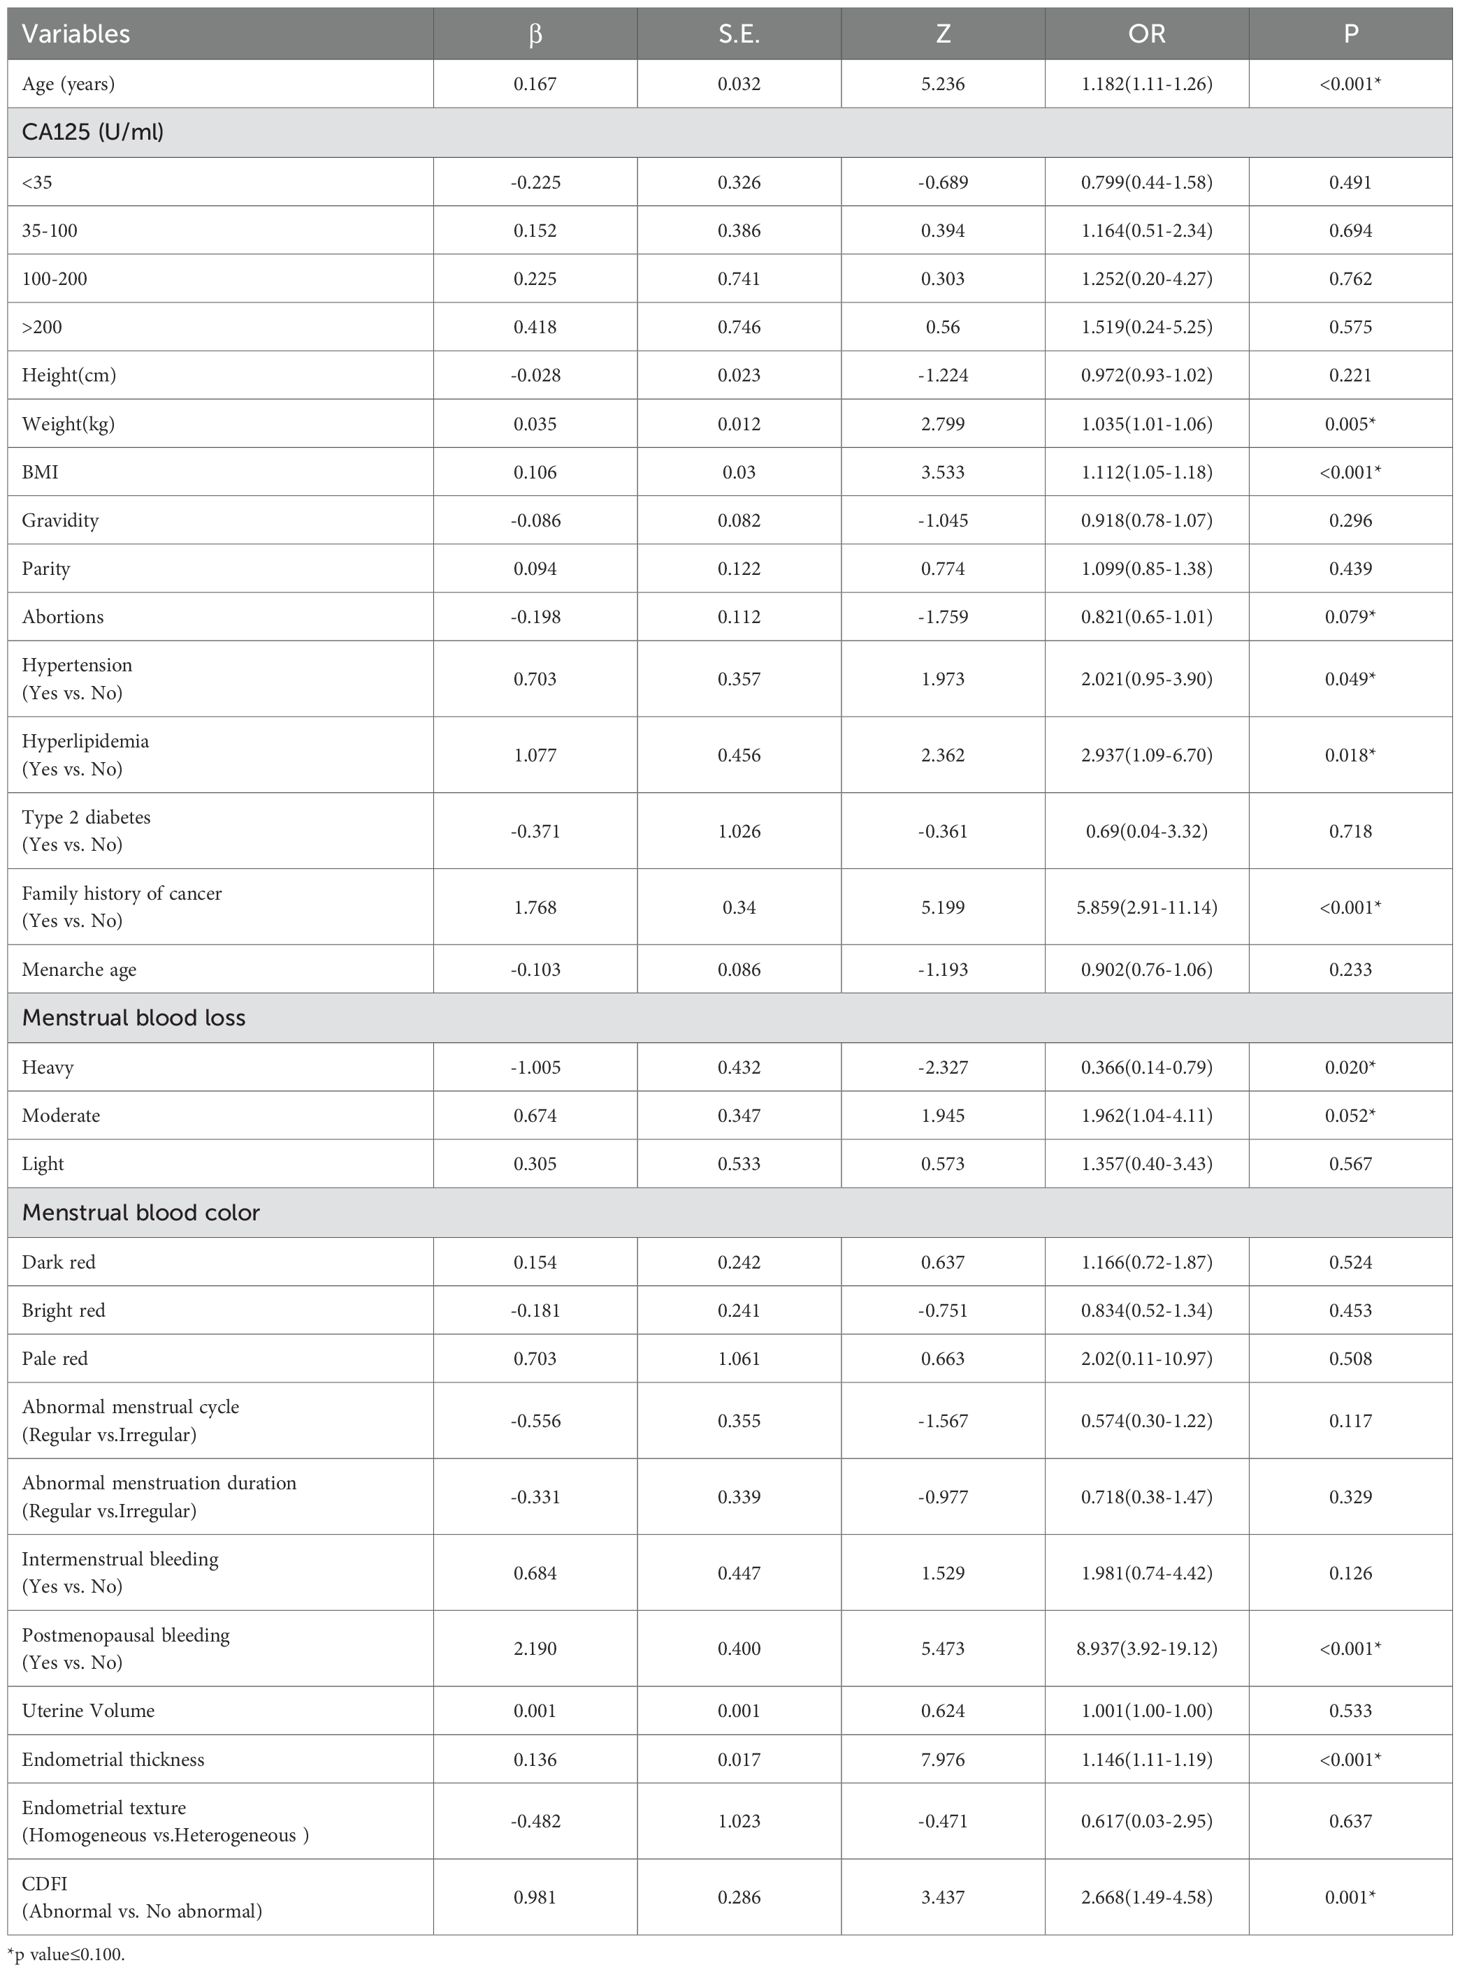
Table 3. Univariate logistic regression analysis of risk.
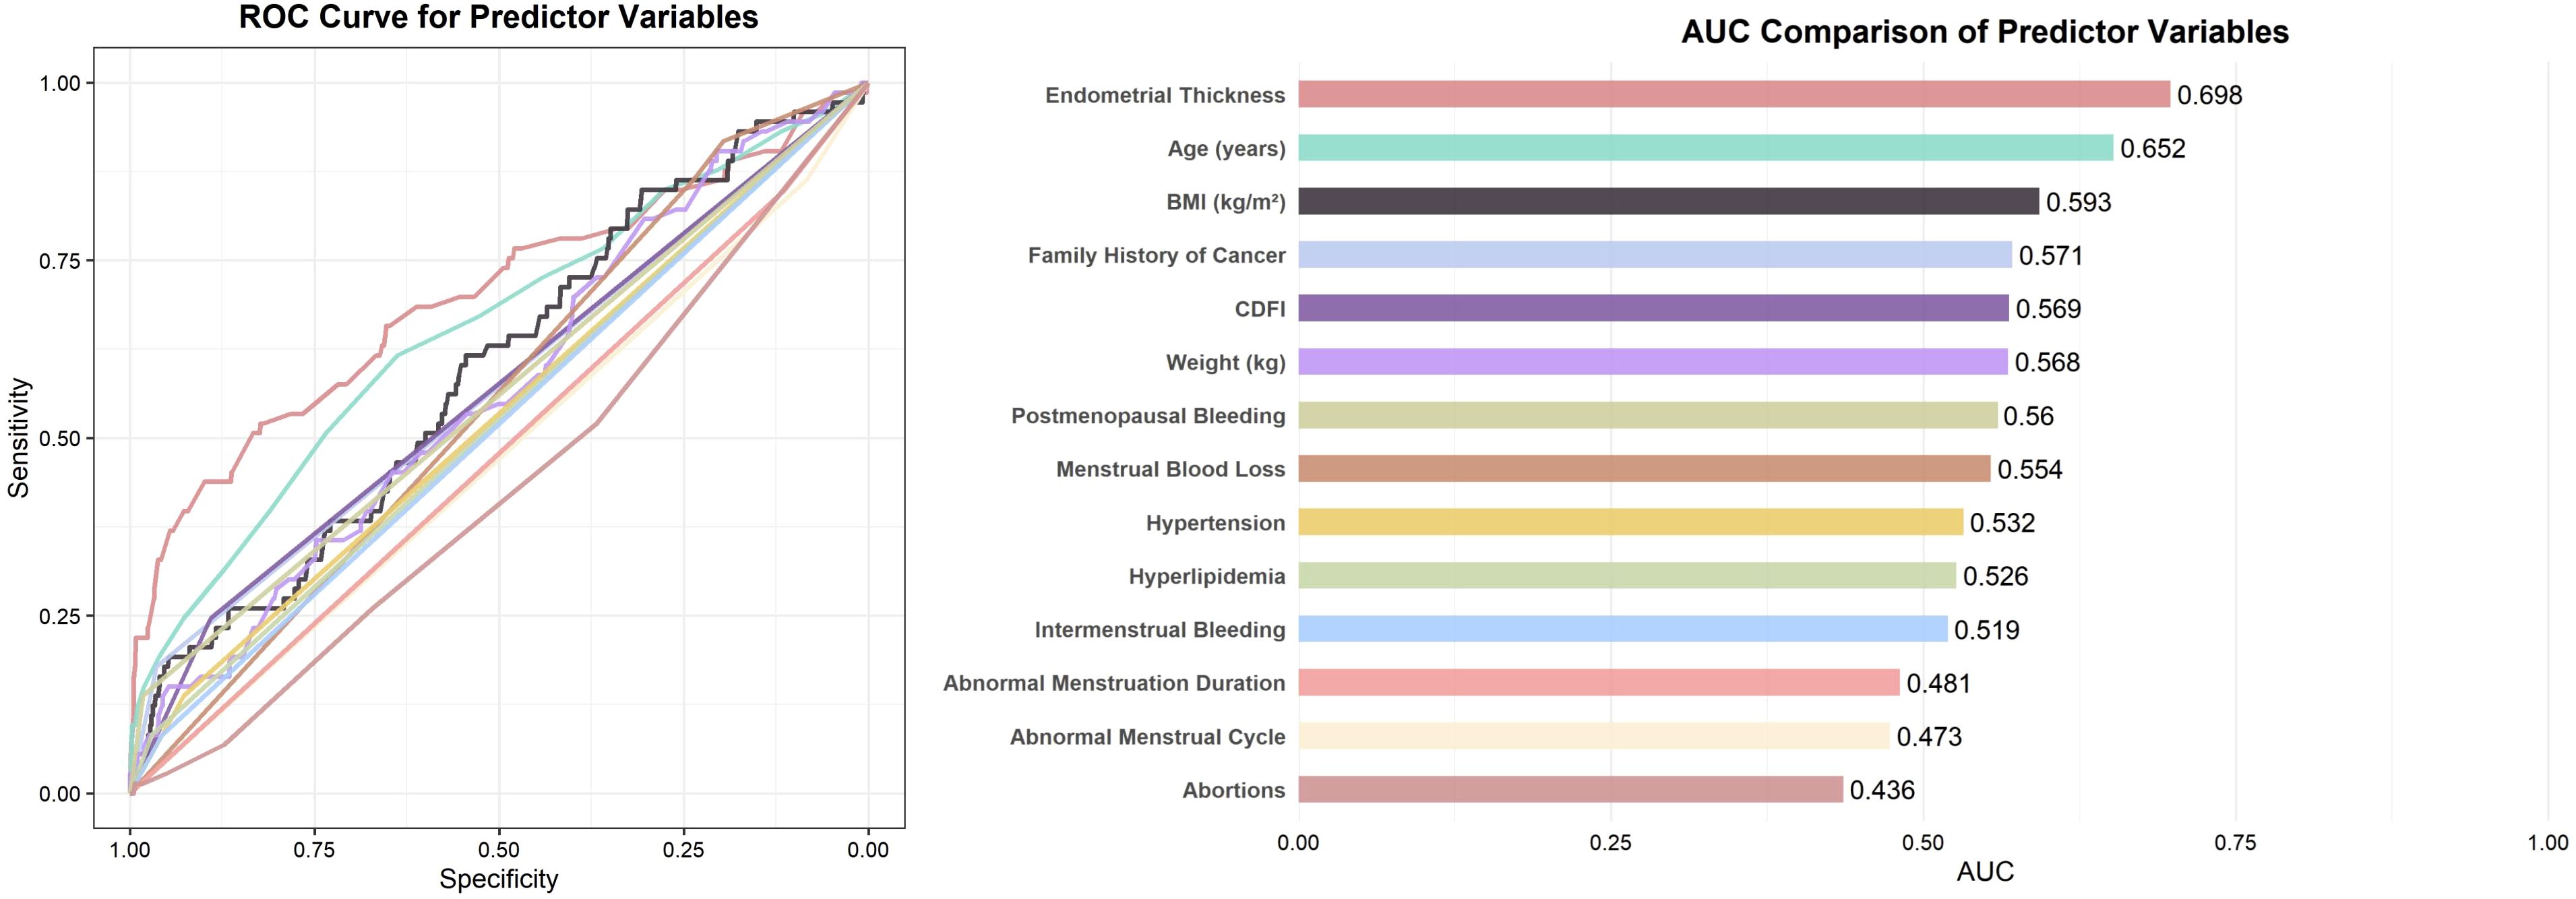
Figure 2. ROC curves and AUC comparison of predictor variables with p < 0.1. Note: For variables with AUC < 0.5, the association direction was opposite to the reference category (e.g., “Yes” vs. “No”); their effective discrimination can be interpreted as 1 − AUC.
3.2 Selection of model variables
Based on the univariate logistic regression analysis, variables with a p-value < 0.1 were further subjected to LASSO regression. When the penalty parameter λ = 0.0008797404, the model achieved optimal performance with minimal variable inclusion. The selected non-zero coefficient variables included age, family history of cancer, endometrial thickness, and postmenopausal bleeding (Figure 3). Considering clinical relevance, four additional variables-menstrual blood loss, abnormal menstrual cycle, abnormal duration of menstruation, and intermenstrual bleeding—were incorporated into the multivariable logistic regression model. The result of the multivariable analysis revealed that older age, positive family history of malignancy, increased endometrial thickness, intermenstrual bleeding, and abnormal menstrual duration were all independently associated with a higher risk of AEH/EC. In contrast, heavier menstrual bleeding was negatively associated with malignancy risk (Table 4).

Figure 3. LASSO regression for feature selection with cross-validation.
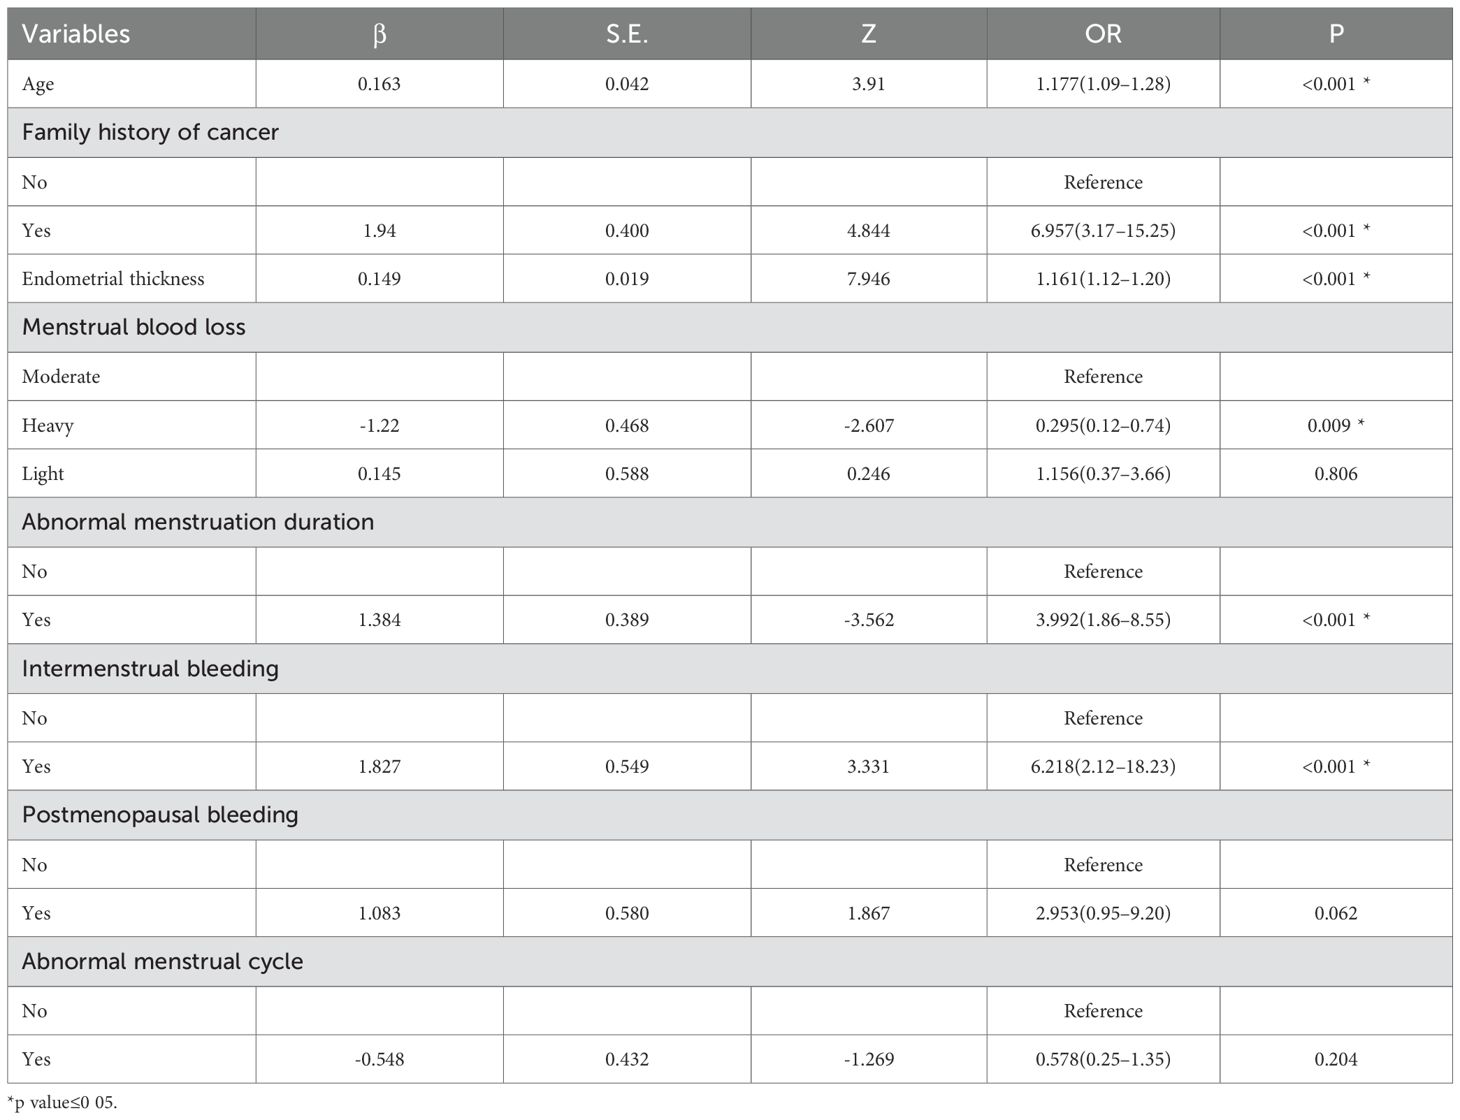
Table 4. Multivariate logistic regression analysis of risk.
3.3 Construction and validation of the predictive model
A diagnostic nomogram was constructed to estimate the risk of AEH/EC based on seven variables: age, family history of cancer, endometrial thickness, menstrual blood loss, abnormal menstrual duration, intermenstrual bleeding, and postmenopausal bleeding (Figure 4). The model demonstrated favorable discriminatory performance, with an AUC of 0.814 in the training cohort (Figure 5A). Internal validation using bootstrap resampling (1,000 iterations) yielded a 95% CI for the AUC of 0.760 to 0.867. The Hosmer–Lemeshow goodness-of-fit test (P = 0.1649) and the calibration plot (Figure 6A) indicated satisfactory agreement between predicted and observed outcomes in the training cohort. External validation using the independent validation cohort produced an AUC of 0.762 (95% CI: 0.671–0.851)(Figure 5B), and the corresponding calibration curve (Figure 6B) further confirmed the model’s stability and predictive accuracy across datasets.
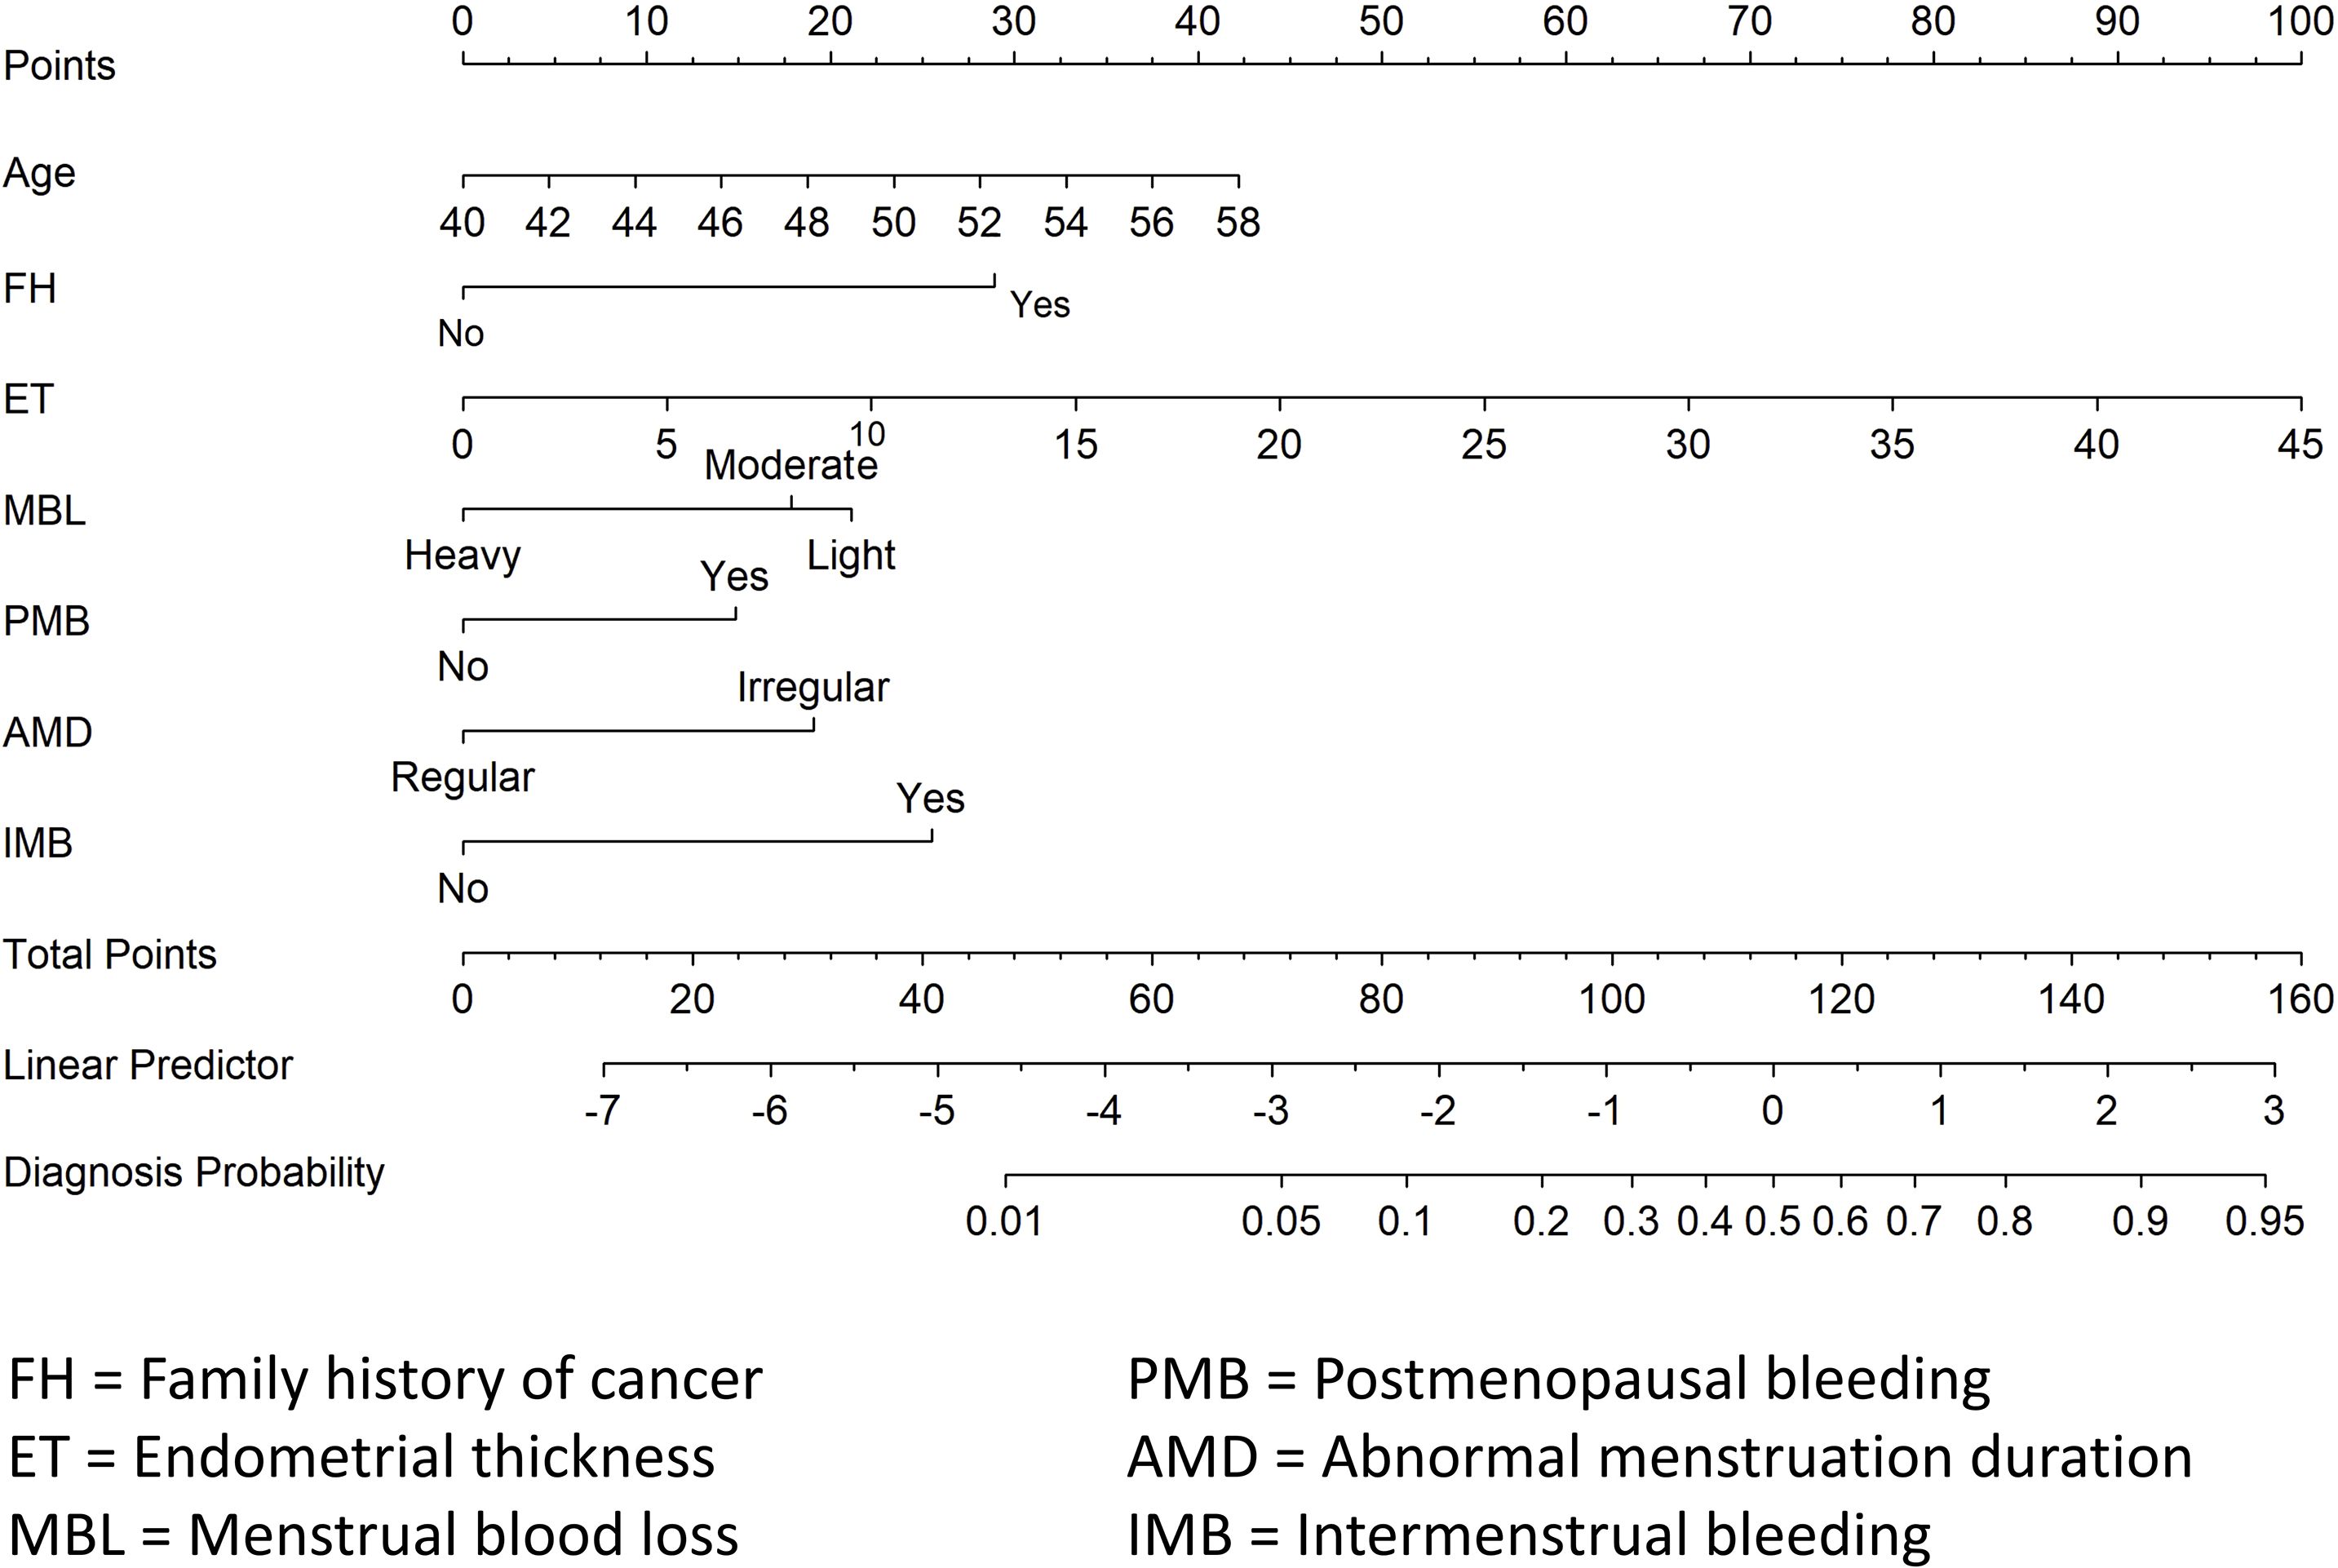
Figure 4. Diagnostic nomogram for predicting the risk of AEH/EC.
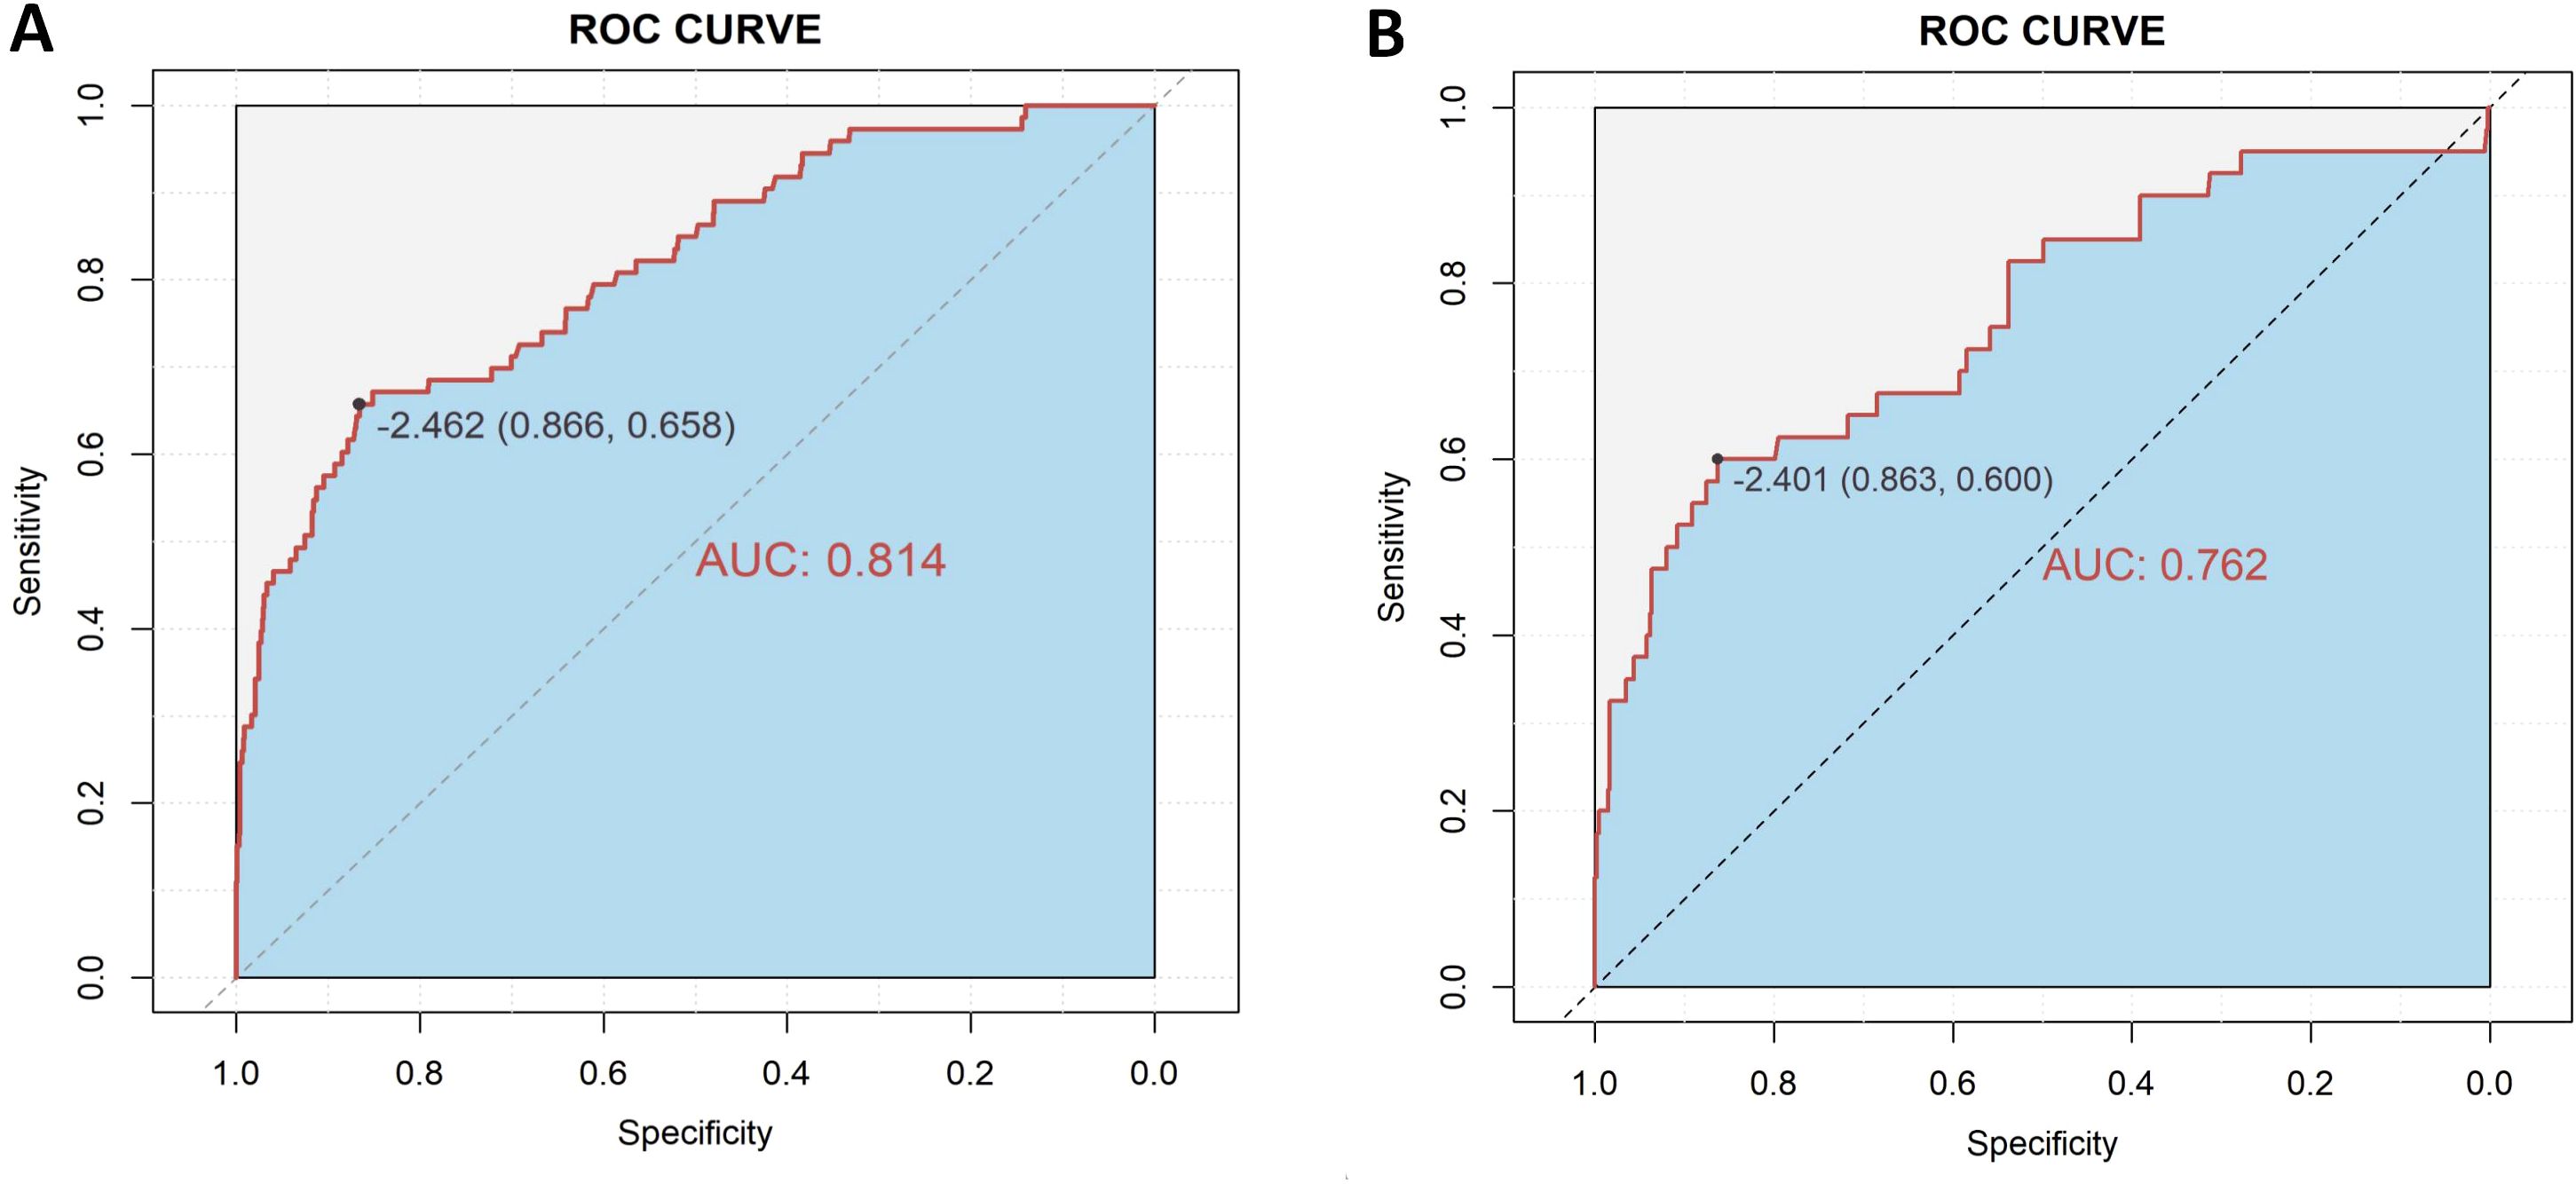
Figure 5. ROC curves for model performance in the training (A) and validation (B) cohorts.
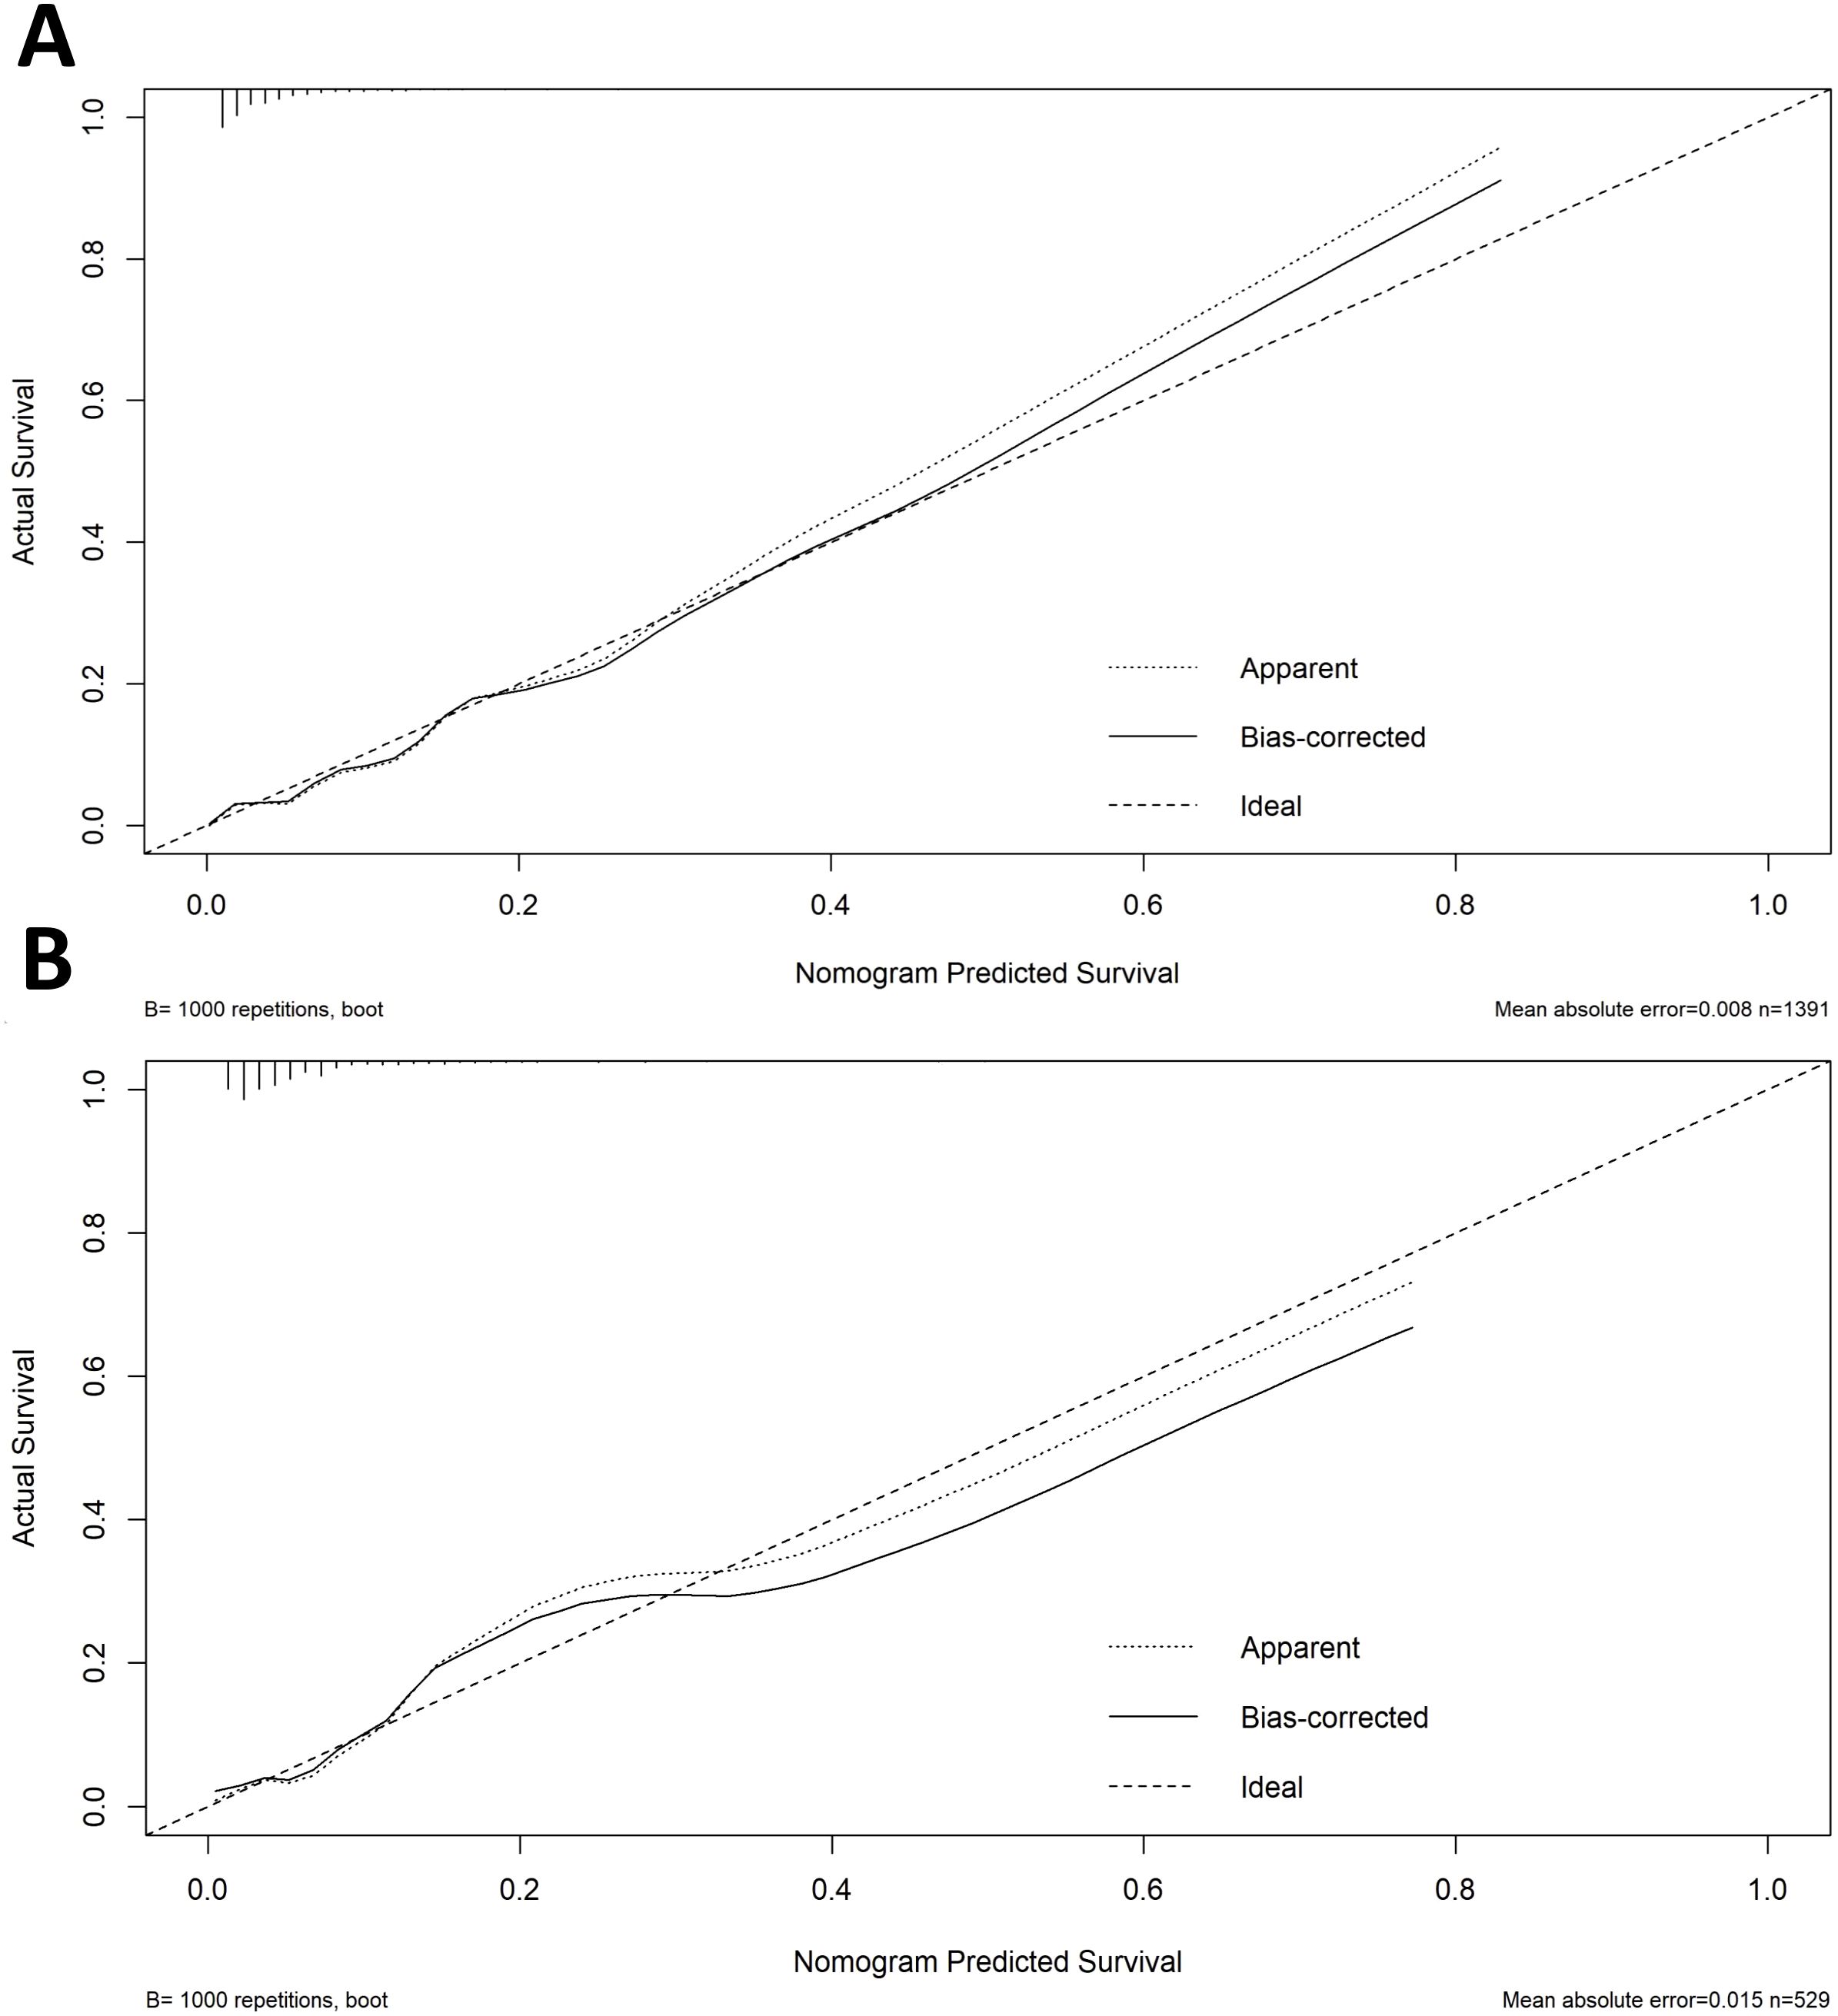
Figure 6. Calibration curves for nomogram prediction in the training (A) and validation (B) cohorts.
3.4 Risk stratification
To evaluate the clinical stratification capacity of the nomogram, total scores were calculated for each patient based on the established multivariable logistic regression model. The optimal cut-off value was determined using the Youden index derived from the ROC curve (Figure 5), yielding a score threshold of 70.362, which corresponded to a logit value of –2.462. Patients were stratified into high-risk (score ≥70.362) and low-risk (score <70.362) groups accordingly. Logistic regression analysis revealed a significantly higher incidence of AEH/EC in the high-risk group compared to the low-risk group, with an OR of 12.46 (95% CI: 7.56–21.01, P < 0.001).
3.5 Clinical utility analysis
The DCA was performed to evaluate the clinical applicability of the nomogram model for predicting AEH/EC (Figure 7). The DCA curve consistently demonstrated a higher net clinical benefit across a range of threshold probabilities compared to the two default strategies-”treat-all” and “treat-none”-indicating favorable clinical utility. In the external validation cohort, the DCA results showed similarly stable performance, supporting the robustness and generalizability of the nomogram across diverse patient populations.
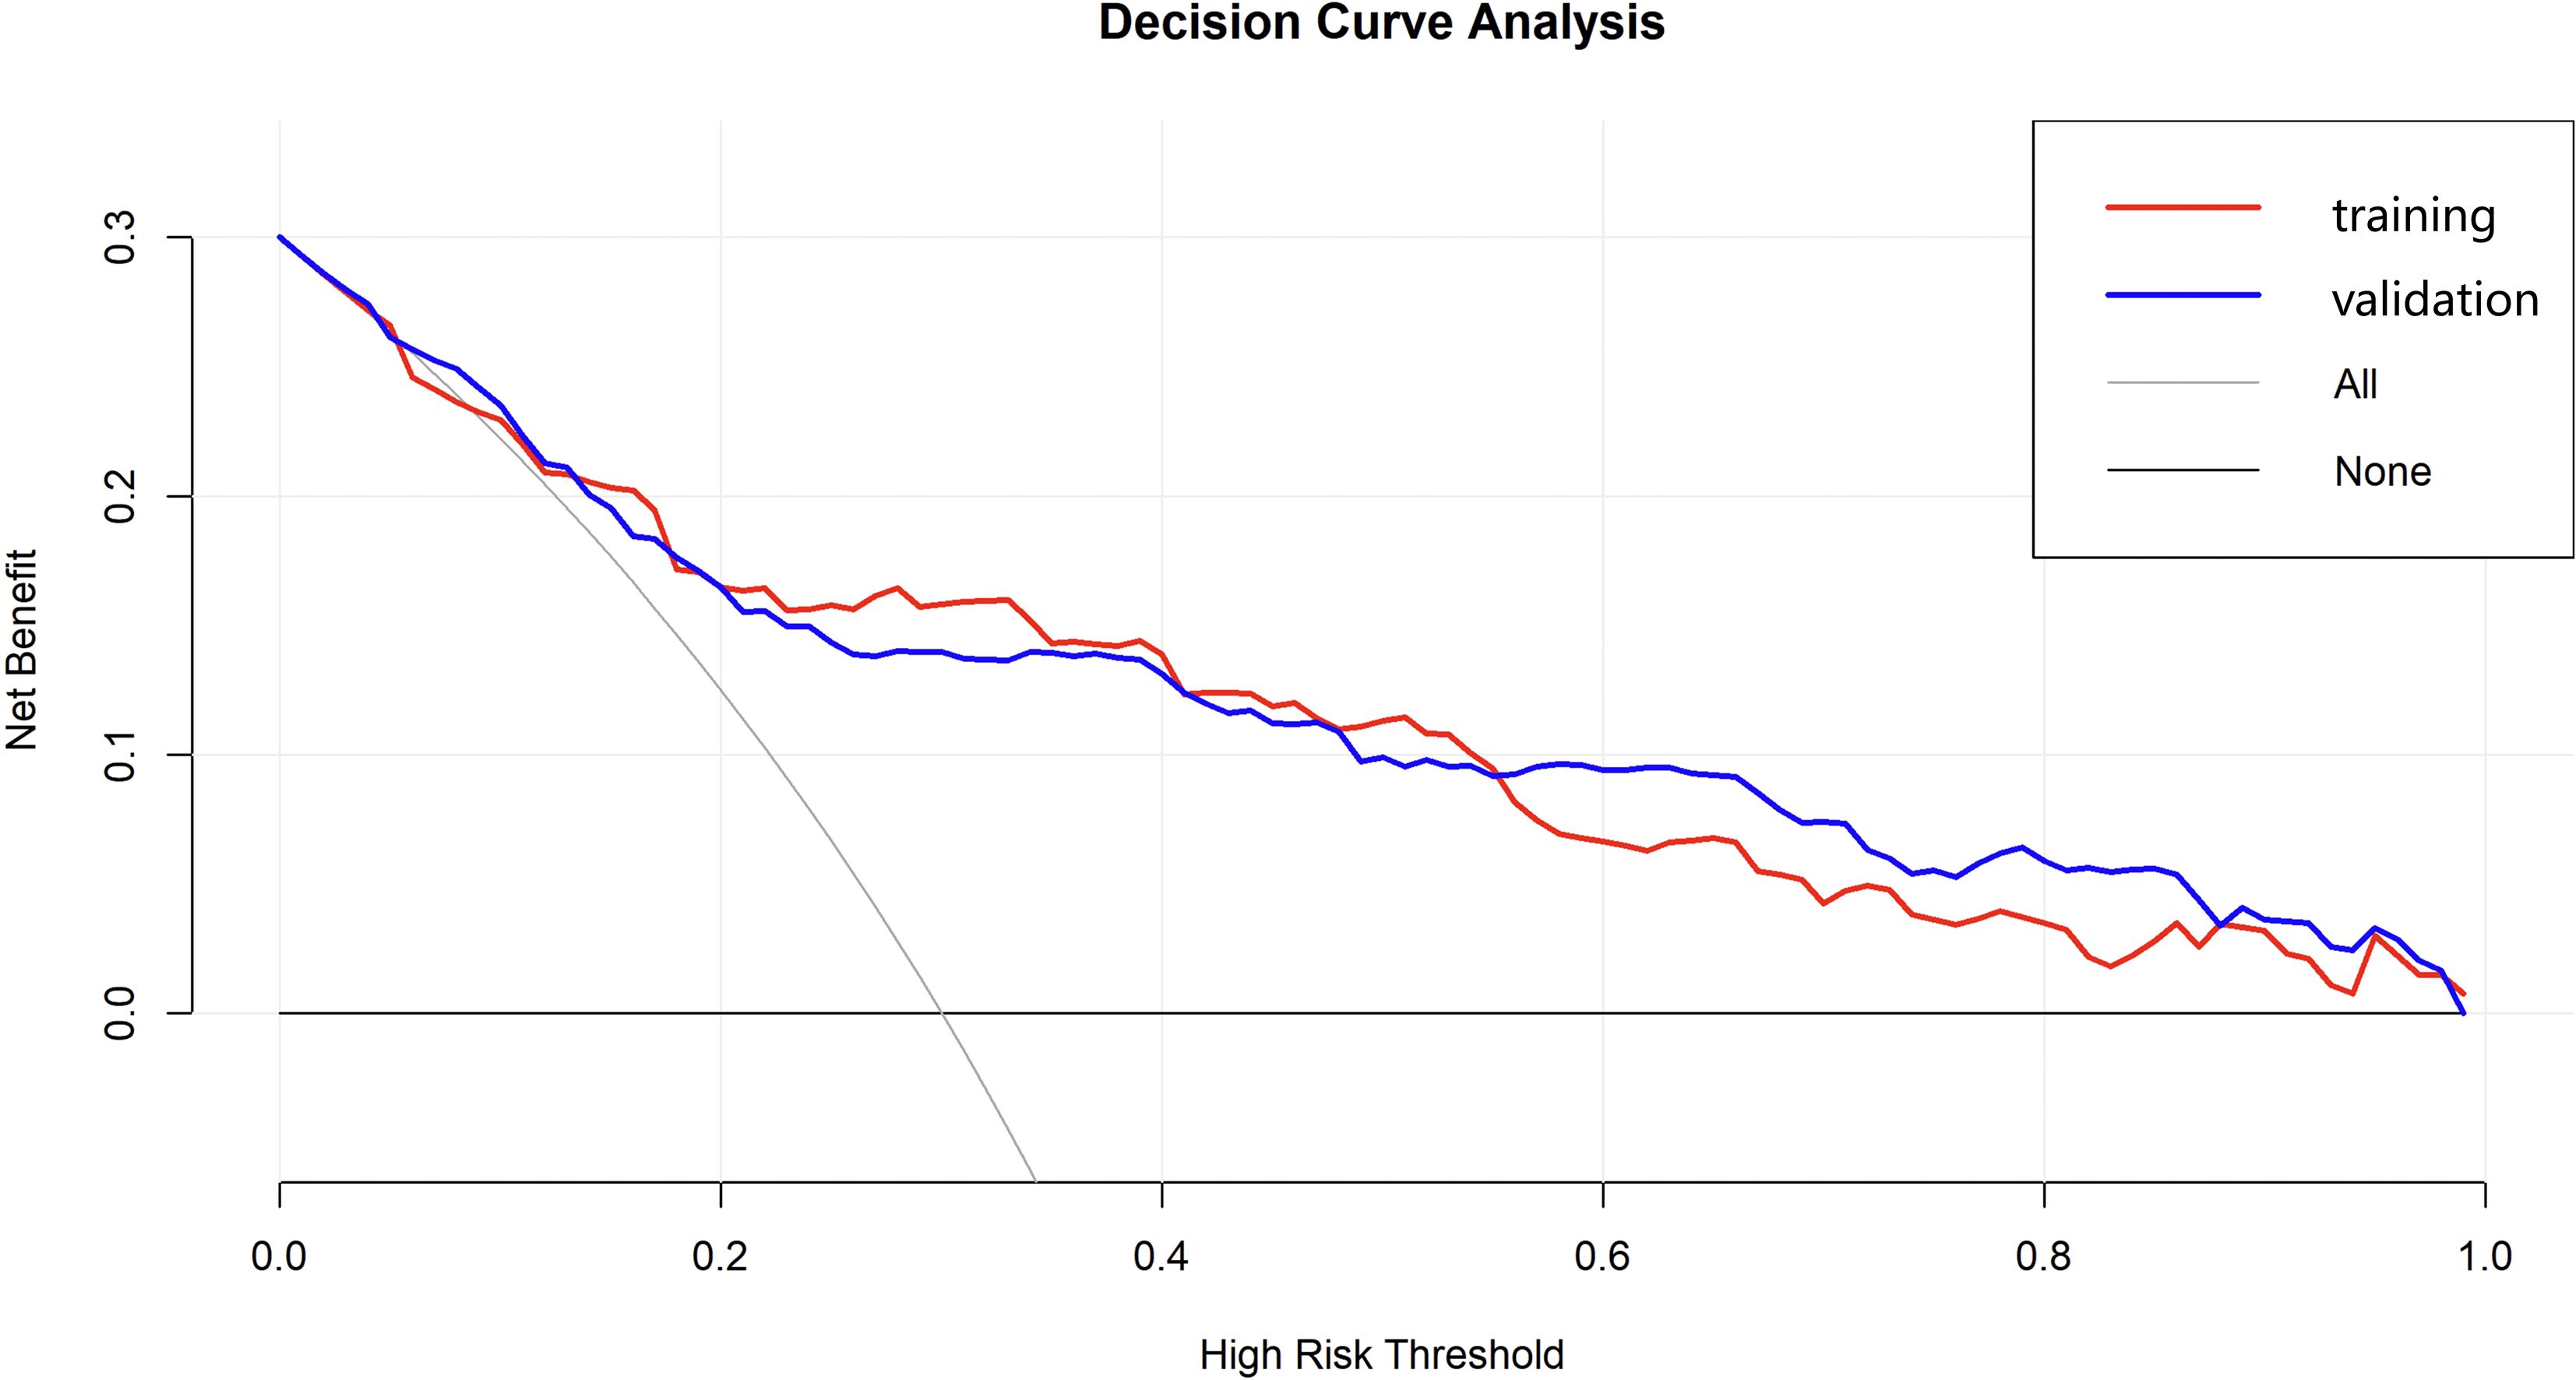
Figure 7. Decision curve analysis of the nomogram model for predicting AEH/EC.
4 Discussion
In recent years, the incidence of EC has steadily increased (9). In clinical practice, AUB-particularly among perimenopausal and postmenopausal women-should raise significant concern for potential precancerous or malignant endometrial lesions (10). To addressing this clinical concern, the present study focused on perimenopausal patients presenting with AUB and systematically collected a comprehensive set of clinical characteristics. Using both univariate and multivariable logistic regression analyses, five independent risk factors were identified: advanced age, family history of malignancy, increased endometrial thickness, moderate menstrual blood loss, and intermenstrual bleeding. Notably, this study is among the first to incorporate AUB patterns as a core predictive variable alongside conventional clinical parameters in constructing a risk prediction model. The nomogram demonstrated favorable discrimination, calibration, and clinical utility in both the training and external validation cohorts. These findings indicate that the potential of mode as a practical and accessible tool for preoperative risk stratification and clinical decision-making in women with AUB.
Numerous studies have established that the development of malignant endometrial lesions is influenced by a variety of clinical risk factors. Conventional predictors—such as advanced age, positive family history of malignancy, increased EMT, and postmenopausal bleeding—have been widely incorporated into predictive models for risk stratification. Consistent with prior literature, the present study identified age, family history of cancer, EMT, and postmenopausal bleeding as independent predictors of AEH/EC (11). Burbos et al. (12)conducted a multivariable analysis of 3,047 women with postmenopausal bleeding and identified diabetes, EMT ≥14 mm, recurrent bleeding episodes, age ≥64 years, and BMI ≥31 kg/m² as independent predictors of EC, developing the DEFAB risk model. In another retrospective cross-sectional study involving 212 postmenopausal women, Sebastian et al. (13)demonstrated that age ≥55 years, frequent bleeding episodes (≥2), diabetes, and endometrial thickening were independent risk factors for EC. Wynants et al. (14)constructed a multivariable prediction model in 2,417 women undergoing ultrasonography for AUB, using age, BMI, and sonographic features as core predictors. However, the aforementioned studies have not focused on the predictive value of specific AUB patterns in endometrial malignancy. Jha et al. (15) reported a potential association between intermenstrual bleeding (IMB) and AEH/EC, although detailed bleeding patterns were not incorporated into their predictive model. Similarly, in the predictive model developed by Burbos et al. (16), while data on vaginal bleeding volume and duration were recorded, these parameters were not found to be independent predictors of malignancy—potentially due to imprecise definitions of bleeding types or population heterogeneity. In our model, endometrial thickness (ET) emerged as the most powerful single predictor of AEH/EC, consistent with previous findings. Nevertheless, integrating refined AUB patterns and demographic factors yielded superior predictive performance compared with ET alone (AUC 0.814 vs. 0.698), while maintaining moderate discrimination in the external validation cohort (AUC 0.762). This suggests that while ET predominantly drives model discrimination, the integrated model combining AUB patterns with other clinical variables further improves diagnostic specificity by identifying benign thickened endometria with low malignant potential.
Our study identified IMB as an independent risk factor for AEH/EC in women aged 40–60 years with AUB, offering novel evidence for its diagnostic relevance. The pathogenesis of EC is intricately linked to prolonged estrogen exposure unopposed by progesterone. Histologically, both AEH and EC are frequently characterized by atypical glandular structures and neovascularization (17), which can compromise endometrial integrity and result in irregular or unpredictable bleeding, typically manifesting as IMB. Furthermore, hyper-estrogenic states can cause endometrial thickening, menstrual cycle irregularity, and vascular fragility, all of which contribute to IMB (18). The cyclical imbalance in endometrial shedding and repair, combined with local vascular malformations or tumor-induced angiogenesis, may underlie the clinical presentation of IMB in these patients. Given these mechanistic links, persistent or recurrent IMB, especially in older or high-risk individuals (19), should prompt evaluation to exclude underlying malignancy.
Interestingly, our analysis revealed an inverse association between heavy menstrual bleeding and malignant pathology, which may appear counterintuitive. However, this observation could be explained by several underlying clinical mechanisms. Heavy menstrual bleeding is frequently linked to benign gynecologic conditions such as submucosal fibroids, endometrial polyps, and adenomyosis, all of which are associated with increased menstrual volume. Moreover, regular heavy bleeding may indicate ovulatory cycles and sufficient progesterone production (20), offering protective effects against unopposed estrogen stimulation. Nevertheless, this association warrants cautious interpretation, as heavy menstrual bleeding may also occur in cases of endometrial hyperplasia or early EC.
Nomograms are widely accepted tools in oncology for risk prediction, integrating multiple clinical variables into a personalized risk score that is easily interpretable and clinically applicable (21). In this study, we developed a novel nomogram model to predict the risk of AEH/EC in women aged 40–60 years with AUB. Compared with conventional modeling strategies, our study introduced the LASSO regression based on logistic regression, which not only effectively identified the most relevant predictors but also addressed multicollinearity and simplified the model, thereby improving generalizability and reducing the risk of overfitting. The model exhibited favorable discrimination and calibration performance in both the training and external validation cohorts. Furthermore, DCA revealed stable net clinical benefit across a broad spectrum of threshold probabilities, supporting the model’s clinical utility. Risk stratification using the optimal cutoff value derived from the ROC curve (70.362) demonstrated that patients in the high-risk group had a 12.46-fold increased likelihood of developing AEH/EC compared to those in the low-risk group (OR = 12.46; 95% CI: 7.56–21.01; P < 0.001), indicating a strong discriminatory capacity. Compared with previously published models for predicting endometrial malignancies (22, 23), our nomogram incorporates symptom-based predictors and validates their independent prognostic value, whose accessibility, simplicity, and robust performance underscore the potential for broad clinical implementation, especially in resource-limited or primary care settings.
Despite the favorable performance of our model, several limitations must be noted. First, the study adopted a retrospective design, and the majority of clinical data were extracted from hospital information systems. Certain variables were based on patient self-reports, which may have introduced recall bias. Second, molecular biomarkers and genomic features were not included in the current model. Future research integrating molecular subtyping and genomic profiling may improve the precision and clinical utility of nomogram. Third, The diagnostic criteria for AUB differ between premenopausal and postmenopausal women. As this study focused on predicting AEH/EC in a transitional population without explicitly separating these physiological stages, such differences may affect the model’s generalizability. Future studies with larger and stratified cohorts are needed to validate the model separately in well-defined premenopausal and postmenopausal subgroups. Fourth, information on prior progestin therapy was not available in our dataset. Because progestins can affect endometrial morphology and related clinical indicators, the lack of these data may influence model accuracy. Future studies incorporating progestin exposure are warranted to further improve predictive performance.
5 Conclusion
This study developed a novel and clinically applicable nomogram model for predicting AEH/EC in women aged 40–60 years presenting with AUB. The model demonstrated strong predictive performance and calibration and provides a convenient and evidence-based method for preoperative risk stratification. It may serve as a valuable tool to facilitate the early identification of high-risk individuals and support personalized clinical management strategies.
Data availability statement
The raw data supporting the conclusions of this article will be made available by the authors, without undue reservation.
Ethics statement
The studies involving humans were approved by Ethics Committee of Guangdong Provincial Hospital of Chinese Medicine. The studies were conducted in accordance with the local legislation and institutional requirements. The ethics committees granted an exemption from the requirement for informed consent owing to the retrospective nature of this study.
Author contributions
SH: Data curation, Formal Analysis, Investigation, Methodology, Project administration, Software, Validation, Writing – original draft, Writing – review & editing. XH: Data curation, Formal Analysis, Investigation, Methodology, Project administration, Software, Writing – original draft, Writing – review & editing. LH: Formal Analysis, Investigation, Methodology, Project administration, Resources, Supervision, Validation, Writing – original draft, Writing – review & editing. TD: Data curation, Formal Analysis, Investigation, Methodology, Project administration, Writing – original draft, Writing – review & editing. YZ: Data curation, Formal Analysis, Investigation, Methodology, Project administration, Resources, Software, Validation, Writing – original draft, Writing – review & editing. JX: Conceptualization, Formal Analysis, Funding acquisition, Methodology, Project administration, Resources, Software, Supervision, Validation, Visualization, Writing – original draft, Writing – review & editing.
Funding
The author(s) declared that financial support was received for this work and/or its publication. This study was supported by YuYun Academic Experience Inheritance Studio of Guangdong Provincial Hospital of Chinese Medicine (E43728) and LiuMinru Academic Experience Inheritance Studio of Guangdong Provincial Hospital of Chinese Medicine(DF02202).
Conflict of interest
The authors declared that this work was conducted in the absence of any commercial or financial relationships that could be construed as a potential conflict of interest.
Generative AI statement
The author(s) declared that generative AI was not used in the creation of this manuscript.
Any alternative text (alt text) provided alongside figures in this article has been generated by Frontiers with the support of artificial intelligence and reasonable efforts have been made to ensure accuracy, including review by the authors wherever possible. If you identify any issues, please contact us.
Publisher’s note
All claims expressed in this article are solely those of the authors and do not necessarily represent those of their affiliated organizations, or those of the publisher, the editors and the reviewers. Any product that may be evaluated in this article, or claim that may be made by its manufacturer, is not guaranteed or endorsed by the publisher.
References
1. Crosbie EJ, Kitson SJ, McAlpine JN, Mukhopadhyay A, Powell ME, and Singh N. Endometrial cancer. Lancet. (2022) 399:1412–28. doi: 10.1016/S0140-6736(22)00323-3, PMID: 35397864
2. Pennant ME, Mehta R, Moody P, Hackett G, Prentice A, Sharp SJ, et al. Premenopausal abnormal uterine bleeding and risk of endometrial cancer. Bjog. (2017) 124:404–11. doi: 10.1111/1471-0528.14385, PMID: 27766759
3. Balachandran VP, Gonen M, Smith JJ, and DeMatteo RP. Nomograms in oncology: more than meets the eye. Lancet Oncol. (2015) 16:e173–80. doi: 10.1016/S1470-2045(14)71116-7, PMID: 25846097
4. Ruan H, Chen S, Li J, Ma L, Luo J, Huang Y, et al. Development and validation of a nomogram prediction model for endometrial Malignancy in patients with abnormal uterine bleeding. Yonsei Med J. (2023) 64:197–203. doi: 10.3349/ymj.2022.0239, PMID: 36825346
5. Munro MG, Critchley H, and Fraser IS. The two figo systems for normal and abnormal uterine bleeding symptoms and classification of causes of abnormal uterine bleeding in the reproductive years: 2018 revisions. Int J Gynaecol Obstet. (2018) 143:393–408. doi: 10.1002/ijgo.12666, PMID: 30198563
6. Higham JM, O’Brien PM, and Shaw RW. Assessment of menstrual blood loss using a pictorial chart. Br J Obstet Gynaecol. (1990) 97:734–9. doi: 10.1111/j.1471-0528.1990.tb16249.x, PMID: 2400752
7. Balasch J, Manau D, Mimo J, Duran M, Puerto B, and Vanrell JA. Trial of routine gonadotropin releasing hormone agonist treatment before abdominal hysterectomy for leiomyoma. Acta Obstet Gynecol Scand. (1995) 74:562–5. doi: 10.3109/00016349509024390, PMID: 7618457
8. Team RC. R: a language and environment for statistical computing. Vienna, Austria: R Foundation for Statistical Computing (2023).
9. Siegel RL, Miller KD, Wagle NS, and Jemal A. Cancer statistics, 2023. CA Cancer J Clin. (2023) 73:17–48. doi: 10.3322/caac.21763, PMID: 36633525
10. Clarke MA, Long BJ, Del MMA, Arbyn M, Bakkum-Gamez JN, and Wentzensen N. Association of endometrial cancer risk with postmenopausal bleeding in women: a systematic review and meta-analysis. JAMA Intern Med. (2018) 178:1210–22. doi: 10.1001/jamainternmed.2018.2820, PMID: 30083701
11. Xu Y and Xie D. Prediction of factors associated with abnormal uterine bleeding by transvaginal ultrasound combined with bleeding pattern. Comput Math Methods Med. (2022) 2022:5653250. doi: 10.1155/2022/5653250, PMID: 35799665
12. Burbos N, Musonda P, Giarenis I, Shiner AM, Giamougiannis P, Morris EP, et al. Predicting the risk of endometrial cancer in postmenopausal women presenting with vaginal bleeding: the norwich defab risk assessment tool. Br J Cancer. (2010) 102:1201–6. doi: 10.1038/sj.bjc.6605620, PMID: 20354525
13. Sebastian A, Neerudu SR, Rebekah G, Varghese L, Regi A, Thomas A, et al. Risk factors for endometrial carcinoma in women with postmenopausal bleeding. J Obstet Gynaecol India. (2021) 71:417–23. doi: 10.1007/s13224-021-01464-3, PMID: 34566302
14. Wynants L, Verbakel J, Valentin L, De Cock B, Pascual MA, Leone F, et al. The risk of endometrial Malignancy and other endometrial pathology in women with abnormal uterine bleeding: an ultrasound-based model development study by the ieta group. Gynecol Obstet Invest. (2022) 87:54–61. doi: 10.1159/000522524, PMID: 35152217
15. Jha S, Singh A, Sinha HH, Bhadani P, Anant M, and Agarwal M. Rate of premalignant and Malignant endometrial lesion in “low-risk” premenopausal women with abnormal uterine bleeding undergoing endometrial biopsy. Obstet Gynecol Sci. (2021) 64:517–23. doi: 10.5468/ogs.21150, PMID: 34555870
16. Burbos N, Musonda P, Duncan TJ, Crocker SG, Morris EP, and Nieto JJ. Estimating the risk of endometrial cancer in symptomatic postmenopausal women: a novel clinical prediction model based on patients’ characteristics. Int J Gynecol Cancer. (2011) 21:500–6. doi: 10.1097/IGC.0b013e31820c4cd6, PMID: 21436697
17. Abulafia O, Triest WE, Sherer DM, Hansen CC, and Ghezzi F. Angiogenesis in endometrial hyperplasia and stage i endometrial carcinoma. Obstet Gynecol. (1995) 86:479–85. doi: 10.1016/0029-7844(95)00203-4, PMID: 7545803
18. Nees LK, Heublein S, Steinmacher S, Juhasz-Boss I, Brucker S, Tempfer CB, et al. Endometrial hyperplasia as a risk factor of endometrial cancer. Arch Gynecol Obstet. (2022) 306:407–21. doi: 10.1007/s00404-021-06380-5, PMID: 35001185
19. Singla A, Kumari R, Mehta S, and Sanyal K. Tubercular cervicitis - a diagnostic dilemma: report of five cases and literature review. Indian J Tuberc. (2025) 72:89–93. doi: 10.1016/j.ijtb.2024.05.004, PMID: 39890379
20. MacGregor R, Jain V, Hillman S, and Lumsden MA. Investigating abnormal uterine bleeding in reproductive aged women. Bmj. (2022) 378:e70906. doi: 10.1136/bmj-2022-070906, PMID: 36113874
21. Wei JH, Feng ZH, Cao Y, Zhao HW, Chen ZH, Liao B, et al. Predictive value of single-nucleotide polymorphism signature for recurrence in localised renal cell carcinoma: a retrospective analysis and multicentre validation study. Lancet Oncol. (2019) 20:591–600. doi: 10.1016/S1470-2045(18)30932-X, PMID: 30880070
22. Plotti F, Capriglione S, Scaletta G, Luvero D, Lopez S, Nastro FF, et al. Implementing the risk of endometrial Malignancy algorithm (rem) adding obesity as a predictive factor: results of rem-b in a single-center survey. Eur J Obstet Gynecol Reprod Biol. (2018) 225:51–6. doi: 10.1016/j.ejogrb.2018.03.044, PMID: 29660578
Keywords: endometrial carcinoma, atypical endometrial hyperplasia, nomogram, abnormal uterine bleeding, risk prediction model
Citation: Huang S, Hu X, Hu L, Du T, Zhao Y and Xiao J (2025) Development of a clinical diagnostic model for atypical endometrial hyperplasia and endometrial carcinoma in women aged 40–60 years based on refined abnormal uterine bleeding patterns. Front. Oncol. 15:1684604. doi: 10.3389/fonc.2025.1684604
Received: 12 August 2025; Accepted: 08 December 2025; Revised: 22 November 2025;
Published: 19 December 2025.
Edited by:
Stefano Restaino, Ospedale Santa Maria della Misericordia di Udine, ItalyReviewed by:
Tomoyuki Otani, Kindai University Faculty of Medicine, JapanYijiao He, Peking University People’s Hospital, China
Copyright © 2025 Huang, Hu, Hu, Du, Zhao and Xiao. This is an open-access article distributed under the terms of the Creative Commons Attribution License (CC BY). The use, distribution or reproduction in other forums is permitted, provided the original author(s) and the copyright owner(s) are credited and that the original publication in this journal is cited, in accordance with accepted academic practice. No use, distribution or reproduction is permitted which does not comply with these terms.
*Correspondence: Jing Xiao, eGlhb2ppbmdzb25fMjAwNEAxMjYuY29t
†These authors have contributed equally to this work and share first authorship