 Weidong Wang†
 Junrong Lu
 Yongcong Yan
 Kai Wen
 Zhenyu Zhou
 Zhiyu Xiao
- Sun Yat-sen Memorial Hospital, Sun Yat-sen University, Guangzhou, China
Background: Hepatocellular carcinoma (HCC) is a prevalent malignant tumor that is associated with significant morbidity and mortality. Programmed cell death 1 ligand 1 (PD-L1) and Vessel Encapsulating Tumor Clusters (VETC) are critical biomarkers influencing immune evasion and metastasis, making them pivotal for guiding treatment decisions. However, it is challenging to obtain pathological samples from some patients because of factors such as advanced tumor stage and poor liver function.
Objective: This study aimed to develop an AI-based imaging model to non-invasively predict PD-L1 and VETC expression in HCC patients, addressing the challenge of limited histopathological data.
Methods: This retrospective study included 162 HCC patients diagnosed between January 2017 and December 2022. Patients were randomly divided into training and test sets (8:2). Radiomic features were extracted from CT images, and various machine learning algorithms were used to construct predictive models and assess their accuracy in predicting PD-L1 and VETC expression.
Results: A total of 2,286 features were extracted from the enhanced abdominal CT images. Among them, seven features were associated with PD-L1 expression and 10 with VETC expression. The Random Forest (RF) model demonstrated good calibration and fit, emerging as the most effective with an AUC of 0.834 (95% CI: 0.752–0.915) for PD-L1 and 0.883 (95% CI: 0.818–0.949) for VETC in the training set, while achieving AUCs of 0.740 (95% CI: 0.541–0.939) for PD-L1 and 0.705 (95% CI: 0.488–0.922) for VETC in the test set.
Conclusion: The radiomics model derived from enhanced abdominal CT demonstrates its potential as a noninvasive tool for predicting the expression of PD-L1 and VETC in HCC patients.
Introduction
Hepatocellular carcinoma (HCC) is a highly prevalent malignant tumor of the digestive system, characterized by elevated morbidity and mortality rates (1, 2). Surgical resection is often not feasible upon diagnosis, resulting in poor prognosis.
Within the cancer immune cycle, the immune checkpoint PD-1 and its ligand PD-L1 play pivotal roles in tumor evasion of immune-mediated apoptosis, suppression of T- and B-cell activation, and facilitation of tumor metastasis and progression. Elevated PD-L1 expression correlates with these phenomena (3–5). Targeted therapy for the PD-1/PD-L1 axis effectively restores immune cell functionality and suppresses tumor growth, indicating that PD-L1 expression is a potential biomarker for guiding subsequent treatment strategies.
Vessel encapsulating tumor clusters (VETC) are tumor lesions surrounded by capillary endothelial cells that facilitate hematogenous metastasis, resulting in an unfavorable prognosis after radical surgical resection. Consequently, VETC serves as a robust adverse-prognostic indicator (6–8). Meanwhile, VETC guides in selecting subsequent treatment strategies, such as sorafenib, which demonstrates a notable increase in overall survival for VETC-positive patients but does not extend survival in VETC-negative patients (9).
A definitive pathological diagnosis is not currently required for HCC diagnosis. Many patients who are ineligible for surgical resection and decline biopsy procedures lack the pathological evidence to guide subsequent treatment decisions. Importantly, the assessment of PD-L1 and VETC expression requires histopathological evaluation. Therefore, noninvasive and convenient method for determining PD-L1 and VETC expression in patients without histopathological data is needed. Artificial intelligence (AI), specifically radiomics technologies applied to medical imaging, supports the need for noninvasive and precise medical interventions. AI has already shown promise in analyzing the cytoplasmic matrix and microenvironment of liver cancer cells, distinguishing between liver cancer types, and predicting therapeutic responses to refine treatment strategies (10). AI-driven CT image analysis has the potential to predict PD-L1 and VETC expression, thereby informing the selection of follow-up treatment for HCC. Therefore, this study aimed to develop a radiomics model using enhanced abdominal CT to non-invasively predict PD-L1 and VETC expression levels in HCC patients, thereby providing treatment decision support for patients who are unable to obtain pathological samples.
Materials and methods
In this study, we reviewed patients diagnosed with HCC at our institution between January 2017 and December 2022 who underwent abdominal CT enhancement scans and pathological examinations after radical surgical resection. The hospital’s ethics committee approved this study and waived the requirement for informed consent. After screening, 162 patients were enrolled in the study.
The inclusion criteria were as follows: 1) histologically confirmed HCC with available PD-L1 and VETC expression assessment via histopathology after resection; 2) complete abdominal triple-phase imaging data available, with an interval of less than 2 weeks between pathology and imaging examinations; 3) treatment-naive status (no prior surgical, interventional, or systemic treatment) before surgical resection and imaging examination; and 4) complete clinical and laboratory data available.
Exclusion criteria included: 1) Suboptimal imaging quality due to significant motion artifacts; 2) Coexistence of other primary malignancies; 3) Incomplete clinical pathological data for comprehensive analysis.
To ensure an appropriate sample distribution, the dataset was randomly divided into training and test sets using an 8:2 ratio. The screening and grouping processes are illustrated in Figure 1.
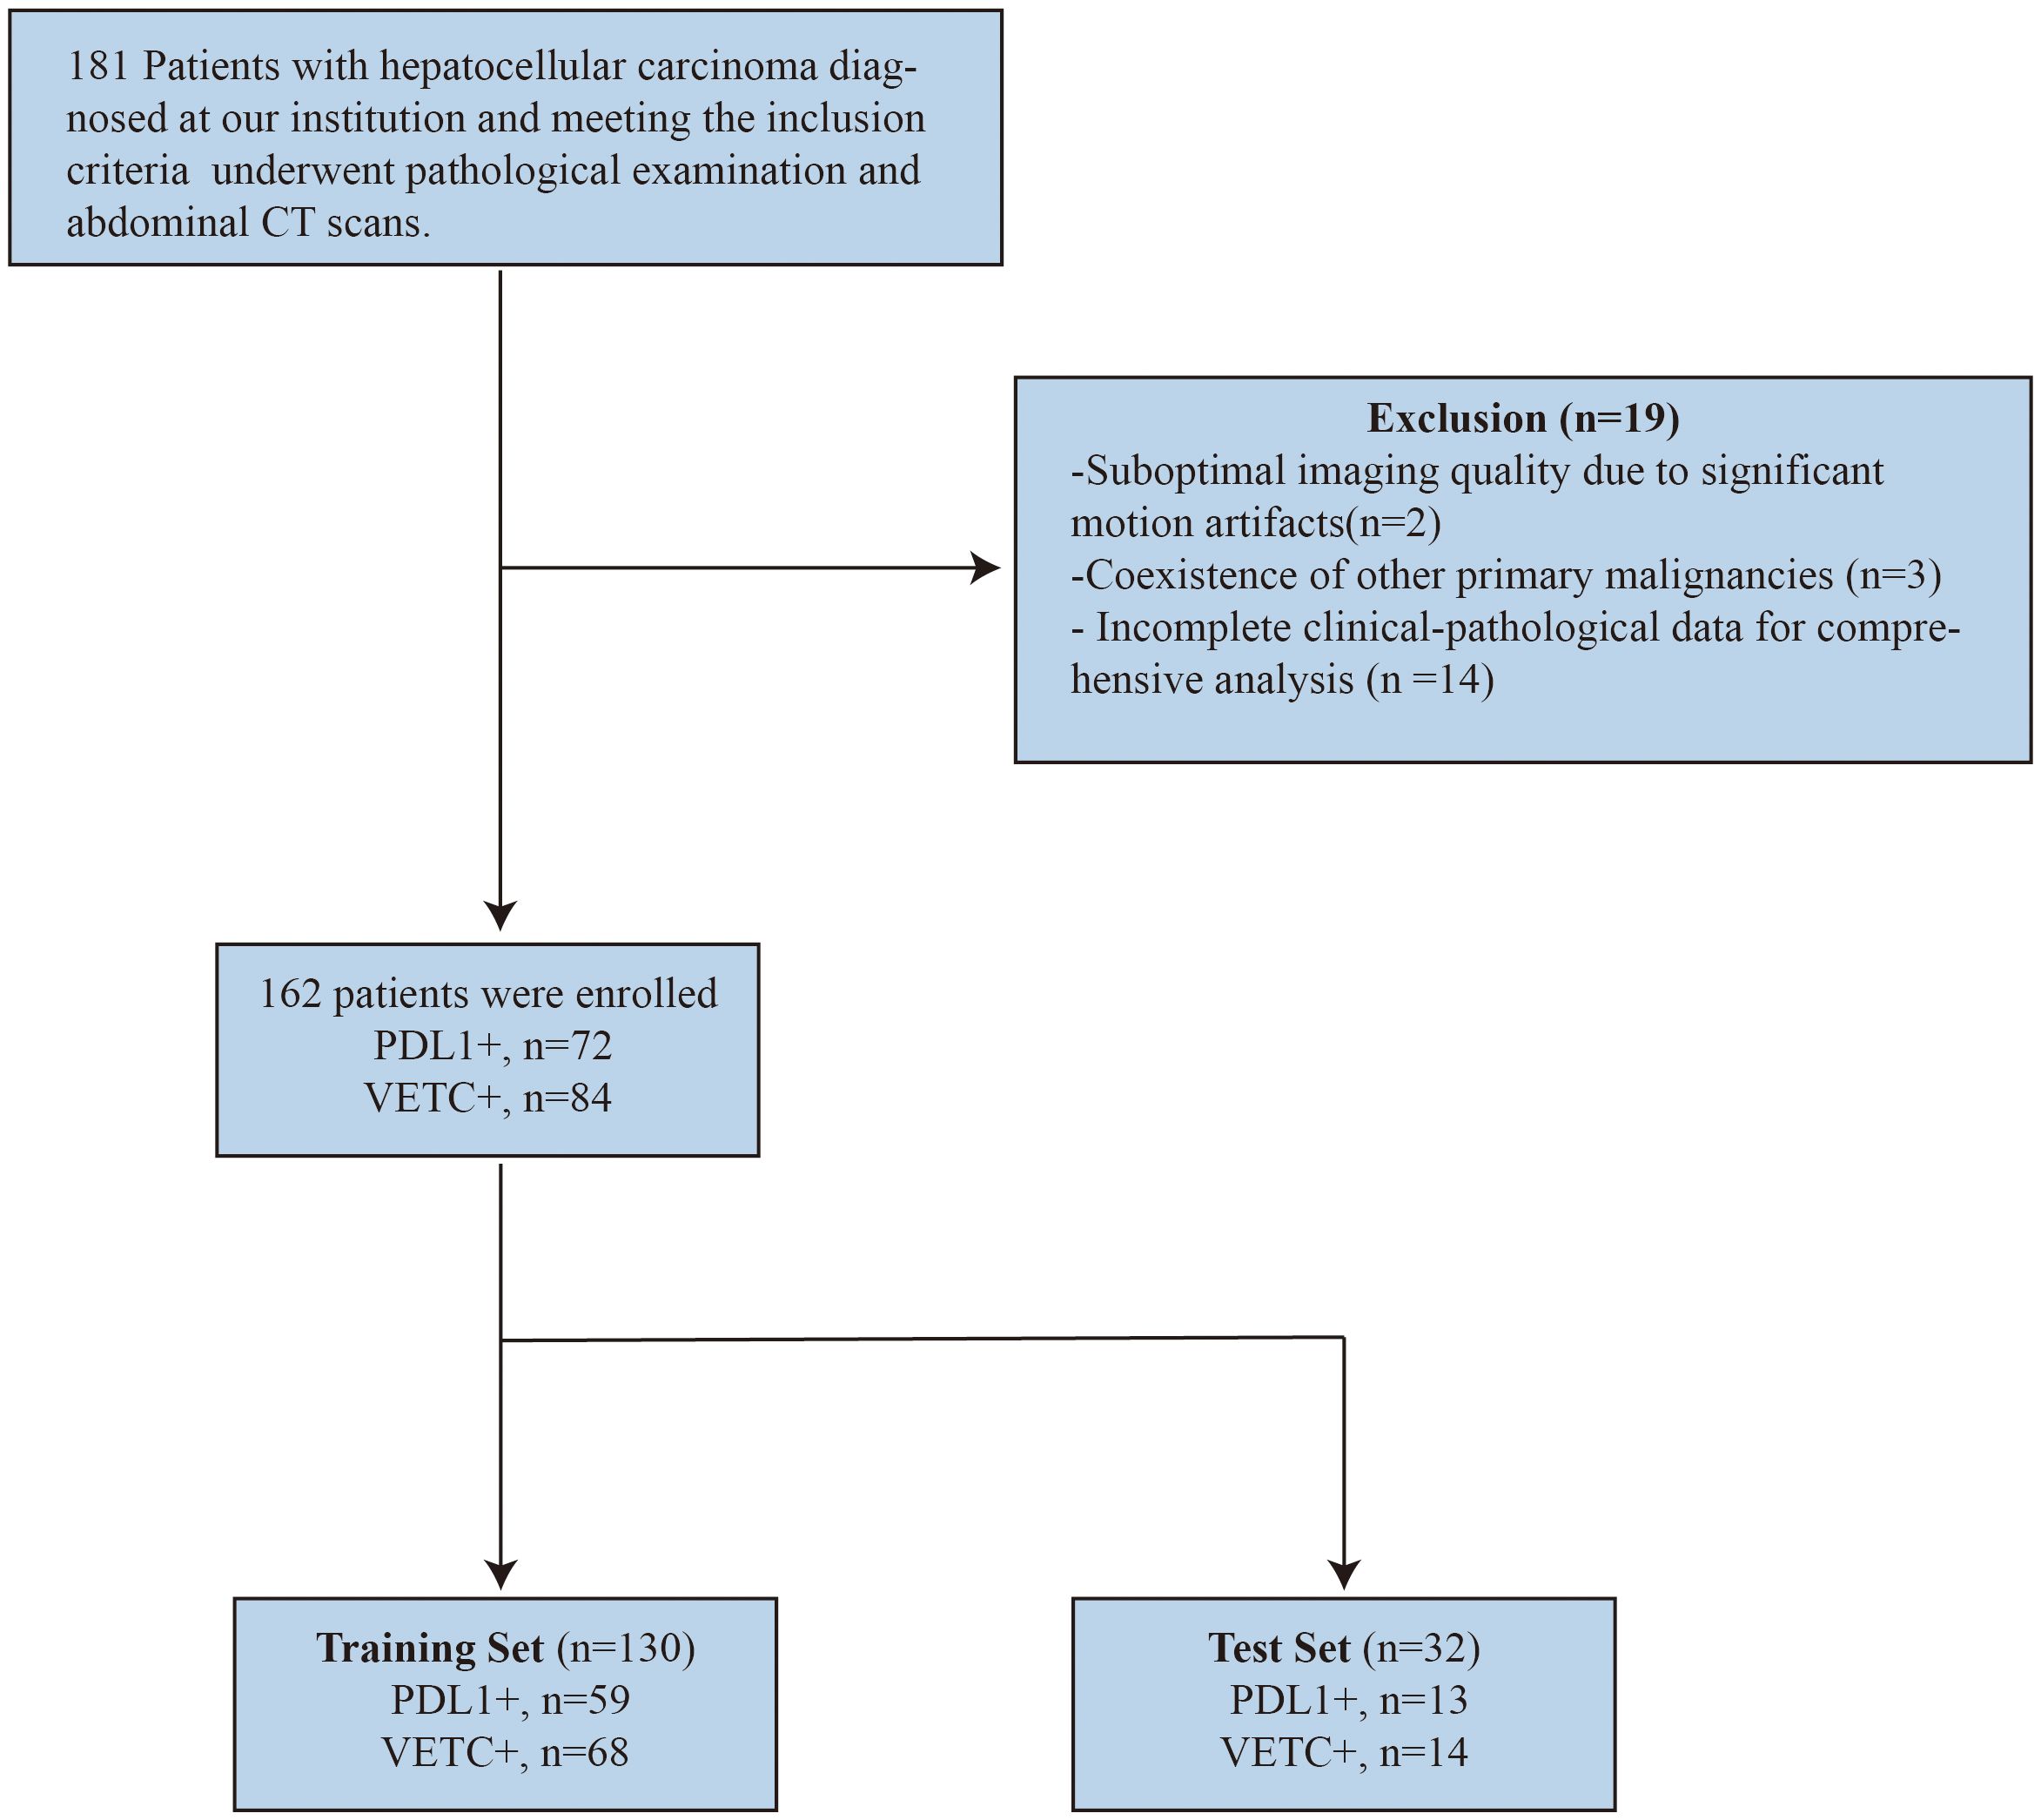
Figure 1. Flowchart of patient enrollment and study design.
Assessment of PD-L1 and VETC expression
The PD-L1 expression and VETC extent were independently evaluated by two experienced pathologists. In cases of disagreement, a third pathologist was consulted to discuss and reach a consensus. All three pathologists were blinded to the patients’ clinical, laboratory, and imaging findings before reaching a final decision.
VETC is defined as the occurrence of sinusoid-like vessels that form web-like networks and encapsulate individual tumor clusters, either partially or entirely within the tumor, as observed in CD34 immunostaining. For CD34 immunostaining, the tissue sections were deparaffinized, rehydrated, and subjected to antigen retrieval using citrate buffer (pH 6.0). The primary antibody, CD34 QBEnd/10 (Quanhui International, China), was applied at a dilution of 1:100, followed by incubation with a horseradish peroxidase (HRP)-conjugated secondary antibody. Diaminobenzidine (DAB) was used for chromogenic detection, and hematoxylin counterstaining was performed on the sections. The extent of VETC was semi-quantitatively assessed in increments of 5% from 0% to 100%. A VETC index of 5% or higher classifies the tumor as VETC positive (VETC+), whereas below this threshold, it is classified as VETC negative (VETC−) (11).
For PD-L1, the intensity of staining was rated on a scale from 0 (negative) to 3 (dark brown). Immunostaining for PD-L1 was performed using the PD-L1 22C3 pharmDx assay (Dako, Agilent Technologies, USA). Tissue sections were incubated with the primary antibody PD-L1 22C3 (clone 22C3, prediluted) after heat-induced epitope retrieval. Detection was achieved using the EnVision FLEX+ visualization system (Dako), followed by DAB chromogen and hematoxylin counterstaining. The proportion of positively stained cells was scored as follows: 0% (0 points), 1%–25% (1 point), 26%–50% (2 points), 51%–75% (3 points), and 76%–100% (4 points). The total IHC staining score was calculated by multiplying the intensity score by the proportion score (12, 13). A total score exceeding 4 points indicated high expression (PD-L1+), whereas a score of 4 or less indicated low expression (PD-L1−).
CT acquisition
Patients underwent contrast-enhanced liver CT within 2 weeks before treatment initiation. CT scans were performed in the axial plane with 1.25 mm-thick sections using a 64-row multi-detector row CT scanner (Discovery CT750hd; GE Healthcare, Waukesha, Wis, USA). The liver protocol includes non-contrast CT followed by a subsequent contrast-enhanced scan encompassing the arterial, portal, and delayed phases. Scanning to capture contrast-enhanced images was conducted at 25 s, 65 s, and 180 s after the injection of ioversol (injection rate of 3 mL/s, dose of 1.0 mL/kg of body weight). The scan parameters were as follows: tube current, 250 mA–350 mA; tube voltage, 120 kVp; rotation time of the tube, 0.8 s; pitch, 1.375:1; slice thickness, 1.25 mm; and interval thickness, 1.25 mm.
Image segmentation and radiomic feature extraction
Two blinded radiologists manually delineated the ROIs on arterial phase CT images using the uAI Research Portal (United Imaging Intelligence). The arterial phase was specifically selected because HCC typically exhibits intense hyperenhancement during this phase, providing superior tumor-to-liver contrast and texture details compared to other phases. This phase is critical for capturing the intratumoral heterogeneity associated with microvascular proliferation (VETC) and immune expression. Consequently, slice-by-slice tracing was performed to generate volumes of interest (VOIs), excluding peritumoral zones, major vessels (>3 mm), and necrotic areas (CT <30 HU). For multifocal cases, each tumor ≥1 cm received a separate annotation. Initial independent segmentations were compared using Dice coefficients, and discrepancies (DSC <0.7) were adjudicated by a senior radiologist. Consensus VOIs were generated through discussions. The uAI platform adheres to the Imaging Biomarker Standardization Initiative (IBSI) guidelines and follows the Clinical, Laboratory, and Experimental Analysis Report (CLEAR) framework.
Feature extraction was performed using the uAI Research Portal’s radiomics module, incorporating first-order statistics features, shape features, and gray-level-related features (such as gray-level co-occurrence matrix). Features were extracted from both raw images and those processed with various filters, such as box mean, Additive Gaussian Noise, and Binomial Blur Image.
Construction and validation of radiomics models
The radiomic features were selected sequentially to ensure robustness. First, correlation analysis and preliminary univariate screening were performed to reduce the dimensionality and remove redundant features. This process reduced the number of features from 2,286 to 593 for PD-L1 prediction and 482 for VETC prediction. Subsequently, univariate logistic regression with a stricter threshold (P-value <0.05) was applied to identify the most significant features, resulting in 64 retained features for PD-L1 and 30 for VETC. Finally, the LASSO regression model with 10-fold cross-validation was used to select the most predictive features, yielding seven features for PD-L1 and 10 for VETC. A radiomics score (Radscore) was calculated using the coefficients of the selected features.
Based on the Radscore, a radiomic model was constructed using machine learning algorithms such as AdaBoost (AB), Bagging Decision Tree (BDT), Decision Tree (DT), Logistic Regression (LR), Random Forest (RF), Support Vector Machine (SVM), and eXtreme Gradient Boosting (XGBOOST). Receiver Operating Characteristic (ROC) curves were plotted. The area under the curve (AUC) was used to evaluate the model’s predictive accuracy for PD-L1 and VETC. Decision Curve Analysis (DCA) was used to calculate the net benefit for patients at various threshold probabilities, assessing the clinical utility of each model.
Statistical analysis
Statistical analyses were conducted using SPSS 26 and R software 4.4.1. Normally distributed continuous variables are described as mean ± SD; non-normally distributed continuous variables are described as median and interquartile range (IQR), and categorical variables are expressed as numbers and percentages. Continuous clinical variables were analyzed using the Student’s t-test or Mann–Whitney U test, and categorical variables were analyzed using Pearson’s chi-square test. Statistical significance was set at p-value <0.05. The Wilcoxon test was used to compare the evaluation efficacy of Radscore between the training and validation groups for PD-L1 and VETC expression. The Brier score and Hosmer–Lemeshow test were used to assess model fit, with p >0.05 indicating a good fit. The DeLong test was used to evaluate the sensitivity, specificity, and AUC of the ROC curves to assess the effectiveness of the classification system.
Results
Patient characteristics
This study included 162 patients (male, n = 139; mean age 53.82 ± 12.29), among whom 72 (44.4%) were PD-L1 positive and 84 (51.9%) were VETC positive. Patients were randomly allocated in an 8:2 ratio to the training set (PD-L1+, n = 59, 45.4%; VETC+, n = 68, 52.3%) and test set (PD-L1+, n = 13, 40.6%; VETC+, n = 14, 43.8%). There were no significant differences in the clinical characteristics between the training and test sets (Table 1).
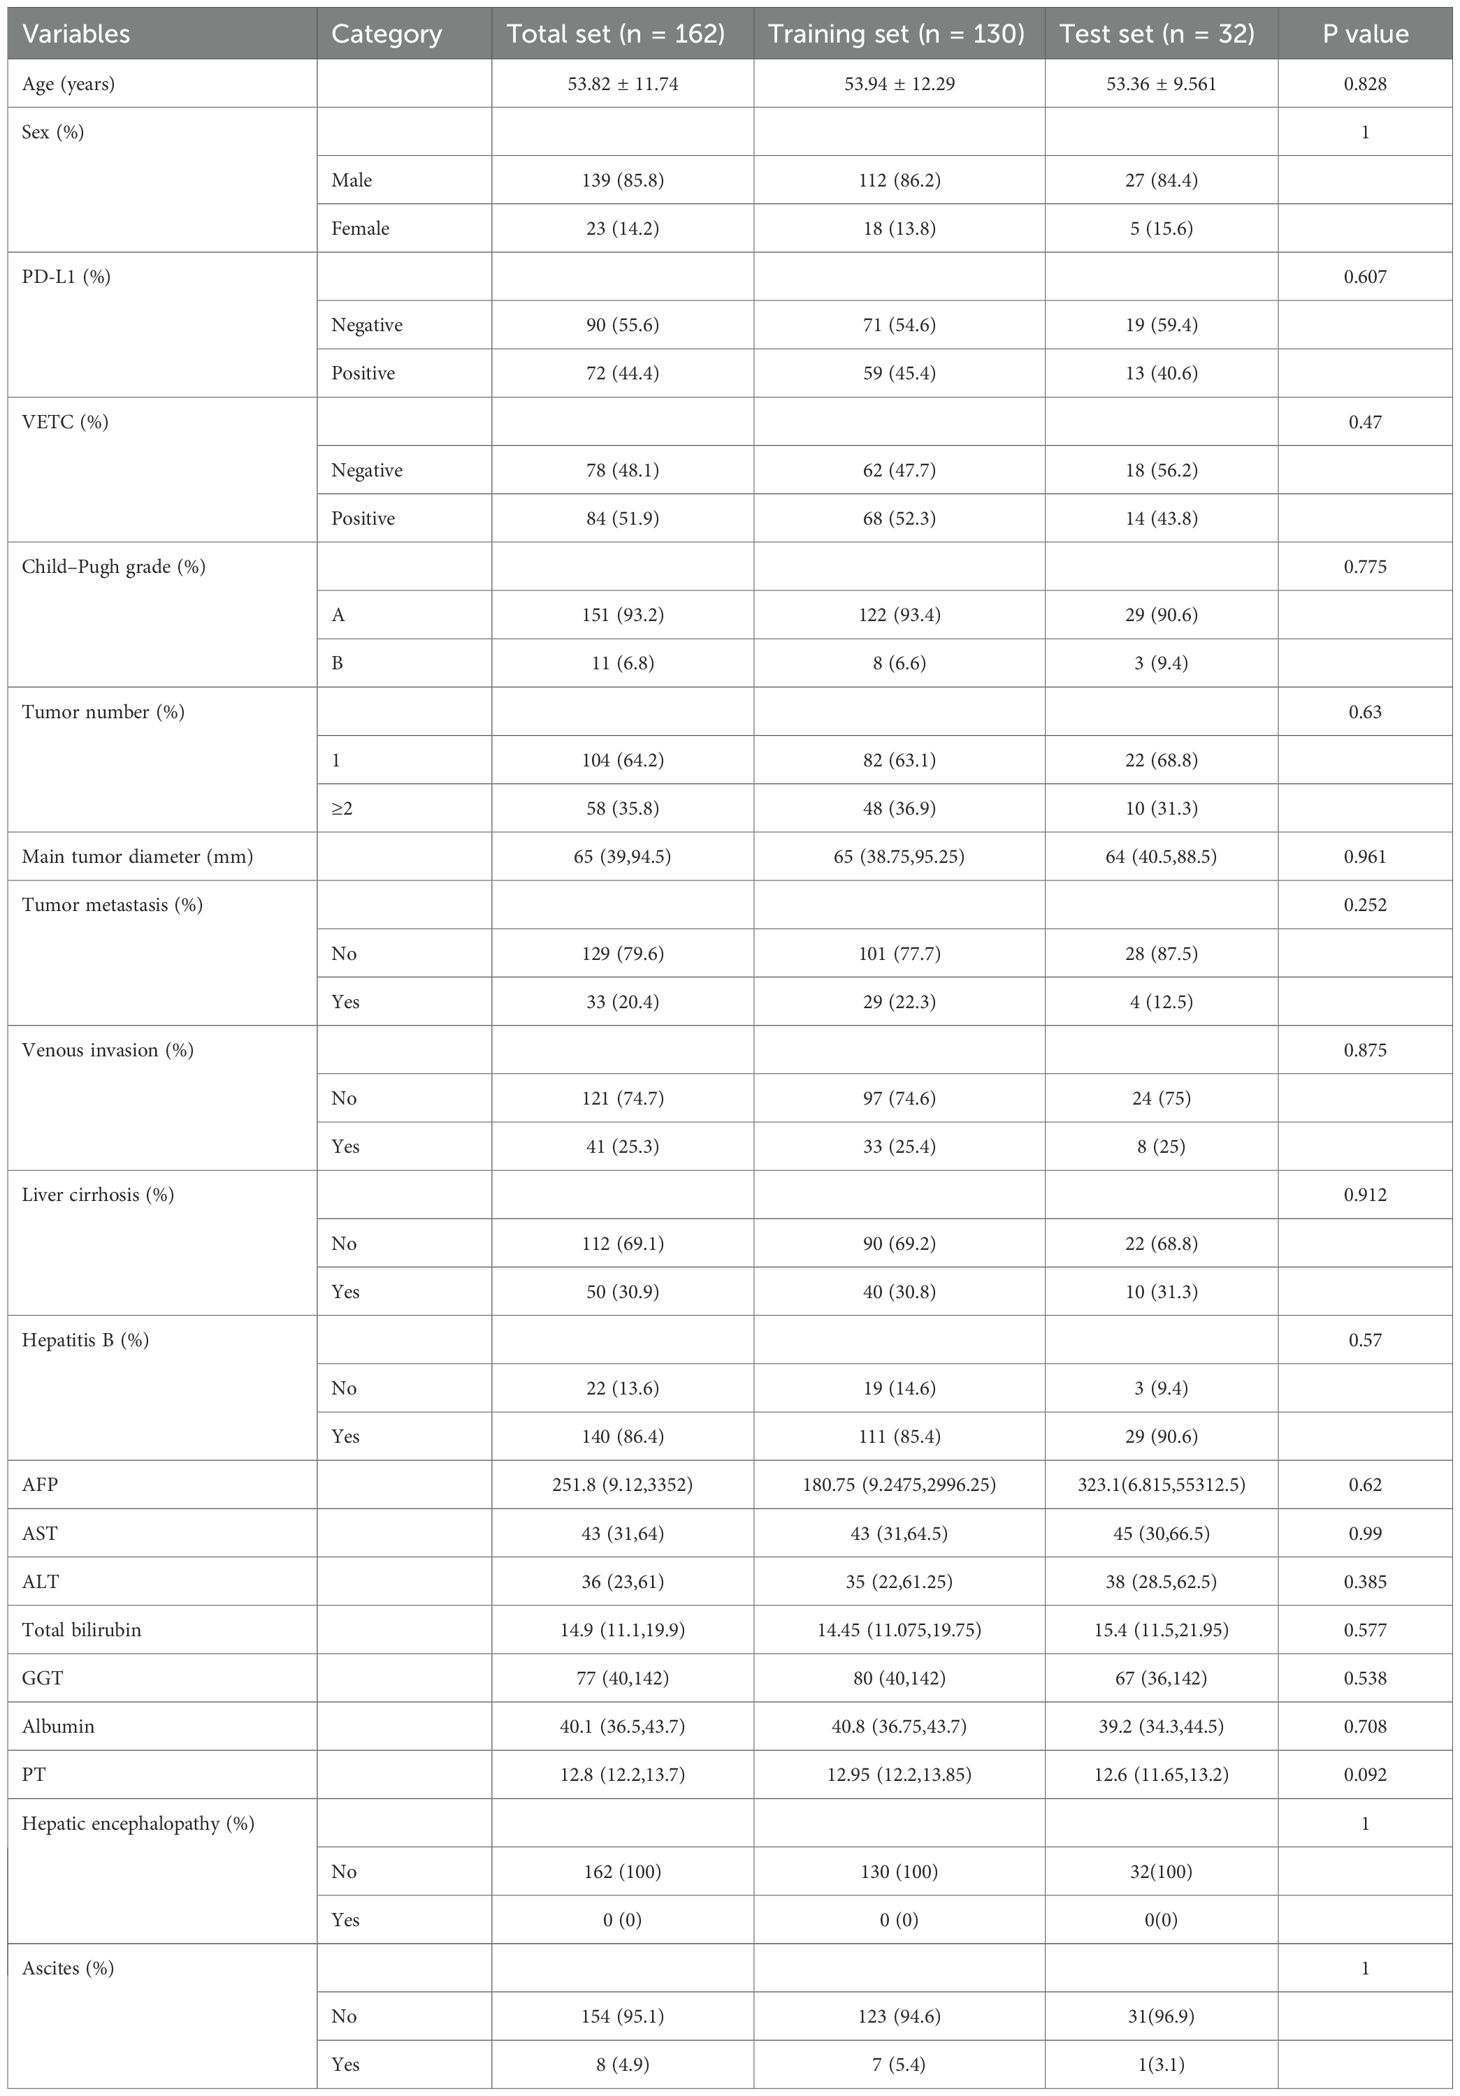
Table 1. Characteristic baseline of patients.
A total of 2,286 features were extracted and selected using correlation coefficients, logistic regression, and LASSO algorithms. Ultimately, we identified seven features strongly associated with PD-L1 and 10 features closely related to VETC. Specifically, the seven PD-L1-related features and five of the 10 VETC-related features showed positive correlations. The Radscore was calculated and used to construct the model. The details of Radscore are provided in Appendix 1.
Various radiomic models, including AB, BDT, DT, LR, RF, SVM, and XGBOOST, were used to predict PD-L1 and VETC, and the performance of each model was evaluated (Table 2, Figure 2). Among them, the RF model demonstrated the best performance, with an AUC of 0.834 (95% CI: 0.752–0.915) for PD-L1 prediction in the training set and 0.740 (95% CI: 0.541–0.939) in the test set. For VETC prediction, RF achieved an AUC of 0.883 (95% CI: 0.818–0.949) in the training set and 0.705 (95% CI: 0.488–0.922) in the test set. To assess the calibration and usefulness of the models, calibration curves and decision curve analyses (DCA) were calculated, and the results are shown in Figures 3, 4. The Hosmer–Lemeshow test (P >0.05) and Brier Score indicated a good model fit for the RF model.
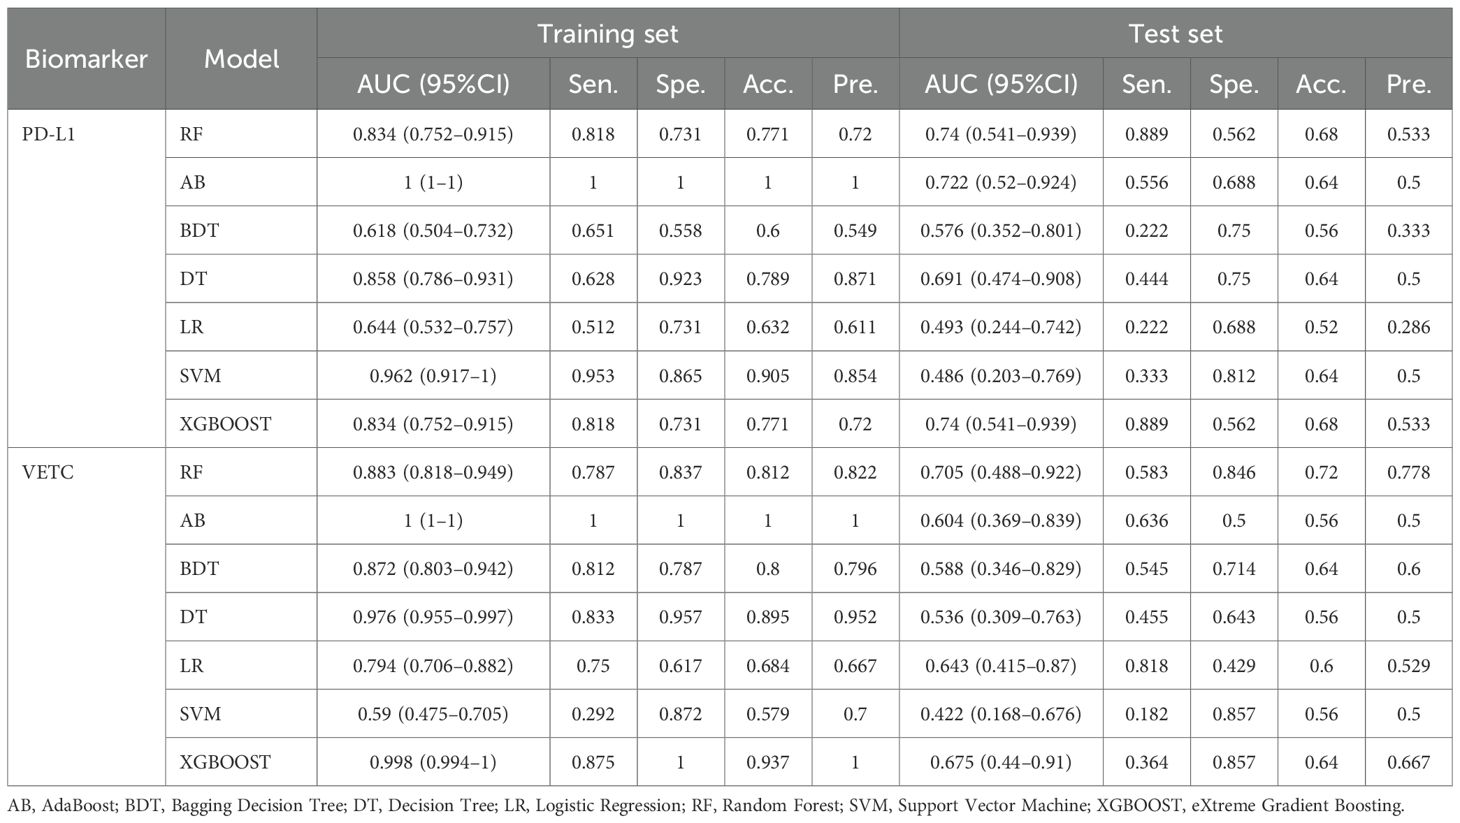
Table 2. Performance evaluation of radiomics models in predicting PD-L1 and VETC expression.
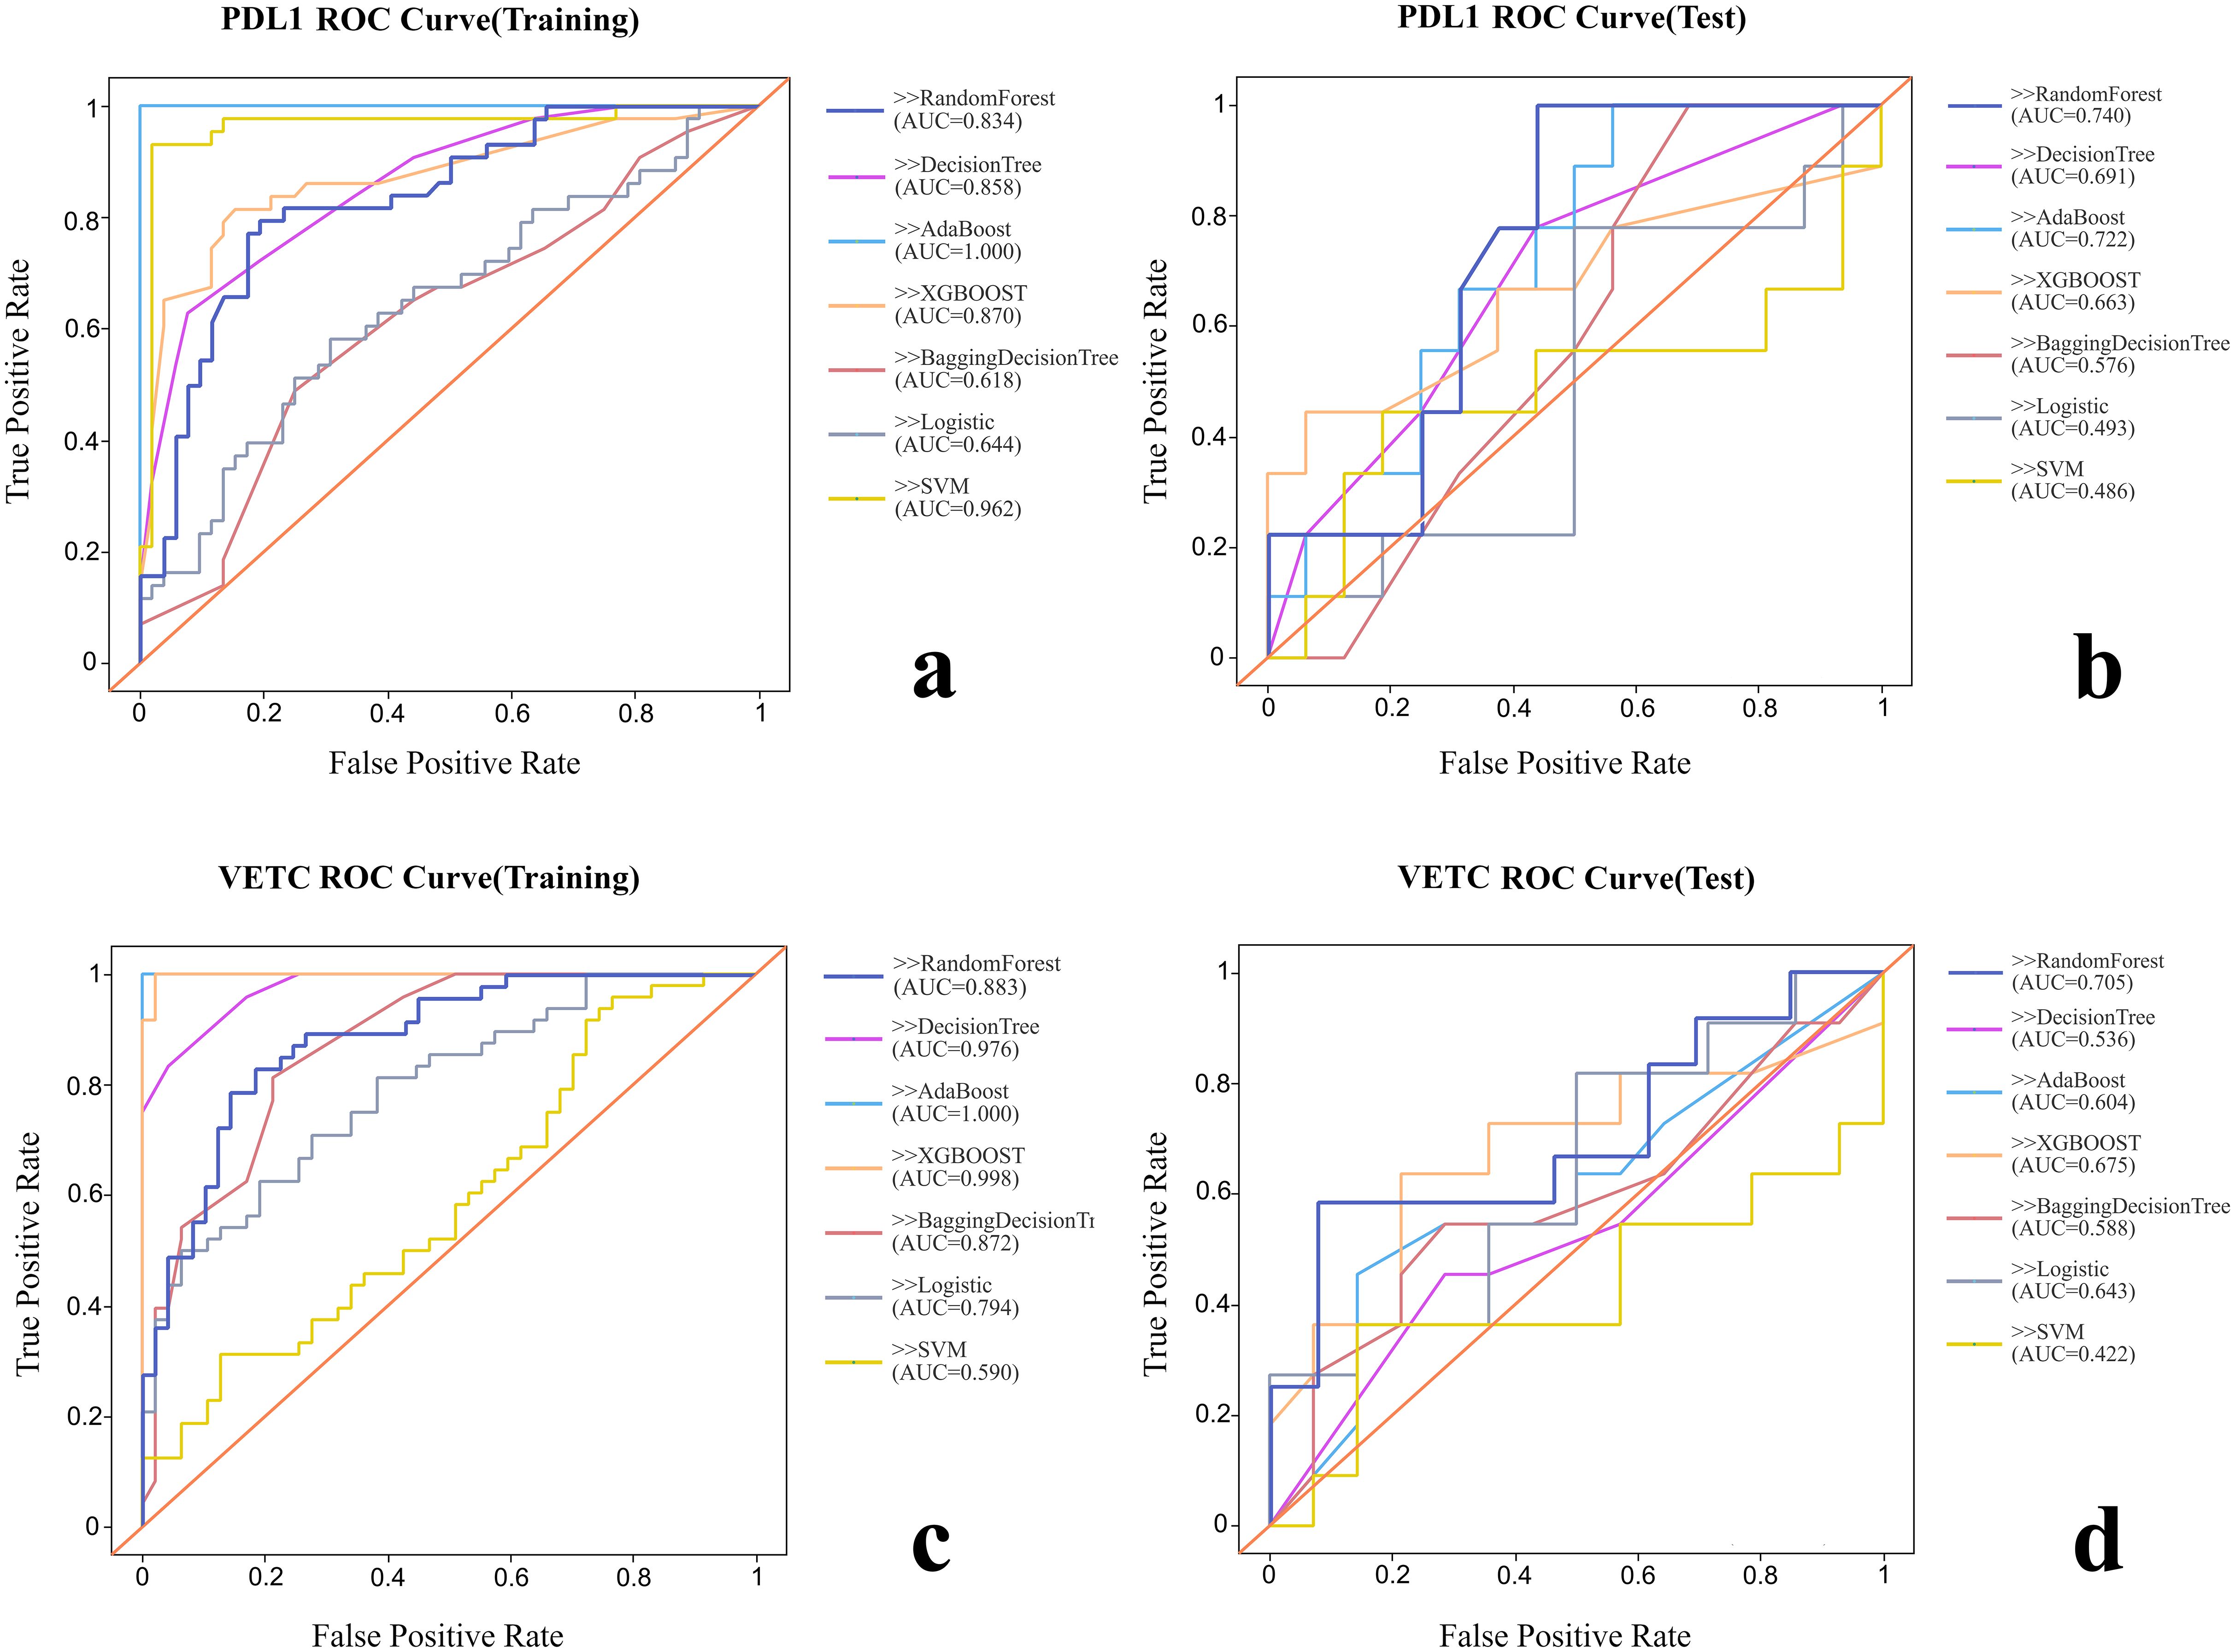
Figure 2. Comparison of the ROC curves of each radiomic model. (A) ROC curve of training group for PD-L1. (B) ROC curve of test group for PD-L1. (C) ROC curve of training group for VETC. (D) ROC curve of test group for VETC.
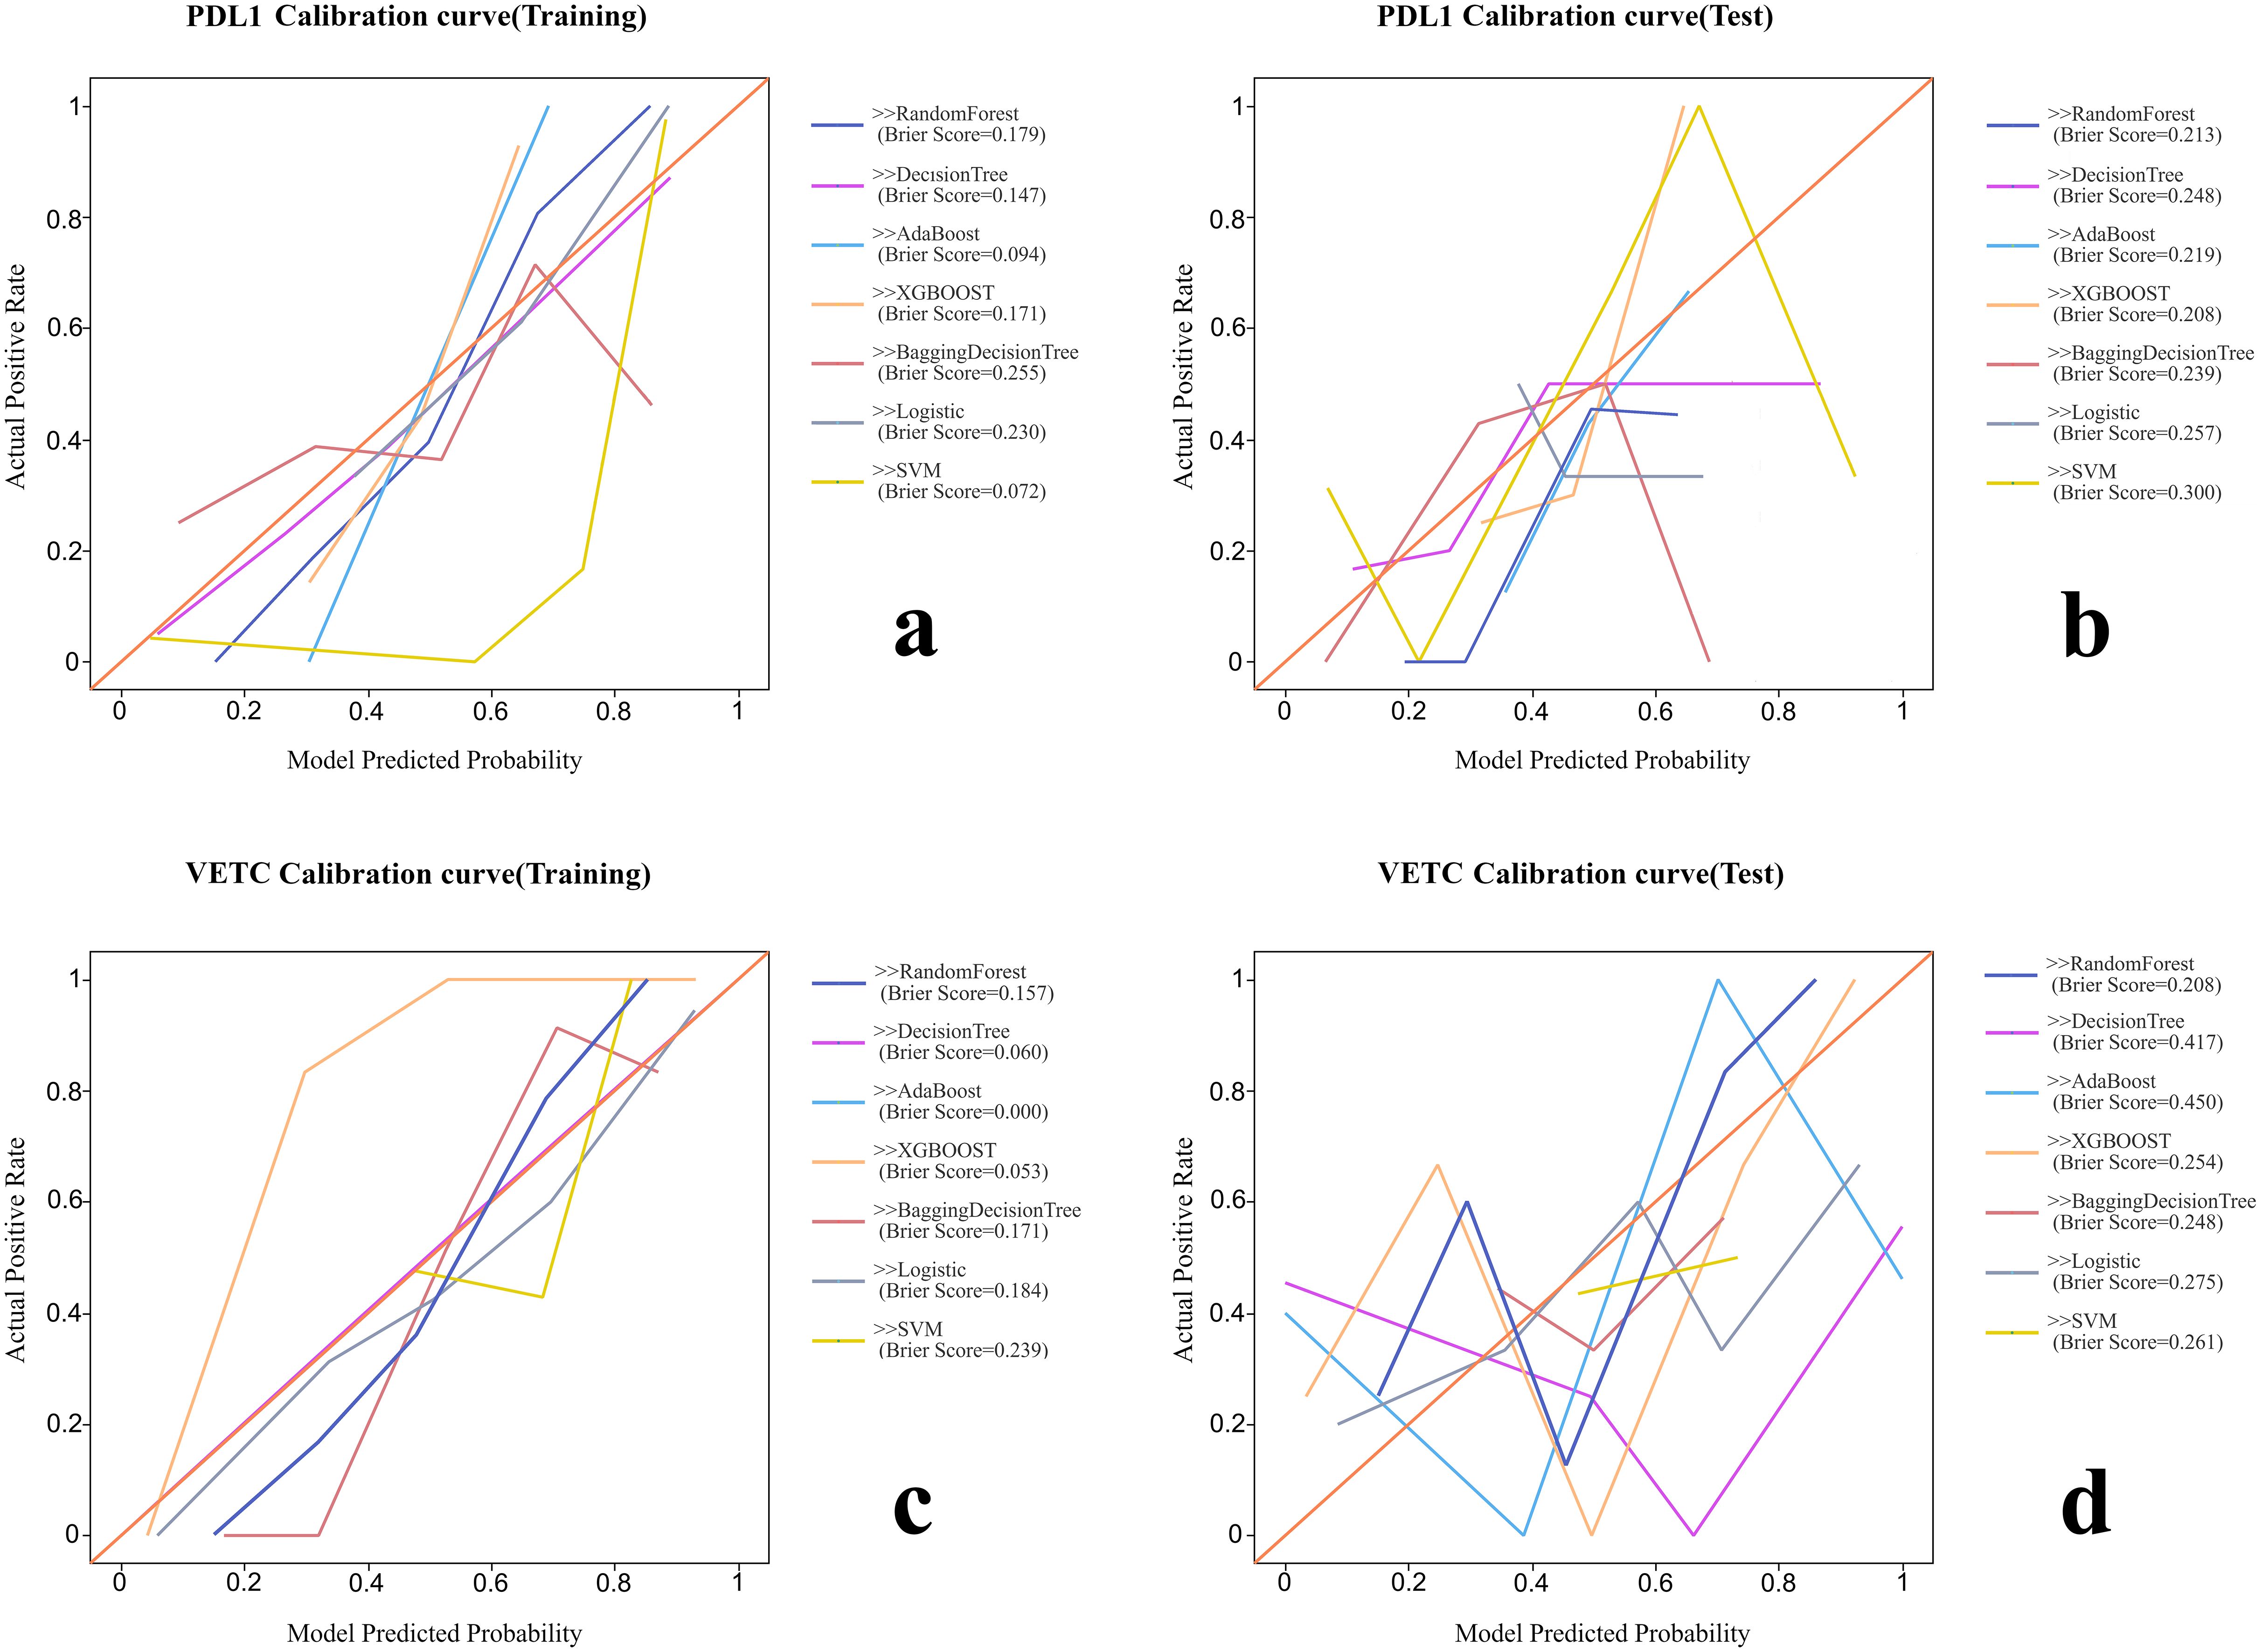
Figure 3. The calibration curves and Brier scores of each radiomic model. (A) Calibration curve of training group for PD-L1. (B) Calibration curve of test group for PD-L1. (C) Calibration curve of training group for VETC. (D) Calibration curve of test group for VETC.
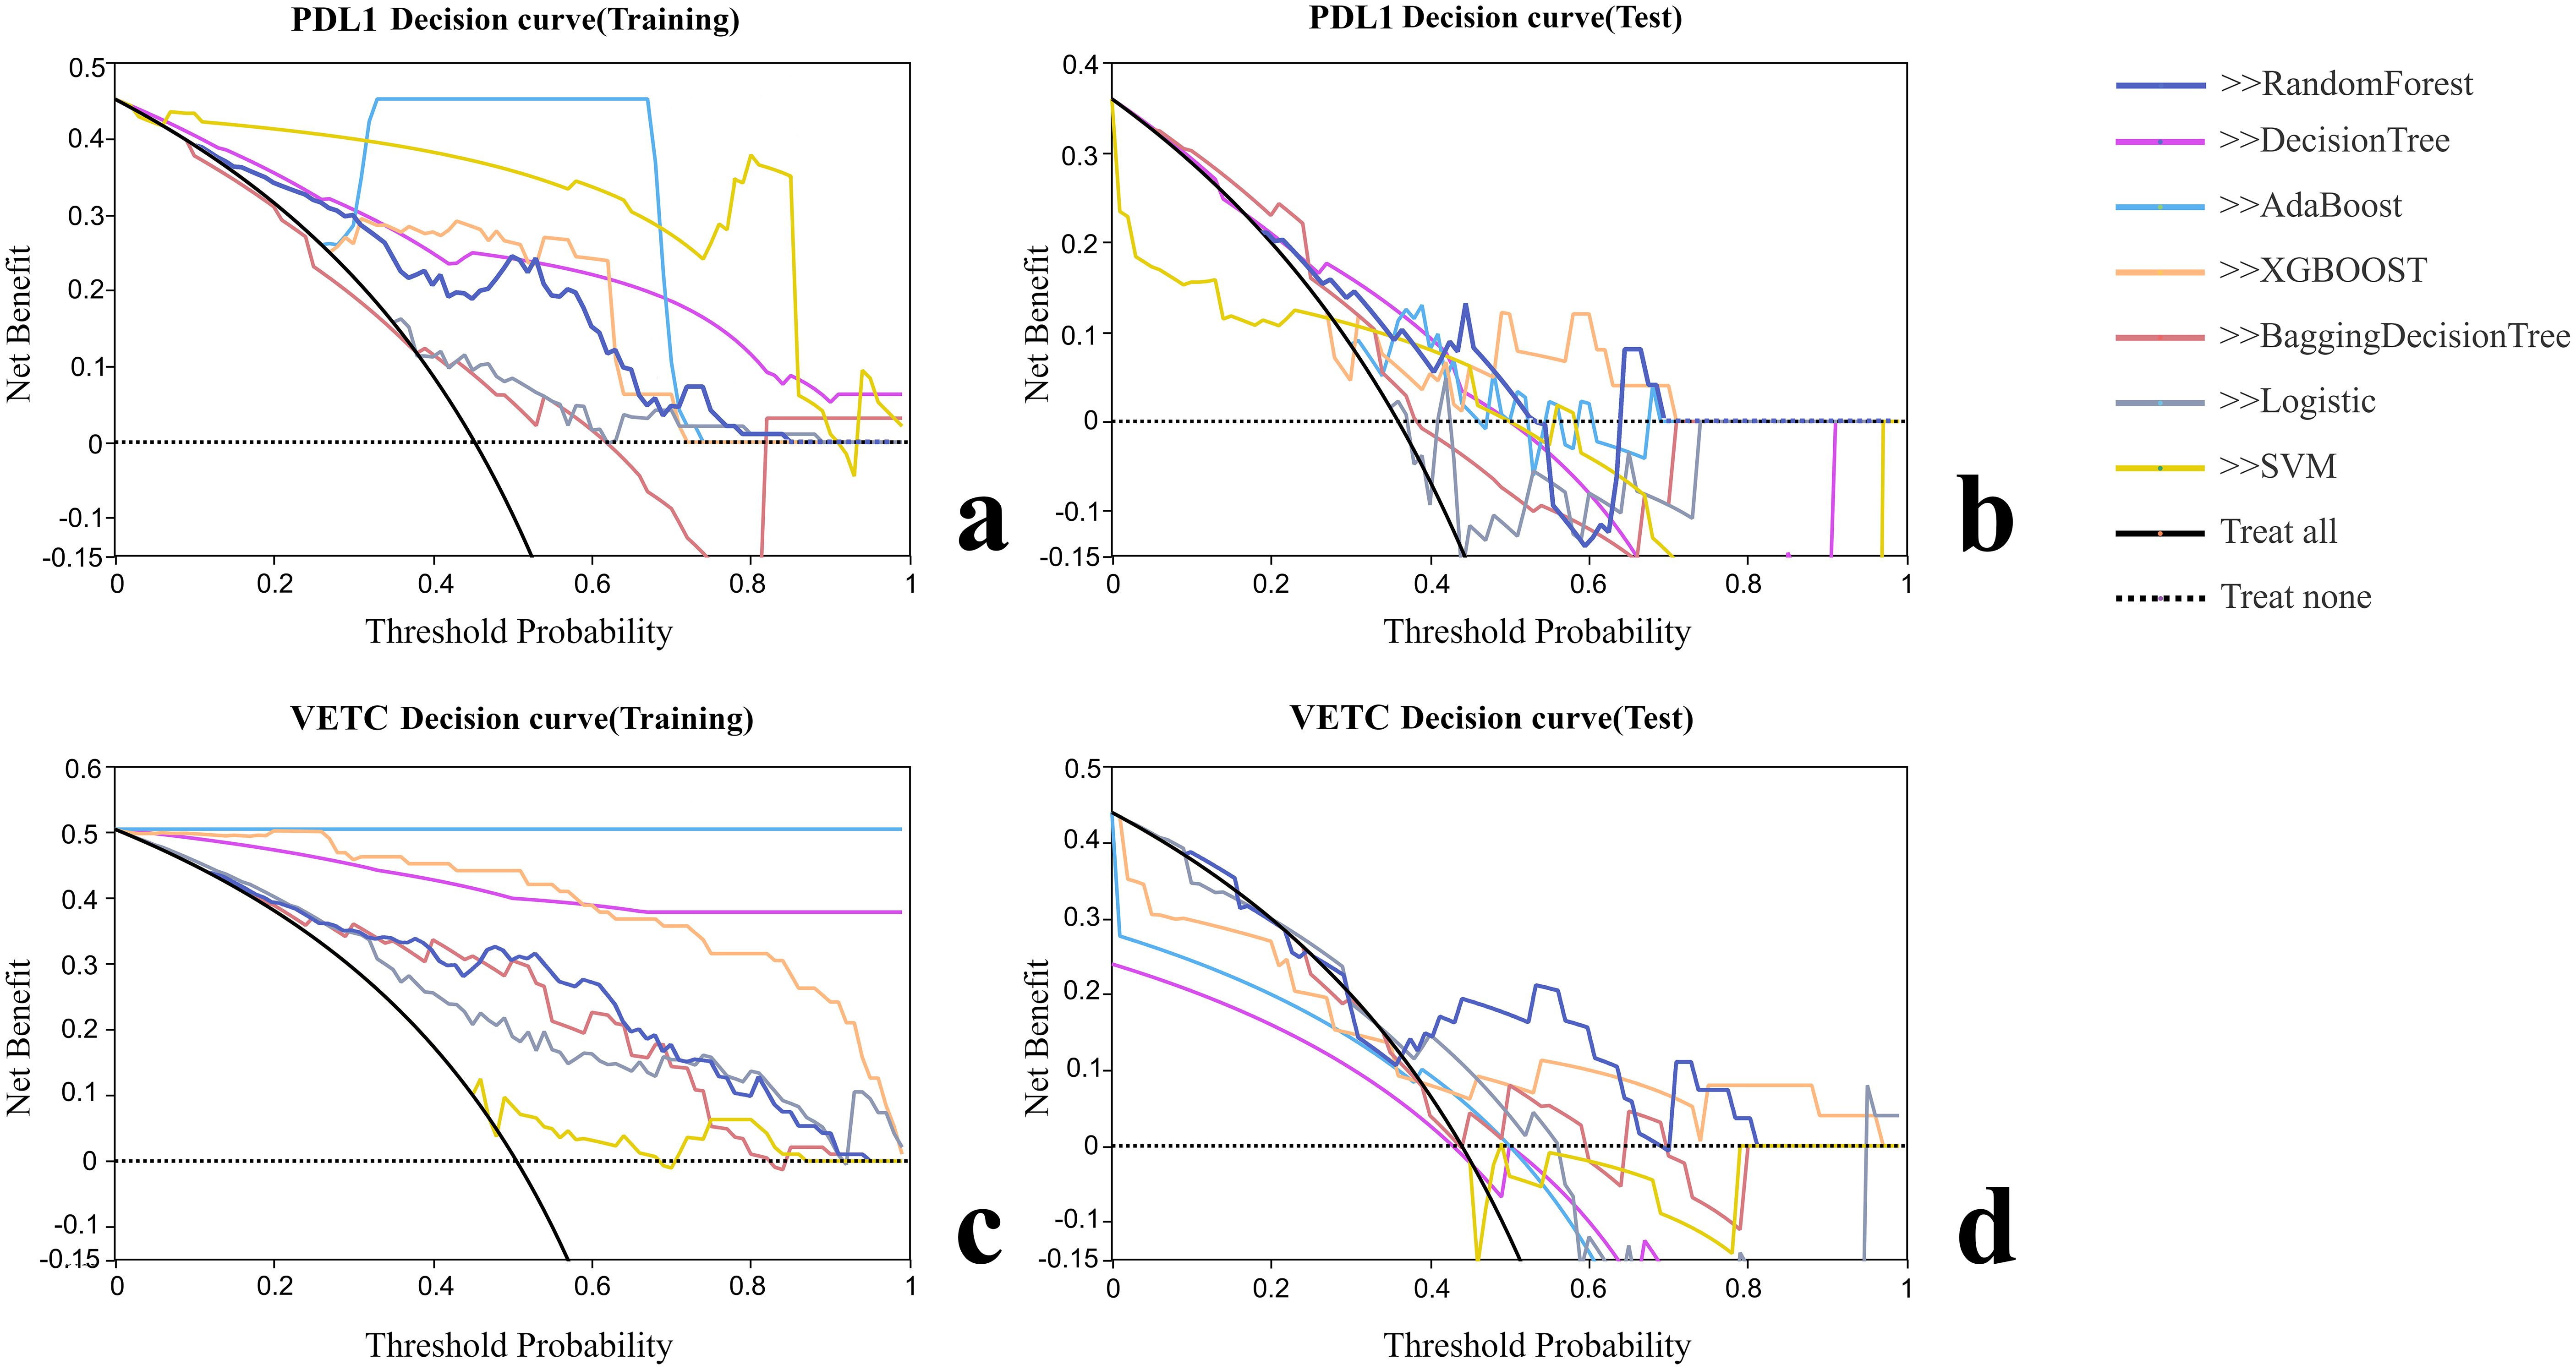
Figure 4. Decision curve analysis of each radiomic model. (A) Decision curve analysis of training group for PD-L1. (B) Decision curve analysis of test group for PD-L1. (C) Decision curve analysis of training group for VETC. (D) Decision curve analysis of test group for VETC.
Discussion
In this study, we established an imaging radiomics model based on enhanced abdominal CT scans to predict the expression of PD-L1 and VETC in patients with HCC. This model aims to provide noninvasive biomarkers for therapeutic decision-making in patients without available histopathological data. The results demonstrate that the RF model achieved high diagnostic efficacy in identifying PD-L1 and VETC expression.
The AUC for PD-L1 prediction in the test set was 0.740 (95% CI: 0.541–0.939), indicating a moderate discriminative ability. Although it did not reach the ideal threshold (AUC ≥0.8), its noninvasive nature can provide preliminary risk stratification for patients who cannot undergo biopsy, such as prioritizing high-risk patients for immune checkpoint inhibitor treatment. The performance decline in the test set (e.g., VETC AUC dropping from 0.883 to 0.705) may be attributed to the insufficient sample size (n = 32) or differences in feature distribution between the training and test sets. Future validation with larger samples and multicenter data is needed to assess the model’s stability.
Radiomics offers significant predictive advantages owing to its noninvasive nature, enabling the analysis of medical images without invasive procedures. It facilitates high-dimensional data analysis by extracting quantitative features that provide insights into tumor morphology and texture, surpassing the capabilities of traditional imaging methods (14). This approach supports personalized medicine by identifying specific pathological characteristics for tailored treatment plans in patients with HCC. Feature selection was conducted using correlation coefficients, univariate logistic regression, and Lasso regression to enhance predictive capability. The RF model demonstrated good calibration and fit in both the training and testing groups, indicating its effectiveness in predicting PD-L1 and VETC expression, which may be attributed to the ability of its ensemble learning mechanism to capture nonlinear relationships in high-dimensional features. We acknowledge the performance gap observed between the training and test sets, particularly for VETC prediction (AUC decrease from 0.883 to 0.705). This pattern is indicative of potential overfitting, a common challenge in radiomics studies, characterized by high dimensionality relative to the sample size. Notably, compared to the Random Forest model, other algorithms, such as AdaBoost, achieved an AUC of 1.000 in the training set but suffered more severe performance declines in the test set, highlighting their sensitivity to noise in high-dimensional data. This observation reinforces our rationale for selecting the Random Forest classifier, which utilizes ensemble methods to better manage variance. The observed performance fluctuations are likely attributable to several factors: the high feature-to-sample ratio, the inherent heterogeneity of HCC not fully captured in the limited test partition (n = 32), and the lack of nested cross-validation. Although we employed LASSO feature selection to mitigate these issues, future validation in larger, multicenter cohorts is essential to confirm model generalization. Moreover, it aims to provide noninvasive biomarkers for patients without tissue pathology data, thereby assisting in clinical decision-making and improving patient outcomes.
Consistent with studies by Dong et al. (15), Zhang et al. (16), and Xie et al. (17), our radiomics model leverages imaging data to predict the pathological presentations of HCC preoperatively with notable efficacy and reproducibility. This confirms the correlation between radiographic images and the expression of tumor pathology. Recent studies have highlighted the potential of radiomics in decoding the tumor immune microenvironment of HCC. For instance, radiomic signatures have been shown to correlate with the density of tertiary lymphoid structures and the infiltration of CD8+ T cells, offering noninvasive insights into the immune landscape (18, 19). Our findings align with this emerging evidence, suggesting that CT-based features capture subtle textural patterns associated with immune-related biomarkers, such as PD-L1. Compared to prior research, our RF model integrates predictions of PD-L1 and VETC, offering a comprehensive assessment that can more thoroughly evaluate and predict the disease state of patients, thereby guiding therapeutic decision-making.
High PD-L1 expression is closely associated with the immune evasion mechanisms of tumors and the formation of the tumor microenvironment, significantly correlating with patient prognosis (20). VETC has been proven to be particularly related to extrahepatic metastasis, especially to the lungs, compared to other distant metastases (21). The expression of PD-L1 and VETC has been identified as an independent predictor of poor prognosis in patients with HCC, indicating a higher likelihood of tumor recurrence and metastasis (22–25). Assessing the expression status of PD-L1 and VETC can guide clinical decision-making and personalized treatment for HCC patients (26). For instance, the level of PD-L1 expression can direct the selection of ICI therapy protocols in liver cancer patients, as suggested by the KEYNOTE-224 study, in which pembrolizumab showed superior efficacy in patients with higher levels of PD-L1 expression (27). Additionally, VETC-positive cases are more sensitive to TACE, HAIC, and targeted therapies, deriving more treatment benefits than VETC-negative cases (9, 28–30). Our constructed radiomics model exhibited good sensitivity and specificity in predicting the expression of PD-L1 and VETC, holding potential clinical application value to aid in the formulation of clinical treatment plans and prognosis evaluation.
While our model demonstrated promising results, the retrospective single-center design and relatively limited sample size, particularly in the independent test set (n = 32), represent primary limitations. The observed performance fluctuations between the training and test cohorts may be partially attributed to the small sample size and potential distribution shifts in the high-dimensional features. Consequently, the current results should be interpreted as being preliminary. Future studies utilizing large-scale, multicenter cohorts are essential to validate the model’s generalizability and robustness across diverse populations. Moreover, the study primarily relied on CT imaging data and utilized arterial phase imaging. Incorporating multimodal imaging techniques, such as MRI, and integrating multi-sequence imaging information could provide more comprehensive insights and improve the accuracy of the prediction model in future investigations.
In addition, HCC that concurrently exhibits both VETC and classical vascular structures (VETC±) has a worse prognosis than HCC that solely expresses VETC− or VETC +. Patients with VETC± have shorter survival times and higher recurrence rates. Pathological evidence suggests that in VETC± HCC, liver metastasis is more likely to occur through an epithelial–mesenchymal transition (EMT)-dependent mechanism associated with VETC− rather than via the VETC pathway (31). This variation in expression influences treatment choice and prognosis. In this study, we did not separate the VETC± cases from the VETC+ cases. Future studies should isolate these cases for dedicated radiomic analyses.
Future research should address these limitations and explore the integration of radiological models into clinical decision-making processes to improve treatment outcomes and prognosis in patients with HCC.
Conclusion
A radiomic model established using random forests (RF) based on enhanced abdominal CT demonstrated the potential to non-invasively predict PD-L1 and VETC expression in HCC patients. This model may provide preliminary information to assist clinicians in guiding clinical decision-making and developing personalized treatment plans, particularly for patients lacking histopathological data, ultimately aimed at improving therapeutic efficacy and prognosis for HCC patients.
Data availability statement
The raw data supporting the conclusions of this article will be made available by the authors, without undue reservation.
Ethics statement
The studies involving humans were approved by Medical Ethics Committee of Sun Yat-sen Memorial Hospital, Sun Yat-sen University. The studies were conducted in accordance with the local legislation and institutional requirements. The ethics committee/institutional review board waived the requirement of written informed consent for participation from the participants or the participants’ legal guardians/next of kin due to retrospective nature of the study. All patient data was collected from existing medical records and was fully anonymized prior to analysis, ensuring that patient privacy was protected and there was no additional risk to the participants. Written informed consent was not obtained from the individual(s) for the publication of any potentially identifiable images or data included in this article due to retrospective nature of the study.
Author contributions
WW: Conceptualization, Data curation, Formal analysis, Investigation, Methodology, Writing – original draft, Writing – review & editing. JL: Conceptualization, Data curation, Formal analysis, Investigation, Methodology, Project administration, Software, Writing – original draft, Writing – review & editing. YY: Conceptualization, Data curation, Formal analysis, Investigation, Methodology, Software, Writing – original draft, Writing – review & editing. KW: Conceptualization, Software, Writing – review & editing. GG: Conceptualization, Writing – review & editing. ZZ: Conceptualization, Resources, Supervision, Writing – review & editing. ZX: Conceptualization, Supervision, Writing – review & editing, Resources.
Funding
The author(s) declared that financial support was not received for this work and/or its publication.
Conflict of interest
The authors declared that this work was conducted in the absence of any commercial or financial relationships that could be construed as a potential conflict of interest.
Generative AI statement
The author(s) declare that Generative AI was not used in the creation of this manuscript.
Any alternative text (alt text) provided alongside figures in this article has been generated by Frontiers with the support of artificial intelligence and reasonable efforts have been made to ensure accuracy, including review by the authors wherever possible. If you identify any issues, please contact us.
Publisher’s note
All claims expressed in this article are solely those of the authors and do not necessarily represent those of their affiliated organizations, or those of the publisher, the editors and the reviewers. Any product that may be evaluated in this article, or claim that may be made by its manufacturer, is not guaranteed or endorsed by the publisher.
Supplementary material
The Supplementary Material for this article can be found online at: https://www.frontiersin.org/articles/10.3389/fonc.2025.1696376/full#supplementary-material
Abbreviations
PD-L1, programmed cell death 1 ligand 1; VETC, vessels encapsulating tumor clusters; HCC, hepatocellular carcinoma; PD-1, programmed death protein 1; AI, artificial intelligence; CT, computed tomography; ROI, regions of interest; VOI, volumes of interest; DSC, dice similarity coefficient; IBSI: imaging biomarker standardization initiative; CLEAR, clinical, laboratory, and experimental analysis report; Lasso, least absolute shrinkage and selection operator regression; AB, AdaBoost, Adaptive Boosting; BDT, bagging decision tree; DT; decision tree; LR, logistic regression; RF, random forest; SVM, support vector machine; XGBOOST, eXtreme gradient boosting; ROC, receiver operating characteristic; AUC, area under the curve; DCA, decision curve analysis; SD, standard deviation; IQR, interquartile range; EMT, epithelial–mesenchymal transition; GGT, gamma-glutamyl transferase; PT, prothrombin time; CI, Child–Pugh index.
References
1. Ganesan P and Kulik LM. Hepatocellular carcinoma: new developments. Clin Liver Dis. (2023) 27:85–102. doi: 10.1016/j.cld.2022.08.004
2. Bray F, Laversanne M, Sung H, Ferlay J, Siegel RL, Soerjomataram I, et al. Global cancer statistics 2022: GLOBOCAN estimates of incidence and mortality worldwide for 36 cancers in 185 countries. CA Cancer J Clin. (2024) 74:229–63. doi: 10.3322/caac.21834
3. Lei Q, Wang D, Sun K, Wang L, and Zhang Y. Resistance mechanisms of anti-PD1/PDL1 therapy in solid tumors. Front Cell Dev Biol. (2020) 8:672. doi: 10.3389/fcell.2020.00672
4. Thibult ML, Mamessier E, Gertner-Dardenne J, Pastor S, Just-Landi S, Xerri L, et al. PD-1 is a novel regulator of human B-cell activation. Int Immunol. (2013) 25:129–37. doi: 10.1093/intimm/dxs098
5. Pedoeem A, Azoulay-Alfaguter I, Strazza M, Silverman GJ, and Mor A. Programmed death-1 pathway in cancer and autoimmunity. Clin Immunol. (2014) 153:145–52. doi: 10.1016/j.clim.2014.04.010
6. Matsuda K, Kurebayashi Y, Masugi Y, Yamazaki K, Ueno A, Tsujikawa H, et al. Immunovascular microenvironment in relation to prognostic heterogeneity of WNT/beta-catenin-activated hepatocellular carcinoma. Hepatol Res. (2023) 53:344–56. doi: 10.1111/hepr.13869
7. Fang JH, Zhou HC, Zhang C, Shang LR, Zhang L, Xu J, et al. A novel vascular pattern promotes metastasis of hepatocellular carcinoma in an epithelial-mesenchymal transition-independent manner. Hepatology. (2015) 62:452–65. doi: 10.1002/hep.27760
8. Sugino T, Yamaguchi T, Hoshi N, Kusakabe T, Ogura G, Goodison S, et al. Sinusoidal tumor angiogenesis is a key component in hepatocellular carcinoma metastasis. Clin Exp Metast. (2008) 25:835–41. doi: 10.1007/s10585-008-9199-6
9. Fang JH, Xu L, Shang LR, Pan CZ, Ding J, Tang YQ, et al. Vessels that encapsulate tumor clusters (VETC) pattern is a predictor of sorafenib benefit in patients with hepatocellular carcinoma. Hepatology. (2019) 70:824–39. doi: 10.1002/hep.30366
10. Liu Z and Zhao P. Integrative analysis unveils ECM signatures and pathways driving hepatocellular carcinoma progression: A multi-omics approach and prognostic model development. J Cell Mol Med. (2024) 28:e18230. doi: 10.1111/jcmm.18230
11. Renne SL, Woo HY, Allegra S, Rudini N, Yano H, Donadon M, et al. Vessels encapsulating tumor clusters (VETC) is a powerful predictor of aggressive hepatocellular carcinoma. Hepatology. (2020) 71:183–95. doi: 10.1002/hep.30814
12. Meyerholz DK and Beck AP. Principles and approaches for reproducible scoring of tissue stains in research. Lab Invest. (2018) 98:844–55. doi: 10.1038/s41374-018-0057-0
13. Gong XQ, Liu N, Tao YY, Li L, Li ZM, Yang L, et al. Radiomics models based on multisequence MRI for predicting PD-1/PD-L1 expression in hepatocellular carcinoma. Sci Rep. (2023) 13:7710. doi: 10.1038/s41598-023-34763-y
14. Maino C, Vernuccio F, Cannella R, Franco PN, Giannini V, Dezio M, et al. Radiomics and liver: Where we are and where we are headed? Eur J Radiol. (2024) 171:111297. doi: 10.1016/j.ejrad.2024.111297
15. Dong X, Yang J, Zhang B, Li Y, Wang G, Chen J, et al. Deep learning radiomics model of dynamic contrast-enhanced MRI for evaluating vessels encapsulating tumor clusters and prognosis in hepatocellular carcinoma. J Magn Reson Imag. (2024) 59:108–19. doi: 10.1002/jmri.28745
16. Zhang C, Zhong H, Zhao F, Ma ZY, Dai ZJ, and Pang GD. Preoperatively predicting vessels encapsulating tumor clusters in hepatocellular carcinoma: Machine learning model based on contrast-enhanced computed tomography. World J Gastrointest Oncol. (2024) 16:857–74. doi: 10.4251/wjgo.v16.i3.857
17. Xie T, Wei Y, Xu L, Li Q, Che F, Xu Q, et al. Self-supervised contrastive learning using CT images for PD-1/PD-L1 expression prediction in hepatocellular carcinoma. Front Oncol. (2023) 13:1103521. doi: 10.3389/fonc.2023.1103521
18. Long S, Li M, Chen J, Zhong L, Abudulimu A, Zhou L, et al. Spatial patterns and MRI-based radiomic prediction of high peritumoral tertiary lymphoid structure density in hepatocellular carcinoma: a multicenter study. J ImmunoTher Cancer. (2024) 12:e009879. doi: 10.1136/jitc-2024-009879
19. Choi J, Gordon A, Eresen A, Zhang Z, Borhani A, Bagci U, et al. Current applications of radiomics in the assessment of tumor microenvironment of hepatocellular carcinoma. Abdom Radiol. (2025) 50:4661–75. doi: 10.1007/s00261-025-04916-w
20. Chang CH, Qiu J, O’Sullivan D, Buck MD, Noguchi T, Curtis JD, et al. Metabolic competition in the tumor microenvironment is a driver of cancer progression. Cell. (2015) 162:1229–41. doi: 10.1016/j.cell.2015.08.016
21. Woo HY, Rhee H, Yoo JE, Kim SH, Choi GH, Kim DY, et al. Lung and lymph node metastases from hepatocellular carcinoma: Comparison of pathological aspects. Liver Int. (2022) 42:199–209. doi: 10.1111/liv.15051
22. Zeng T, Zhao Q, Liu J, Dai B, Wang T, Yang F, et al. Expression pattern of PD-1/PD-L1 in primary liver cancer with clinical correlation. Liver Int. (2023) 43:1995–2001. doi: 10.1111/liv.15666
23. Xie M, Lin Z, Ji X, Luo X, Zhang Z, Sun M, et al. FGF19/FGFR4-mediated elevation of ETV4 facilitates hepatocellular carcinoma metastasis by upregulating PD-L1 and CCL2. J Hepatol. (2023) 79:109–25. doi: 10.1016/j.jhep.2023.02.036
24. Li XS, Li JW, Li H, and Jiang T. Prognostic value of programmed cell death ligand 1 (PD-L1) for hepatocellular carcinoma: a meta-analysis. Biosci Rep. (2020) 40:BSR20200459. doi: 10.1042/BSR20200459
25. Escors D, Gato-Canas M, Zuazo M, Arasanz H, Garcia-Granda MJ, Vera R, et al. The intracellular signalosome of PD-L1 in cancer cells. Signal Transduct Target Ther. (2018) 3:26. doi: 10.1038/s41392-018-0022-9
26. Zhang N, Yang X, Piao M, Xun Z, Wang Y, Ning C, et al. Biomarkers and prognostic factors of PD-1/PD-L1 inhibitor-based therapy in patients with advanced hepatocellular carcinoma. biomark Res. (2024) 12:26. doi: 10.1186/s40364-023-00535-z
27. Zhu AX, Finn RS, Edeline J, Cattan S, Ogasawara S, Palmer D, et al. Pembrolizumab in patients with advanced hepatocellular carcinoma previously treated with sorafenib (KEYNOTE-224): a non-randomised, open-label phase 2 trial. Lancet Oncol. (2018) 19:940–52. doi: 10.1016/S1470-2045(18)30351-6
28. Lin C, He Y, Liu M, Wu A, Zhang J, Li S, et al. Vessels that encapsulate tumor clusters (VETC) predict cTACE response in hepatocellular carcinoma. J Hepatocell Carcinom. (2023) 10:383–97. doi: 10.2147/JHC.S395903
29. Wang JH, Li XS, Tang HS, Fang RY, Song JJ, Feng YL, et al. Vessels that encapsulate tumor clusters (VETC) pattern predicts the efficacy of adjuvant TACE in hepatocellular carcinoma. J Cancer Res Clin Oncol. (2023) 149:4163–72. doi: 10.1007/s00432-022-04323-4
30. Lin W, Lu L, Zheng R, Yuan S, Li S, Ling Y, et al. Vessels encapsulating tumor clusters: a novel efficacy predictor of hepatic arterial infusion chemotherapy in unresectable hepatocellular carcinoma. J Cancer Res Clin Oncol. (2023) 149:17231–9. doi: 10.1007/s00432-023-05444-0
Keywords: hepatocellular carcinoma, PD-L1, VETC, radiomics, machine learning, random forest
Citation: Wang W, Lu J, Yan Y, Wen K, Guo G, Zhou Z and Xiao Z (2025) A radiomic model for noninvasive prediction of PD-L1 and VETC expression in hepatocellular carcinoma using enhanced abdominal CT. Front. Oncol. 15:1696376. doi: 10.3389/fonc.2025.1696376
Received: 31 August 2025; Accepted: 29 November 2025; Revised: 26 November 2025;
Published: 12 December 2025.
Edited by:
Hao Liu, Southern Medical University, ChinaReviewed by:
Yang Liu, Zhejiang Provincial People’s Hospital, ChinaJason Xing Kang, Nanyang Technological University, Singapore
Copyright © 2025 Wang, Lu, Yan, Wen, Guo, Zhou and Xiao. This is an open-access article distributed under the terms of the Creative Commons Attribution License (CC BY). The use, distribution or reproduction in other forums is permitted, provided the original author(s) and the copyright owner(s) are credited and that the original publication in this journal is cited, in accordance with accepted academic practice. No use, distribution or reproduction is permitted which does not comply with these terms.
*Correspondence: Zhenyu Zhou, emhvdXpoeTI2QG1haWwyLnN5c3UuZWR1LmNu; Zhiyu Xiao, eGlhb3poaXlAbWFpbC5zeXN1LmVkdS5jbg==
†These authors share first authorship