Abstract
Background:
Pancreatic ductal adenocarcinoma (PDAC) exhibits high lethality due to late diagnosis, therapy resistance, and cancer stem cell (CSC)-driven progression. However, the molecular determinants of stemness in PDAC remain unclear.
Methods:
We integrated RNA-sequencing and clinical data from TCGA to calculate stemness indices and identify hub genes using weighted co-expression network analysis and differential expression profiling. PCDH1 expression was validated in PDAC tissues by qRT-PCR and immunohistochemistry. Functional assays, including MTT, colony formation, Transwell, wound healing, flow cytometry, and spheroid culture, were performed following PCDH1 knockdown. Transcriptome sequencing was used to delineate downstream signaling mechanisms.
Results:
PCDH1 emerged as a stemness-associated oncogene strongly linked to poor survival. It was markedly overexpressed in PDAC tissues and cell lines. Silencing PCDH1 significantly impaired proliferation, clonogenicity, migration, and CSC frequency. Sphere-forming ability was also reduced. Transcriptomic analysis revealed downregulation of PI3K/AKT signaling upon PCDH1 knockdown, and rescue experiments confirmed its role in driving PDAC progression through PI3K/AKT activation. High PCDH1 expression further correlated with immune exclusion and distinctive patterns of chemosensitivity.
Conclusion:
PCDH1 is a novel stemness-linked oncogene that accelerates PDAC progression via PI3K/AKT signaling. Its prognostic relevance, association with immune evasion, and impact on drug responsiveness highlight PCDH1 as a promising biomarker and therapeutic target for CSC-directed intervention in PDAC.
1 Introduction
Pancreatic ductal adenocarcinoma (PDAC) represents one of the most devastating solid tumors, characterized by rapid progression, profound therapeutic resistance, and extremely poor survival outcomes (1). Despite advances in multimodal management, including surgery, cytotoxic chemotherapy, and immunotherapeutic approaches, clinical benefits remain modest and long-term survival is rare (2). The aggressive biology of PDAC arises not only from its mutational landscape but also from profound cellular plasticity and adaptation to environmental stressors, which collectively fuel recurrence and metastasis (3).
Mounting evidence indicates that a small subset of tumor cells endowed with stem-like features—commonly referred to as cancer stem cells (CSCs)—play a decisive role in sustaining tumor heterogeneity and therapeutic refractoriness (4). These cells possess enhanced self-renewal capacity, plasticity, and the ability to reconstitute tumor hierarchies, enabling them to survive conventional therapies and drive relapse (5). Consequently, the molecular underpinnings of CSC maintenance have become an area of intense investigation, as their disruption could attenuate malignant progression and improve therapeutic outcomes in PDAC (6, 7).
Among the pathways implicated in sustaining stemness, the PI3K/AKT signaling axis has emerged as a central regulator of tumor growth, metabolic adaptation, and resistance mechanisms (8, 9). Dysregulation of this pathway is frequently observed in pancreatic cancer and is closely associated with both disease aggressiveness and therapeutic failure (10, 11). Identifying upstream regulators that interface with PI3K/AKT signaling and confer stemness advantages could therefore reveal novel vulnerabilities amenable to therapeutic intervention.
Protocadherin-1 (PCDH1), a member of the protocadherin family, has recently been implicated in multiple pathological processes, but its role in pancreatic cancer biology remains largely unexplored (12). Given the growing recognition of cell adhesion molecules as regulators of stemness and microenvironmental interactions, investigating whether PCDH1 functions as a stemness-linked oncogene in PDAC holds substantial promise (13, 14). Here, we systematically interrogated transcriptomic datasets, validated expression patterns in patient specimens, and functionally characterized PCDH1 in PDAC models to determine its contribution to tumor progression and stemness regulation.
2 Methods and materials
2.1 Data acquisition
RNA-sequencing data and corresponding clinical annotations for 179 pancreatic ductal adenocarcinoma (PDAC) specimens and 4 adjacent normal pancreatic tissues were obtained from the TCGA-PAAD cohort. Raw expression data were downloaded in fragments per kilobase per million (FPKM) format, accompanied by patient-level metadata including overall survival, tumor grade, and stage. Data retrieval and preprocessing were performed through the UCSC Xena browser (http://www.genome.ucsc.edu/index.html), ensuring standardized normalization. Only samples with complete clinical and survival information were retained for downstream analysis, thereby minimizing bias from missing data.
2.2 Tumor stemness index
To quantify cellular dedifferentiation, we utilized stemness indices derived from multi-omics features, as established by Malta et al. (14). Both RNA-based (mRNAsi) and DNA methylation-based (mDNAsi) scores were applied to TCGA tumors, while additional stemness indices—RNAss and DNAss—were acquired from published resources. These indices reflect transcriptomic and epigenetic stemness, respectively. For PDAC samples, RNAss values were emphasized due to their stronger correlation with patient outcomes. The indices were subsequently integrated with clinical variables to assess their prognostic significance and biological relevance.
2.3 Survival analysis
Overall survival (OS) was defined as the primary clinical endpoint. Patients were stratified into high- and low-expression groups according to the median expression values of candidate genes or stemness indices. Kaplan–Meier survival curves were constructed, and differences were evaluated using log-rank tests. In addition, univariate Cox proportional-hazards regression was conducted to identify prognostic genes. Hazard ratios (HRs) with 95% confidence intervals (CIs) were calculated to estimate the relative risk of mortality. This dual approach ensured both statistical robustness and clinical interpretability.
2.4 Weighted gene co-expression analysis
To explore gene modules associated with stemness traits, we implemented WGCNA in R. Hierarchical clustering of all PDAC samples was performed to exclude outliers, followed by the determination of an appropriate soft-thresholding power (β) using the pickSoftThreshold function to approximate a scale-free network. Genes were subsequently organized into co-expression modules by dynamic tree cutting, and eigengenes for each module were correlated with stemness indices. Modules most strongly associated with RNAss were extracted for downstream analysis, thereby enriching for gene clusters potentially regulating stemness in PDAC.
2.5 Differential analysis
Differentially expressed genes (DEGs) between tumor and normal tissues were identified using the Limma package in R. Stringent thresholds of |log2 fold change| ≥ 1 and a false discovery rate (FDR) ≤ 0.05 were applied to ensure reliability. Volcano plots and heatmaps were generated to visualize transcriptional alterations, while significant DEGs were intersected with RNAss-associated WGCNA modules to obtain candidate hub genes for functional validation.
2.6 Protein-Protein Interaction network and enrichment analysis
Functional interactions among candidate genes were explored using the GeneMANIA platform (15), which integrates genetic, physical, and predicted interactions across multiple organisms. Constructed networks were used to visualize relationships between PCDH1 and its interacting partners, enabling insights into potential biological processes and pathways influenced by PCDH1 (15). To explore biological mechanisms underlying PCDH1 activity, ssGSEA was used to quantify enrichment scores for hallmark oncogenic pathways in TCGA-PDAC samples. Pearson correlations between PCDH1 expression and pathway scores were calculated, identifying signaling cascades significantly associated with PCDH1-driven tumor biology.
2.7 Immune infiltration profiling
To characterize the tumor immune microenvironment, single-sample gene set enrichment analysis (ssGSEA) was employed to estimate the relative abundance of 24 immune cell populations. Parallelly, the ESTIMATE algorithm was applied to derive immune, stromal, and ESTIMATE composite scores, reflecting global immune activity. For higher resolution, single-cell RNA-seq data from the TISCH database (16) were interrogated to evaluate PCDH1 expression across distinct tumor and immune subpopulations. This multi-level immune analysis enabled assessment of PCDH1 in immune regulation and tumor–host interactions (16).
2.8 Pharmacological sensitivity analysis
We employed the GSCALite platform to evaluate correlations between PCDH1 expression and therapeutic responsiveness. The Gene Set Differential Correlation (GSDC) module was used to assess pathway–drug interactions under varying conditions, while the Cancer Therapeutics Response Portal (CTRP) module predicted half-maximal inhibitory concentration (IC50) values for targeted agents and chemotherapeutics across diverse cell lines (17). These analyses allowed us to link PCDH1 expression with putative vulnerabilities to specific drugs.
2.9 Cell transfection and cell treatment
Normal pancreatic ductal epithelial cells (HPNE) and pancreatic cancer cell lines (HPAC, SW1990, PATU 8898t, CFPAC1, and BxPC3) were cultured in Dulbecco’s Modified Eagle Medium (DMEM) or RPMI-1640 supplemented with 10% fetal bovine serum (FBS) and 1% penicillin–streptomycin. Cultures were maintained in a humidified incubator at 37 °C with 5% CO2. Cell line authentication and mycoplasma testing were routinely performed to ensure experimental fidelity. Cells were introduced with either a negative control siRNA (si-NC) or a small interfering RNA specifically targeting PCDH1 (si-PCDH1), both synthesized by GENERAL BIOL (Anhui, China). Transfections were conducted using Lipofectamine 2000 (Life Technologies, CA, USA) following the manufacturer’s recommendations, and gene silencing efficiency was verified by qRT-PCR. After 48 h of incubation, sufficient suppression of PCDH1 was achieved, allowing cells to be used in subsequent functional assays. For rescue conditions, cells were treated with 100 ng/mL IGF-1 (HY-P7018, MedChemExpress) for 1 h. Immediately thereafter, proliferation, migration, and stemness-related assays were performed. All experiments were independently repeated in triplicate to ensure consistency and reliability of the results.
2.10 MTT assay
Twenty-four hours after transfection with 50 nM si-NC or si-PCDH1, BXPC3 and SW1990 cells were detached with 0.05% trypsin, counted, and seeded at 1×10³ cells per well in 96-well plates (100 µL complete medium + 10% FBS, five replicates). Cultures were incubated at 37 °C, 5% CO2 for 0, 24, 48, or 72 h; 20 µL MTT (5 mg/mL) was then added for 4 h. After removing the supernatant, 100 µL DMSO was added, plates were shaken for 10 min, and absorbance was read at 490 nm. Data are mean ± SD of three independent experiments (18).
2.11 Colony formation assay
Colony-forming capacity was assessed in BXPC3 and SW1990 cells 24 h after transfection with si-NC or si-PCDH1. Single-cell suspensions (300–500 cells/well, 6-well plate; density optimized per line) were cultured for 14–21 days under standard conditions with fresh complete medium supplied every 3–4 days. When colonies exceeded 50 cells they were gently washed with PBS, fixed in 4% paraformaldehyde (15 min, RT), stained with 0.1% crystal violet (15 min), rinsed and air-dried. Plates were scanned at 600 dpi and analyzed with ImageJ to determine colony number and mean diameter. All assays were performed in triplicate; results are presented as mean ± SD (19).
2.12 Transwell assay
Cell migration was assessed using 24-well Transwell chambers (Corning, NY, USA) equipped with polycarbonate membranes containing 8 μm pores. BXPC3 and SW1990 cells were transfected with si-NC or si-PCDH1 for 24 h, harvested with 0.05% trypsin, and resuspended in serum-free DMEM. Cell suspensions were adjusted to a final density of 1×10⁴ cells per 200 μL, which was seeded into the upper chambers. The lower chambers were filled with 600 μL of DMEM supplemented with 10% FBS to establish a chemoattractant gradient. Each condition was performed in triplicate to ensure reproducibility. Cells were incubated for 24 h under standard conditions (37 °C, 5% CO2, humidified atmosphere). After incubation, the non-migrated cells remaining on the upper surface of the membrane were gently removed using cotton swabs. Migrated cells adherent to the lower surface were washed twice with PBS, fixed in 4% paraformaldehyde for 15 min at room temperature, and stained with 0.1% crystal violet for 20 min. Excess dye was removed with PBS, and membranes were air-dried. Cells were visualized under an inverted microscope (Olympus, Japan) at 200× magnification, and migrated cells were quantified across five randomly selected fields per membrane. Migration results were averaged from three independent experiments and expressed as mean ± SD (20).
2.13 Wound healing assay
Cell migratory ability was further examined by a wound healing assay. BXPC3 and SW1990 cells were seeded in 6-well plates and grown to 90–95% confluence. To minimize proliferation-related bias, cells were starved in serum-free medium for 12 h prior to scratching. A uniform scratch was generated across the monolayer using a sterile 200 μL pipette tip held perpendicular to the plate. Detached cells were gently washed away with PBS, and fresh serum-free DMEM was added to maintain quiescence. Images of the wound were captured at 0, 24, and 48 h using phase-contrast microscopy (Leica, Germany), ensuring identical locations were imaged by marking reference points on the plate underside (21).
2.14 Immunohistochemistry
Formalin-fixed, paraffin-embedded (FFPE) pancreatic ductal adenocarcinoma (PDAC) tissues and matched adjacent normal pancreatic tissues were obtained from six patients who underwent surgical resection at the First Affiliated Hospital of Harbin Medical University, following informed consent and institutional ethical approval. Tissue sections (3 μm) were cut using a rotary microtome, mounted on glass slides, baked at 60 °C for 1 h, and sequentially deparaffinized in xylene and rehydrated through graded ethanol solutions. Antigen retrieval was carried out in citrate buffer (pH 6.0) using microwave heating for 15 min. Endogenous peroxidase activity was quenched with 3% hydrogen peroxide for 10 min at room temperature, and non-specific binding was blocked with 5% bovine serum albumin for 30 min. Slides were incubated overnight at 4 °C with a rabbit polyclonal anti-PCDH1 primary antibody (bs-111111R, Bioss Biotechnology, China) at the manufacturer-recommended dilution. After PBS rinsing, sections were incubated with a horseradish peroxidase (HRP)-conjugated secondary IgG antibody (PV-9000, ZSGB-BIO, China) for 20 min at room temperature. Visualization was performed using a diaminobenzidine (DAB) substrate, and nuclei were counterstained with hematoxylin. Negative controls were prepared by substituting primary antibodies with isotype controls. Stained sections were imaged under a bright-field microscope at 400× magnification. For each specimen, three randomly selected high-power fields were captured. Quantitative assessment of PCDH1 expression was performed using Image-Pro Plus (IPP) software, measuring integrated optical density (IOD) and normalizing against the stained area to yield mean optical density (MOD). All analyses were conducted in duplicate by two independent investigators blinded to the clinical diagnosis to minimize observer bias.
2.15 Sphere formation assay
The self-renewal ability of pancreatic cancer cells was assessed by a sphere formation assay under non-adherent, serum-free conditions. BXPC3 and SW1990 cells were enzymatically dissociated into single-cell suspensions, and viable cells were counted using trypan blue exclusion. The concentration was adjusted to 1.5×10⁴ cells/mL, and 1 mL of this suspension was seeded into 24-well ultra-low attachment plates (Corning, USA) for pre-culture. Subsequently, cells were diluted to 4×10³ cells/well in 200 μL and plated into U-bottom 96-well ultra-low attachment plates, ensuring nine replicate wells per condition. To reduce edge effects from evaporation, 200 μL of sterile PBS was added to peripheral wells. Cells were cultured at 37 °C in a humidified atmosphere with 5% CO2, in serum-free DMEM/F12 medium supplemented with 20 ng/mL epidermal growth factor (EGF), 20 ng/mL basic fibroblast growth factor (bFGF), and B27 supplement (1:50, Gibco). Medium was replenished every 3 days. Photographs were captured at 0, 24, and 48 h, and again on day 5, using an inverted phase-contrast microscope at 40× magnification. Sphere number and diameter were quantified using ImageJ software. A minimum cutoff of 50 μm diameter was applied to define valid spheres. For each experimental group, nine wells were analyzed, and results were averaged across three independent experiments. Data were expressed as mean ± SD, and statistical significance of group differences was evaluated by Student’s t-test (22).
2.16 Flow cytometry analysis
Flow cytometry was employed to evaluate the expression of stemness-associated surface markers in PDAC cells. After transfection and appropriate culture treatments, cells were harvested by gentle trypsinization, washed twice in cold phosphate-buffered saline (PBS), and resuspended in staining buffer (PBS containing 2% fetal bovine serum) at a concentration of 1×10⁶ cells/mL. Cells were aliquoted into 1.5 mL Eppendorf tubes according to experimental groups, ensuring equal cell counts across conditions. For surface antigen staining, cells were incubated with fluorochrome-conjugated monoclonal antibodies, including anti-CD133 (12-1338-42, Thermo Fisher) and anti-CD24 (11-0247-42, Thermo Fisher), at manufacturer-recommended dilutions. CD24 conjugates with FITC, CD133 conjugates with PE. Parallel tubes containing isotype-matched control antibodies were prepared to account for non-specific binding. Staining was performed for 30 min at 4 °C in the dark to prevent fluorochrome degradation, with gentle vortexing every 10 min to ensure uniform suspension and antibody access. After incubation, cells were washed twice with cold PBS to remove unbound antibodies and resuspended in 500 μL of staining buffer for analysis. To exclude dead cells, propidium iodide (PI) was added immediately before acquisition when required. Data acquisition was performed on a FACSCalibur™ flow cytometer (BD Biosciences, San Jose, USA) equipped with a 488 nm argon laser. A minimum of 1×10⁴ events were collected per sample, and compensation settings were adjusted using single-stained controls. Data analysis was conducted using FlowJo software (Tree Star Inc., Ashland, OR, USA). Marker-positive cell populations were gated based on forward/side scatter and isotype controls. Final results were reported as the percentage of CD133+ or CD24+ cells relative to the total viable population. All experiments were repeated independently at least three times.
2.17 Statistical analysis
All statistical analyses were performed using R software (version 4.2.0) and GraphPad Prism (version 9.0) to ensure robustness. Data were first tested for normality using the Shapiro–Wilk test. For normally distributed variables, differences between two groups were assessed using Student’s t-test; otherwise, the Mann–Whitney U test was applied. For comparisons among multiple groups, one-way ANOVA or the Kruskal–Wallis test was used as appropriate. Categorical variables were compared with chi-squared or Fisher’s exact tests. Correlations between continuous variables were evaluated using Spearman’s rank correlation analysis. Levels of significance were denoted as P < 0.05(*), P < 0.01(**), P < 0.001 (***), and P < 0.0001 (****), with “ns” indicating non-significance.
3 Results
3.1 Association of stemness indices with prognosis and identification of RNAss-related gene modules
The overall research workflow is illustrated in Figure 1. To assess the prognostic relevance of stemness in PDAC, patients were stratified according to DNA methylation–based stemness index (DNAss) and RNA expression–based stemness index (RNAss). Kaplan–Meier survival analysis revealed no significant association between DNAss and overall survival (OS) (HR = 1.27, 95% CI 0.83–1.95, P = 0.272; Figure 2A). In contrast, patients with elevated RNAss exhibited markedly poorer OS compared with those in the low RNAss group (HR = 1.72, 95% CI 1.11–2.66, P = 0.016; Figure 2B), underscoring the clinical impact of transcriptional stemness in PDAC. To further explore molecular correlates of RNAss, we constructed a weighted gene co-expression network (WGCNA). Hierarchical clustering identified 14 distinct gene modules, each represented by a unique color (Figure 2C). Module–trait correlation analysis demonstrated that the black (r=0.48, P = 3e–10) and blue (r=0.46, P = 2e–09) modules showed the strongest positive associations with RNAss, suggesting that genes within these modules may contribute to stemness-associated tumor biology (Figure 2D).
Figure 1
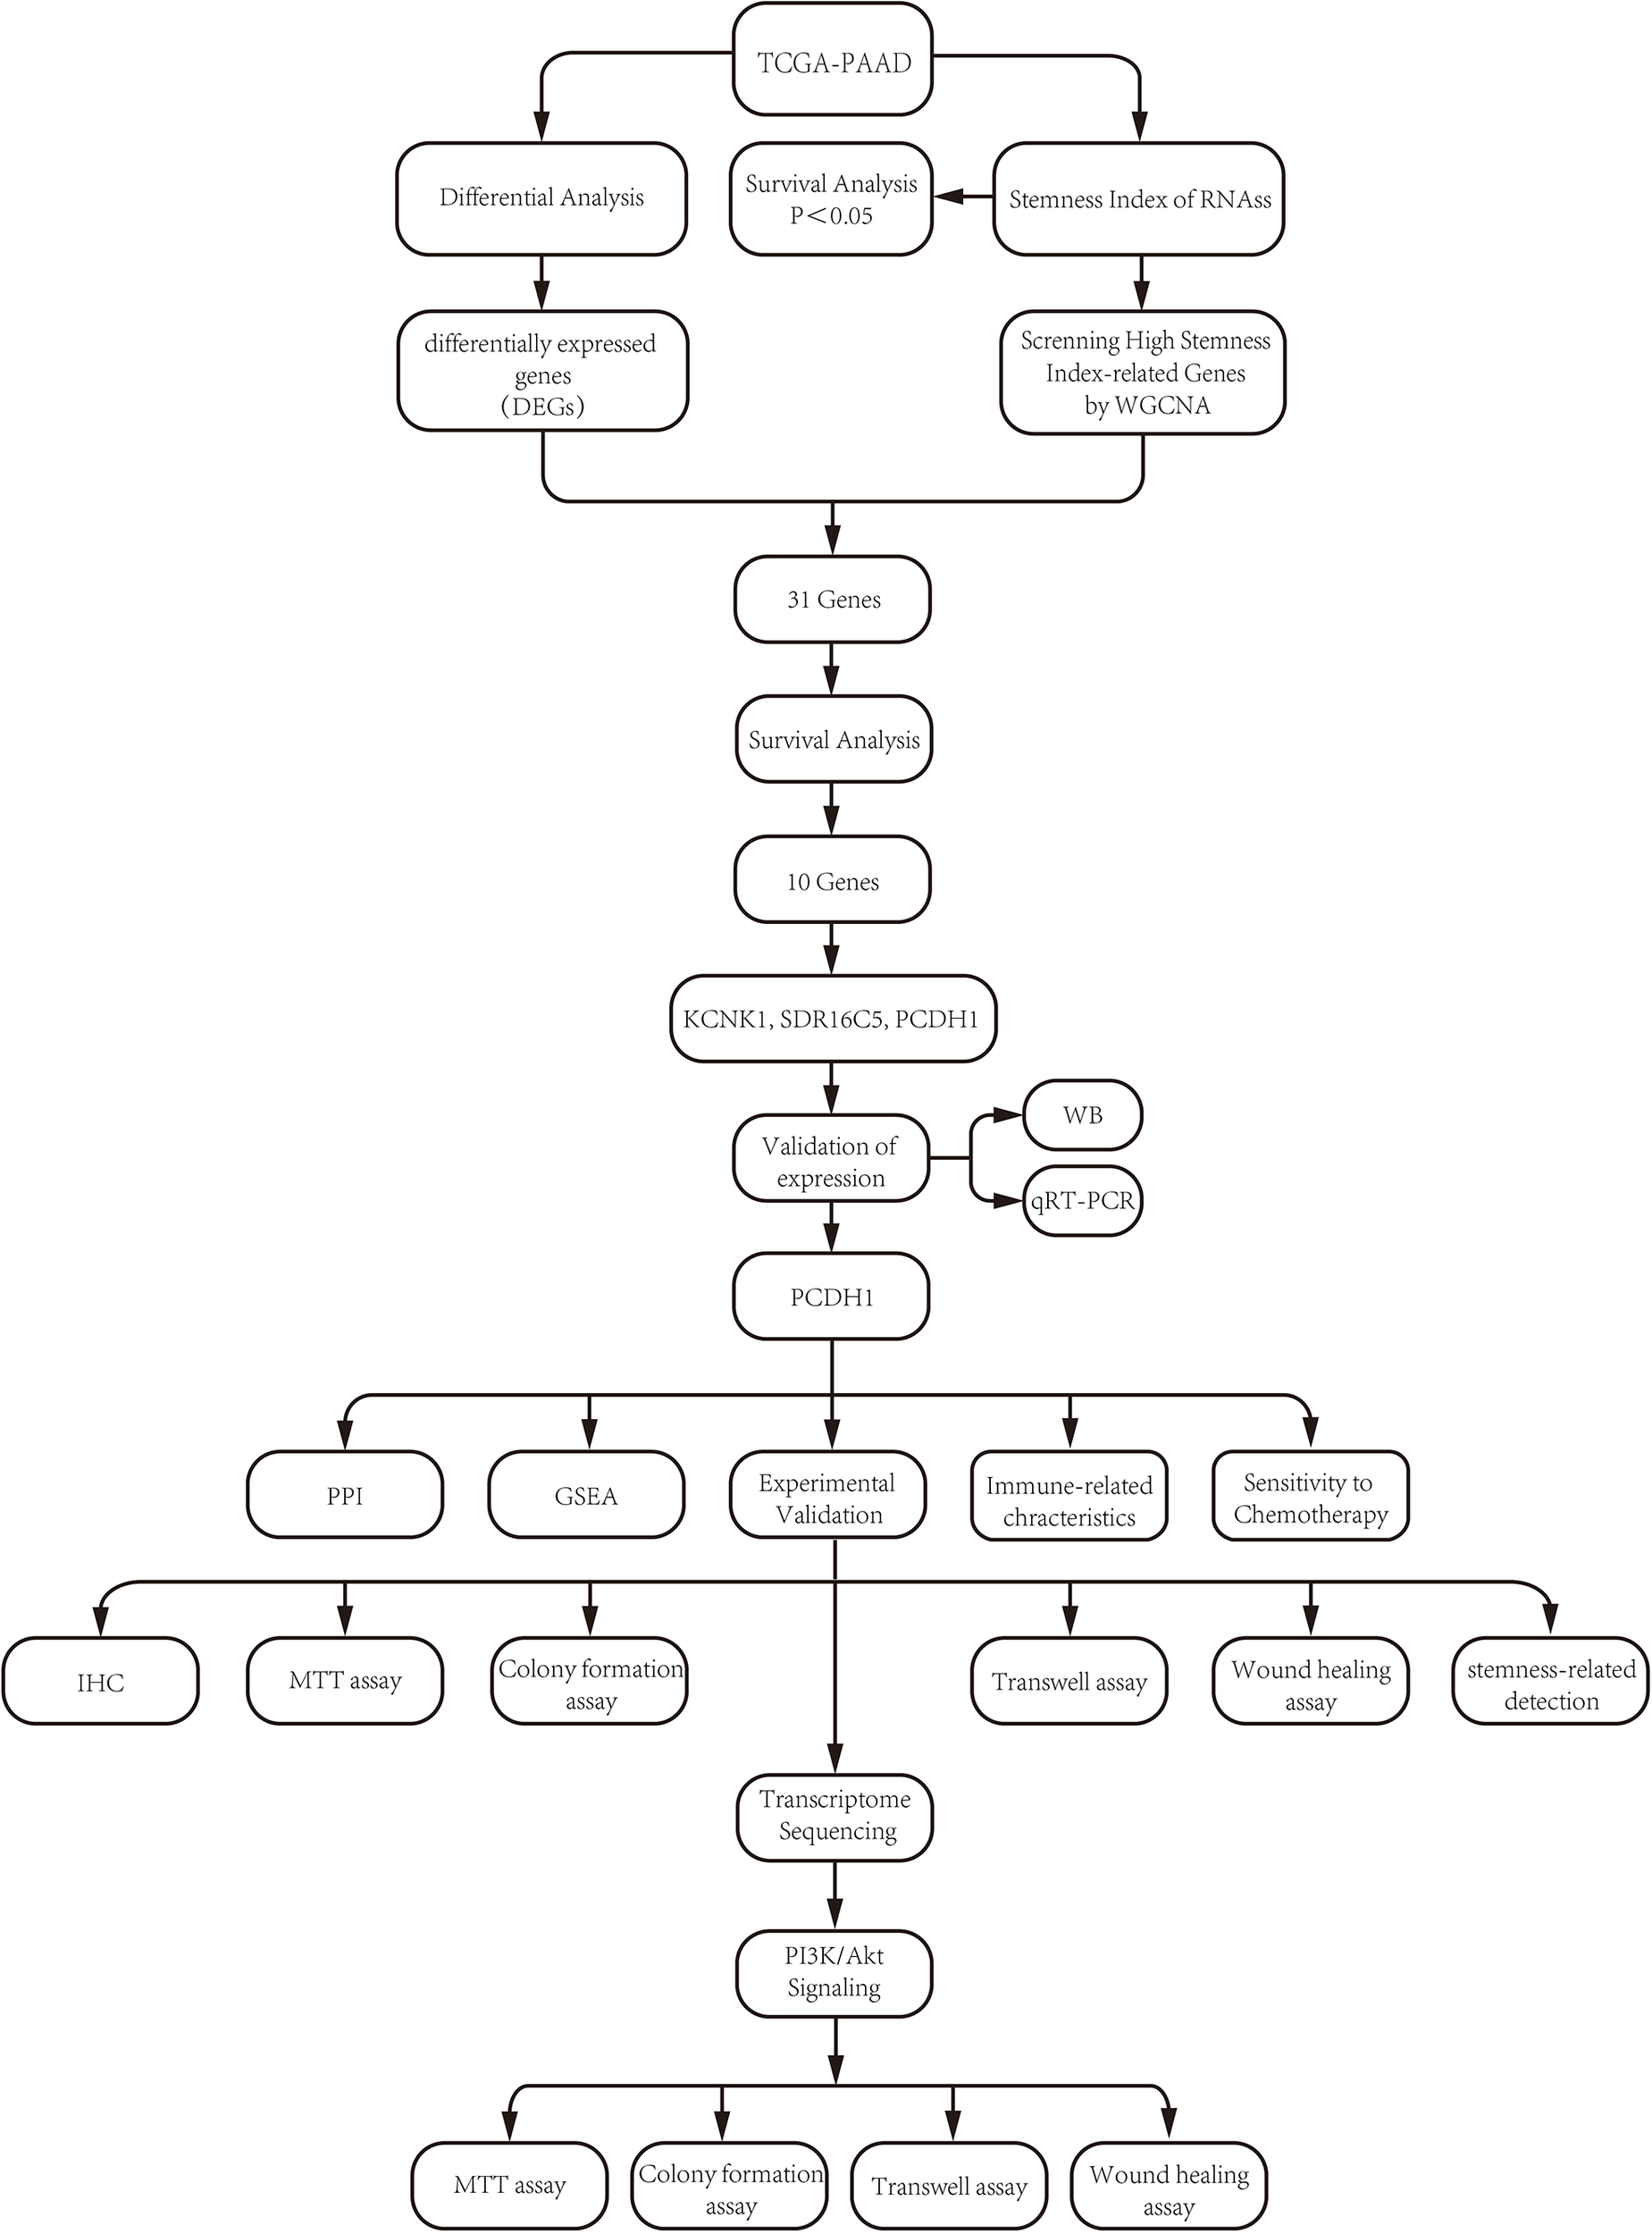
Flow chart.
Figure 2
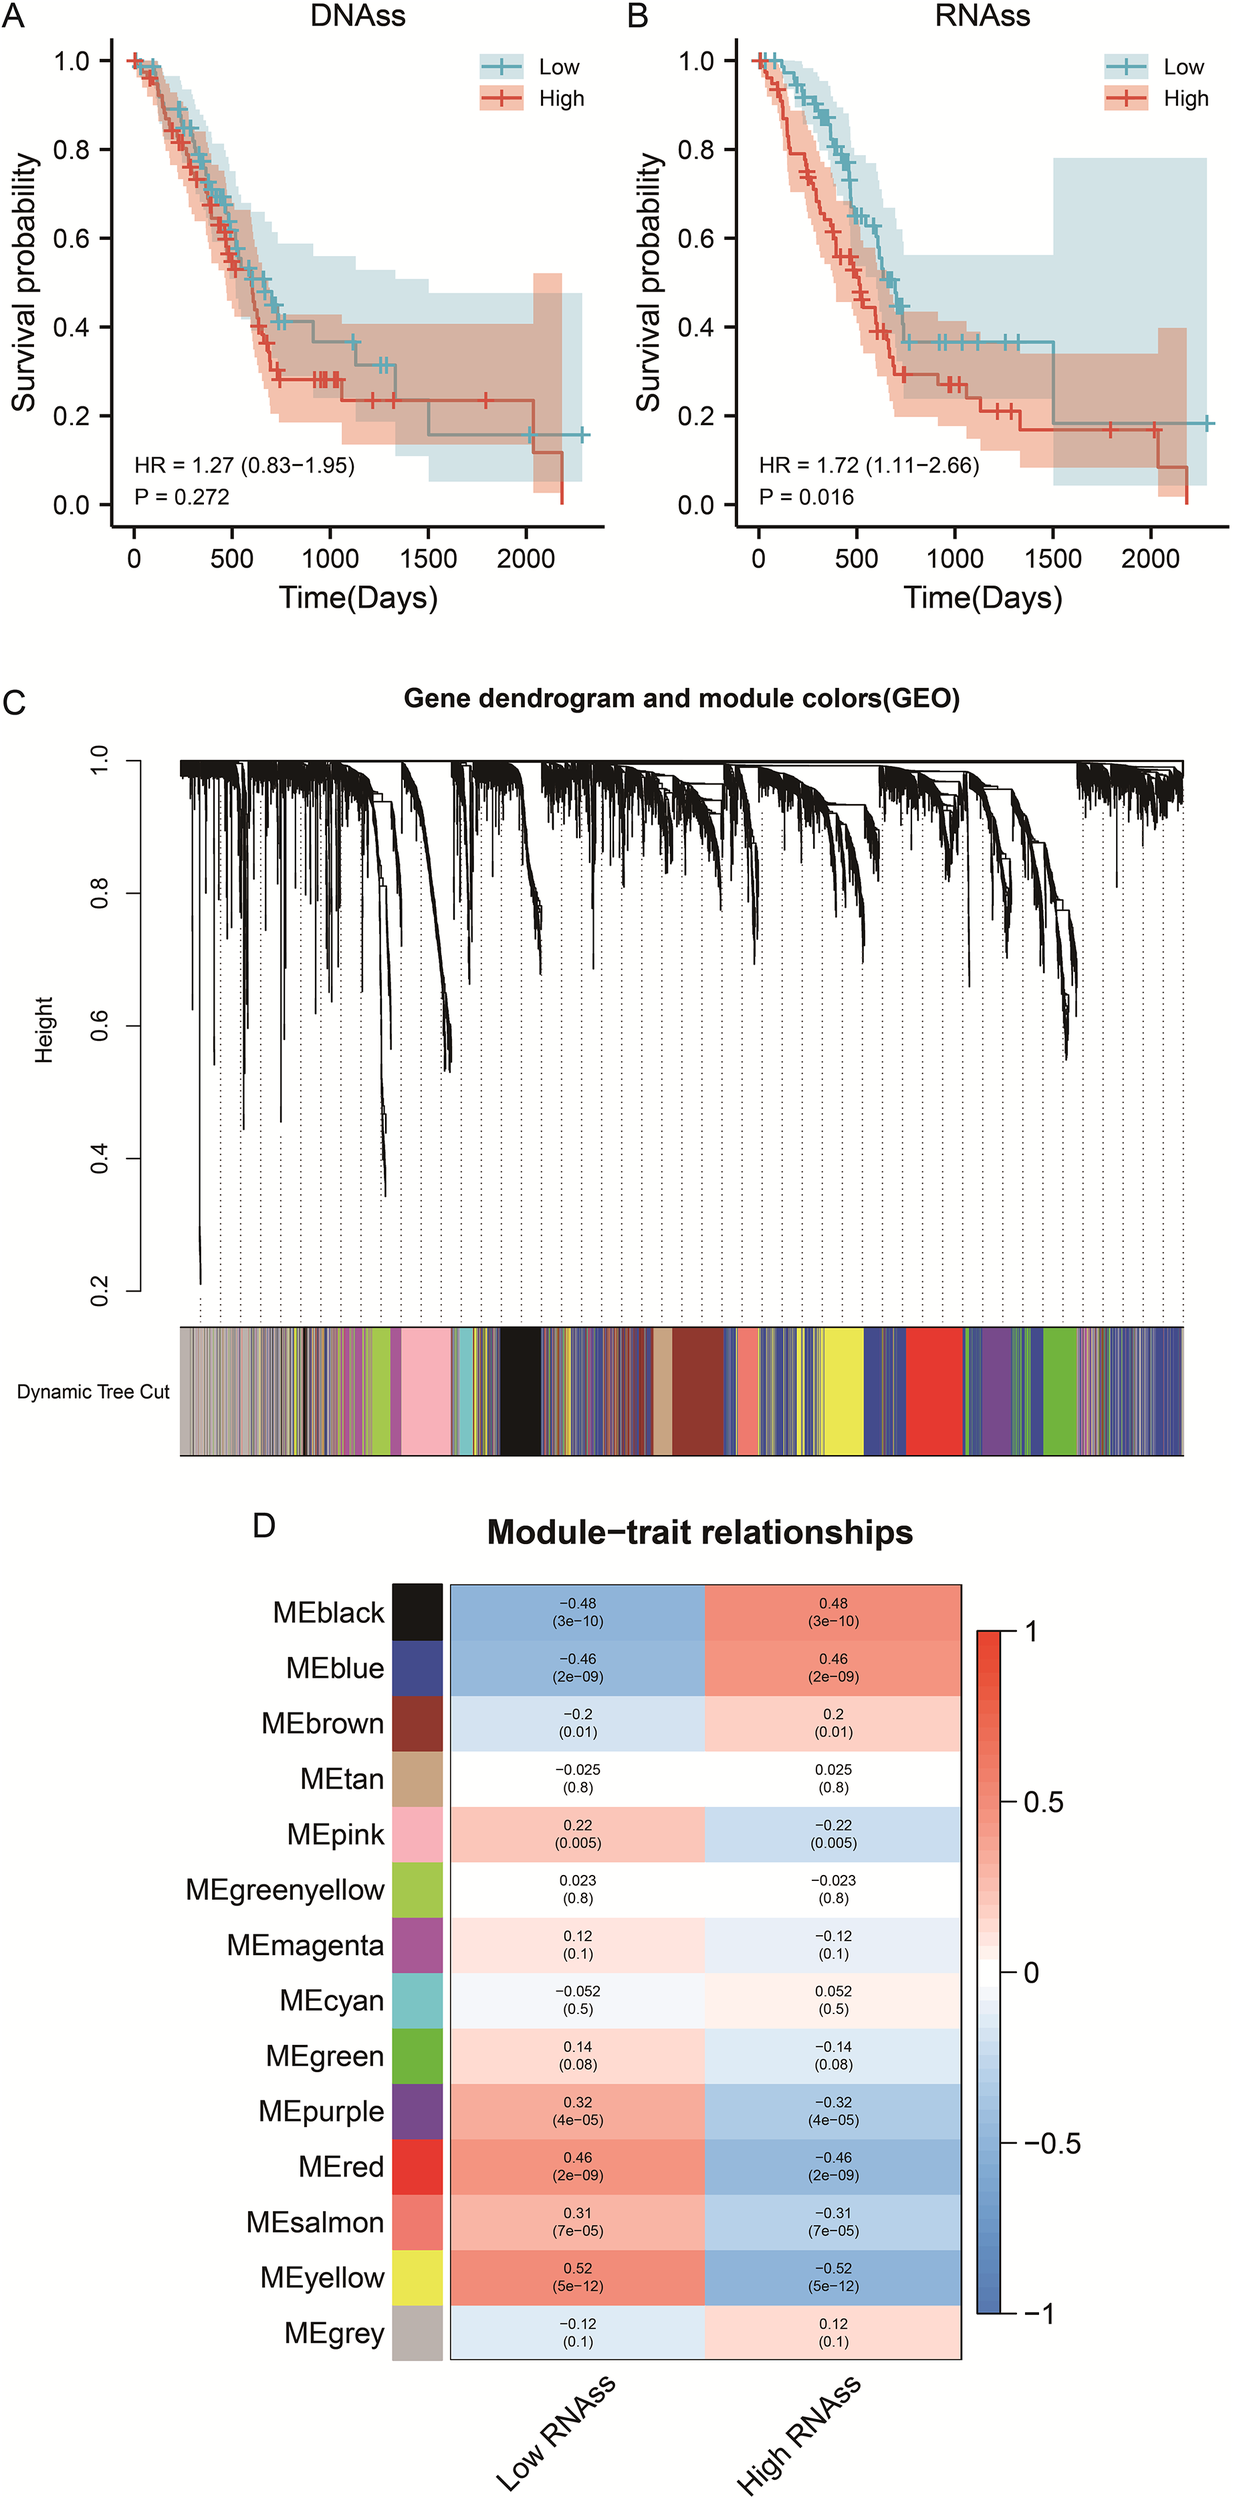
WGCNA screened the gene modules with significant positive correlation with RNAss index. (A) Survival curve of PDAC patients with different DNAss index. (B) Survival curve of PDAC patients with different RNAss index. (C) Gene dendrogram and module colors (GEO). (D) Module-trait relationships.
3.2 Identification of RNAss-related hub genes in PDAC
To pinpoint hub genes associated with stemness and tumor development, we analyzed the overlap between the 39 upregulated differentially expressed genes (DEGs) and the 1,687 genes from the RNAss-related black and blue modules. This comparison revealed 31 common genes (Figures 3B), all showing elevated expression in PDAC tissues and a positive correlation with RNAss. Subsequently, we conducted univariate Cox regression to evaluate the prognostic value of these genes, identifying ten with significant links to overall survival (OS) in PDAC: B3GNT3, ESRP1, KCNK1, MAL2, PCDH1, PERP, SDR16C5, SERPINB5, TMPRSS4, and TOB1. For further experimental validation, we focused on the least explored genes in PDAC research based on literature review. Among these, KCNK1, SDR16C5, and PCDH1 emerged as understudied candidates, warranting deeper investigation.
Figure 3
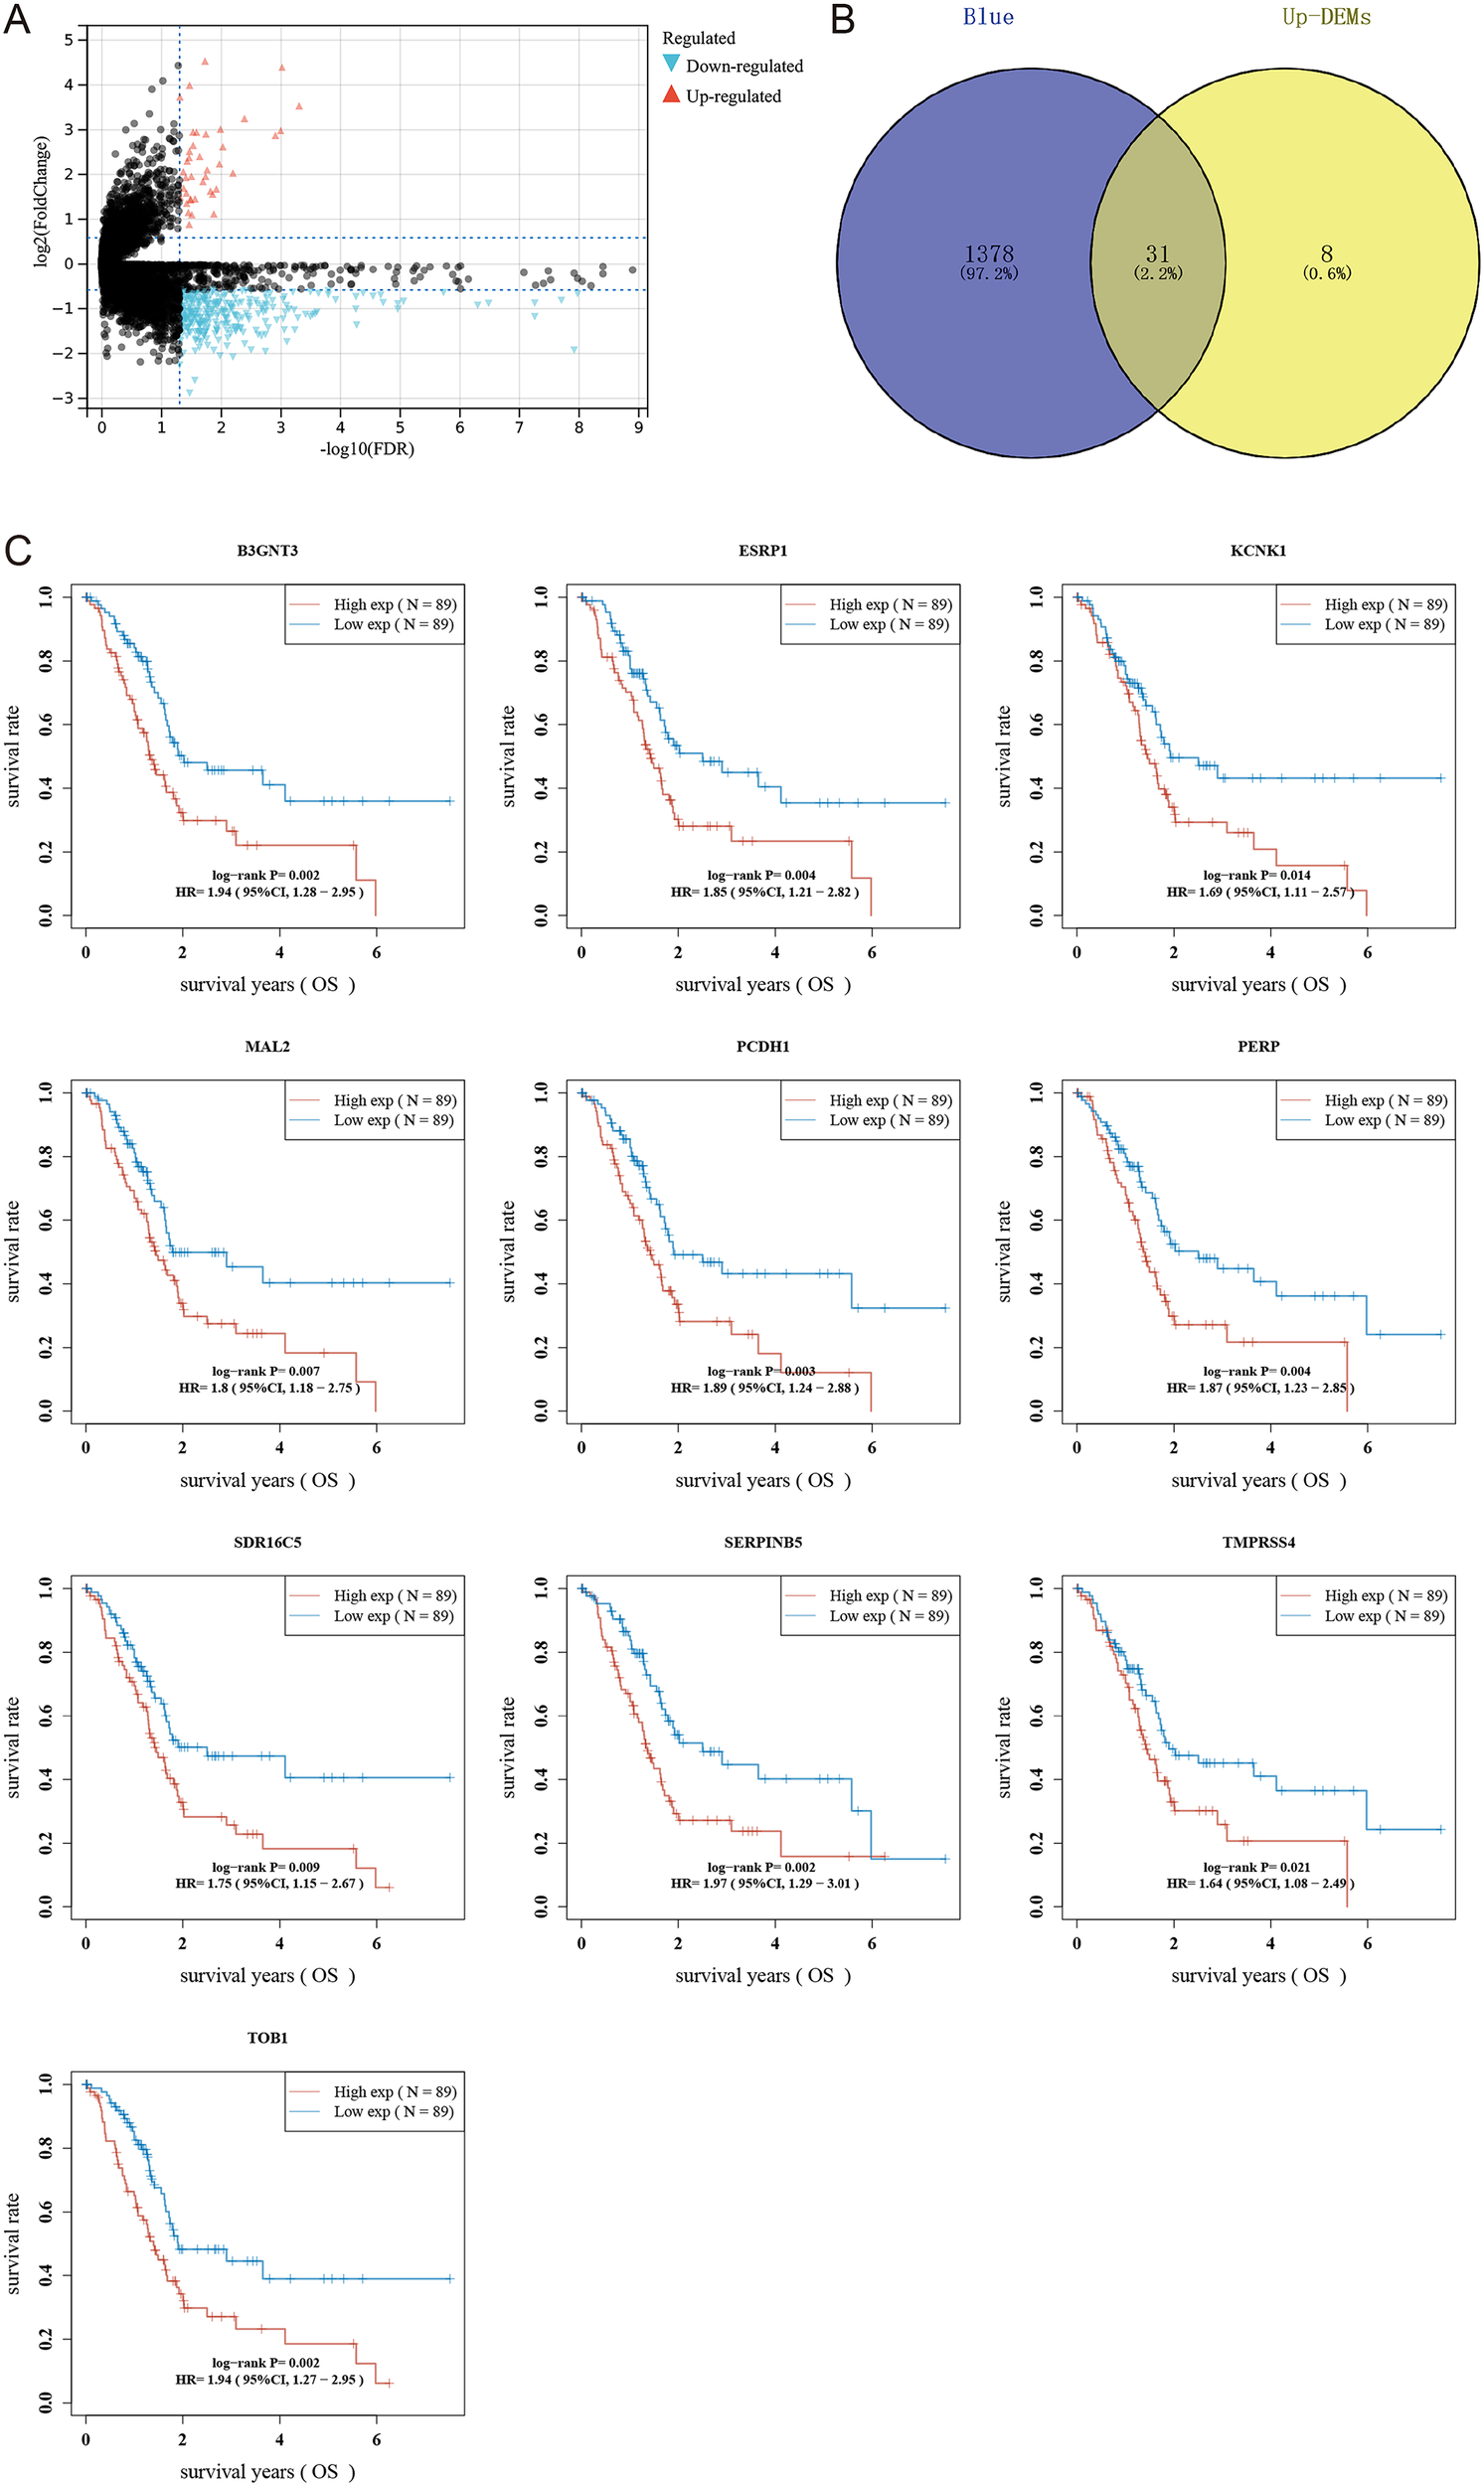
Screening hub genes related to RNAss index. (A) Volcano map shows differentially expressed genes in PDAC. (B) Wayne diagram intersects blue module, black module, and differentially expressed genes. (C) Survival curves of 10 hub genes.
3.3 Expression patterns and cellular localization of RNAss-associated hub genes
To further validate candidate stemness-associated genes, we compared the expression of KCNK1, PCDH1, and SDR16C5 between PDAC and normal pancreatic tissues using TCGA and GTEx datasets. All three genes were significantly upregulated in tumors relative to non-malignant samples (**P<0.001; Figure 4A), suggesting potential oncogenic roles in PDAC. We next examined their cellular distribution using single-cell transcriptomic datasets (PAAD_CRA001160 and PAAD_GSE111672). KCNK1 expression was predominantly enriched in malignant epithelial cells, with additional signals in ductal cells and fibroblasts (Figure 4B). PCDH1 displayed broader localization, being highly expressed in malignant cells as well as fibroblasts, endothelial cells, and select immune subsets, consistent with a role in mediating tumor–stroma interactions (Figure 4C). SDR16C5 was strongly enriched in malignant populations and acinar cells, but largely absent from immune or stromal compartments (Figure 4D). Together, these findings confirm that KCNK1, PCDH1, and SDR16C5 are aberrantly upregulated in PDAC and exhibit distinct yet complementary patterns of cellular distribution, implicating them as potential contributors to tumor progression. Notably, the broad expression of PCDH1 across malignant and stromal cell types highlights it as a particularly compelling candidate for functional validation.
Figure 4
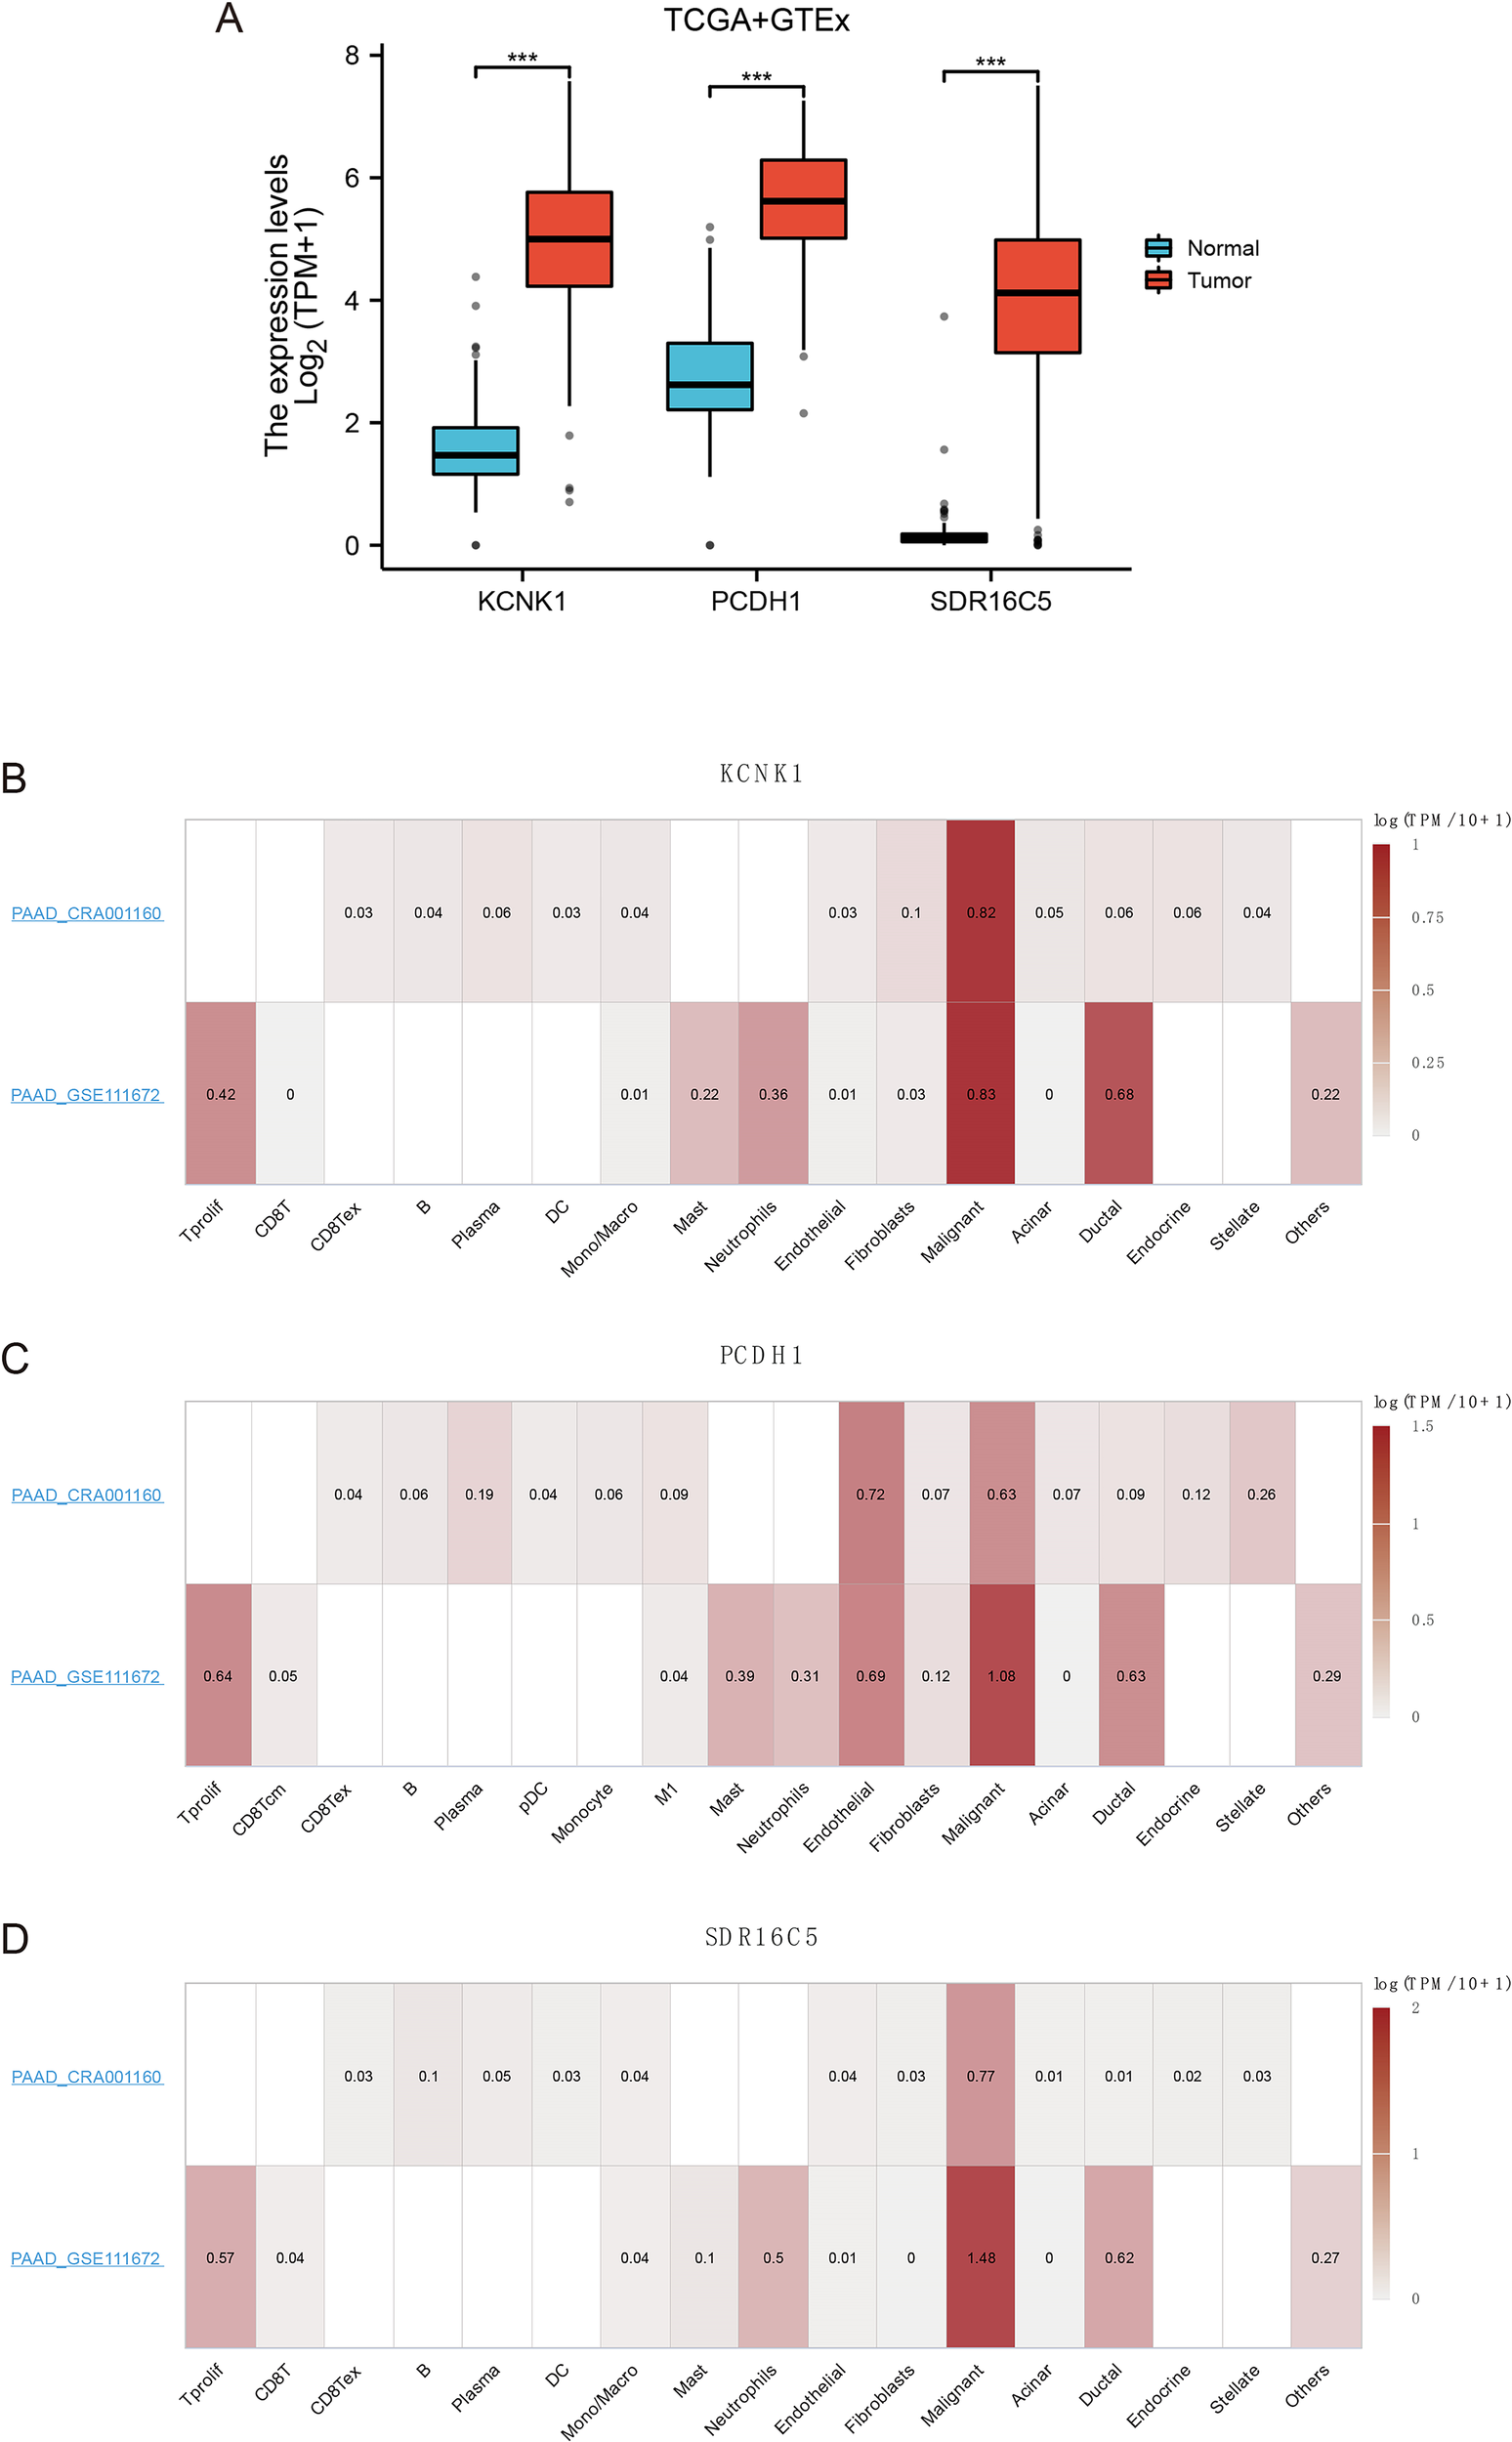
Expression of 3 hub genes (A) Gene expression of KCNK1, PCDH1 and SDR16C5. (B) Expression of KCNK1 in a single cell. (C) Expression of PCDH1 in a single cell. (D) Expression of SDR16C5 in a single cell.
3.4 Validation and clinical relevance of PCDH1 expression
We next validated the expression of candidate stemness-associated genes in PDAC cell lines and patient tissues. qRT-PCR analysis confirmed that KCNK1 and SDR16C5 were downregulated in PANC-1 but moderately expressed in BxPC3 relative to normal pancreatic epithelial cells (HPNE) (Figures 5A, C). In contrast, PCDH1 displayed marked upregulation in BxPC3, while expression remained low in PANC-1 (Figure 5B). Expanded profiling across additional PDAC lines revealed consistently elevated PCDH1 expression in SW1990, PATU8988, and CFPAC1 cells compared to HPNE, whereas HPAC exhibited relatively modest levels (Figure 5D). Immunohistochemistry of paired tumor and adjacent tissues from six patients further demonstrated pronounced membranous PCDH1 staining in PDAC specimens compared with paracancerous counterparts. Quantitative analysis confirmed significantly higher mean optical density (MOD) in tumor tissues (P<0.01; Figure 5E). Receiver operating characteristic (ROC) analysis showed that PCDH1 expression had strong discriminatory power for distinguishing PDAC from normal tissue, with an area under the curve (AUC) of 0.978 (95% CI: 0.966–0.991; Figure 5F). To explore molecular interactions, a protein–protein interaction (PPI) network centered on PCDH1 was constructed. This analysis revealed associations with multiple proteins, including SMAD3, RNF14, PPM1A, and OPHN1, implicating PCDH1 in signaling cascades relevant to tumor progression and stemness regulation (Figure 5G). Collectively, these findings confirm that PCDH1 is robustly overexpressed in PDAC at both cellular and tissue levels, possesses high diagnostic value, and is embedded within oncogenic signaling networks, supporting its role as a candidate stemness-linked oncogene. Following closely, we further explored the correlation between clinical information and PCDH1 levels in PDAC patients in the TCGA cohort. The outcomes revealed that PCDH1 displayed a degree of variability in pathological grading, which means its expression was significantly higher in patients with G2 & G3 & G4 grading compared to those with G1 grading (Table 1).
Figure 5
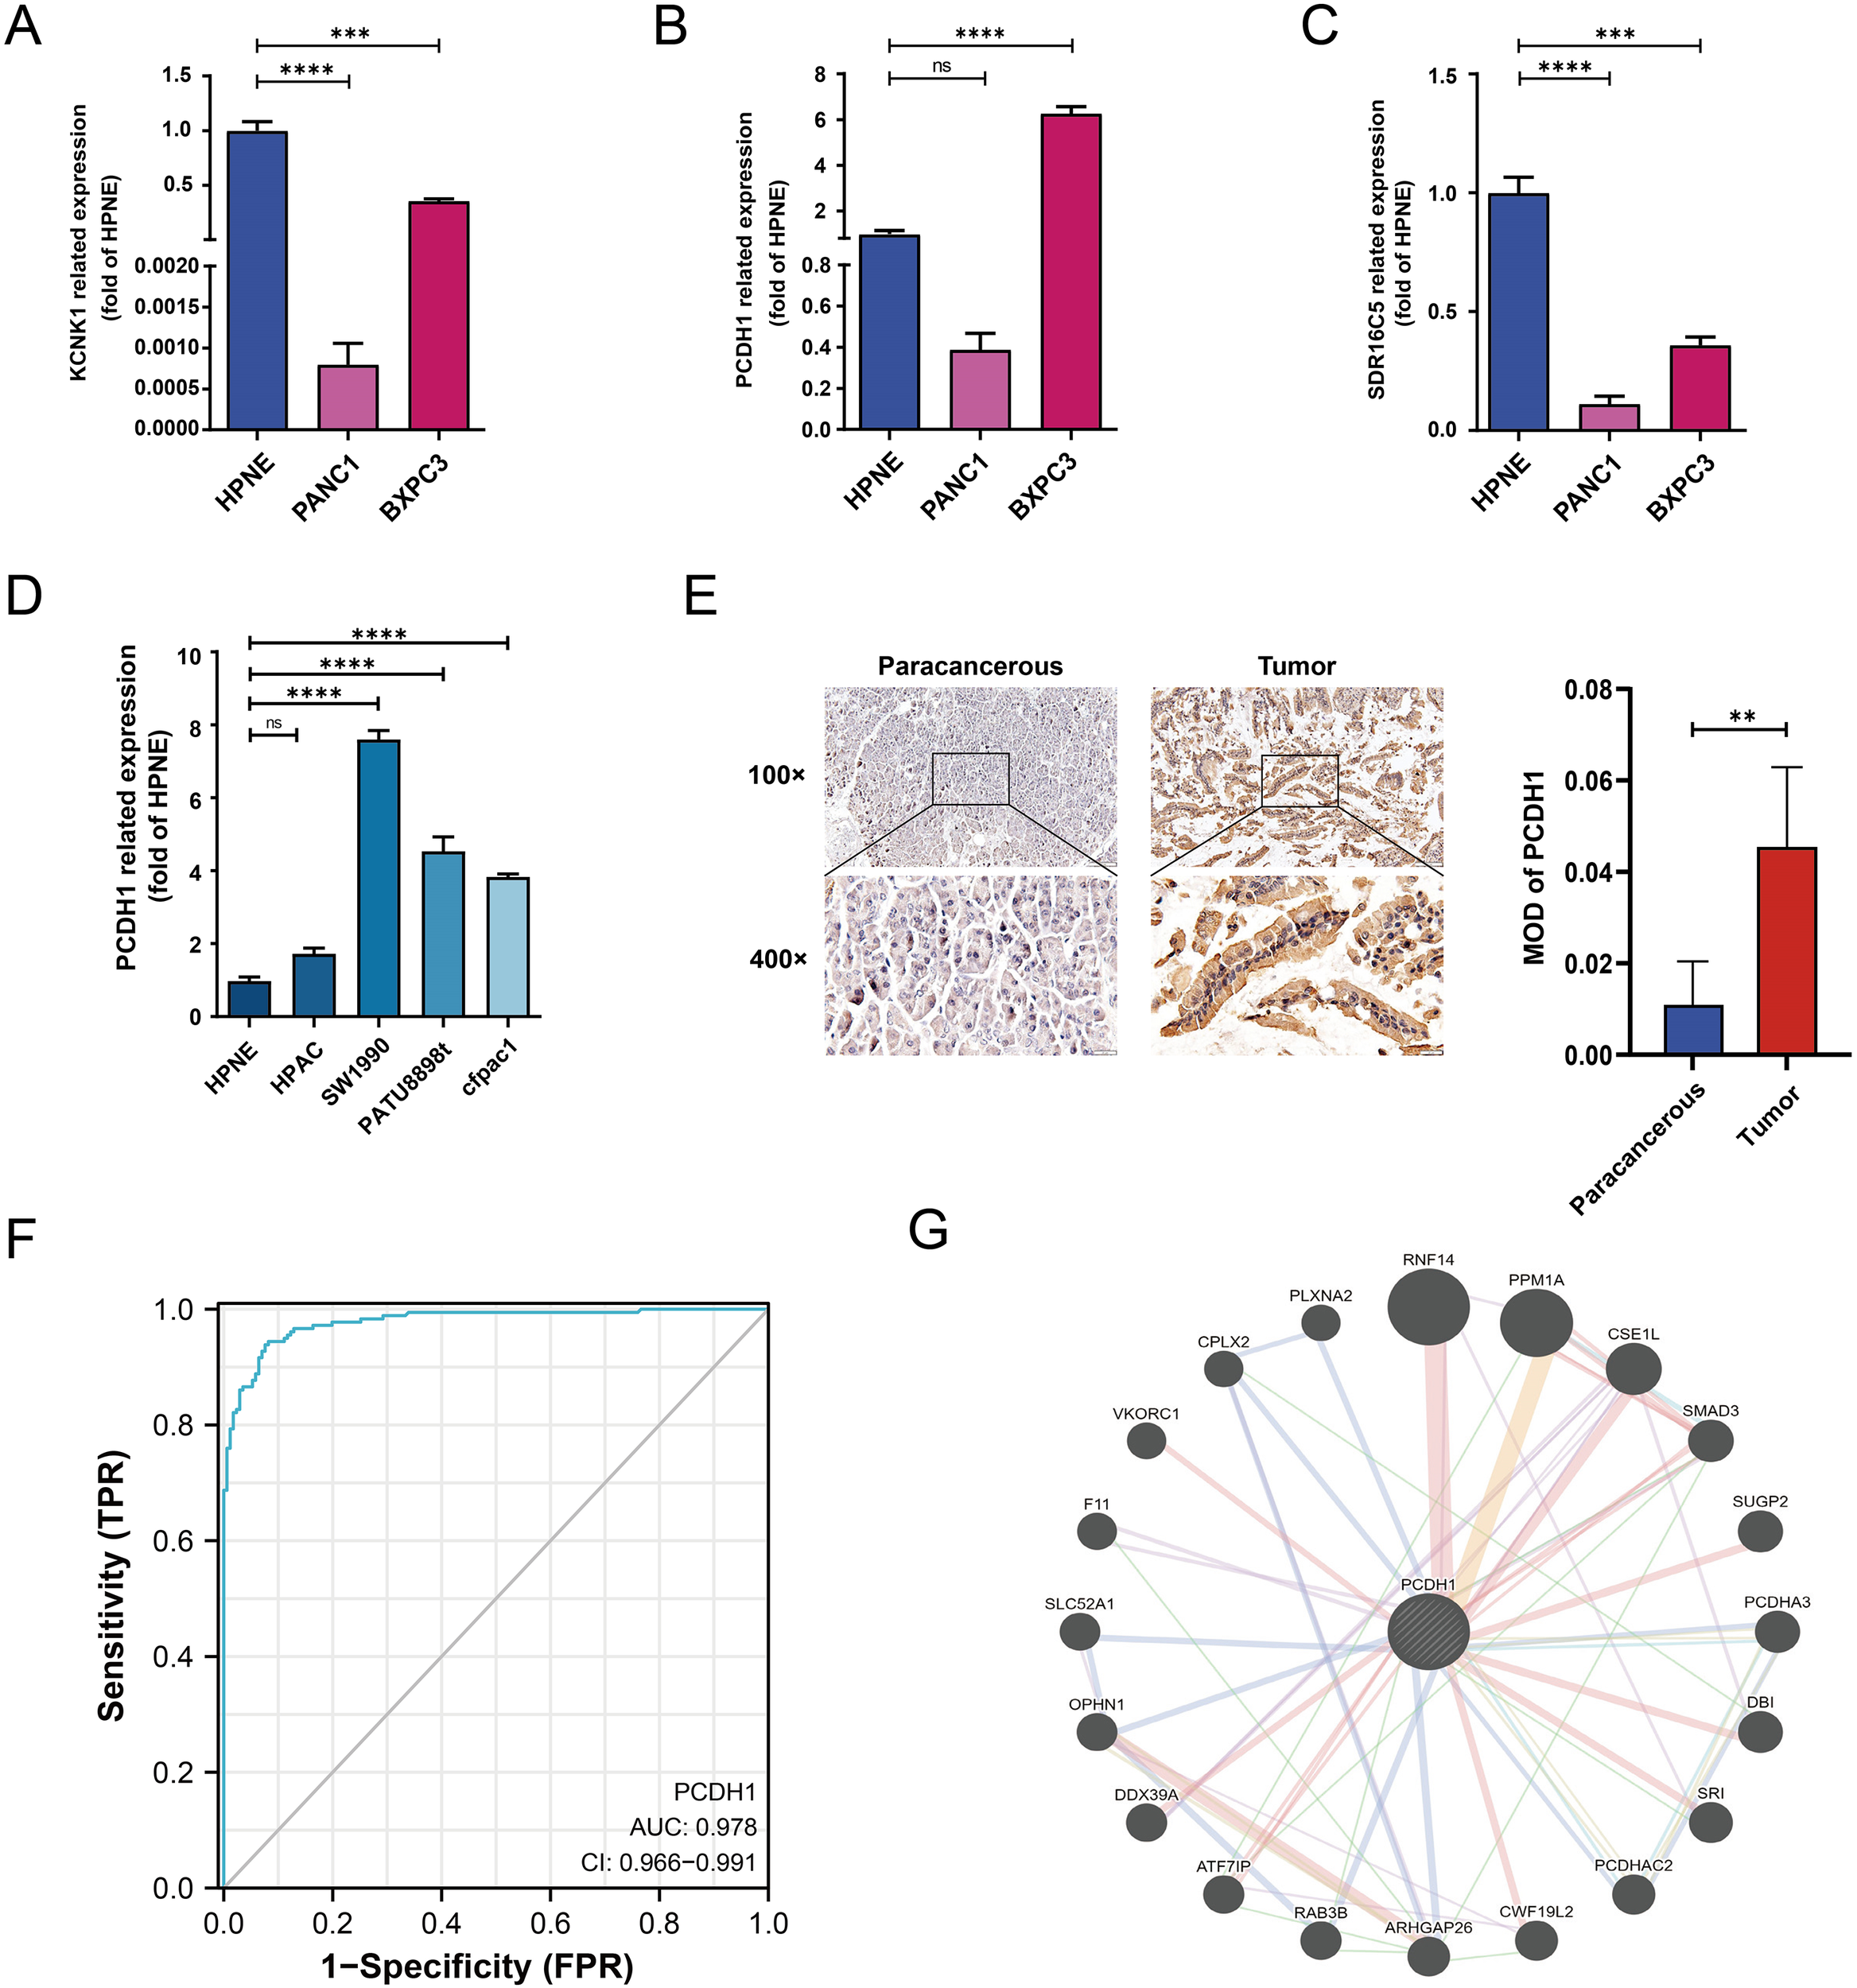
Related assays on the expression of hub genes. (A–C) mRNA expression of KCNK1, PCDH1 and SDR16C5 in HPNE and BXPC3. (D) mRNA expression of PCDH1 in HPNE and multiple PDAC cell lines. (E) Matched pairs of PDAC tissues and adjacent non-neoplastic pancreatic tissues were stained with PCDH1-specific antibodies for immunohistochemical analysis. Representative images of tissues and tumor-infiltrating cells are shown (100×, scale bar = 100 μm; 400×, scale bar = 20 μm). The MOD of PCDH1 is obtained by analyzing the photo-optical density with IPP software. (F) ROC curve of PCDH1 in PDAC. (G) Protein-protein interaction network of PCDH1. (ns: P>0.05, *P < 0.05, **P < 0.01, ***P < 0.001, ****P < 0.0001).
Table 1
| Characteristics | Total(N) | Odds Ratio(OR) | P value |
|---|---|---|---|
| T stage (T3&T4 vs. T1) | 152 | 1.429 (0.305-7.465) | 0.648 |
| N stage (N1 vs. N0) | 173 | 0.646 (0.330-1.250) | 0.197 |
| M stage (M1 vs. M0) | 84 | 3.524 (0.494-70.590) | 0.269 |
| Pathologic stage (Stage II & Stage III & Stage IV vs. Stage I) | 175 | 1.803 (0.718-4.787) | 0.217 |
| Gender (Male vs. Female) | 178 | 1.578 (0.873-2.873) | 0.133 |
| Age (>65 vs. <=65) | 178 | 1.046 (0.580-1.886) | 0.881 |
| Histologic grade (G2&G3&G4 vs. G1) | 176 | 4.463 (1.892-11.818) | 0.001 |
| Smoker (Yes vs. No) | 144 | 0.836 (0.432-1.612) | 0.593 |
| Alcohol history (Yes vs. No) | 166 | 0.808 (0.431-1.507) | 0.503 |
| History of diabetes (Yes vs. No) | 146 | 0.805 (0.382-1.689) | 0.566 |
| History of chronic pancreatitis (Yes vs. No) | 141 | 2.321 (0.717-8.921) | 0.179 |
| Family history of cancer (Yes vs. No) | 110 | 0.704 (0.328-1.501) | 0.364 |
Relationship between clinical information and PCDH1 expression in PDAC patients of TCGA.
3.5 PCDH1 expression is associated with immune infiltration in PDAC
To further elucidate the immunological role of PCDH1 in PDAC, we evaluated its association with tumor immune infiltration using ESTIMATE and CIBERSORT algorithms. Elevated PCDH1 expression was significantly correlated with reduced immune infiltration, as indicated by negative correlations with ImmuneScore (r = –0.260, P<0.001; Figure 6A), StromaScore (r = –0.243, P = 0.001; Figure 6B), and ESTIMATEScore (r = –0.276, P<0.001; Figure 6C). Detailed immune cell profiling revealed that PCDH1 expression was inversely associated with multiple effector populations, including plasmacytoid dendritic cells (pDCs), follicular helper T (TFH) cells, cytotoxic T cells, CD8+ T cells, and regulatory T cells (Tregs), as well as B cells and antigen-presenting subsets (Figure 6D). Conversely, its correlations with Th2 cells and NK cell subsets were weak or nonsignificant. These findings suggest that PCDH1 overexpression may contribute to an immunosuppressive tumor microenvironment in PDAC, characterized by reduced infiltration of adaptive immune cells and impaired antitumor immunity.
Figure 6
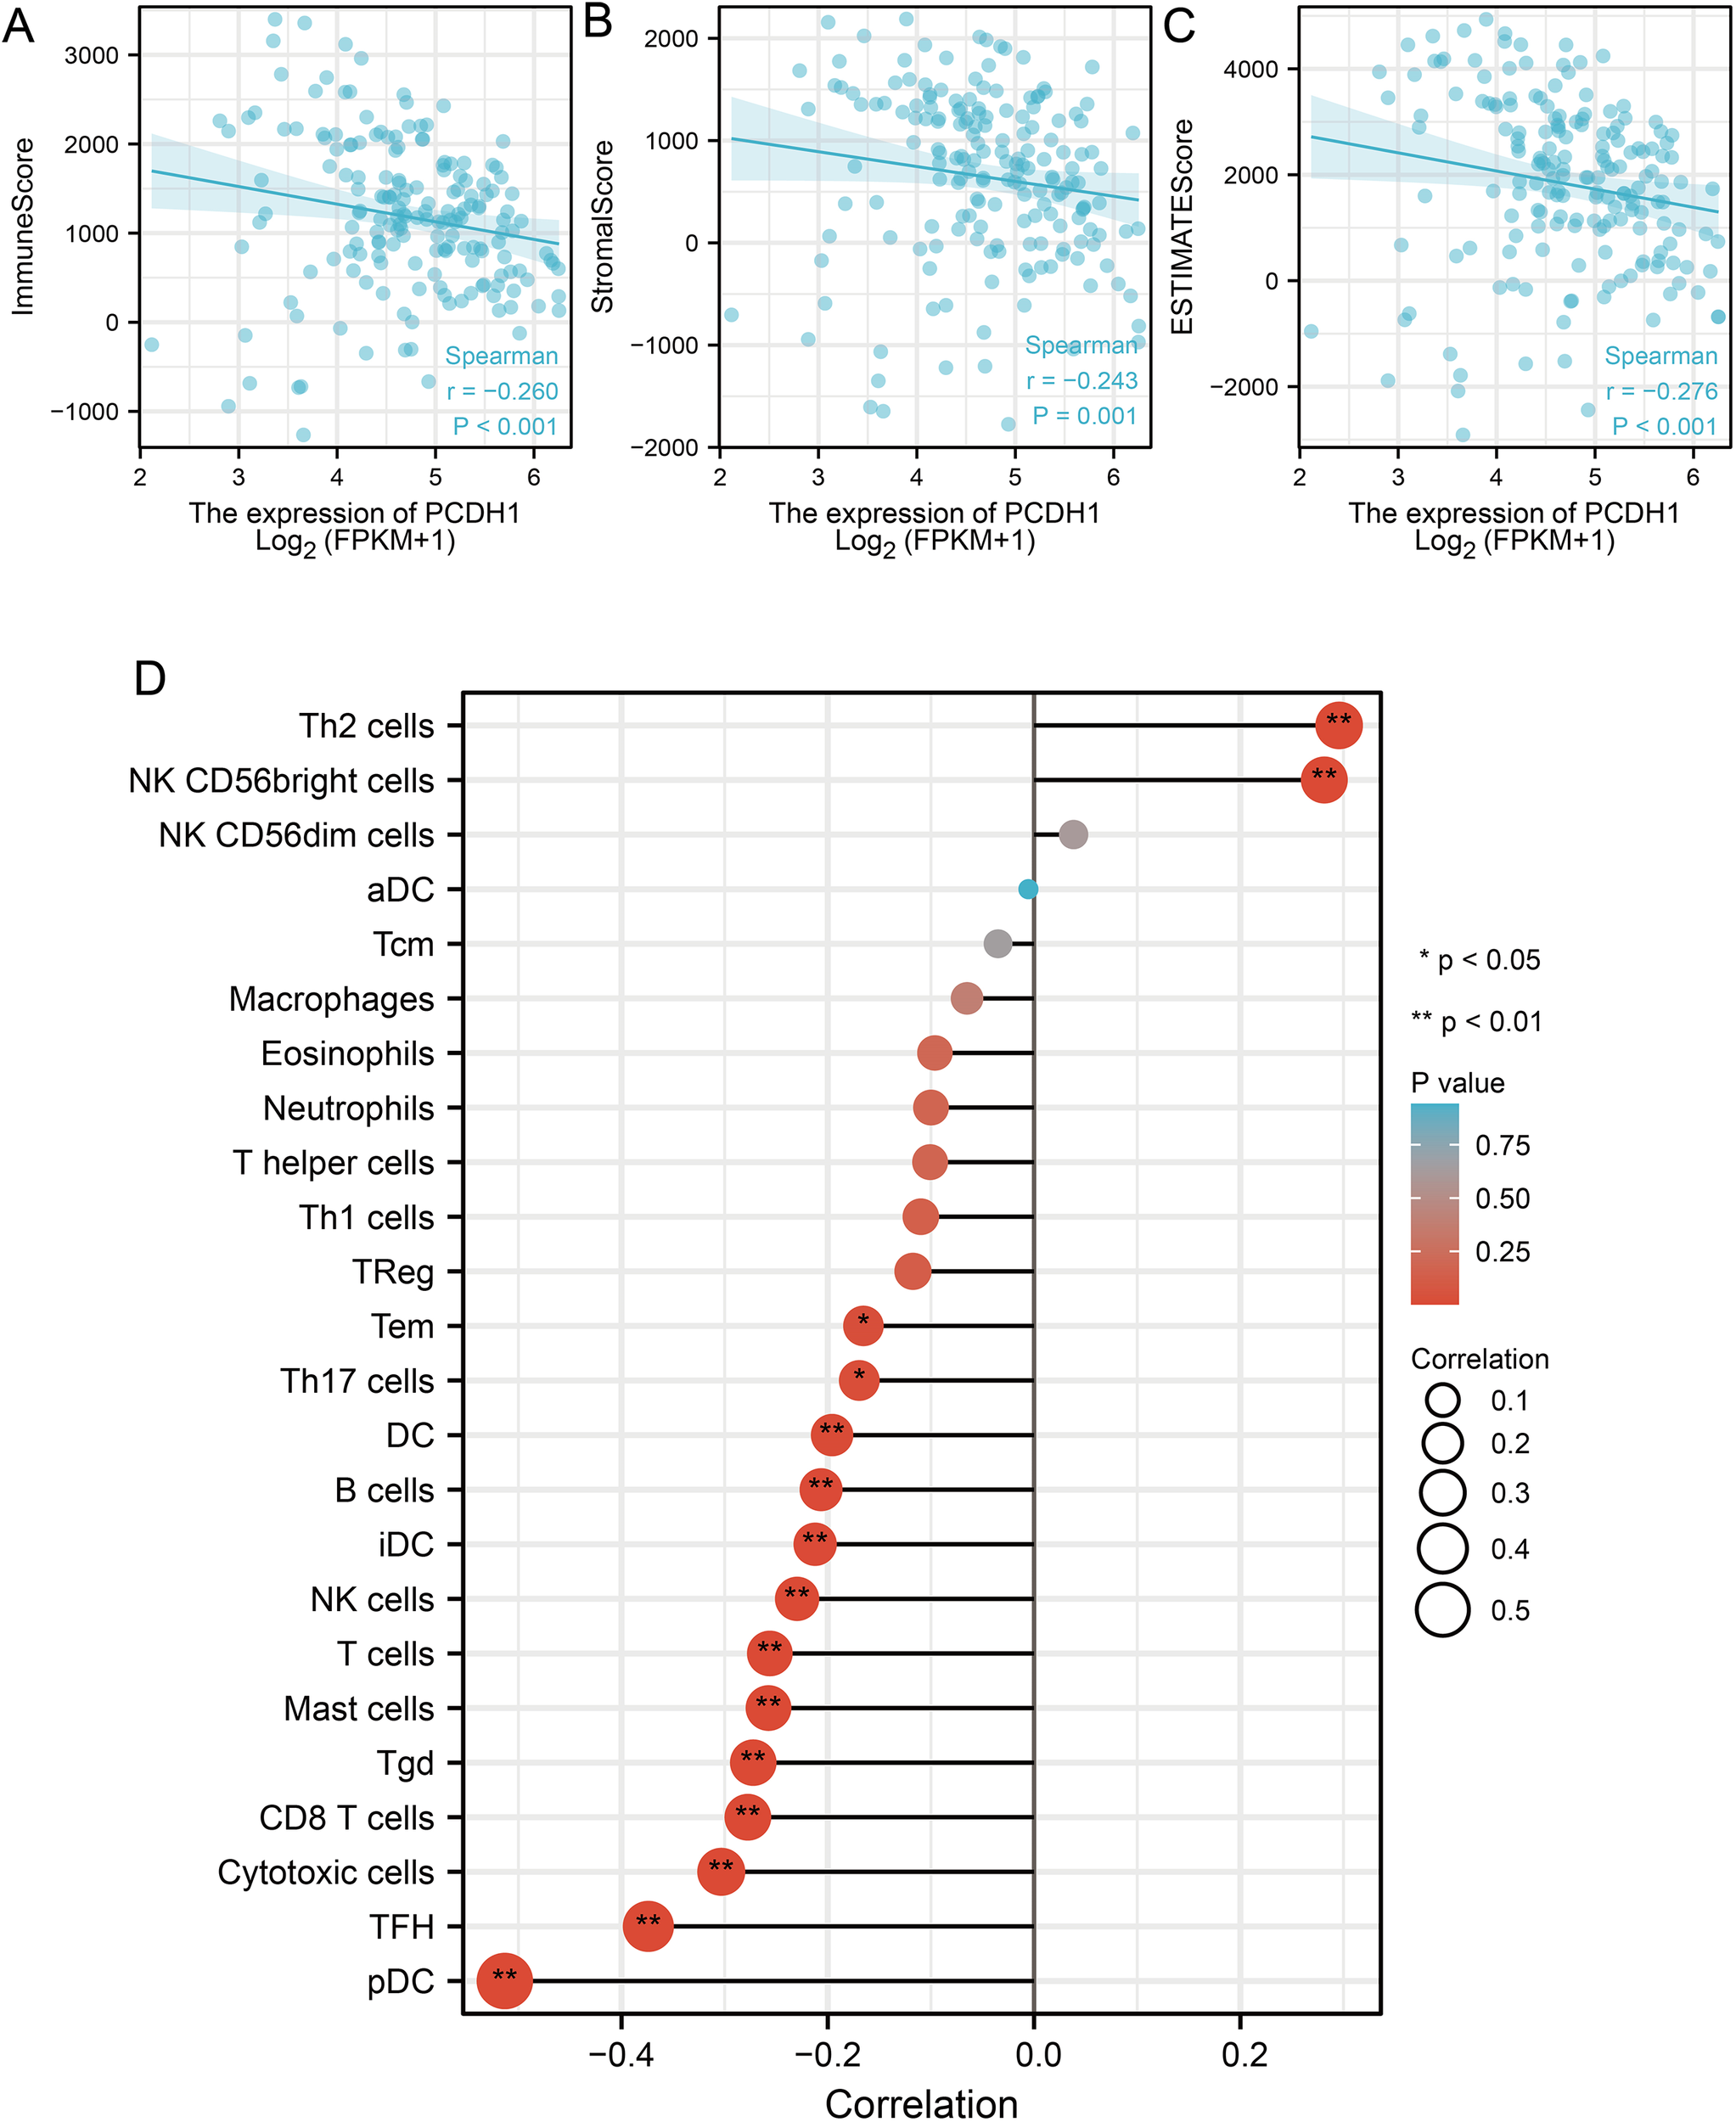
Correlation between PCDH1 and immune infiltration. (A) Correlation between PCDH1 and immune score. (B) Correlation between PCDH1 and stromal score. (C) Correlation between PCDH1 and ESTIMATE score. (D) Correlation between PCDH1 and immune cells. (*P < 0.05, **P < 0.01).
3.6 Association of PCDH1 expression with drug sensitivity
To explore the potential therapeutic implications of PCDH1, we assessed its correlation with drug sensitivity using the GDSC and CTRP pharmacogenomic datasets. In the GDSC cohort, high PCDH1 expression was significantly associated with increased sensitivity to a broad spectrum of chemotherapeutic and targeted agents, including gemcitabine, paclitaxel, and several kinase inhibitors (correlation coefficients ≈0.3–0.4, FDR ≤ 0.05; Figure 7A). In contrast, negative correlations were observed with selected agents, most notably Erlotinib, Lapatinib, and Trametinib (r≈–0.4, FDR ≤ 0.05), suggesting potential resistance mechanisms linked to PCDH1 overexpression. Similarly, CTRP analysis corroborated these findings, demonstrating widespread positive correlations between PCDH1 expression and sensitivity to multiple cytotoxic drugs and small-molecule inhibitors. Conversely, resistance associations were again evident with a subset of tyrosine kinase inhibitors, including Sorafenib and Lapatinib (Figure 7B). Collectively, these pharmacogenomic data indicate that PCDH1 expression may serve as a predictive biomarker of drug response in PDAC, conferring differential sensitivity across distinct therapeutic classes. This dual role highlights the need for context-dependent evaluation of PCDH1 when considering treatment strategies.
Figure 7
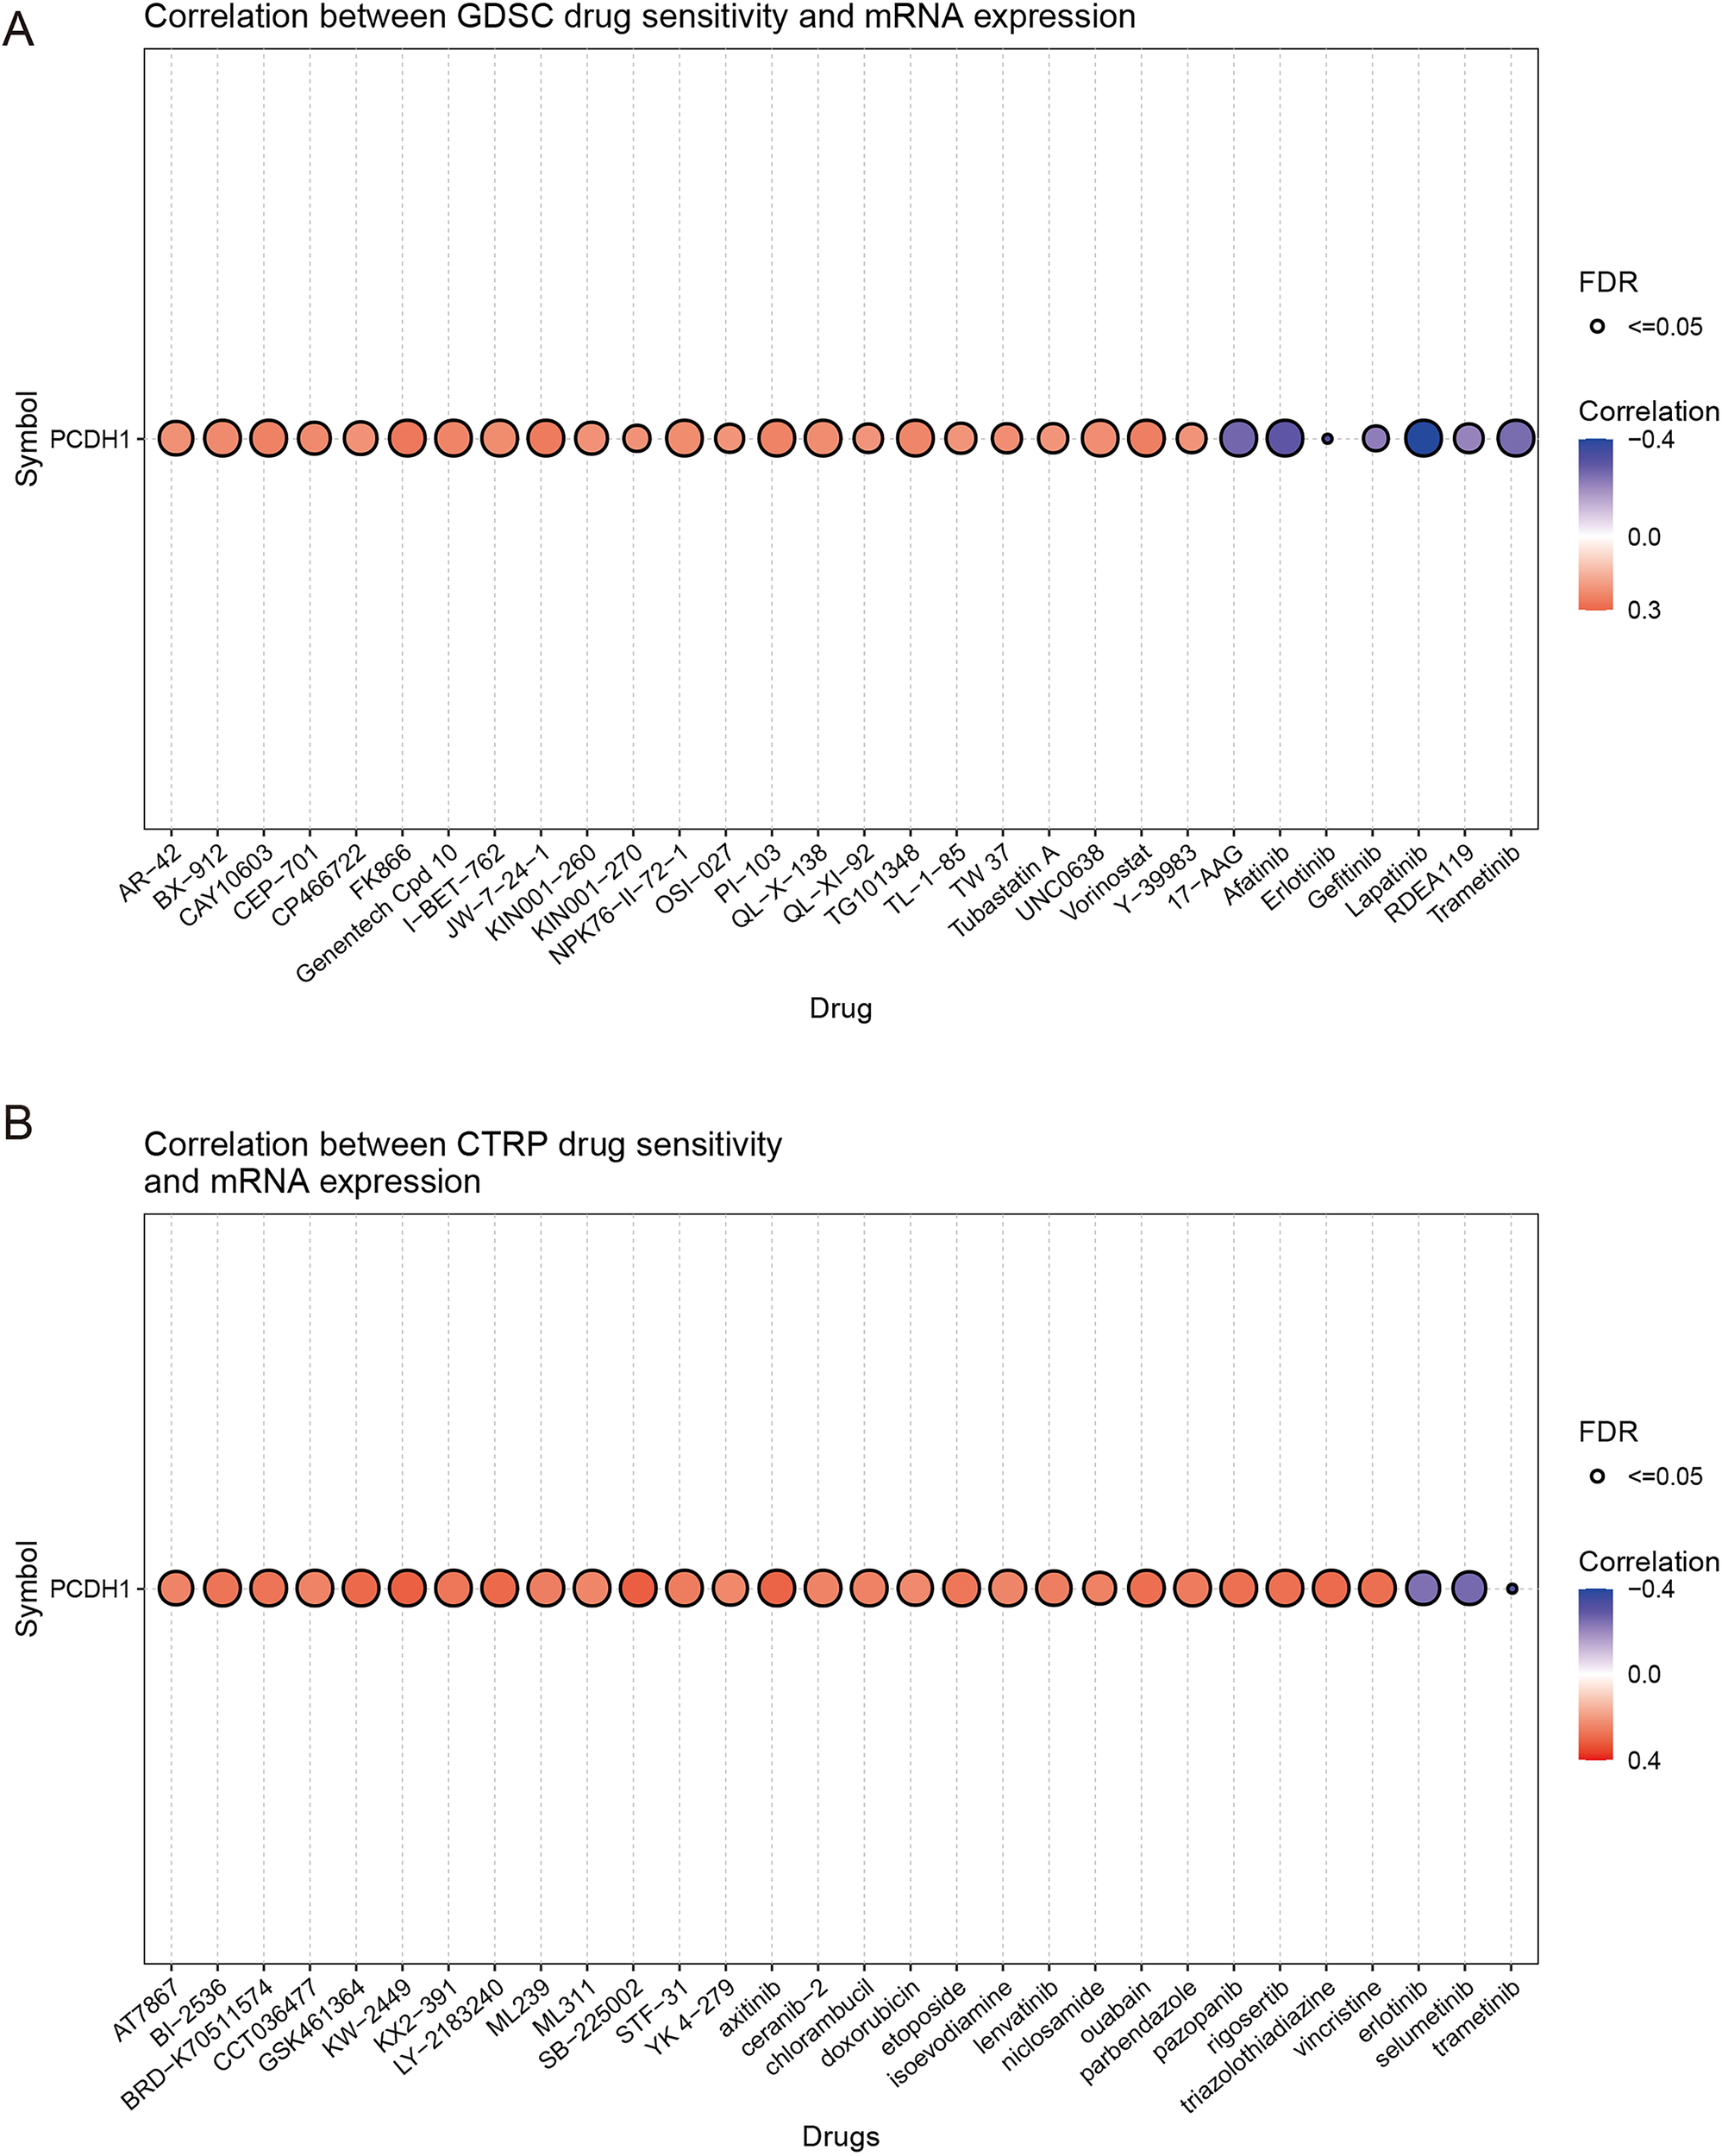
Chemosensitivity of PCDH1. (A) Correlation between GDSC drug sensitivity and PCDH1 mRNA expression (B) Correlation between CTRP drug sensitivity and PCDH1 mRNA expression.
3.7 Functional effects of PCDH1 knockdown in PDAC cells
To experimentally validate the oncogenic role of PCDH1, we performed loss-of-function assays in PDAC cell lines. Among three designed siRNAs, PCDH1-siRNA1 exhibited the highest silencing efficiency as determined by qRT-PCR, and was therefore selected for subsequent experiments (Figures 8A, B). MTT assay demonstrated that PCDH1 knockdown significantly suppressed cell proliferation in both BxPC3 and SW1990 cells across multiple time points (P<0.001; Figures 8C, E). Consistently, colony formation assays revealed that the clonogenic capacity of PCDH1-deficient cells was markedly reduced compared with control groups (Figures 8D, F). These findings collectively indicate that PCDH1 promotes PDAC cell growth and clonogenic survival, further substantiating its role as a functional oncogene and a potential therapeutic target.
Figure 8
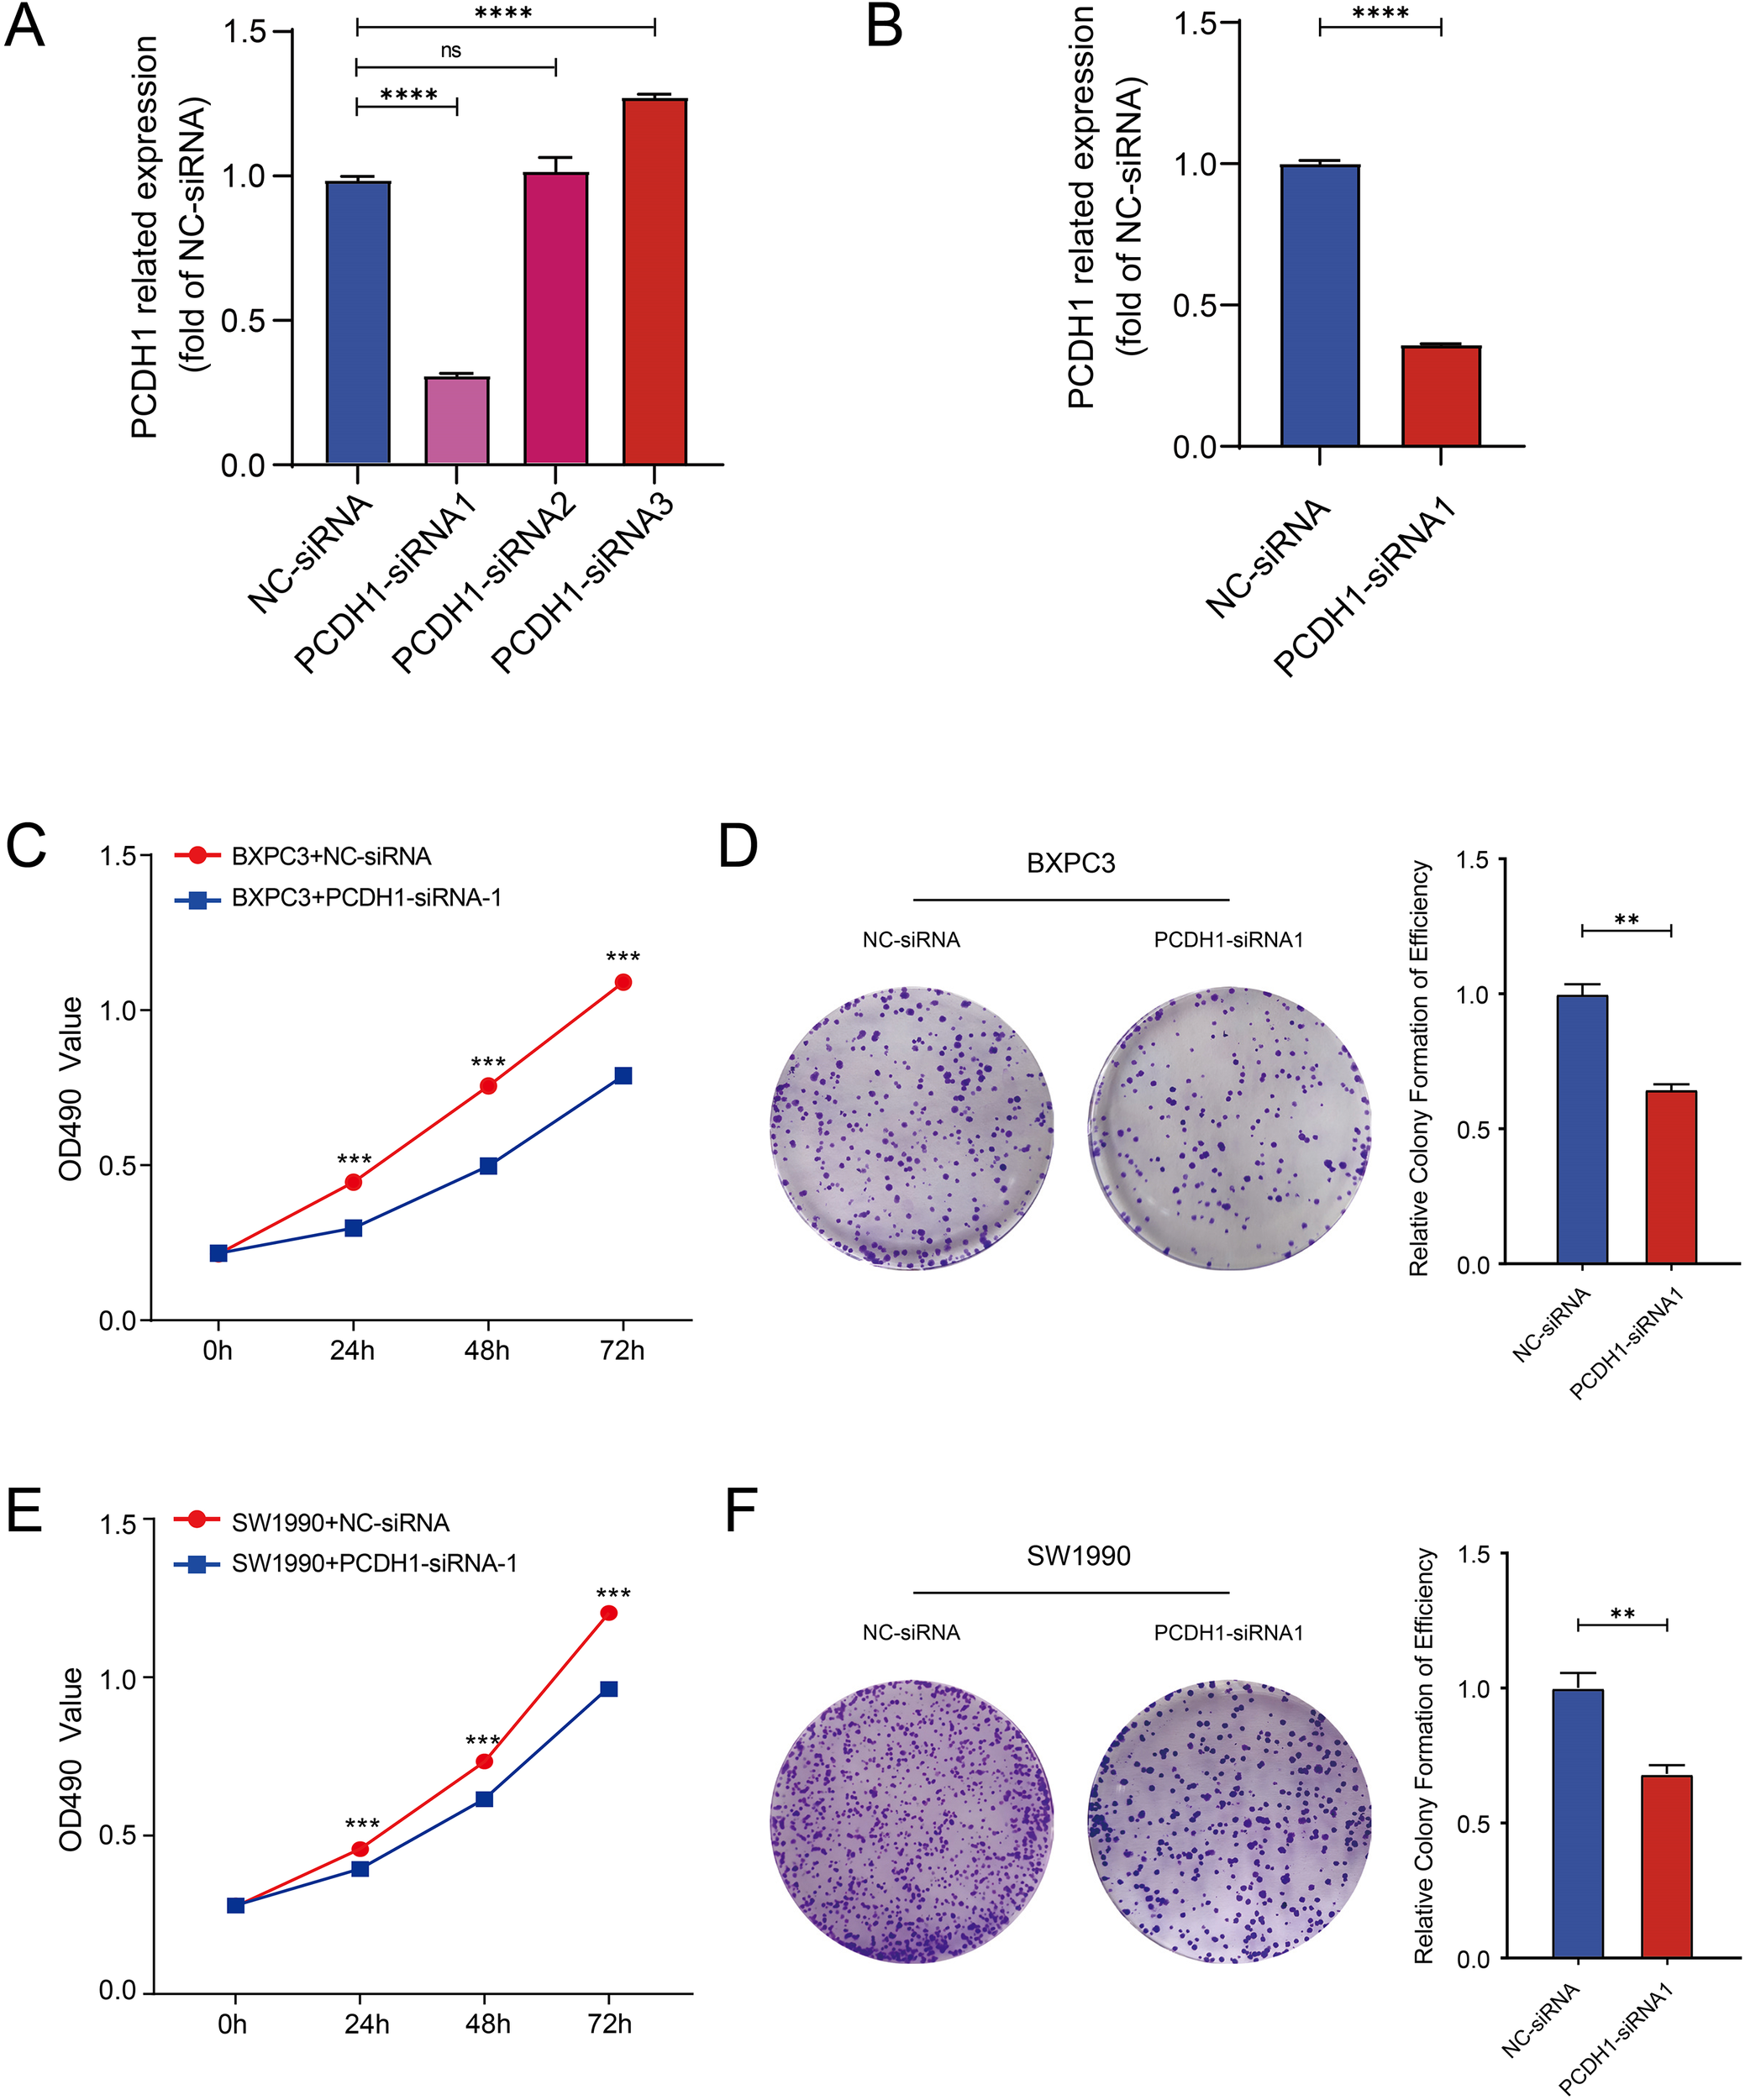
Knockdown of PCDH1 inhibited the proliferation of PDAC. (A) Efficiency of knocking down mRNA of PCDH1 si-RNA in BXPC3. (B) Efficiency of knocking down mRNA of PCDH1 si-RNA in SW1990. (C, E) MTT assays reveal the proliferation ability of control group and PCDH1 knockdown group in cell line BXPC3 and SW1990. (D, F) Colony formation assays reveal the proliferation ability of control group and PCDH1 knockdown group in cell line BXPC3 and SW1990. (ns: P>0.05, *P < 0.05, **P < 0.01, ***P < 0.001, ****P < 0.0001).
3.8 PCDH1 depletion suppresses migratory capacity of PDAC cells
To assess the impact of PCDH1 on tumor cell motility, we performed both Transwell migration and wound-healing assays in BxPC3 and SW1990 cells. Transwell analysis demonstrated that silencing PCDH1 markedly reduced the number of migrated cells compared with negative control groups (Figures 9A, B). Consistently, wound-healing assays revealed significantly delayed closure of scratch gaps in PCDH1-deficient cells. In both BxPC3 and SW1990 models, the migratory index was significantly reduced at 24 h and 48 h following knockdown, indicating impaired collective migration (Figures 9C, D). Together, these findings provide functional evidence that PCDH1 promotes the migratory phenotype of PDAC cells, supporting its role in driving tumor invasiveness.
Figure 9
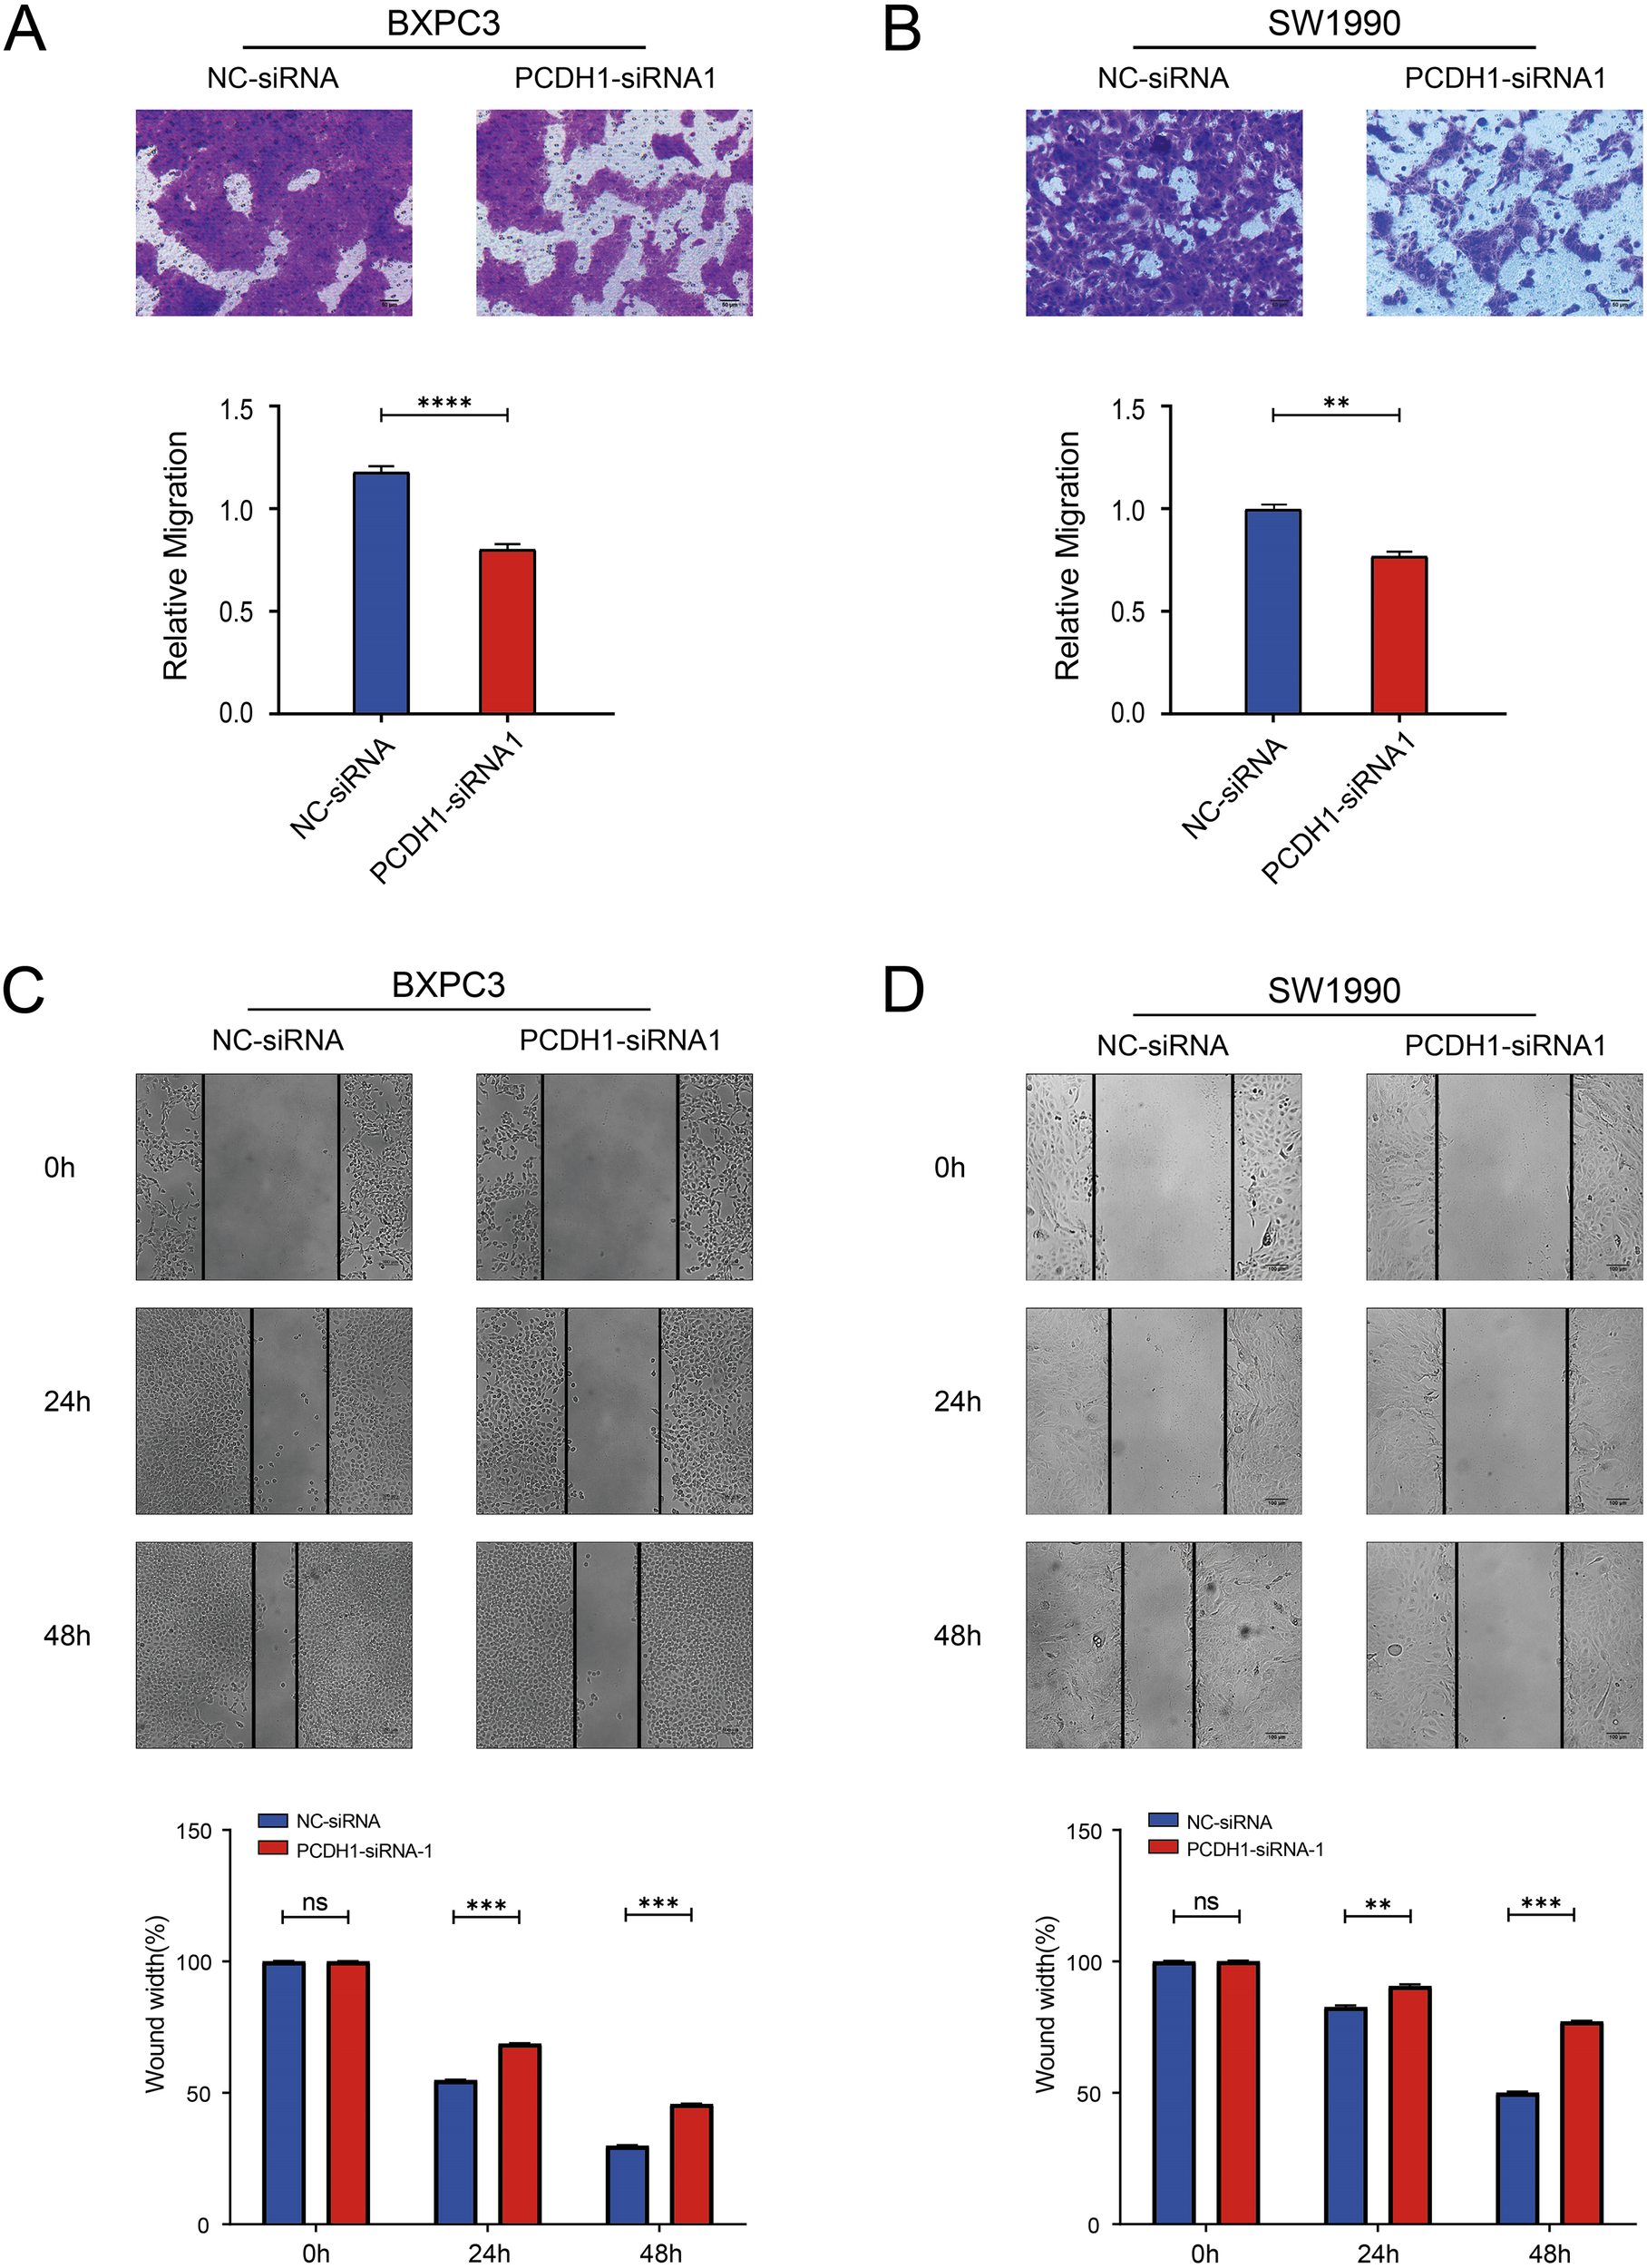
Knockdown of PCDH1 inhibited the migration of PDAC. (A) Transwell assays show the migration ability of the control group and the PCDH1 knockdown group in the BXPC3 cell line. (Scale bar = 50μm) (B) Transwell assays show the migration ability of the control group and the PCDH1 knockdown group in the SW1990 cell line. (Scale bar = 50μm) (C) Wound healing assays exhibit the migration ability of the control group and the PCDH1 knockdown group in the BXPC3 cell line. (Scale bar = 100μm) (D) Wound healing assays exhibit the migration ability of the control group and the PCDH1 knockdown group in the SW1990 cell line. (Scale bar = 100μm) (ns: P>0.05, *P < 0.05, **P < 0.01, ***P < 0.001, ****P < 0.0001).
3.9 PCDH1 knockdown attenuates stemness phenotypes in PDAC cells
To determine whether PCDH1 contributes to cancer stemness in PDAC, we examined its effect on canonical stemness markers and sphere-forming capacity. qRT-PCR analysis revealed that PCDH1 silencing markedly reduced the transcriptional levels of CD24 and CD133 in both BxPC3 and SW1990 cells (Figures 10A, B). Flow cytometric analysis confirmed a significant decline in CD24+ and CD133+ cell populations following PCDH1 knockdown (Figures 10C–H), indicating loss of stem-like subpopulations. Functionally, sphere formation assays further demonstrated that PCDH1-deficient cells exhibited impaired self-renewal ability. Both BxPC3 and SW1990 cells with PCDH1 silencing generated significantly smaller and fewer tumor spheres compared with controls, with differences becoming pronounced by day 5 of culture (Figures 10I–L). Taken together, these results provide compelling evidence that PCDH1 sustains stemness-associated phenotypes in PDAC, promoting the maintenance of CD24+/CD133+ subpopulations and enhancing self-renewal capacity.
Figure 10
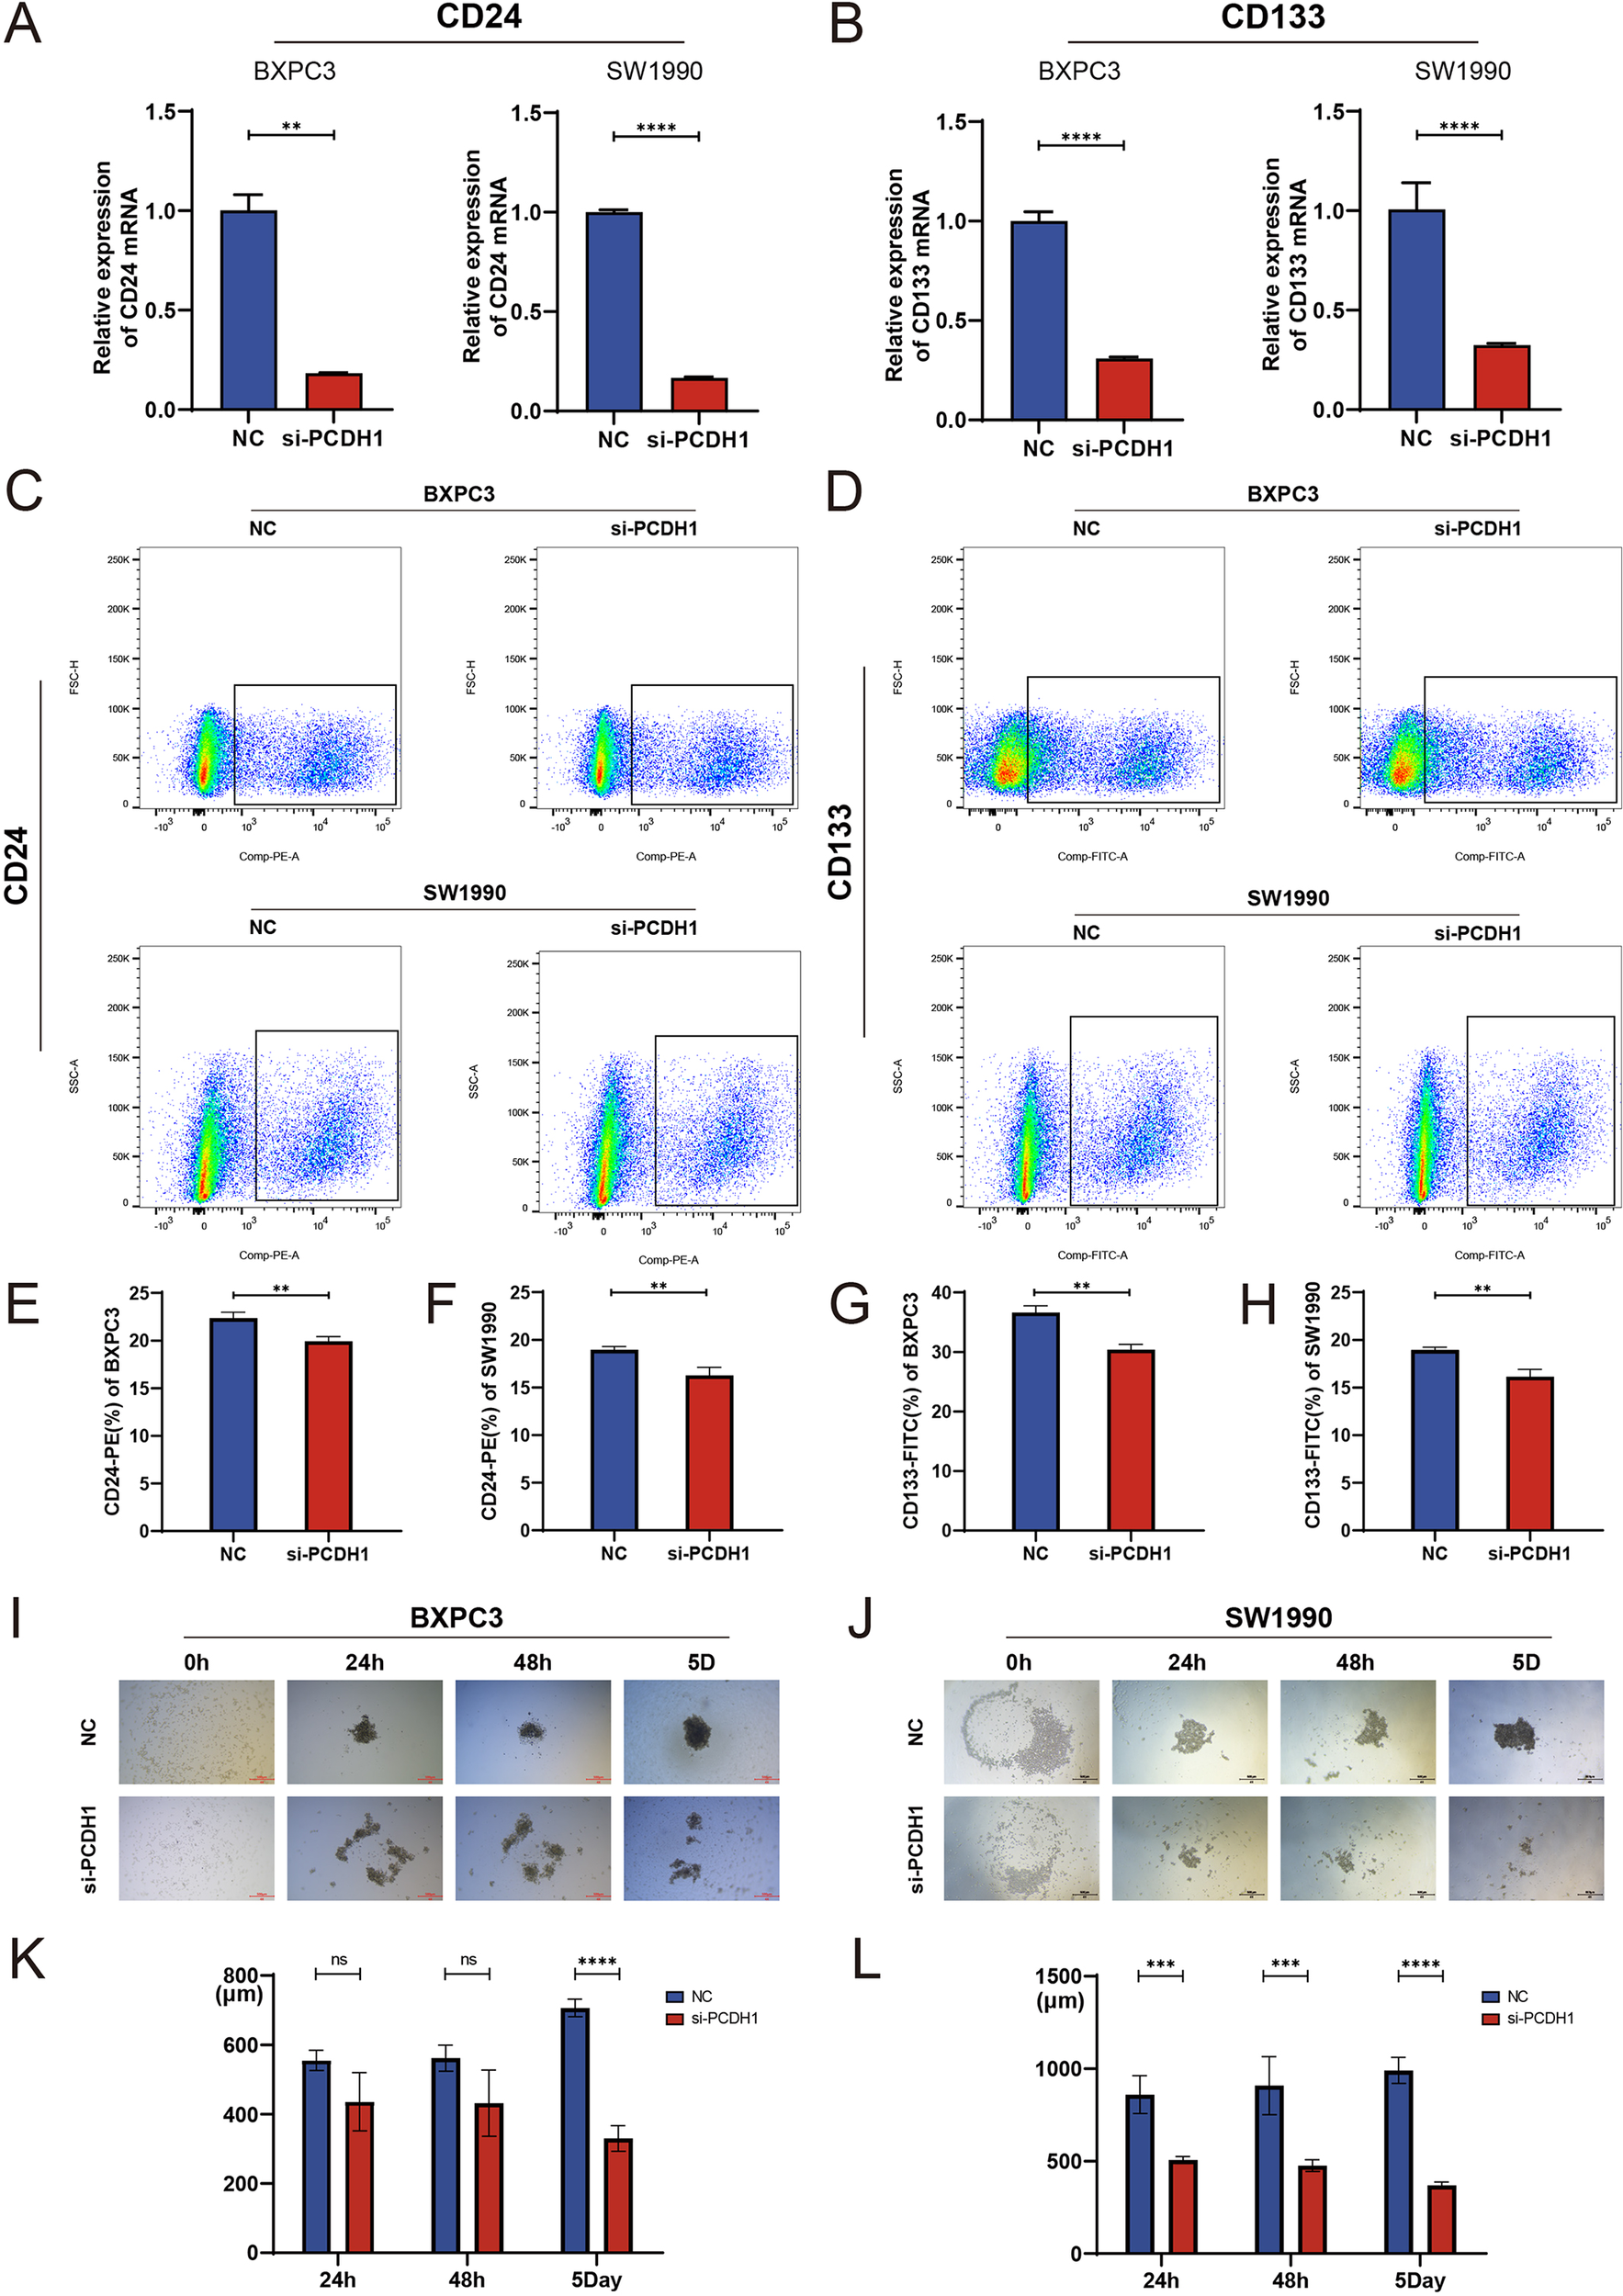
Knockdown of PCDH1 inhibited the tumor stemness of PDAC cell lines. (A) Relative expression of CD24 mRNA in the control group and the PCDH1 knockdown group. (B) Relative expression of CD133 mRNA in the control group and the PCDH1 knockdown group. (C) Detection of CD24+ cells in the control and PCDH1 knockdown groups via flow cytometry in BXPC3 and SW1990 cell lines. (D) Detection of CD133+ cells in the control and PCDH1 knockdown groups via flow cytometry in BXPC3 and SW1990 cell lines. (E, F) Percentage of CD24+ cells between the control group and the PCDH1 knockdown group (G, H) Percentage of CD133+ cells between the control group and the PCDH1 knockdown group. (I, J) Sphere formation assay was performed to detect sphere formation ability of the control group and the PCDH1 knockdown group in BXPC3 and SW1990. (K, L) Diameter of tumor spheres at 24 h, 48 h and 5 days in the control group and the PCDH1 knockdown group.(Scale bar = 500μm) (ns: P>0.05, **P < 0.01, ***P < 0.001, ****P < 0.0001).
3.10 Transcriptomic profiling reveals PI3K-Akt pathway involvement downstream of PCDH1
To elucidate the molecular mechanisms underlying PCDH1 function in PDAC, transcriptomic profiling was performed following siRNA-mediated knockdown. Hierarchical clustering of differentially expressed genes revealed a distinct separation between control and PCDH1-silenced groups, with widespread transcriptional downregulation observed upon PCDH1 inhibition (Figure 11A). Subsequent KEGG pathway enrichment analysis highlighted significant involvement of cancer-related signaling networks, most prominently the PI3K-Akt pathway, alongside cytokine–cytokine receptor interactions and extracellular matrix–related processes (Figure 11B). To validate these findings, we examined the expression of representative downstream targets by qRT-PCR. Notably, genes implicated in oncogenic signaling and tumor progression, including GNB4, EGF, MYB, IL6R, ANGPT4, and ITGB8, were consistently downregulated in both BxPC3 and SW1990 cells following PCDH1 silencing (Figures 11C, D). Collectively, these data demonstrate that PCDH1 exerts its oncogenic role in PDAC at least partly by modulating PI3K-Akt signaling and associated tumor-promoting effectors.
Figure 11
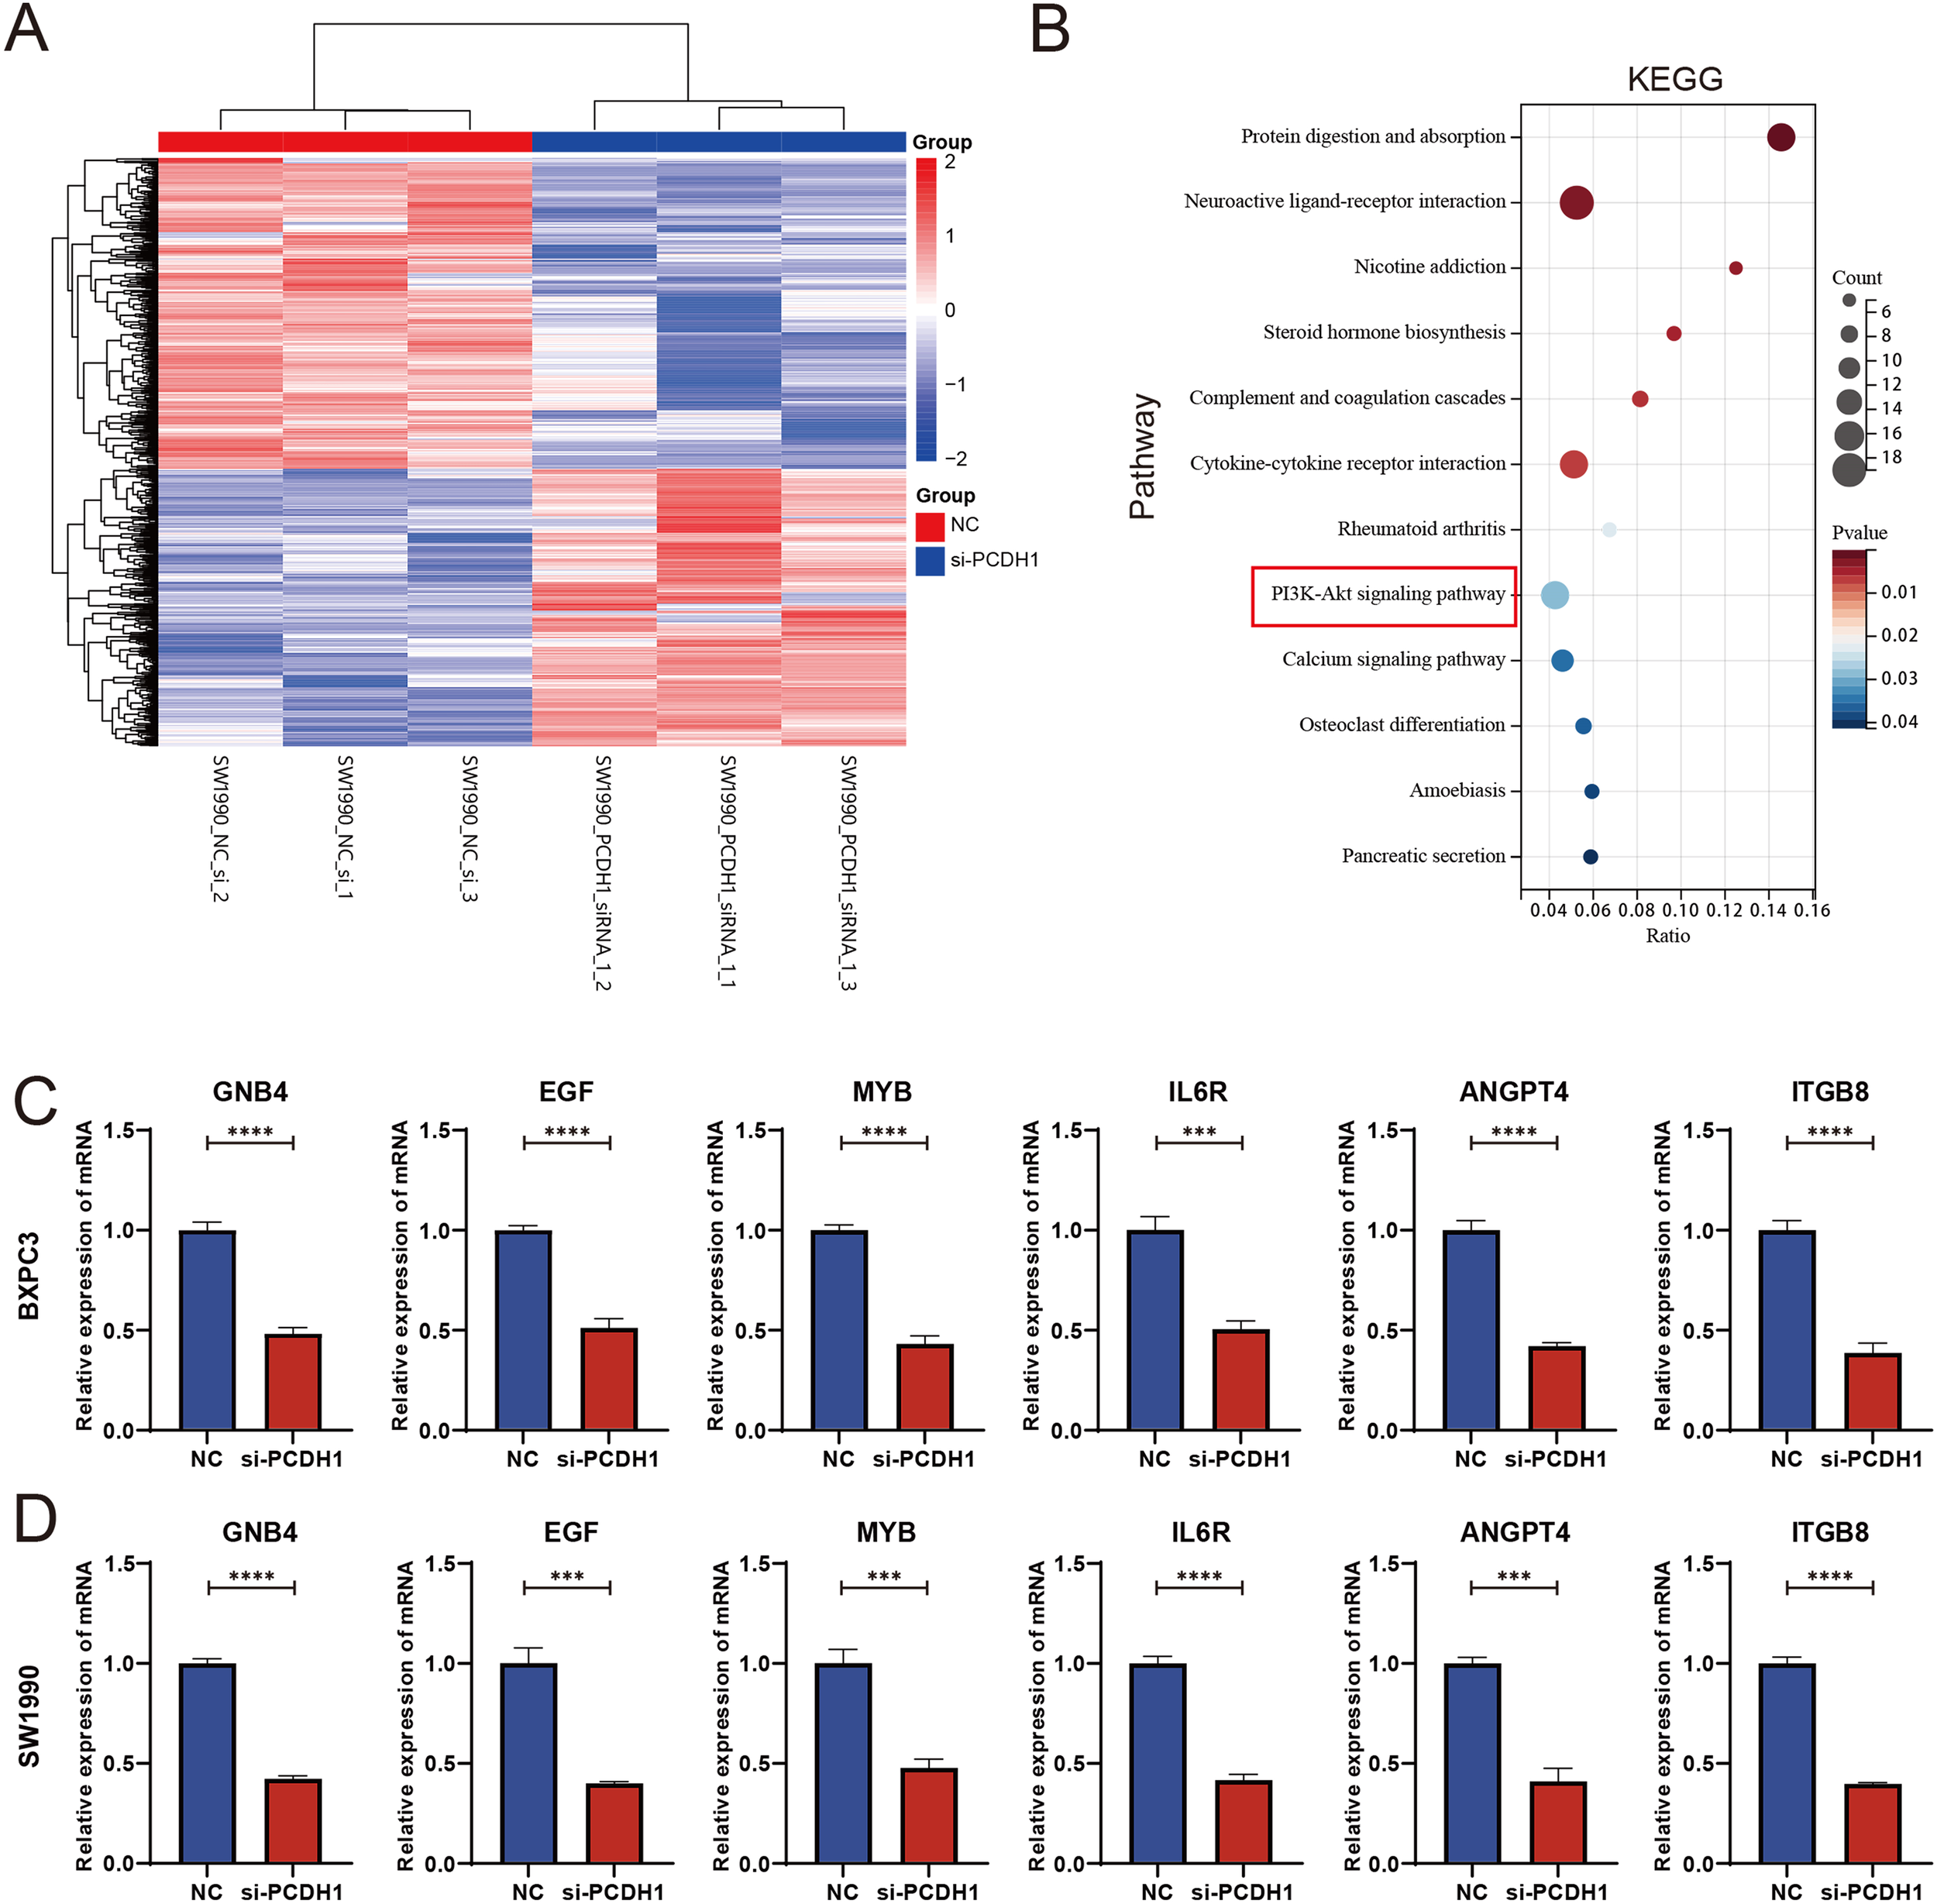
PCDH1 promotes proliferation and migration of PDAC through activation of PI3K/Akt pathway. (A) Heatmap of differential expression genes between the NC and si-PCDH1 groups. (B) KEGG enrichment analysis demonstrates pathways associated with differential expression genes. (C, D) Expression levels of mRNA for six molecules in the PI3K/Akt pathway were detected by qRT-PCR. (***P < 0.001, ****P < 0.0001).
3.11 IGF-1 rescues the proliferative impairment induced by PCDH1 knockdown
To explore whether PCDH1 exerts its oncogenic function via the PI3K/AKT axis, we conducted rescue assays using exogenous IGF-1 stimulation. MTT assays demonstrated that silencing PCDH1 markedly suppressed proliferation in both BxPC3 and SW1990 cells, whereas IGF-1 treatment significantly restored proliferative capacity. Notably, combined treatment with si-PCDH1 and IGF-1 partially rescued the growth defect, confirming the functional involvement of PI3K/AKT signaling (Figures 12A, B). Colony formation assays further corroborated these findings. PCDH1 knockdown drastically reduced clonogenic survival, while IGF-1 stimulation promoted robust colony formation. Importantly, IGF-1 partially reversed the inhibitory effect of si-PCDH1, though not to the level of IGF-1 stimulation alone, suggesting that PCDH1 may act upstream to potentiate PI3K/AKT-driven tumorigenicity (Figures 12C–E). Collectively, these results establish that PCDH1 promotes PDAC cell growth and clonogenicity, at least in part, through activation of the PI3K/AKT pathway, thereby functionally linking PCDH1 expression to oncogenic signaling cascades.
Figure 12
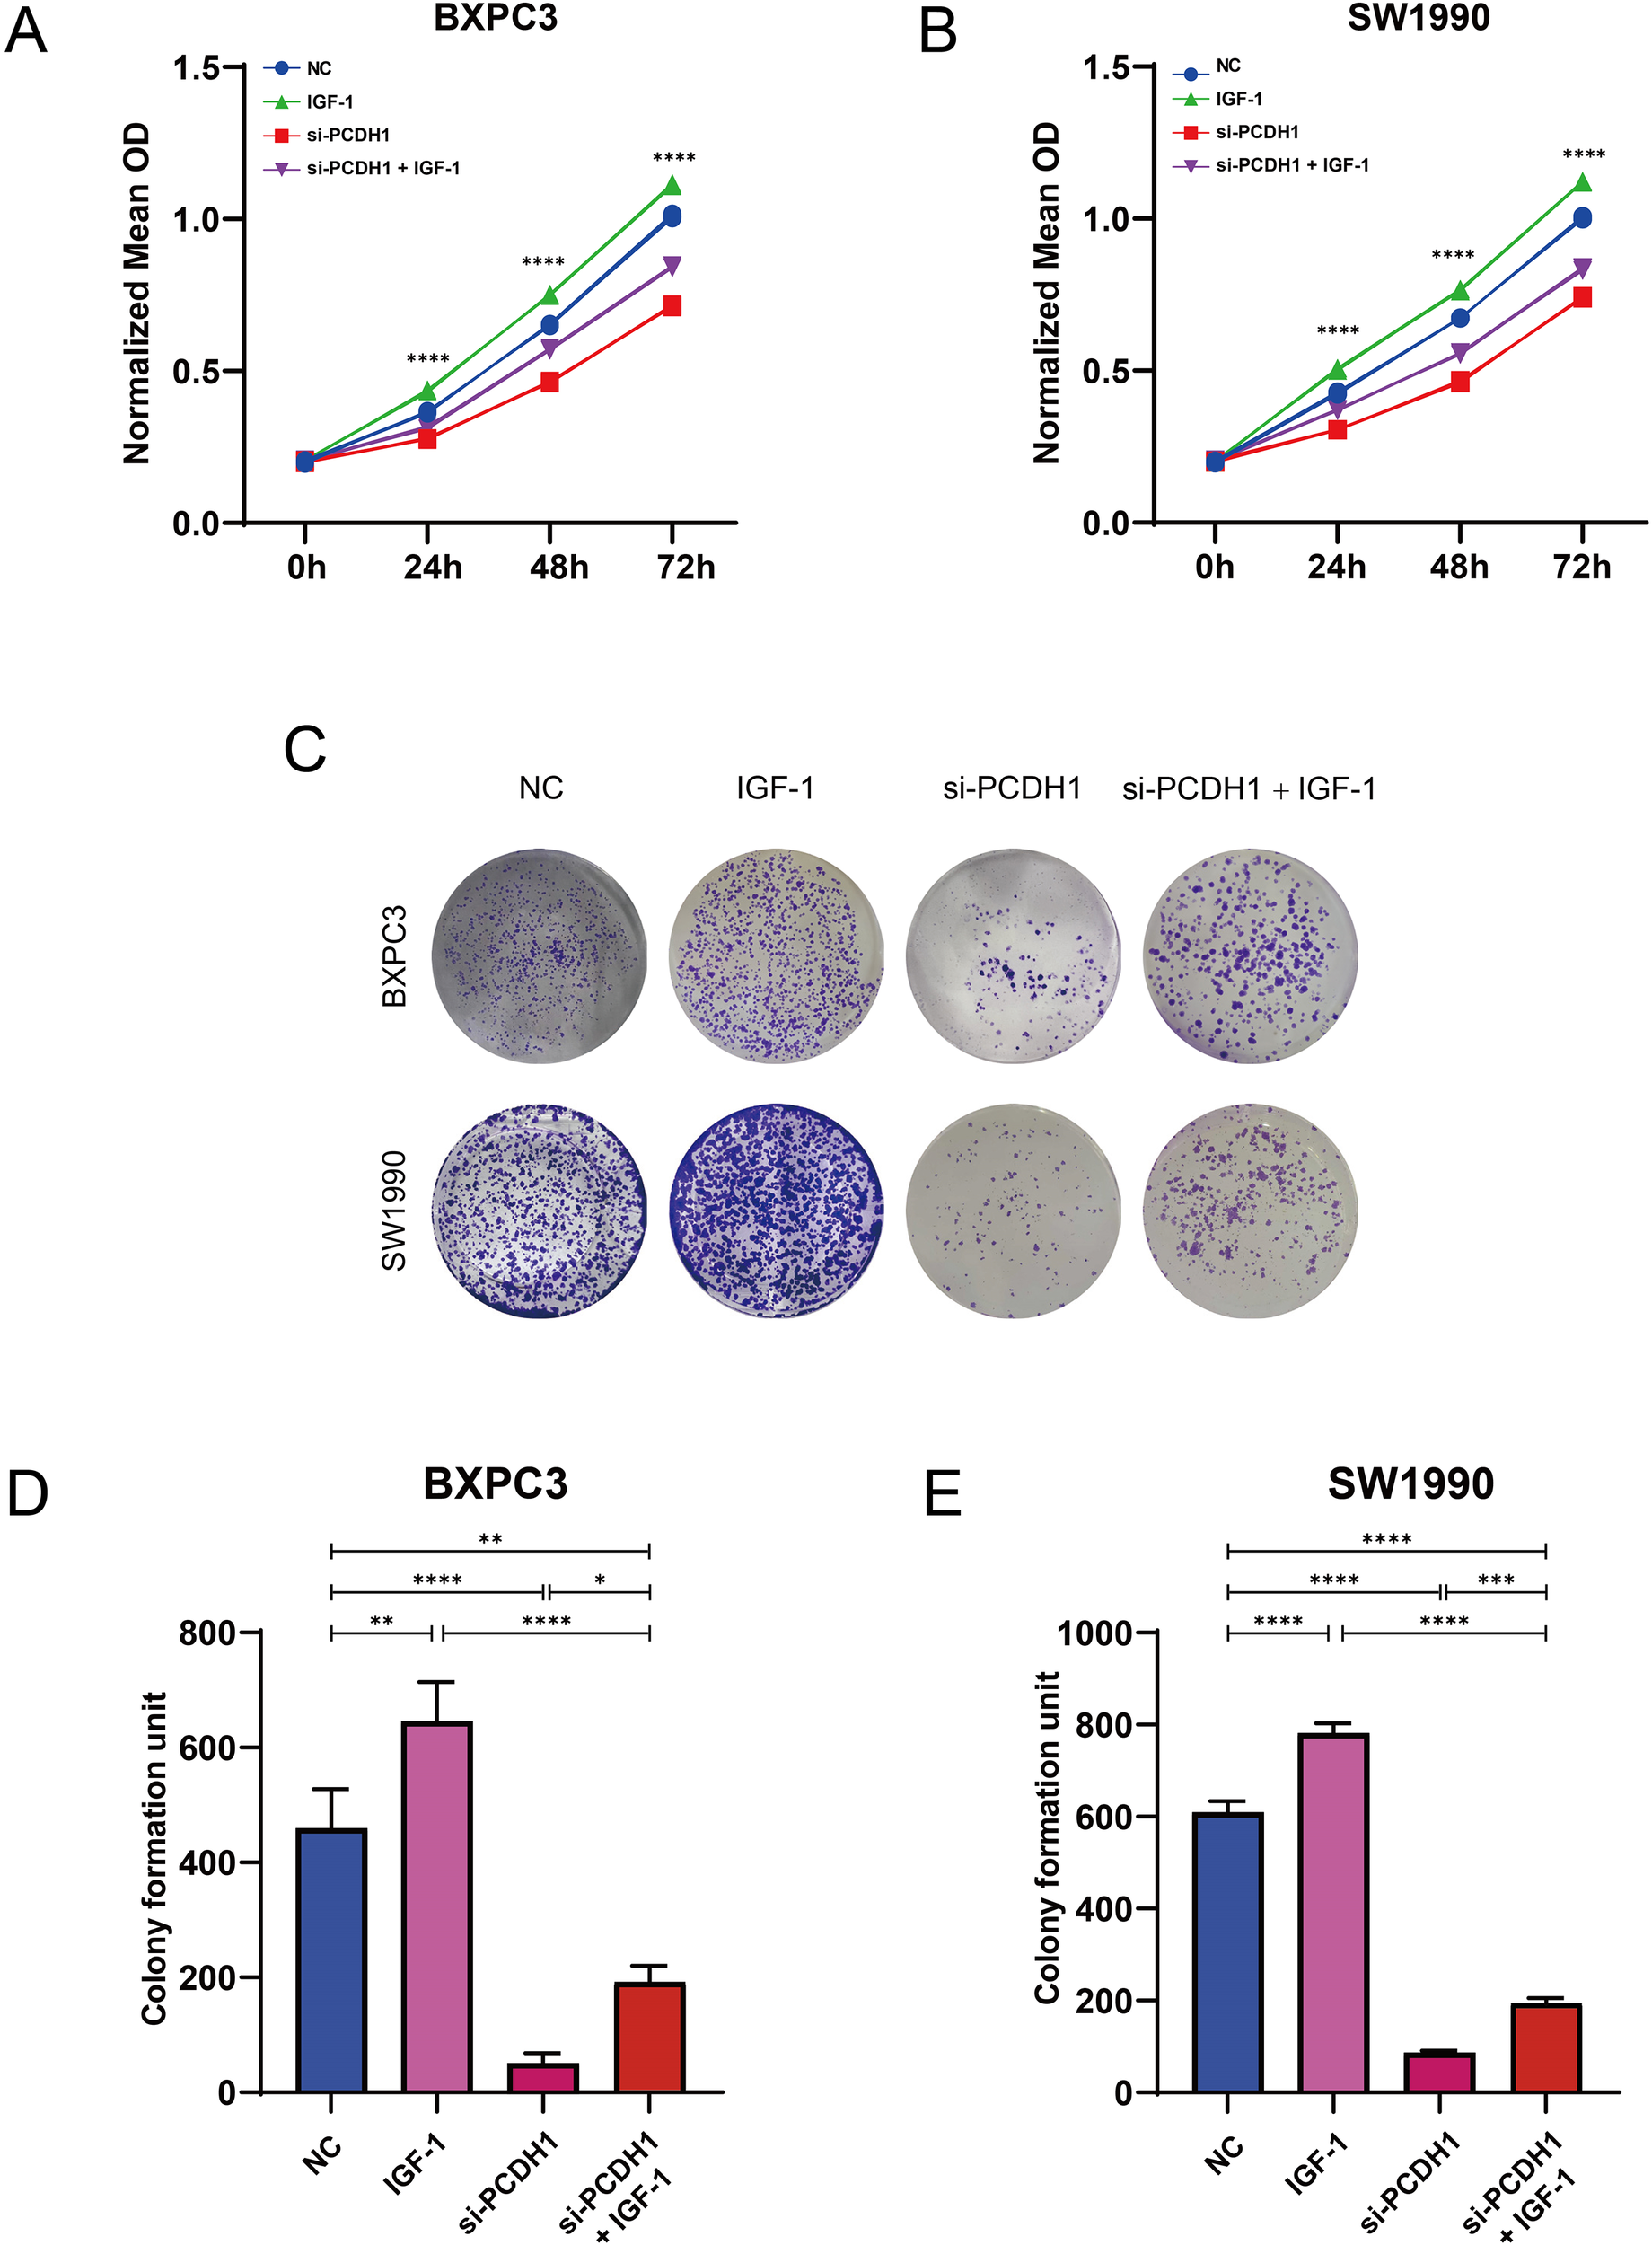
PCDH1 promotes proliferation and migration of PDAC through activation of PI3K/Akt pathway. (A, B) MTT assay was used to detect the proliferation ability of the control, IGF-1, si-PCDH1, and si-PCDH1 + IGF-1 groups. (C–E) A colony formation assay was performed to detect the proliferation ability of the four groups. (*P < 0.05, **P < 0.01, ***P < 0.001, ****P < 0.0001).
3.12 PCDH1 regulates pancreatic cancer cell migration
To investigate the effect of PCDH1 on cell motility, we first performed Transwell migration assays in BxPC3 and SW1990 cells. Knockdown of PCDH1 markedly reduced the number of migrated cells compared to the control group (P < 0.01). Conversely, stimulation with IGF-1 significantly enhanced migration. Notably, co-treatment with si-PCDH1 and IGF-1 partially restored migratory ability, although it remained lower than that of the IGF-1 group alone (Figures 13A–C). Consistent with the Transwell results, wound healing assays showed that PCDH1 silencing significantly delayed wound closure in both BxPC3 and SW1990 cells (P < 0.01). Cells treated with IGF-1 demonstrated accelerated wound closure, while the combination of si-PCDH1 and IGF-1 exhibited intermediate effects, indicating only partial rescue of the impaired migration (Figures 13D–G). Together, these findings demonstrate that PCDH1 knockdown suppresses pancreatic cancer cell migration, whereas IGF-1 stimulation counteracts this effect, suggesting that PCDH1 may regulate cell motility at least in part through the IGF-1–associated signaling pathway.
Figure 13
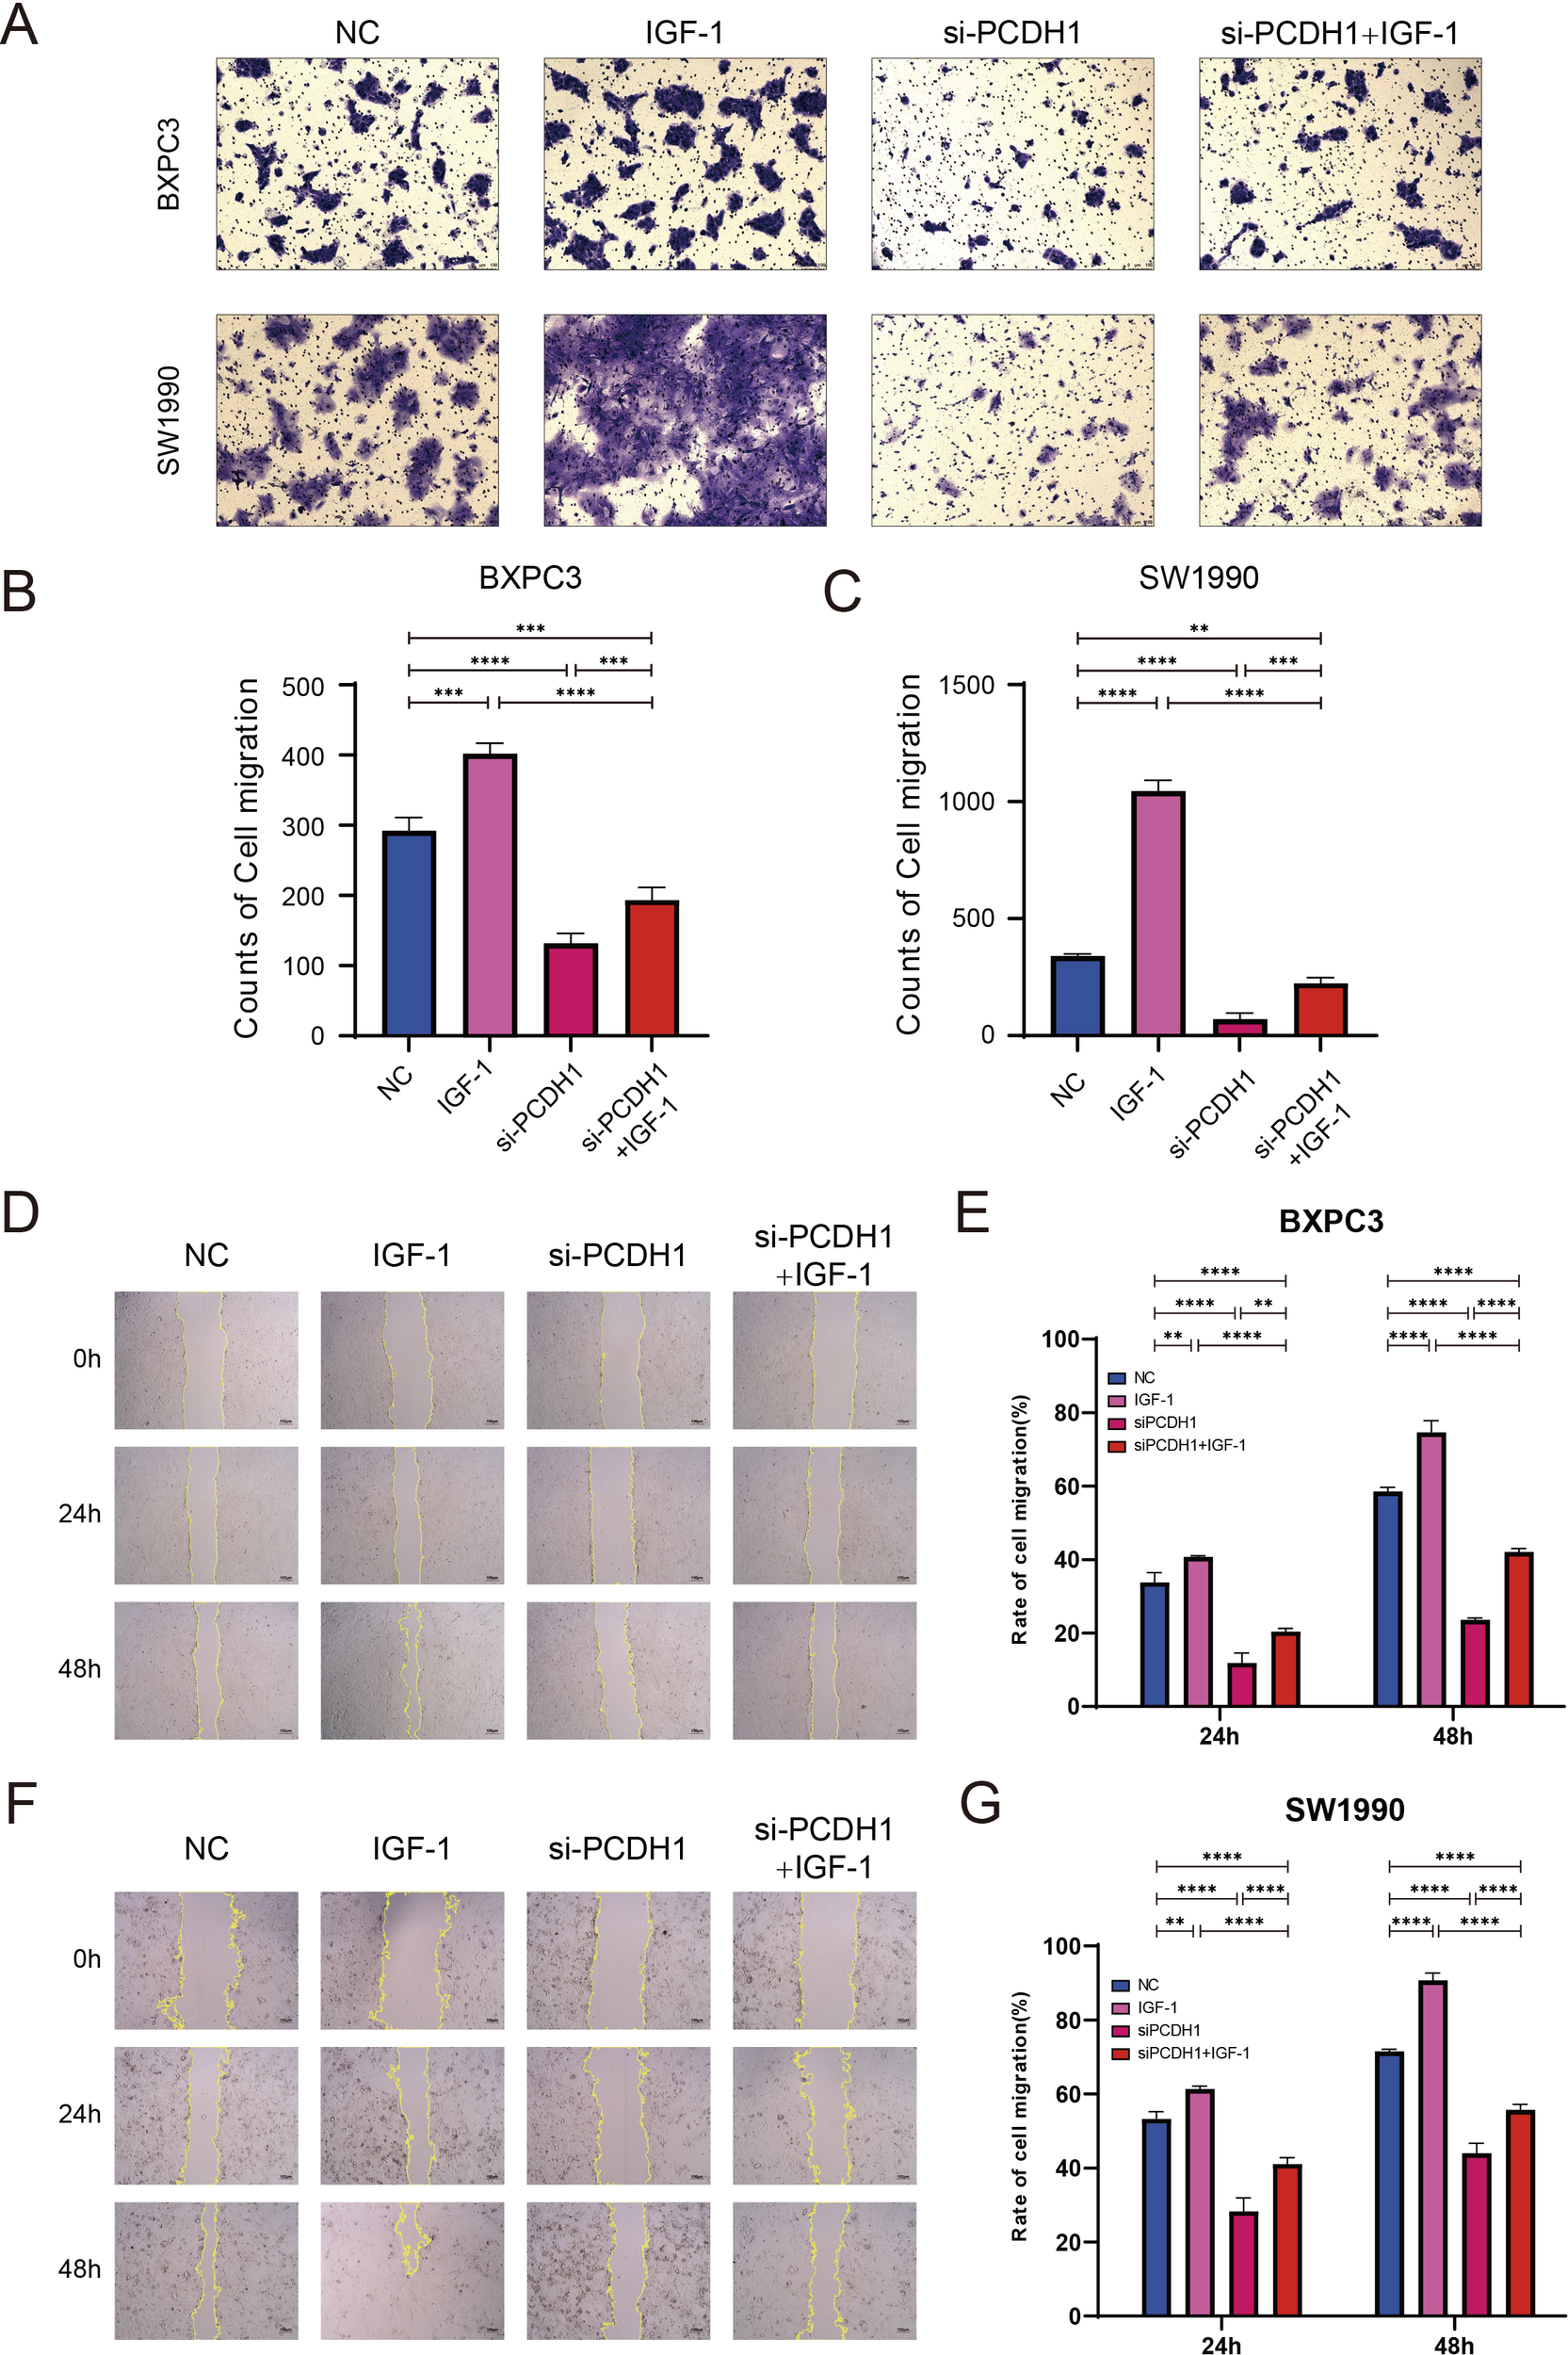
PCDH1 promotes proliferation and migration of PDAC through activation of PI3K/Akt pathway. (A) Transwell assays present the migration capacity of the control, IGF-1, si-PCDH1, and si-PCDH1 + IGF-1 groups. (Scale bar = 100μm) (B, C) Counts of cell migration in four groups. (D, F) Wound healing assays exhibit the migration ability of the four groups. (Scale bar = 100μm) (E, G) Rate of cell migration in four groups. (**P < 0.01, ***P < 0.001, ****P < 0.00011).
4 Discussion
Pancreatic ductal adenocarcinoma (PDAC) continues to rank among the most aggressive malignancies, characterized by rapid progression, early dissemination, and poor therapeutic response (23, 24). Despite advances in multimodal therapy, outcomes remain dismal, underscoring the urgent need to identify molecular determinants that sustain malignant behavior and therapeutic resistance. Increasing attention has been directed toward cancer stem cells (CSCs), a rare but functionally critical subset of tumor cells with self-renewal and multilineage potential (25, 26). CSCs not only initiate tumorigenesis but also fuel recurrence and metastasis by resisting cytotoxic and immune-mediated elimination. Our findings implicate protocadherin-1 (PCDH1) as a previously underappreciated regulator of stemness in PDAC (27).
Through integrative bioinformatics, we identified PCDH1 as a hub gene closely associated with stemness indices, and subsequent validation confirmed its overexpression in PDAC tissues compared with adjacent normal samples (28). Importantly, high PCDH1 expression correlated with reduced overall survival, highlighting its prognostic value (29–31). Functional assays demonstrated that PCDH1 promotes proliferative capacity, colony formation, and migratory potential, while knockdown substantially impaired these malignant traits (32). Moreover, stemness-related features, including spheroid formation and expression of canonical CSC markers CD24 and CD133, were markedly diminished upon PCDH1 silencing. These data collectively position PCDH1 as a driver of CSC maintenance in PDAC (33).
Mechanistically, transcriptomic profiling of PCDH1-deficient cells revealed downregulation of PI3K/AKT signaling, a pathway extensively linked to oncogenesis, metabolic adaptation, and therapeutic resistance in PDAC (34). Rescue experiments with IGF-1 further substantiated that PI3K/AKT activation is a critical mediator of PCDH1 function (35, 36). Thus, our study identifies PCDH1 not merely as a marker of stemness but as an upstream regulator of a canonical oncogenic cascade. Targeting this axis may therefore represent a rational strategy for CSC-directed therapy (37). Beyond tumor-intrinsic functions, PCDH1 expression exhibited strong correlations with an immunosuppressive tumor microenvironment (38). Elevated PCDH1 was associated with reduced infiltration of cytotoxic T cells, dendritic cells, and NK subsets, suggesting that PCDH1 may facilitate immune exclusion and tolerance (37). This dual role—sustaining CSC traits while dampening anti-tumor immunity—renders PCDH1 an especially compelling therapeutic candidate (39, 40). Furthermore, pharmacogenomic analyses indicated that PCDH1-high tumors display selective vulnerability to inhibitors of receptor tyrosine kinases and MAPK signaling, pointing toward opportunities for patient stratification in precision oncology (41, 42).
It should be acknowledged that this study also has certain limitations. This study was conducted primarily in 2D culture and awaits in vivo confirmation using organoids, patient-derived xenografts, or genetically engineered mouse models to validate PCDH1’s control of stemness and immune evasion. Detailed PI3K-AKT interactome mapping, immune-suppressive mechanisms, and drug-sensitivity predictions will require Co-IP/MS, phospho-proteomics, T-cell co-culture systems, and PDX efficacy assays. Future work will integrate multicenter clinical cohorts, single-cell multi-omics, and in vivo limiting-dilution transplantation to dissect the spatiotemporal PCDH1 signaling network and evaluate its translational potential as a companion diagnostic and a therapeutic target combinable with PI3K/mTOR inhibitors. In summary, our work establishes PCDH1 as a stemness-linked oncogene that orchestrates PDAC aggressiveness through PI3K/AKT activation while shaping immune evasion and drug response. These findings extend the biological understanding of PDAC stemness and highlight PCDH1 as both a prognostic biomarker and a potential therapeutic target. Future investigations should focus on validating these observations in preclinical models, exploring the structural basis of PCDH1–PI3K/AKT crosstalk, and assessing its utility as a companion biomarker in clinical trials.
5 Conclusion
Our study identifies PCDH1 as a stemness-linked oncogene in pancreatic ductal adenocarcinoma (PDAC). Integrative analyses revealed that PCDH1 is markedly upregulated in tumors, correlates with poor patient survival, and drives malignant phenotypes including proliferation, migration, and cancer stem cell maintenance. Mechanistically, PCDH1 promotes PDAC progression through activation of the PI3K/AKT signaling cascade, thereby coupling stemness traits with oncogenic signaling. In addition, elevated PCDH1 expression was associated with immune exclusion and selective drug sensitivities, highlighting its relevance not only as a prognostic biomarker but also as a potential determinant of therapeutic response. Taken together, these findings position PCDH1 at the intersection of stemness regulation, tumor aggressiveness, and treatment resistance in PDAC. By linking CSC biology to immune modulation and actionable signaling pathways, PCDH1 offers a promising target for precision oncology approaches. Future work should validate these observations in in vivo models and assess the translational potential of PCDH1-directed interventions, both as a therapeutic target and as a stratification marker in clinical management of PDAC.
Statements
Data availability statement
The original contributions presented in the study are included in the article/supplementary material. Further inquiries can be directed to the corresponding authors.
Author contributions
ZY: Writing – review & editing, Data curation, Writing – original draft, Supervision, Conceptualization. ZZ: Methodology, Supervision, Writing – original draft. YS: Writing – review & editing, Data curation, Writing – original draft, Software. CD: Validation, Writing – review & editing, Writing – original draft, Investigation. WZ: Writing – review & editing, Writing – original draft, Software, Supervision, Investigation. DZ: Data curation, Writing – original draft, Software, Writing – review & editing, Methodology.
Funding
The author(s) declared that financial support was received for this work and/or its publication. This study was funded by the China Postdoctoral Science Foundation (Grant No. 2016M591549).
Conflict of interest
The author(s) declared that this work was conducted in the absence of any commercial or financial relationships that could be construed as a potential conflict of interest.
Generative AI statement
The author(s) declared that generative AI was not used in the creation of this manuscript.
Any alternative text (alt text) provided alongside figures in this article has been generated by Frontiers with the support of artificial intelligence and reasonable efforts have been made to ensure accuracy, including review by the authors wherever possible. If you identify any issues, please contact us.
Publisher’s note
All claims expressed in this article are solely those of the authors and do not necessarily represent those of their affiliated organizations, or those of the publisher, the editors and the reviewers. Any product that may be evaluated in this article, or claim that may be made by its manufacturer, is not guaranteed or endorsed by the publisher.
Glossary
- AKT
Protein kinase B
- ANGPT4
Angiopoietin-4
- APC
Antigen-presenting cell
- AUC
Area under the curve
- bFGF
Basic fibroblast growth factor
- B3GNT3
β-1,3-N-acetylglucosaminyltransferase 3
- BSA
Bovine serum albumin
- CI
Confidence interval
- CSC
Cancer stem cell
- CTRP
Cancer Therapeutics Response Portal
- DAB
3,3′-Diaminobenzidine
- DEG
Differentially expressed gene
- DMSO
Dimethyl sulfoxide
- DNAss
DNA-methylation-based stemness score
- EGF
Epidermal growth factor
- ESRP1
Epithelial splicing regulatory protein 1
- ESTIMATE
Estimation of STromal and Immune cells in MAlignant Tumor tissues using Expression data
- FBS
Fetal bovine serum
- FFPE
Formalin-fixed paraffin-embedded
- FDR
False discovery rate
- FITC
Fluorescein isothiocyanate
- FPKM
Fragments per kilobase of transcript per million mapped reads
- GDSC
Genomics of Drug Sensitivity in Cancer
- GNB4
Guanine nucleotide-binding protein subunit β-4
- GSDC
Gene Set Differential Correlation
- HR
Hazard ratio
- HRP
Horseradish peroxidase
- IC50
Half-maximal inhibitory concentration
- IGF-1
Insulin-like growth factor-1
- IL6R
Interleukin-6 receptor
- IOD
Integrated optical density
- IHC
Immunohistochemistry
- ITGB8
Integrin β-8
- KCNK1
Potassium two-pore domain channel subfamily K member 1
- KEGG
Kyoto Encyclopedia of Genes and Genomes
- Limma
Linear models for microarray data
- MAL2
MAL proto-oncogene, T-cell differentiation protein 2
- MOD
Mean optical density
- mRNAsi
mRNA-based stemness index
- MTT
3-(4,5-Dimethylthiazol-2-yl)-2,5-diphenyltetrazolium bromide
- MYB
MYB proto-oncogene, transcription factor
- NK
Natural killer
- ns
Not significant
- OS
Overall survival
- PAAD
Pancreatic adenocarcinoma
- PBS
Phosphate-buffered saline
- PCR
Polymerase chain reaction
- PDAC
Pancreatic ductal adenocarcinoma
- PCDH1
Protocadherin-1,PE:Phycoerythrin
- PERP
p53 apoptosis effector related to PMP-22
- PI
Propidium iodide
- PI3K
Phosphatidylinositol 3-kinase
- PPI
Protein–protein interaction
- pDC
Plasmacytoid dendritic cell
- qRT-PCR
Quantitative real-time PCR
- RNAss
RNA-based stemness score
- ROC
Receiver operating characteristic
- RPMI
Roswell Park Memorial Institute medium
- RT
Room temperature
- SD
Standard deviation
- SDRC5
Short-chain dehydrogenase/reductase family 16C member 5
- SEM
Standard error of the mean
- si-NC
Small interfering negative control
- si-PCDH1
Small interfering RNA targeting PCDH1
- SMAD3
SMAD family member 3
- ssGSEA
Single-sample gene set enrichment analysis
- TCGA
The Cancer Genome Atlas
- TFH
T follicular helper
- TISCH
Tumor Immune Single-cell Hub
- TMPRSS4
Transmembrane protease serine 4
- TOB1
Transducer of ERBB2-1
- Treg
Regulatory T cell
- UCSC
University of California, Santa Cruz
- WGCNA
Weighted gene co-expression network analysis.
References
1
Taherian M Wang H Wang H . Pancreatic ductal adenocarcinoma: molecular pathology and predictive biomarkers. Cells. (2022) 11:3068. doi: 10.3390/cells11193068
2
Hewitt DB Aziz H Brown ZJ Pawlik TM . Role of genetic testing in hepatic, pancreatic, and biliary cancers. Surg Oncol. (2022) 44:101844. doi: 10.1016/j.suronc.2022.101844
3
Li D Xie K Wolff R Abbruzzese JL . Pancreatic cancer. Lancet. (2004) 363:1049–57. doi: 10.1016/s0140-6736(04)15841-8
4
Sardar M Recio-Boiles A Mody K Karime C Chandana SR Mahadevan D et al . Pharmacotherapeutic options for pancreatic ductal adenocarcinoma. Expert Opin Pharmacother. (2022) 23:2079–89. doi: 10.1080/14656566.2022.2149322
5
Jiang Y Sohal DPS . Pancreatic adenocarcinoma management. JCO Oncol Pract. (2023) 19:19–32. doi: 10.1200/op.22.00328
6
Nakaoka K Ohno E Kawabe N Kuzuya T Funasaka K Nakagawa Y et al . Current status of the diagnosis of early-stage pancreatic ductal adenocarcinoma. Diagnostics (Basel). (2023) 13:215. doi: 10.3390/diagnostics13020215
7
Rasheed ZA Matsui W . Biological and clinical relevance of stem cells in pancreatic adenocarcinoma. J Gastroenterol Hepatol. (2012) 27 Suppl 2:15–8. doi: 10.1111/j.1440-1746.2011.07015.x
8
Aponte PM Caicedo A . Stemness in cancer: stem cells, cancer stem cells, and their microenvironment. Stem Cells Int. (2017) 2017:5619472. doi: 10.1155/2017/5619472
9
Prasad S Ramachandran S Gupta N Kaushik I Srivastava SK . Cancer cells stemness: A doorstep to targeted therapy. Biochim Biophys Acta Mol Basis Dis. (2020) 1866:165424. doi: 10.1016/j.bbadis.2019.02.019
10
Melzer C von der Ohe J Lehnert H Ungefroren H Hass R . Cancer stem cell niche models and contribution by mesenchymal stroma/stem cells. Mol Cancer. (2017) 16:28. doi: 10.1186/s12943-017-0595-x
11
Ponomarev A Gilazieva Z Solovyeva V Allegrucci C Rizvanov A . Intrinsic and extrinsic factors impacting cancer stemness and tumor progression. Cancers (Basel). (2022) 14(4):970. doi: 10.3390/cancers14040970
12
Qin S Mao Y Wang H Duan Y Zhao L . The interplay between M6a modification and non-coding rna in cancer stemness modulation: mechanisms, signaling pathways, and clinical implications. Int J Biol Sci. (2021) 17:2718–36. doi: 10.7150/ijbs.60641
13
Jing N Gao WQ Fang YX . Regulation of formation, stemness and therapeutic resistance of cancer stem cells. Front Cell Dev Biol. (2021) 9:641498. doi: 10.3389/fcell.2021.641498
14
Malta TM Sokolov A Gentles AJ Burzykowski T Poisson L Weinstein JN et al . Machine learning identifies stemness features associated with oncogenic dedifferentiation. Cell. (2018) 173:338–54.e15. doi: 10.1016/j.cell.2018.03.034
15
Franz M Rodriguez H Lopes C Zuberi K Montojo J Bader GD et al . Genemania update 2018. Nucleic Acids Res. (2018) 46:W60–w4. doi: 10.1093/nar/gky311
16
Sun D Wang J Han Y Dong X Ge J Zheng R et al . Tisch: A comprehensive web resource enabling interactive single-cell transcriptome visualization of tumor microenvironment. Nucleic Acids Res. (2021) 49:D1420–d30. doi: 10.1093/nar/gkaa1020
17
Liu CJ Hu FF Xia MX Han L Zhang Q Guo AY . Gscalite: A web server for gene set cancer analysis. Bioinformatics. (2018) 34:3771–2. doi: 10.1093/bioinformatics/bty411
18
Mosmann T . Rapid colorimetric assay for cellular growth and survival: application to proliferation and cytotoxicity assays. J Immunol Methods. (1983) 65:55–63. doi: 10.1016/0022-1759(83)90303-4
19
Franken NA Rodermond HM Stap J Haveman J van Bree C . Clonogenic assay of cells in vitro. Nat Protoc. (2006) 1:2315–9. doi: 10.1038/nprot.2006.339
20
Kramer N Walzl A Unger C Rosner M Krupitza G Hengstschläger M et al . In vitro cell migration and invasion assays. Mutat Res. (2013) 752:10–24. doi: 10.1016/j.mrrev.2012.08.001
21
Liang CC Park AY Guan JL . In vitro scratch assay: A convenient and inexpensive method for analysis of cell migration in vitro. Nat Protoc. (2007) 2:329–33. doi: 10.1038/nprot.2007.30
22
Weiswald LB Bellet D Dangles-Marie V . Spherical cancer models in tumor biology. Neoplasia. (2015) 17:1–15. doi: 10.1016/j.neo.2014.12.004
23
Sulciner ML Ashley SW Molina G . Advances and remaining challenges in the treatment for borderline resectable and locally advanced pancreatic ductal adenocarcinoma. J Clin Med. (2022) 11:4866. doi: 10.3390/jcm11164866
24
Sung H Ferlay J Siegel RL Laversanne M Soerjomataram I Jemal A et al . Global cancer statistics 2020: globocan estimates of incidence and mortality worldwide for 36 cancers in 185 countries. CA Cancer J Clin. (2021) 71:209–49. doi: 10.3322/caac.21660
25
Maitra A Hruban RH . Pancreatic cancer. Annu Rev Pathol. (2008) 3:157–88. doi: 10.1146/annurev.pathmechdis.3.121806.154305
26
Hidalgo M . Pancreatic cancer. N Engl J Med. (2010) 362:1605–17. doi: 10.1056/NEJMra0901557
27
Lapidot T Sirard C Vormoor J Murdoch B Hoang T Caceres-Cortes J et al . A Cell Initiating Human Acute Myeloid Leukaemia after Transplantation into Scid Mice. Nature. (1994) 367:645–8. doi: 10.1038/367645a0
28
Li C Heidt DG Dalerba P Burant CF Zhang L Adsay V et al . Identification of pancreatic cancer stem cells. Cancer Res. (2007) 67:1030–7. doi: 10.1158/0008-5472.Can-06-2030
29
Koning H Sayers I Stewart CE de Jong D Ten Hacken NH Postma DS et al . Characterization of protocadherin-1 expression in primary bronchial epithelial cells: association with epithelial cell differentiation. FASEB J. (2012) 26:439–48. doi: 10.1096/fj.11-185207
30
Mortensen LJ Kreiner-Møller E Hakonarson H Bønnelykke K Bisgaard H . The pcdh1 gene and asthma in early childhood. Eur Respir J. (2014) 43:792–800. doi: 10.1183/09031936.00021613
31
Koppelman GH Meyers DA Howard TD Zheng SL Hawkins GA Ampleford EJ et al . Identification of pcdh1 as a novel susceptibility gene for bronchial hyperresponsiveness. Am J Respir Crit Care Med. (2009) 180:929–35. doi: 10.1164/rccm.200810-1621OC
32
Hermann PC Sainz B Jr . Pancreatic cancer stem cells: A state or an entity? Semin Cancer Biol. (2018) 53:223–31. doi: 10.1016/j.semcancer.2018.08.007
33
Shibata M Hoque MO . Targeting cancer stem cells: A strategy for effective eradication of cancer. Cancers (Basel). (2019) 11:732. doi: 10.3390/cancers11050732
34
Stoica AF Chang CH Pauklin S . Molecular therapeutics of pancreatic ductal adenocarcinoma: targeted pathways and the role of cancer stem cells. Trends Pharmacol Sci. (2020) 41:977–93. doi: 10.1016/j.tips.2020.09.008
35
Du X Yi X Zou X Chen Y Tai Y Ren X et al . Pcdh1, a poor prognostic biomarker and potential target for pancreatic adenocarcinoma metastatic therapy. BMC Cancer. (2023) 23:1102. doi: 10.1186/s12885-023-11474-1
36
Ye Z Yang Y Wei Y Li L Wang X Zhang J . Pcdh1 promotes progression of pancreatic ductal adenocarcinoma via activation of nf-Κb signalling by interacting with kpnb1. Cell Death Dis. (2022) 13:633. doi: 10.1038/s41419-022-05087-y
37
Raj D Aicher A Heeschen C . Concise review: stem cells in pancreatic cancer: from concept to translation. Stem Cells. (2015) 33:2893–902. doi: 10.1002/stem.2114
38
Kim SY Yasuda S Tanaka H Yamagata K Kim H . Non-clustered protocadherin. Cell Adh Migr. (2011) 5:97–105. doi: 10.4161/cam.5.2.14374
39
Oskarsson T Batlle E Massagué J . Metastatic stem cells: sources, niches, and vital pathways. Cell Stem Cell. (2014) 14:306–21. doi: 10.1016/j.stem.2014.02.002
40
Frank M Kemler R . Protocadherins. Curr Opin Cell Biol. (2002) 14:557–62. doi: 10.1016/s0955-0674(02)00365-4
41
Barbato L Bocchetti M Di Biase A Regad T . Cancer stem cells and targeting strategies. Cells. (2019) 8:926. doi: 10.3390/cells8080926
42
Dianat-Moghadam H Sharifi M Salehi R Keshavarz M Shahgolzari M Amoozgar Z . Engaging stemness improves cancer immunotherapy. Cancer Lett. (2023) 554:216007. doi: 10.1016/j.canlet.2022.216007
Summary
Keywords
gene, pancreatic ductal adenocarcinoma, PCDH1, stemness index, verification
Citation
Yang Z, Zhang Z, Song Y, Dai C, Zhang W and Zhao D (2026) PCDH1 facilitates migration, proliferation, and stemness of pancreatic cancer cells through PI3K-Akt signaling. Front. Oncol. 15:1696695. doi: 10.3389/fonc.2025.1696695
Received
01 September 2025
Revised
11 December 2025
Accepted
12 December 2025
Published
12 January 2026
Volume
15 - 2025
Edited by
Zong Sheng Guo, University at Buffalo, United States
Reviewed by
Zongyao Zhang, First Affiliated Hospital of Anhui Medical University, China
Marvin Lins, Federal University of Mato Grosso, Brazil
Updates
Copyright
© 2026 Yang, Zhang, Song, Dai, Zhang and Zhao.
This is an open-access article distributed under the terms of the Creative Commons Attribution License (CC BY). The use, distribution or reproduction in other forums is permitted, provided the original author(s) and the copyright owner(s) are credited and that the original publication in this journal is cited, in accordance with accepted academic practice. No use, distribution or reproduction is permitted which does not comply with these terms.
*Correspondence: Weihui Zhang, zhangweihui626@hotmail.com; Dali Zhao, zhaodali@hrbmu.edu.cn
Disclaimer
All claims expressed in this article are solely those of the authors and do not necessarily represent those of their affiliated organizations, or those of the publisher, the editors and the reviewers. Any product that may be evaluated in this article or claim that may be made by its manufacturer is not guaranteed or endorsed by the publisher.