 Shiyu Cui1†Hongzheng Song2†Fanxia Lin3Xiaomeng Han1Bo Wang1
 Liang Zhang4Feng Hou5Enhao Kang5Jizheng Lin1*
 Henan Lou1*
- 1Department of Radiology, The Affiliated Hospital of Qingdao University, Qingdao, China
- 2Department of Radiology, Qingdao Municipal Hospital, Qingdao, China
- 3Department of Radiology, People’s Hospital of Rizhao, Rizhao, China
- 4Department of Nuclear Medicine, The Affiliated Hospital of Qingdao University, Qingdao, China
- 5Department of Pathology, The Affiliated Hospital of Qingdao University, Qingdao, China
Background: This study aims to explore the value of radiomic features from different regions of part-solid nodules (PSNs) for predicting spread through air spaces (STAS) in lung adenocarcinoma.
Methods: This retrospective analysis included 333 patients with PSNs lung adenocarcinoma pathologically confirmed in three hospitals. Data from one institution were utilized for training set (n=223), while the remaining two served as the external test set (n=110). The computed tomography radiomic features were extracted from different areas of the nodule (ground-glass, solid, gross, and perinodular). Three machine learning classifiers (support vector machine, light gradient boosting machine [LightGBM], logistic regression) were used to build predictive models. Model performance was assessed using accuracy and area under the curve (AUC). The DeLong test was used to determine differences in AUC values between models. The clinical benefits of models were assessed using decision curve analysis (DCA).
Results: In the external test set, the radiomics model developed using combined features from ground-glass, solid, and perinodular regions with LightGBM classifier achieved an AUC of 0.840 (95% confidence interval [CI]: 0.758–0.921), which was better than the clinical model (AUC = 0.622, 95% CI: 0.494–0.750, P < 0.001) and other radiomics models. DCA indicated that this model has achieved a higher net benefit.
Conclusion: The radiomics model developed using radiomic features of distinct solid and ground-glass components of PSNs and the perinodular region can contribute to identifying the STAS status in lung adenocarcinoma.
Introduction
Lung cancer ranks among the most prevalent cancers globally, having the highest incidence rate (1). In most countries, adenocarcinoma emerges as the predominant pathological type, accounting for nearly 50% of all lung cancers (2). The detection rates for pulmonary nodules and early lung cancer have increased with the extensive application of low-dose chest computed tomography (CT) (3, 4). Pulmonary nodules can be classified according to CT findings into pure ground glass nodules, solid nodules, and part-solid nodules (PSNs).
Spread through air spaces (STAS) was recognized as an invasion mode of lung adenocarcinoma by the World Health Organization (WHO) in 2015. STAS refers to the spreading of micropapillary clusters, solid nests, or single cells beyond the edge of the tumor into the air space in the surrounding lung parenchyma (5). Lung adenocarcinoma with STAS shows a poor prognosis, with reduced overall survival and disease-free survival rates (6, 7). In recent years, sublobar resection has been widely used as a minimally invasive surgical method to treat early lung cancer (8, 9). However, lung cancer patients who exhibit STAS after sublobar resection have an increased risk of recurrence (10, 11). STAS serves as an important prognostic factor after sublobar resection for early lung adenocarcinoma, and such tumors may not be suitable for sublobar resection (12, 13). Unfortunately, STAS can only be determined by surgical methods at present, and there are still uncertainties regarding the accuracy of intraoperative frozen sections (14, 15). Therefore, it is very important to determine the status of STAS before operation because it helps clinicians choose the most appropriate surgical approach.
Previous research (16–18) showed that STAS mostly occurs in solid or part-solid nodules, whereas it is rarely observed in pure ground glass nodules. Compared with pure ground glass nodules, PSNs exhibit a high positive of STAS, along with a high invasiveness and a less favorable prognosis. Meanwhile, lung adenocarcinoma presenting as PSN is a special clinical subtype that can show different clinicopathological features from solid tumors (19). Consequently, special attention should be paid to PSNs.
Radiomics analysis using quantitative features extracted from medical images allows precise and detailed evaluation of lesions, including the presence of tumor heterogeneity (20). Several studies (21–24) have used radiomics method to assess STAS status in lung adenocarcinoma, and these have achieved good diagnostic performance. However, their study failed to offer a detailed analysis of lung adenocarcinoma with PSNs. Additionally, because of unclear internal mechanisms that limit transparency and credibility, the application of such models in clinical practice may be restricted (25). Shapley Additive exPlanations (SHAP) is a unified structure based on additive feature mapping techniques that consider the predictions of complex models (26). It can explain the importance of features and assist in comprehending the function of each feature in making predictions for both the entire dataset and specific samples (27). By combining radiomics and SHAP, it is possible to build a model that explains the prediction in an understandable way (28, 29).
This study aimed to construct and evaluate radiomics signatures derived from various areas of the nodule (ground-glass, solid, gross, and perinodular) for predicting STAS status in lung adenocarcinoma with PSNs. Moreover, we used the SHAP method to illustrate the decision-making process of the models and gain insights into the connections between radiomic features and STAS.
Methods
Patients
The Ethics Committee of our institution authorized this retrospective study (No. QYFY WZLL 29455) and waived the need for informed consent. Patients with lung adenocarcinoma who had undergone surgical resection in three hospitals between December 2019 and April 2024 were retrospectively collected. The inclusion criteria included. (1) pathology-confirmed invasive lung adenocarcinoma; (2) thin-slice CT examination (slice thickness ≤ 1.25 mm) performed within 1 month before operation; (3) tumor that was PSN with a maximum diameter ≤ 3 cm; and (4) clinicopathological data were complete. The exclusion criteria included: (1) patients with multiple lesions; (2) patients who received preoperative anti-tumor treatment (immunotherapy, chemotherapy, or radiotherapy); (3)patients who had previously been diagnosed with other malignant tumors; and (4) patients with low-quality image.
In total, 333 patients were collected (Figure 1). Patients were separated into a training group (n=223, center 1) and an external test group (n=110, centers 2 and 3).
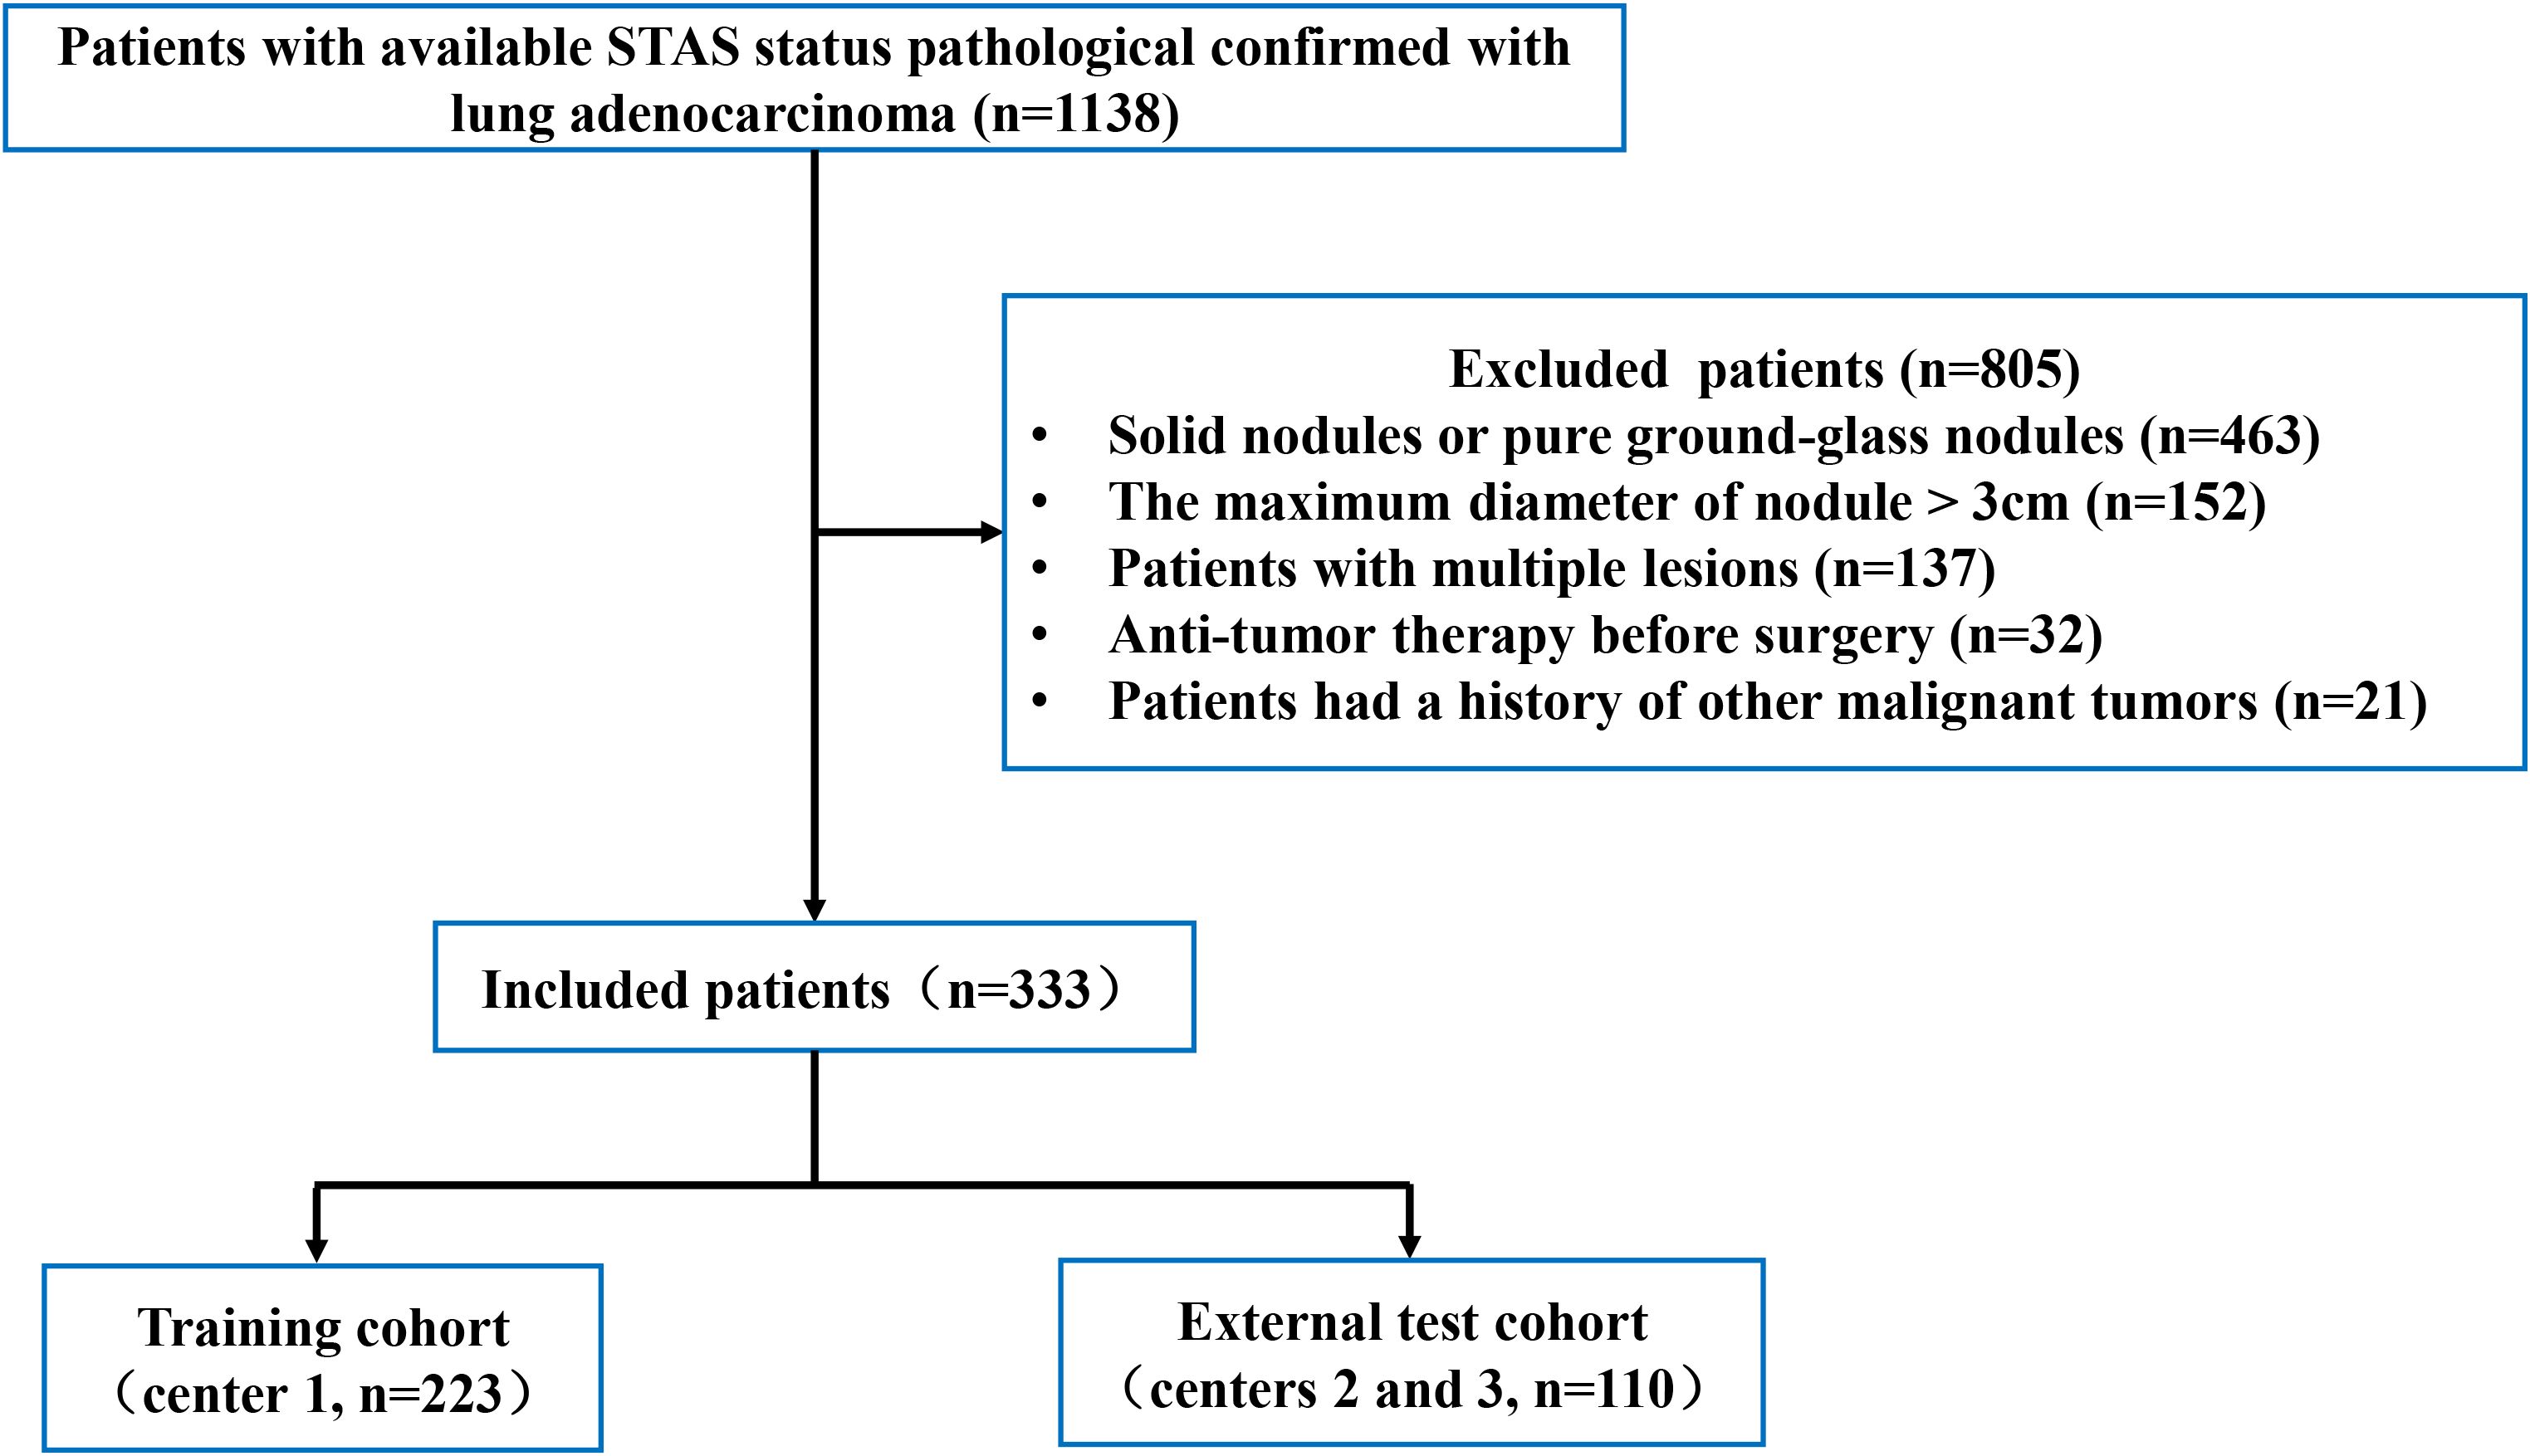
Figure 1. The process used to select patients is shown in the flowchart. STAS, spread through air spaces.
Histopathologic evaluation
Two pathologists, unaware of the clinical outcomes for the patients, independently evaluated the tumor slides. Where any discrepancies, a consensus was achieved through discussion. According to the WHO classification, STAS refers to the existence of tumor cells in the lung air spaces beyond the margin of the main tumor. It has three main forms: (1) single cells, multiple separate and non-continuous single cells occupy the air spaces; (2) solid nests, where the solid component of the tumor fills the air spaces; and (3) micropapillary clusters, micro-nipple structures without central fibrovascular cores fill the air spaces (10, 30).
Image acquisition
Supplementary Table S1 outlines the parameters used for CT scanning. Unenhanced CT was acquired using a slice thickness of ≤ 1.25 mm.
Clinical data collection and CT image evaluation
The clinical characteristics and CT findings of patients were analyzed, including gender, age, smoking history, consolidation/tumor ratio (CTR), maximum solid component diameter (Dsolid), maximum tumor diameter (Dmax), clinical T stage, carcinoembryonic antigen (CEA) level, nodule location, boundary, spiculation, lobulation, vascular convergence, pleural indentation, air bronchogram, and vacuole. Two experienced radiologists evaluated the CT images of the lesions. They did not know the pathological results of the lesions before evaluation and reached a consensus through discussion when there were differences in their evaluation results.
Image segmentation and extraction of radiomic features
An experienced radiologist manually delineated the regions of interest (ROIs) using 3D-slicer software (version 5.2.1, https://www.slicer.org). The gross nodule region (GNR), solid region (SR), ground-glass opacity region (GGR), and perinodular region (PR) were delineated as shown in Figure 2, and three-dimensional ROIs of the different nodule regions were generated. The segmentation steps were as follows: (1) the GNR was delineated around the edge of the nodule using the lung window (window level, -700 HU; window width, 1200 HU), excluding large bronchi and vessels as much as possible; (2) the SR was identified within the GNR by applying a thresholding method (> −50HU); (3) the GGR was obtained by subtracting the SR from the GNR; and (4) the PR was defined as extending 5 mm from the edge of the nodule to the periphery, excluding nearby soft tissues such as the mediastinum or chest wall (31).
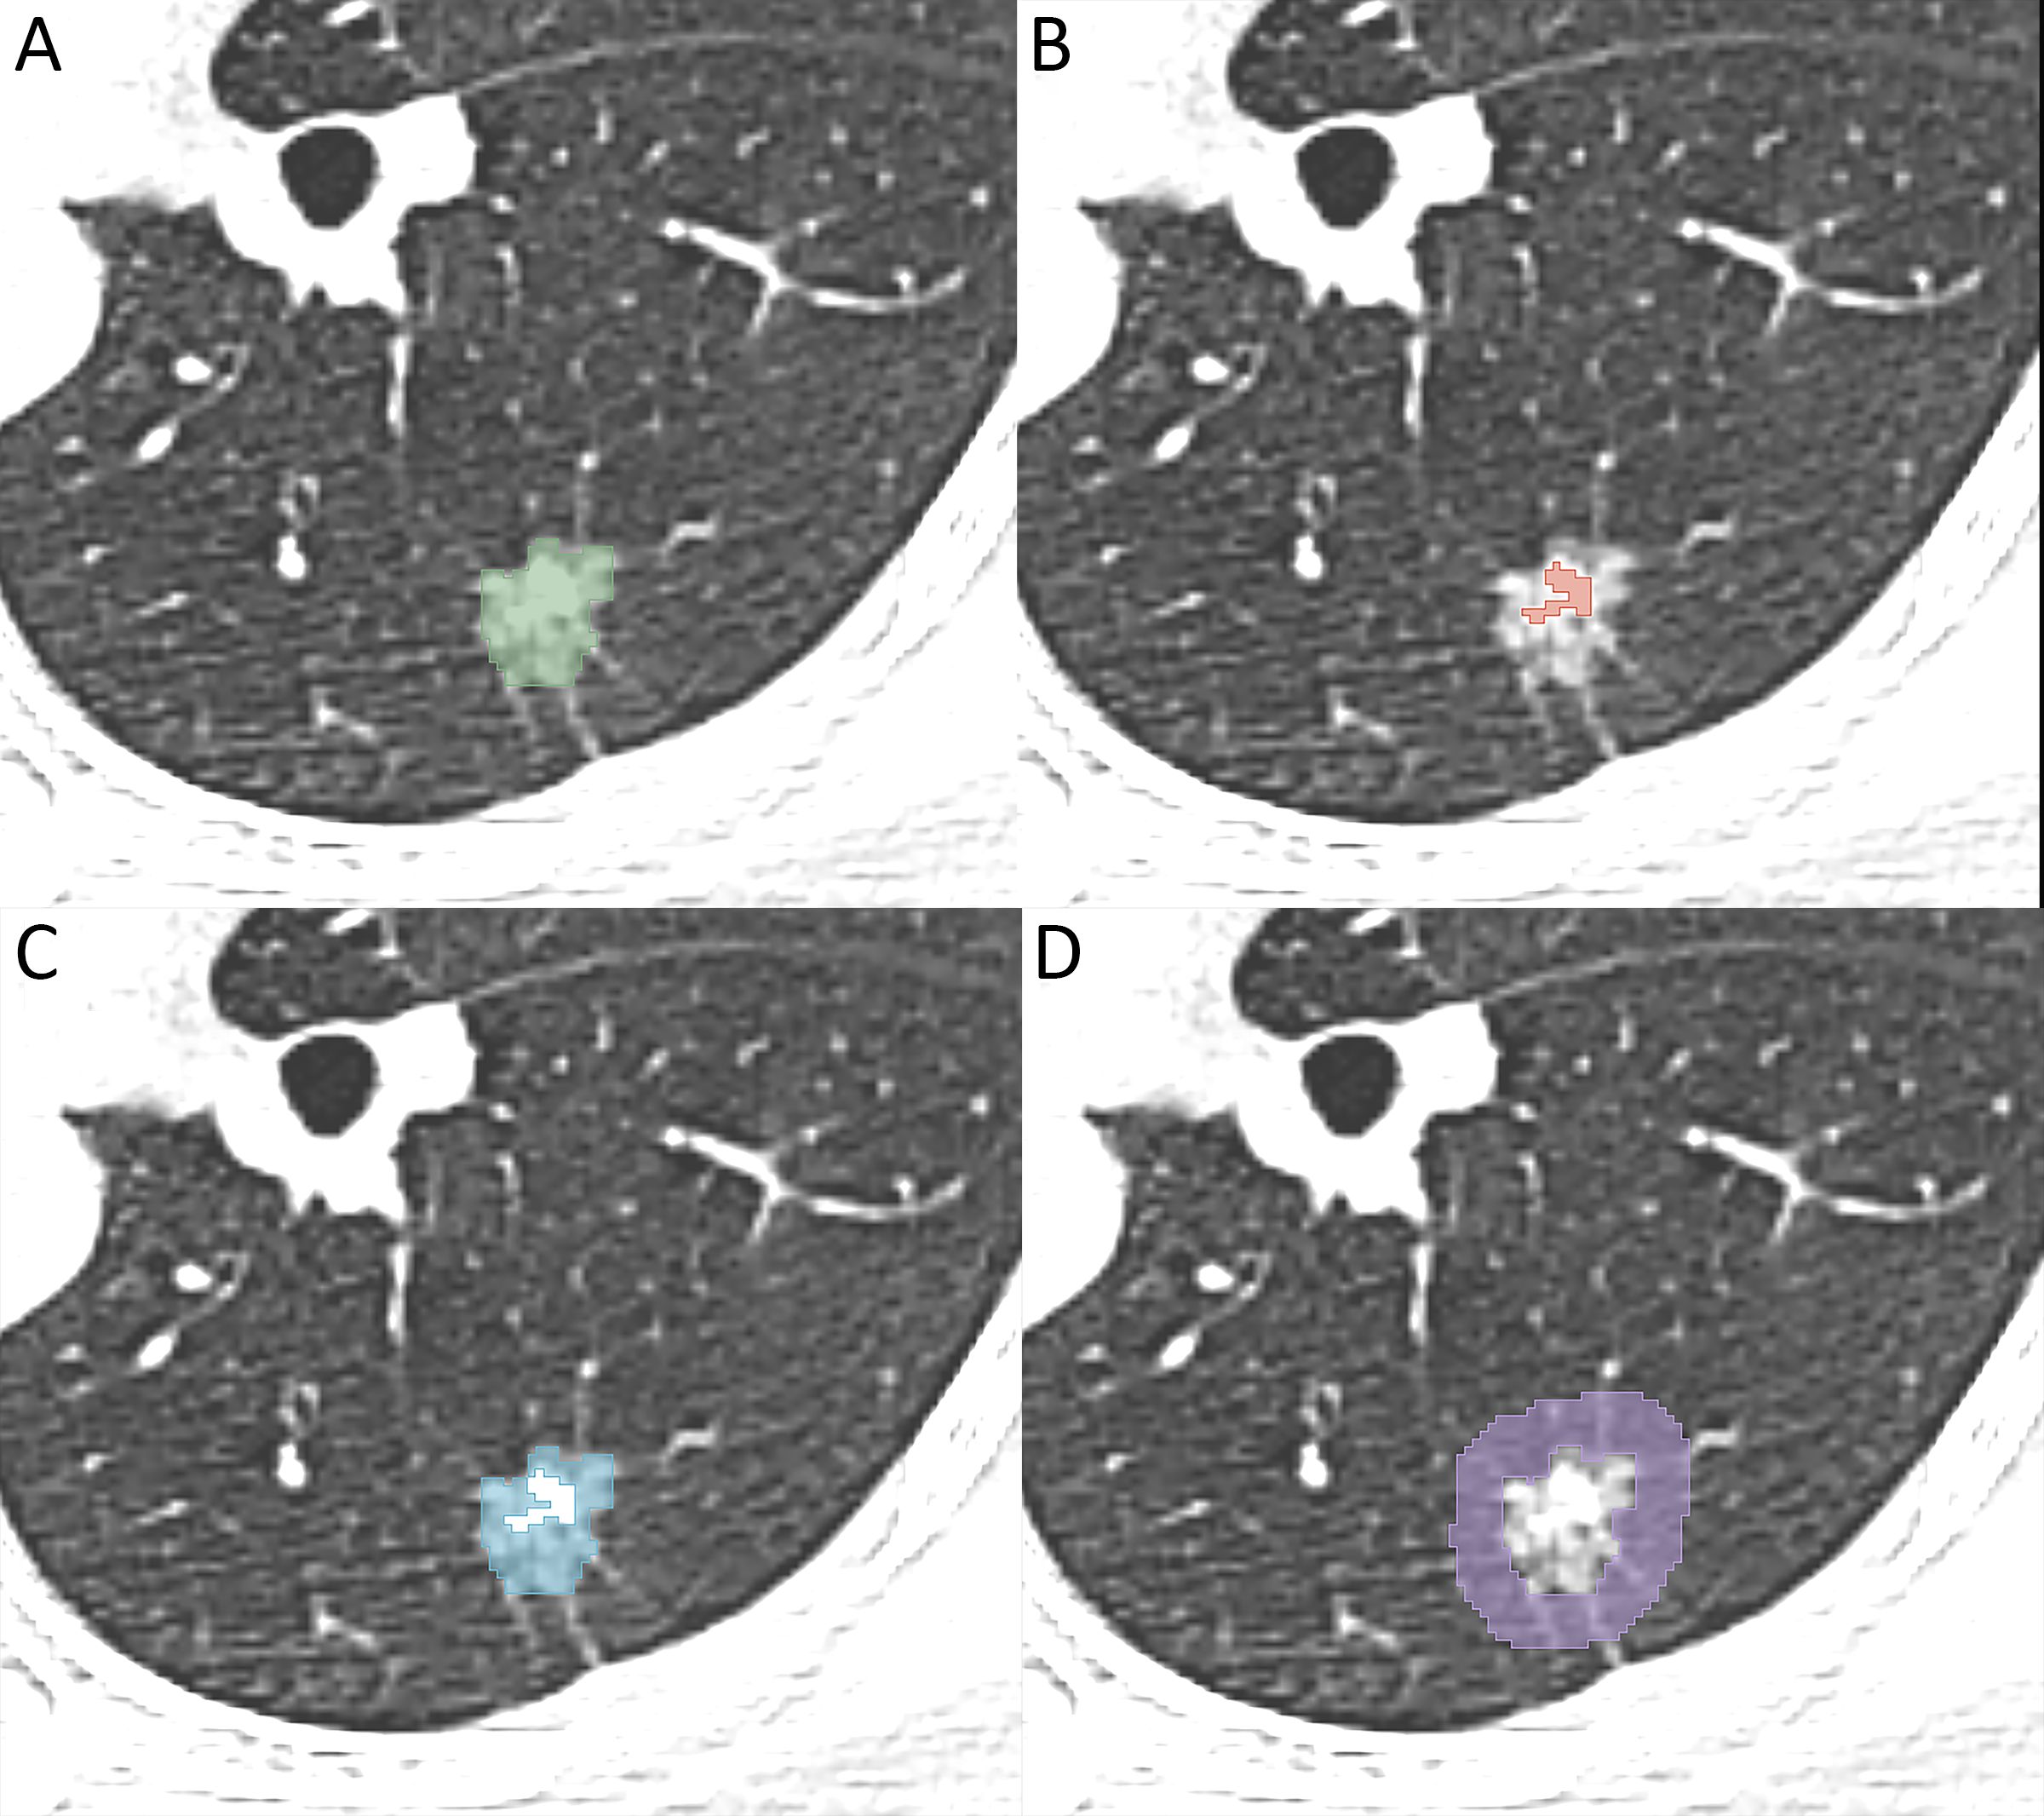
Figure 2. Image illustrates segmentation of different region of interest. (A) the gross nodule region, (B) the solid region, (C) the ground-glass opacity region, (D) the perinodular region.
Thirty lesions were randomly selected and delineated two weeks later by the same radiologist and another radiologist to allow intra- and inter-observer correlation coefficients (ICCs) to be computed. The radiologists were blinded to clinical and pathological data during the segmentation process.
Pyradiomics software (version 3.1.0) was used to extract radiomic features from the ROIs. To mitigate the impact of different CT spatial resolutions, all images were resampled to a voxel size of 1 × 1 × 1 mm. Finally, each ROI yielded a total of 1316 features, including a suite of texture features, 14 shape-based features, and 252 first-order features. The texture features consisted of 70 neighboring grey tone difference matrix (NGTDM) features, 196 grey-level dependence matrix (GLDM) features, 224 grey-level size zone matrix (GLSZM) features, 336 gray-level co-occurrence matrix (GLCM) features, and 224 grey-level run-length matrix (GLRLM) features.
Selection of radiomic features and model construction
Features with ICCs > 0.75 were chosen for further analyses. All features were processed with Z-score normalization, and the combat compensation technique was employed to adjust those radiomic features that were influenced by batch effects resulting from different devices (32). The Spearman rank test was used to evaluate the correlation between features, and when the linear correlation coefficient was > 0.80, features were considered redundant and removed. Least absolute shrinkage and selection operator (LASSO) regression was then used to identify the features with the most predictive value. A total of 3 machine learning classifiers were used to construct models for the radiomic features from different regions of the nodule (GNR, SR, GGR, PR). These three classifiers were: support vector machine (SVM), light gradient boosting machine (LightGBM), logistic regression (LR). The classifiers were trained on the training set using a 10-fold cross-validation method.
Clinical model construction
Univariate logistic regression analysis was used to identify variables associated with STAS status. Variables with P < 0.05 were further analyzed using multivariate logistic regression analysis. Variables yielding P < 0.05 in the multivariate analysis were deemed independent predictors of STAS. Using these significant variables, a clinical model was developed.
Interpretability of the model using SHAP
SHAP technology was used to clarify and analyze the radiomic features applied to the radiomics models. This approach allows the significance of each feature in a machine learning model to be represented and provides a comprehensive explanation of how each feature affects the output result, either raising or lowering it.
The SHAP summary plot can effectively visualize and interpret the significance of features in relation to the predictions of a model, with features being listed top-down on the basis of their importance. Compared with the bottom features, the top features exhibit greater contributions to the model and possess higher predictive power. The SHAP values were computed for the chosen radiomic features contained in the radiomics model showing the best performance. The SHAP value of a specific feature from an individual patient is represented by a dot, and these dots are stacked vertically and arranged horizontally to illustrate the density of identical SHAP values. Subsequently, each point is assigned a color based on the feature’s value. The SHAP force plot enables the evaluation of a single patient to be interpreted. The percentage contribution of a specific feature to the SHAP value is represented by the length of the arrow. Positive (red) or negative (blue) contributions are indicated by the color of the arrow. Figure 3 illustrates the workflow of the study.
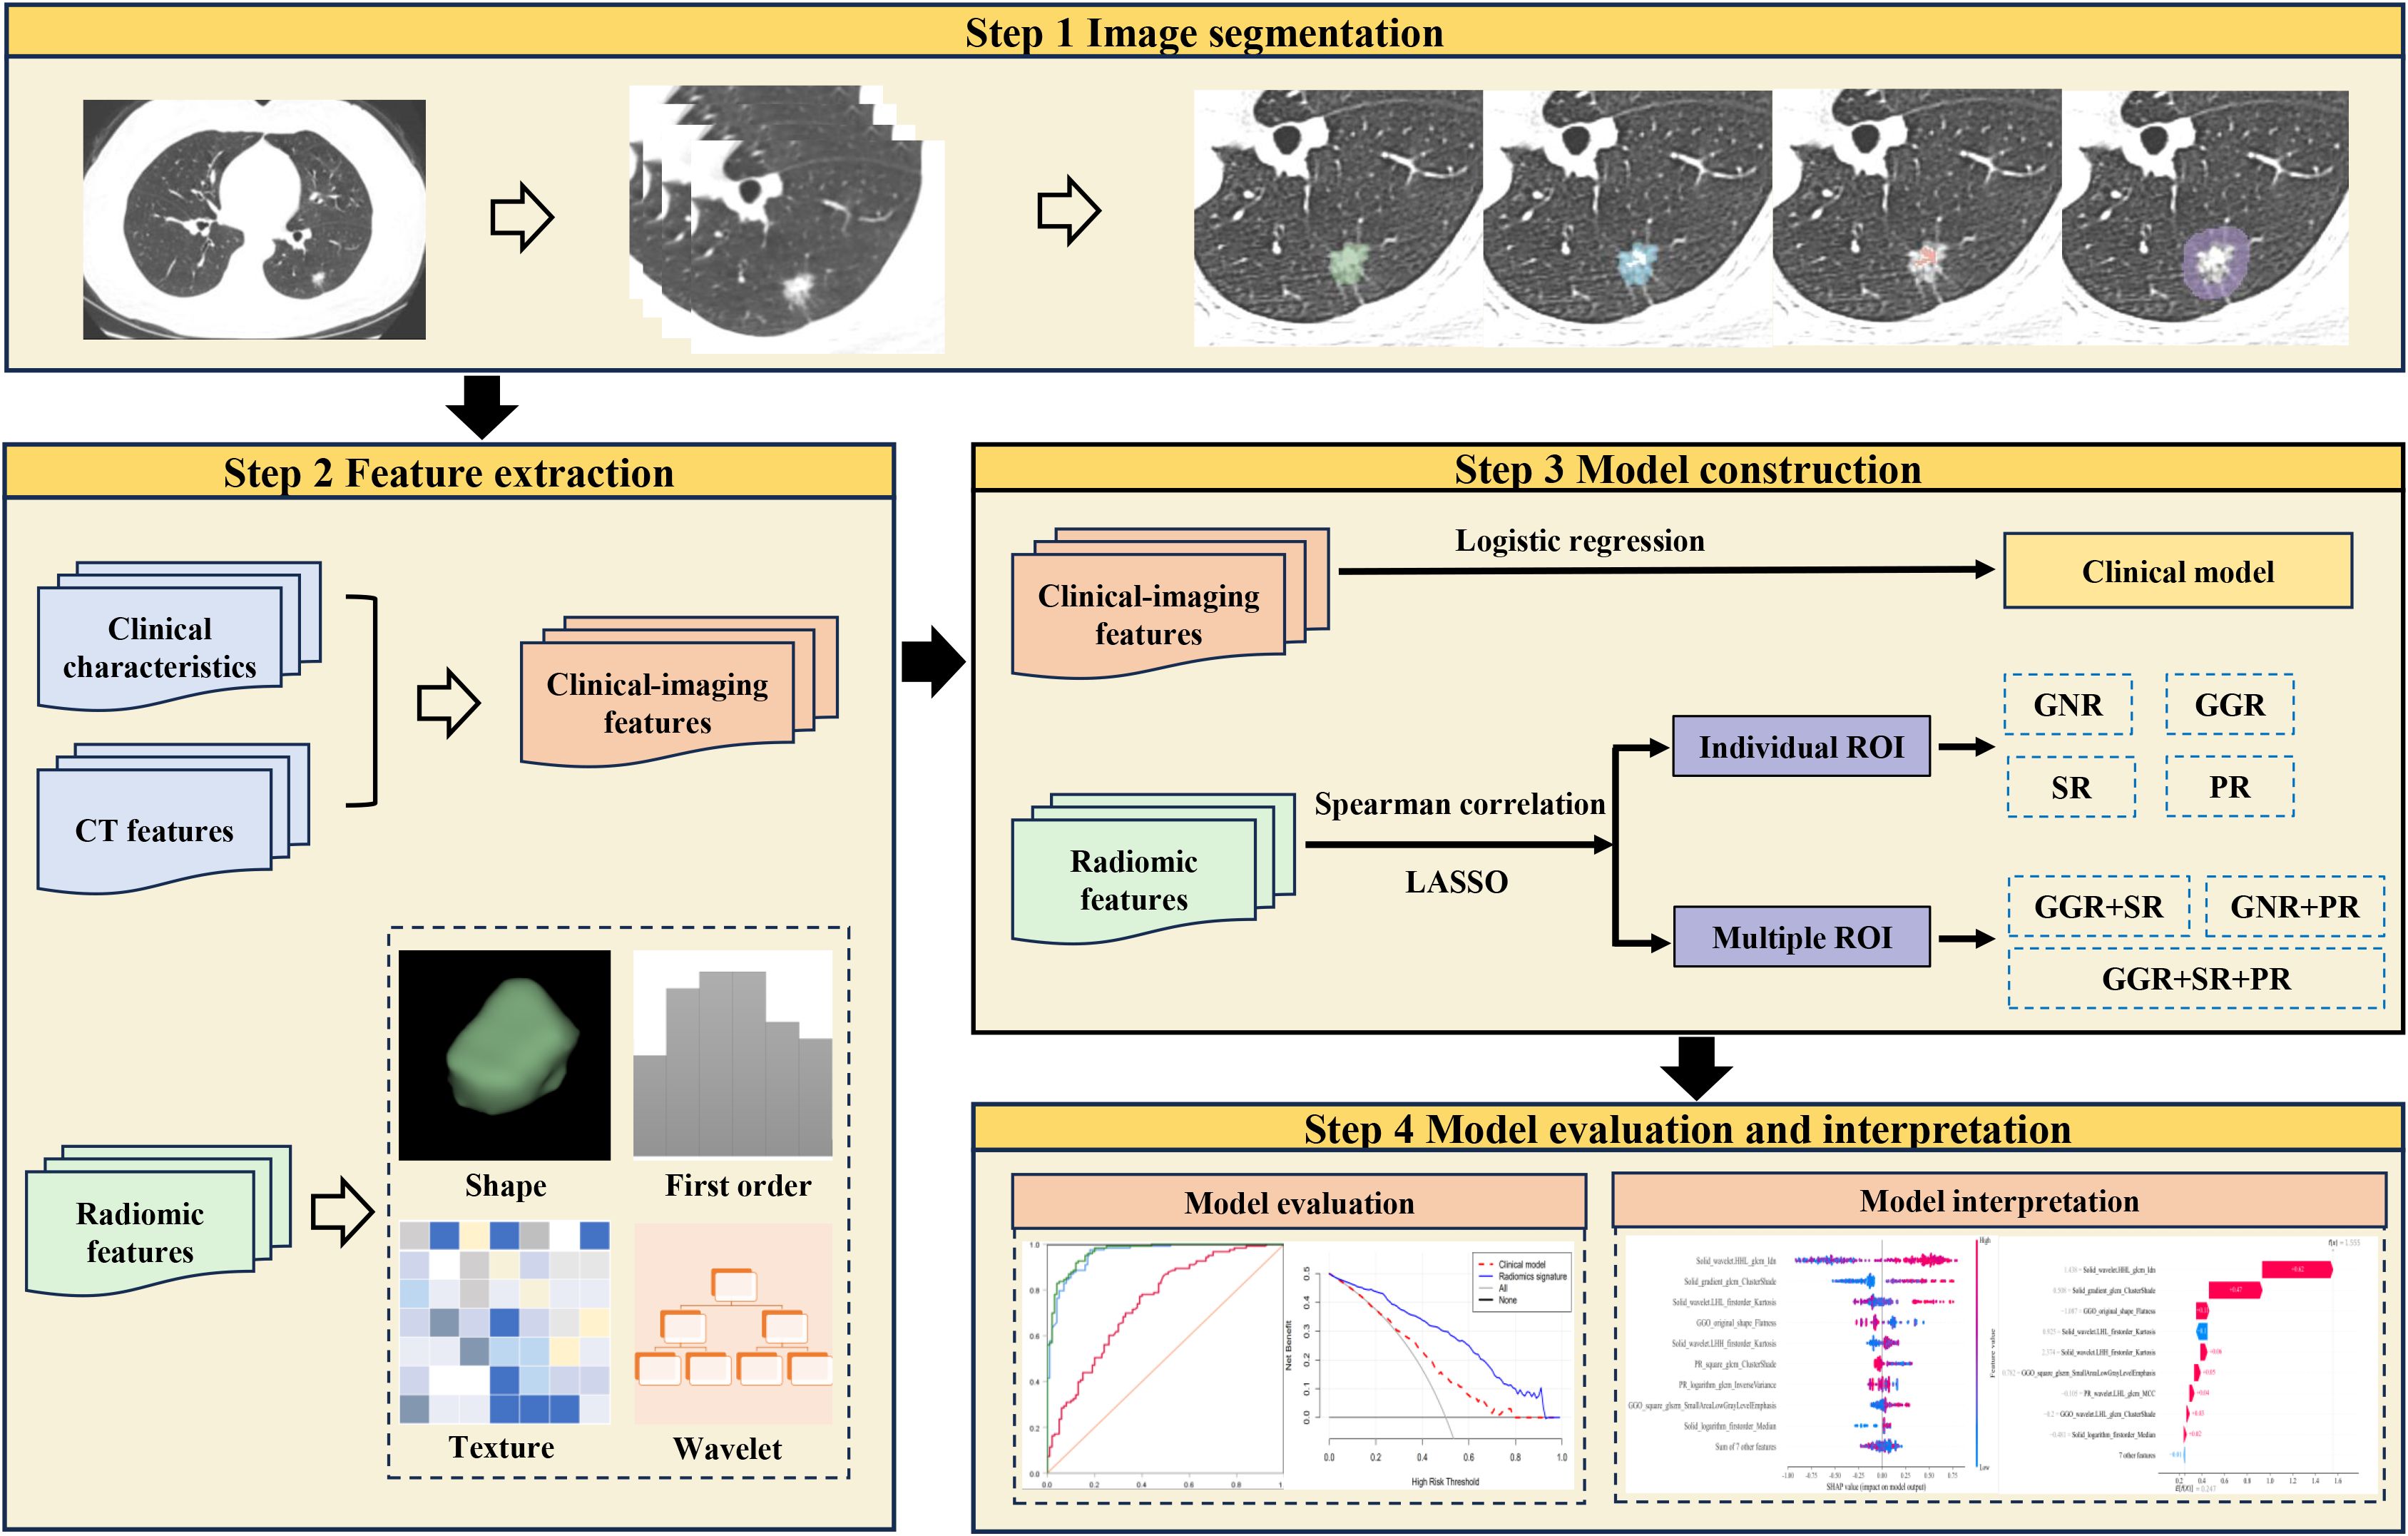
Figure 3. Flowchart of the study.
Statistical analysis
Data were analyzed using SPSS software (version 26.0, IBM) and R software (version 4.3.1, www.r-project.org). Python (3.9.7, www.python.org) was used to build the machine learning models. The Kolmogorov-Smirnov test was used to test continuous data for normality. Comparative data analysis was conducted using the Mann-Whitney U test for non-normally distributed continuous data, independent samples t-tests was used for normally distributed continuous data, and Fisher’s exact test or the chi-square test were used for categorical variables.
The ability of the models to predict STAS status was assessed using the receiver operating characteristics (ROC) curve and the area under the curve (AUC), with a 95% confidence interval (CI) provided. The AUC values were compared between the best-performing model and the other models using the DeLong test. The clinical utility of the models was assessed using decision curve analysis (DCA). A value of P < 0.05 was considered statistically significant.
Results
Clinical and CT characteristics
Table 1 provides details on the clinical and CT features of the patients. Among 333 patients with lung adenocarcinoma, 152 cases were STAS-positive, and 181 were STAS-negative. There were 210 women and 123 men, ranging in age from 29 to 83 years.
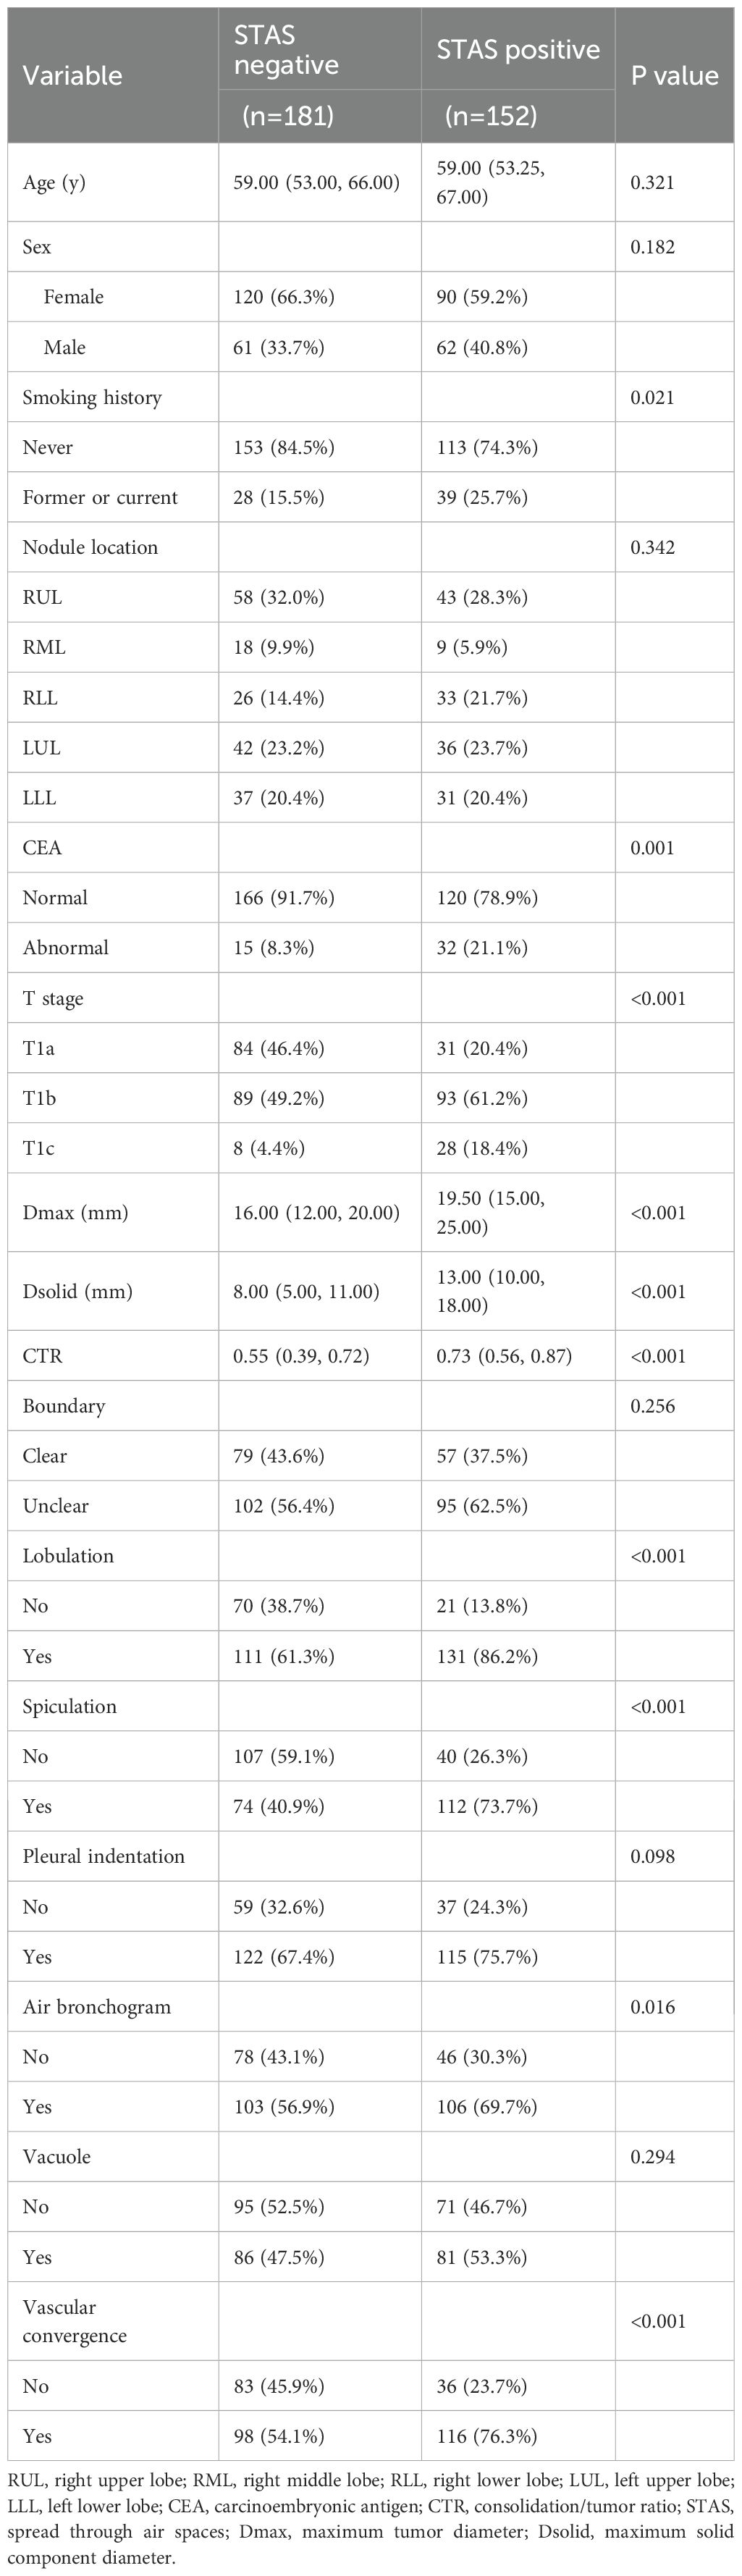
Table 1. Clinical and CT characteristics of patients.
Statistically significant differences were observed in smoking history, CEA, T stage, CTR, Dsolid, Dmax, lobulation, spiculation, air bronchogram, and vascular convergence between the STAS-positive and STAS-negative groups.
Construction of the clinical model
When applied to the training set, the univariate logistic regression analysis demonstrated that risk factors predicting STAS in lung adenocarcinoma included CEA, T stage, Dsolid, Dmax, CTR, boundary, lobulation, spiculation, and vascular convergence (Table 2). Multivariate logistic regression analysis demonstrated that CTR was an independent predictor of STAS, and then the clinical model was built. Finally, the clinical model achieved an AUC value of 0.681 (95% CI: 0.611–0.752) for the training set and 0.622 (95% CI: 0.494–0.750) for the external test set (Table 3).
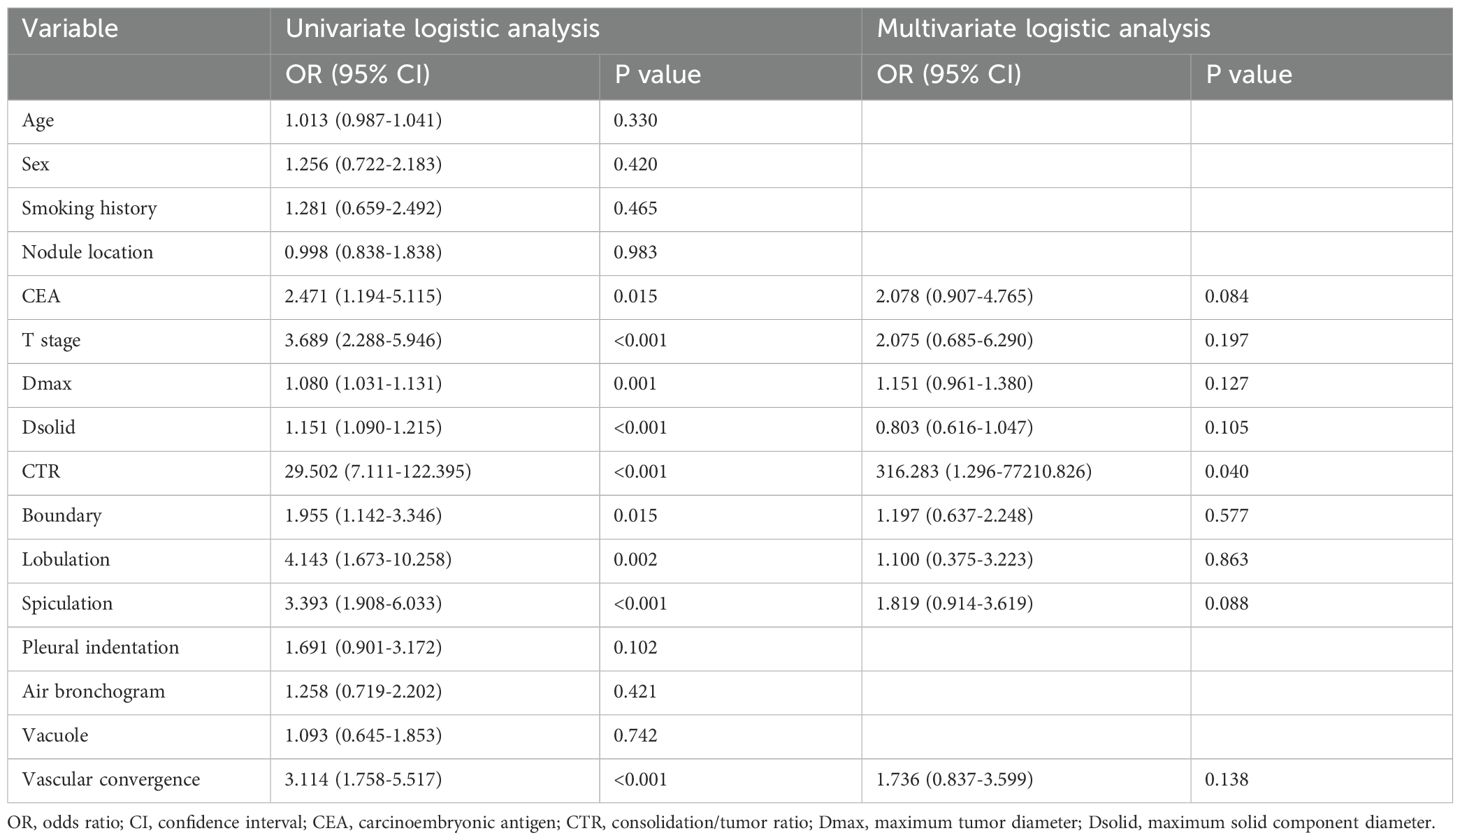
Table 2. Analysis by logistic regression of clinical and CT characteristics.
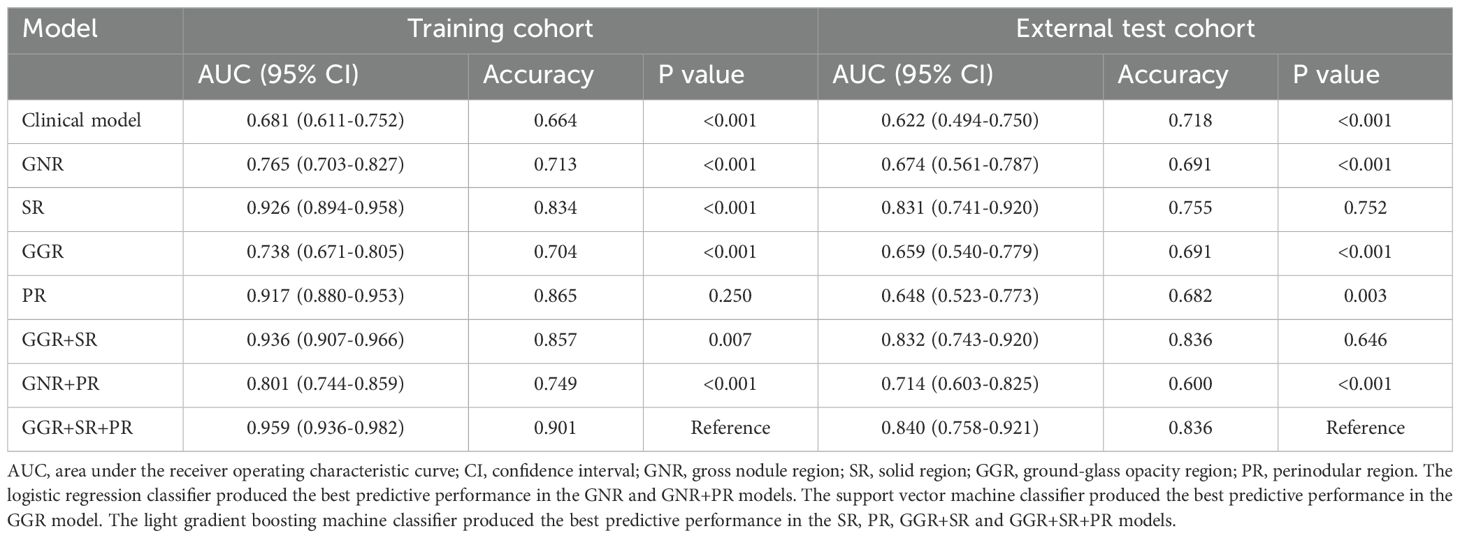
Table 3. Diagnostic value of clinical model and each best machine learning model based on different nodule regions.
Construction of radiomics signatures and evaluation of their performance
For individual ROIs (GNR, GGR, SR and PR), features with ICCs > 0.75 were retained, and further feature selection was carried out in the training group using Spearman correlation coefficients and the LASSO algorithm (Figures 4A, B). We identified 3, 4, 8, and 15 radiomic features with the highest predictive value for GNR, GGR, SR, and PR, respectively. We used the aforementioned 3 machine learning classifiers to establish radiomics signatures for the four ROIs. For both the training and external test groups, the LightGBM classifier model based on SR features (SR model) produced the highest predictive performance, with accuracy values of 0.834 and 0.755, respectively, and AUC values of 0.926 (95% CI: 0.894–0.958) and 0.831 (95% CI: 0.741–0.920) (Table 3). Supplementary Table S2 provides details on the performance of three machine learning classifiers using radiomic features from individual ROIs.
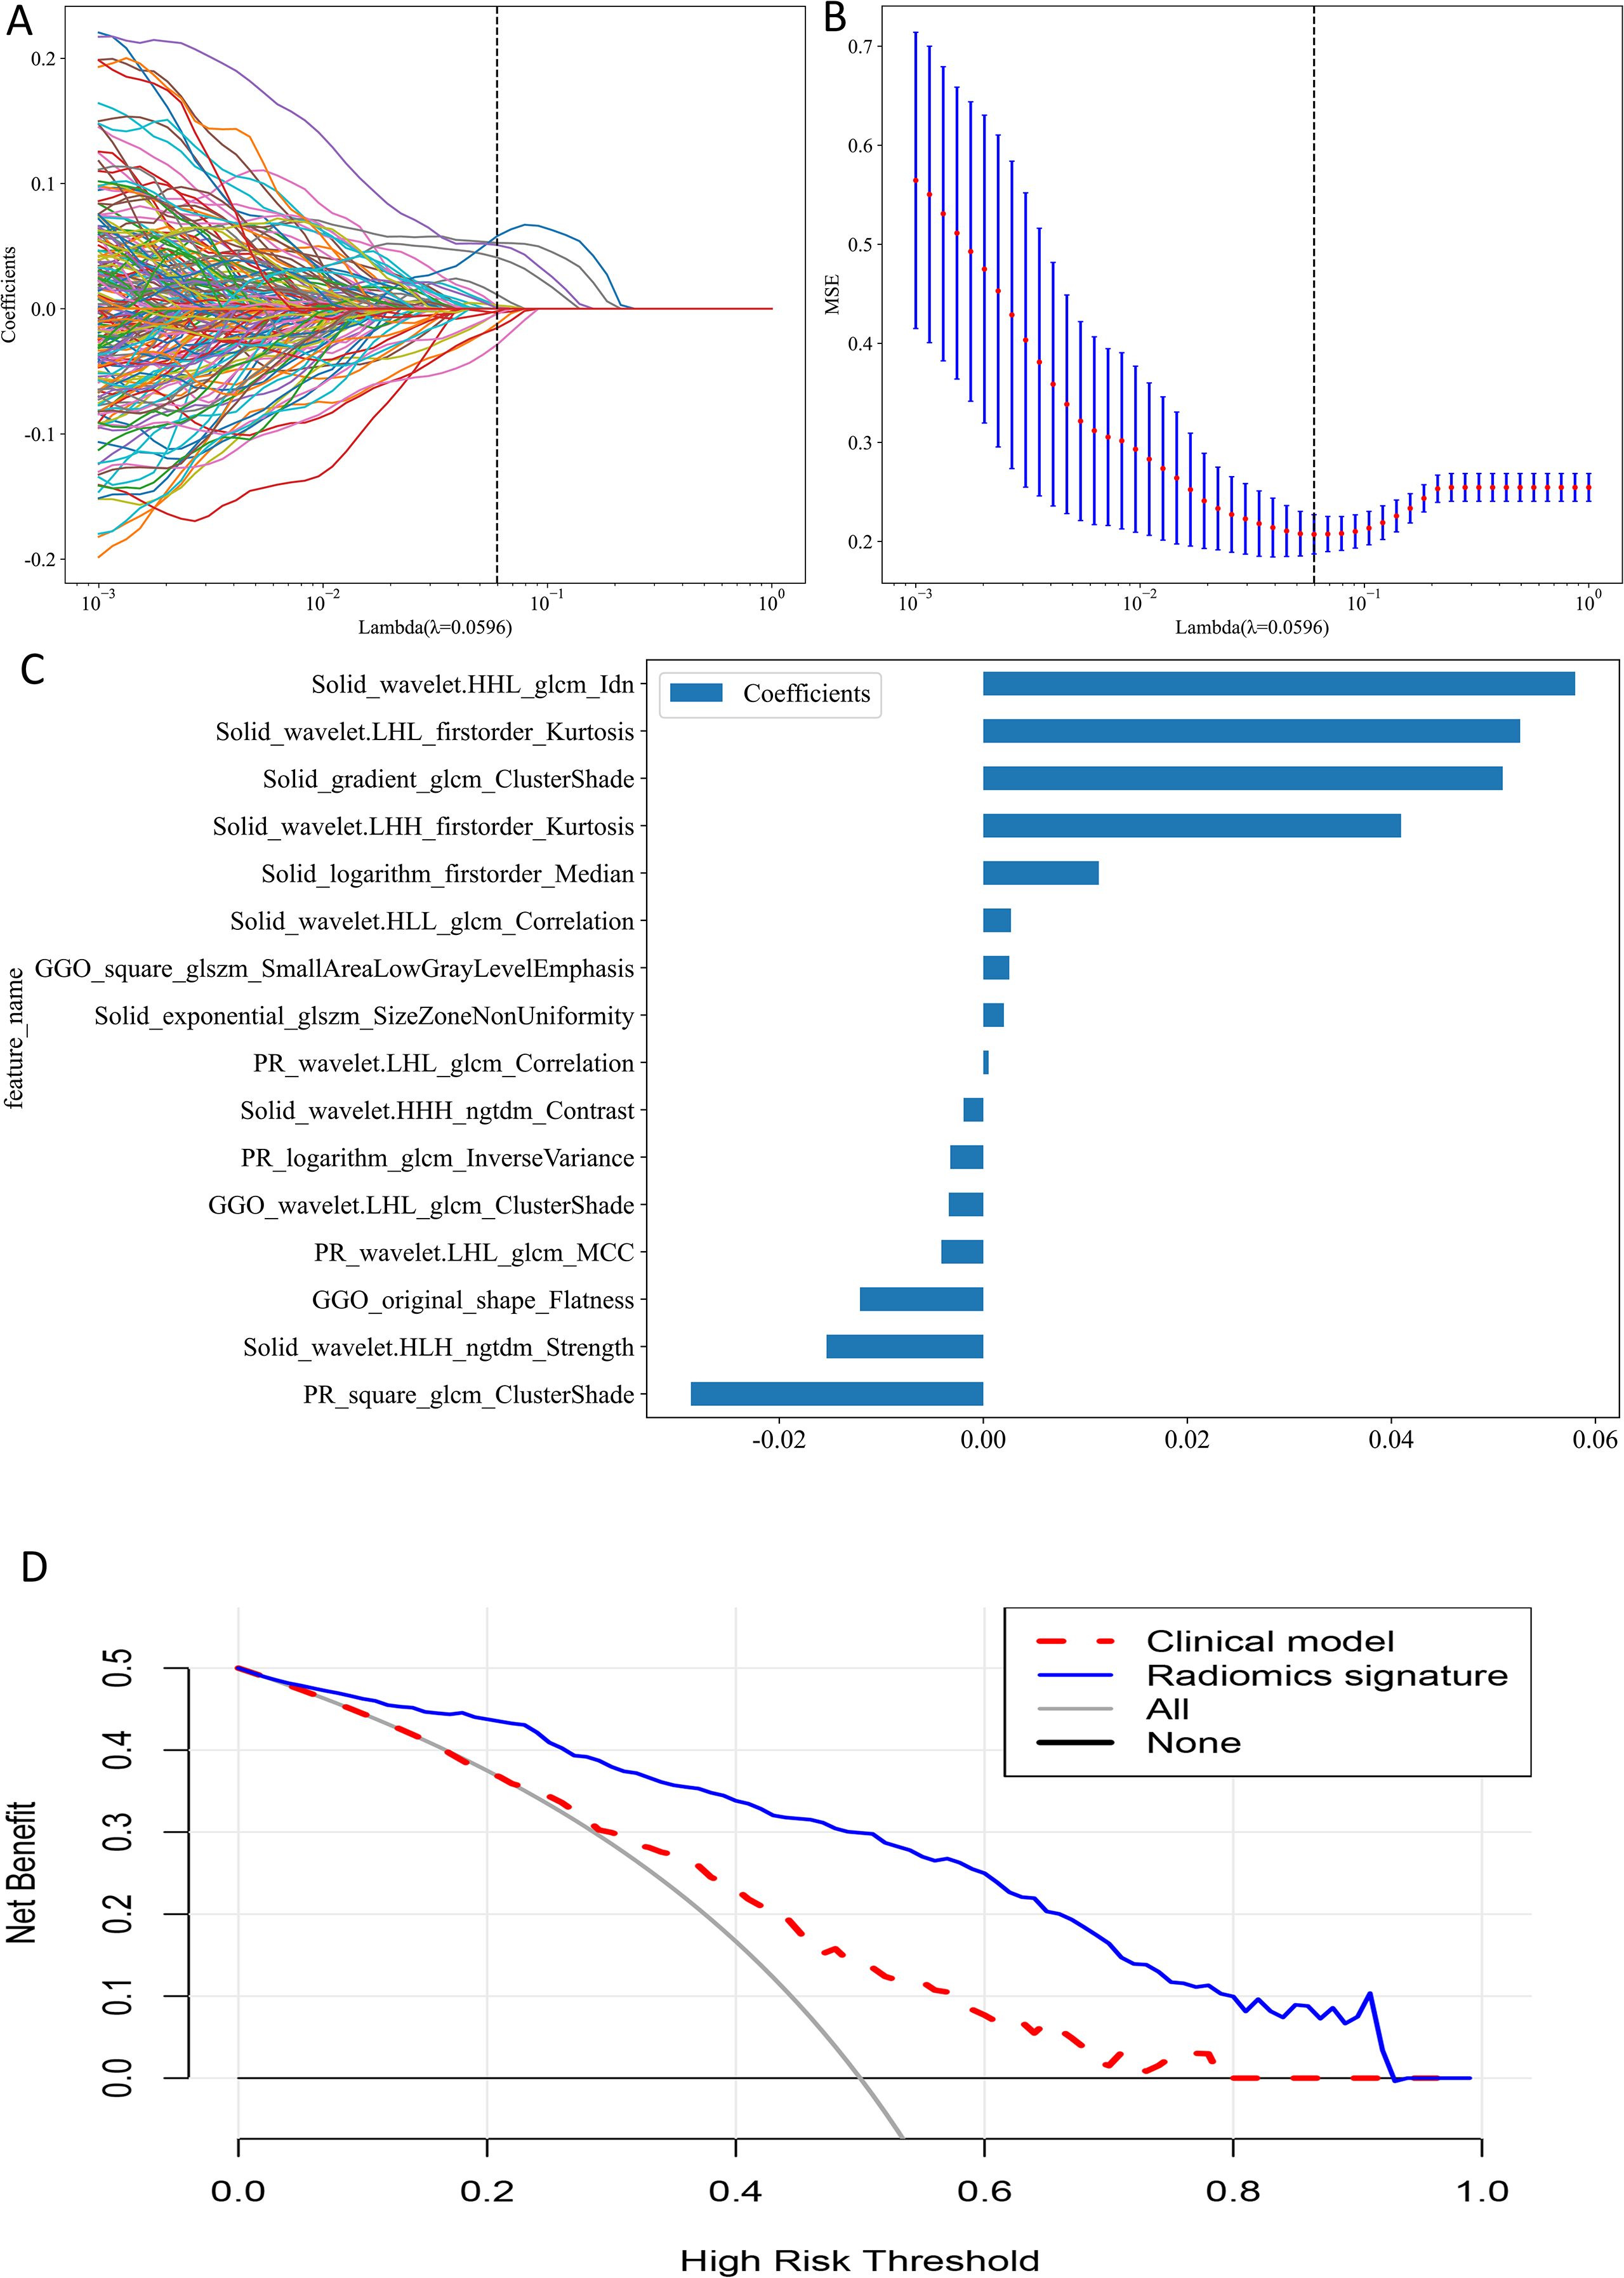
Figure 4. (A) The plot of coefficient profile. (B) The plot of cross-validation. (C) Feature weight histogram in best-performing model. (D) Decision curve analysis.
For analysis of multiple ROIs (GGR+SR, GNR+PR and GGR+SR+PR), we combined the features of the selected ROIs before performing correlation analysis and applying the aforementioned screening methods, choosing 8, 7, and 16 radiomic features to construct the respective multiple ROI-based radiomics signatures. The LightGBM classifier model utilizing combined features from GGR, SR, and PR (GGR+SR+PR model) produced the greatest predictive performance (training group: AUC = 0.959, 95% CI: 0.936–0.982, Accuracy = 0.901; external test group: AUC = 0.840, 95% CI: 0.758–0.921, Accuracy = 0.836) (Table 3). This was the best-performing model and outperformed the SR model. The sixteen radiomic features that formed the best radiomics signature included nine SR features, three GGR features, and four PR features (Figure 4C). Supplementary Table S3 provides details on the performance of three machine learning classifiers using radiomic features from multiple ROIs.
Model performance comparison
The GGR+SR+PR model did not demonstrate a significant difference in AUC value from the GGR+SR model (P = 0.646) or SR model (P = 0.752) in the external test group. The AUC value of the GGR+SR+PR model was significantly superior to that of all other models, as detailed in Table 3. The DCA presented in Figure 4D shows that the GGR+SR+PR model achieved greater net benefit within more threshold probabilities than did the clinical model.
Model interpretability with SHAP
In Figure 5, it can be observed that wavelet-HHL_glcm_Idn from SR played a vital role in the best radiomics model’s differentiation of STAS status. The color map indicates a positive correlation between the SHAP value of this feature and the model’s output. For the individual sample predictions, we randomly chose two patients to make the force plot (Figure 6). Each forecast began with a base value of 0.247, representing the average SHAP value of all predictions. In Figure 6A, the SHAP value of the patient is 1.65, which exceeds the base value and results in a prediction of positive for STAS. Conversely, in Figure 6B, the patient’s SHAP value was −1.37, suggesting a prediction of STAS negative.
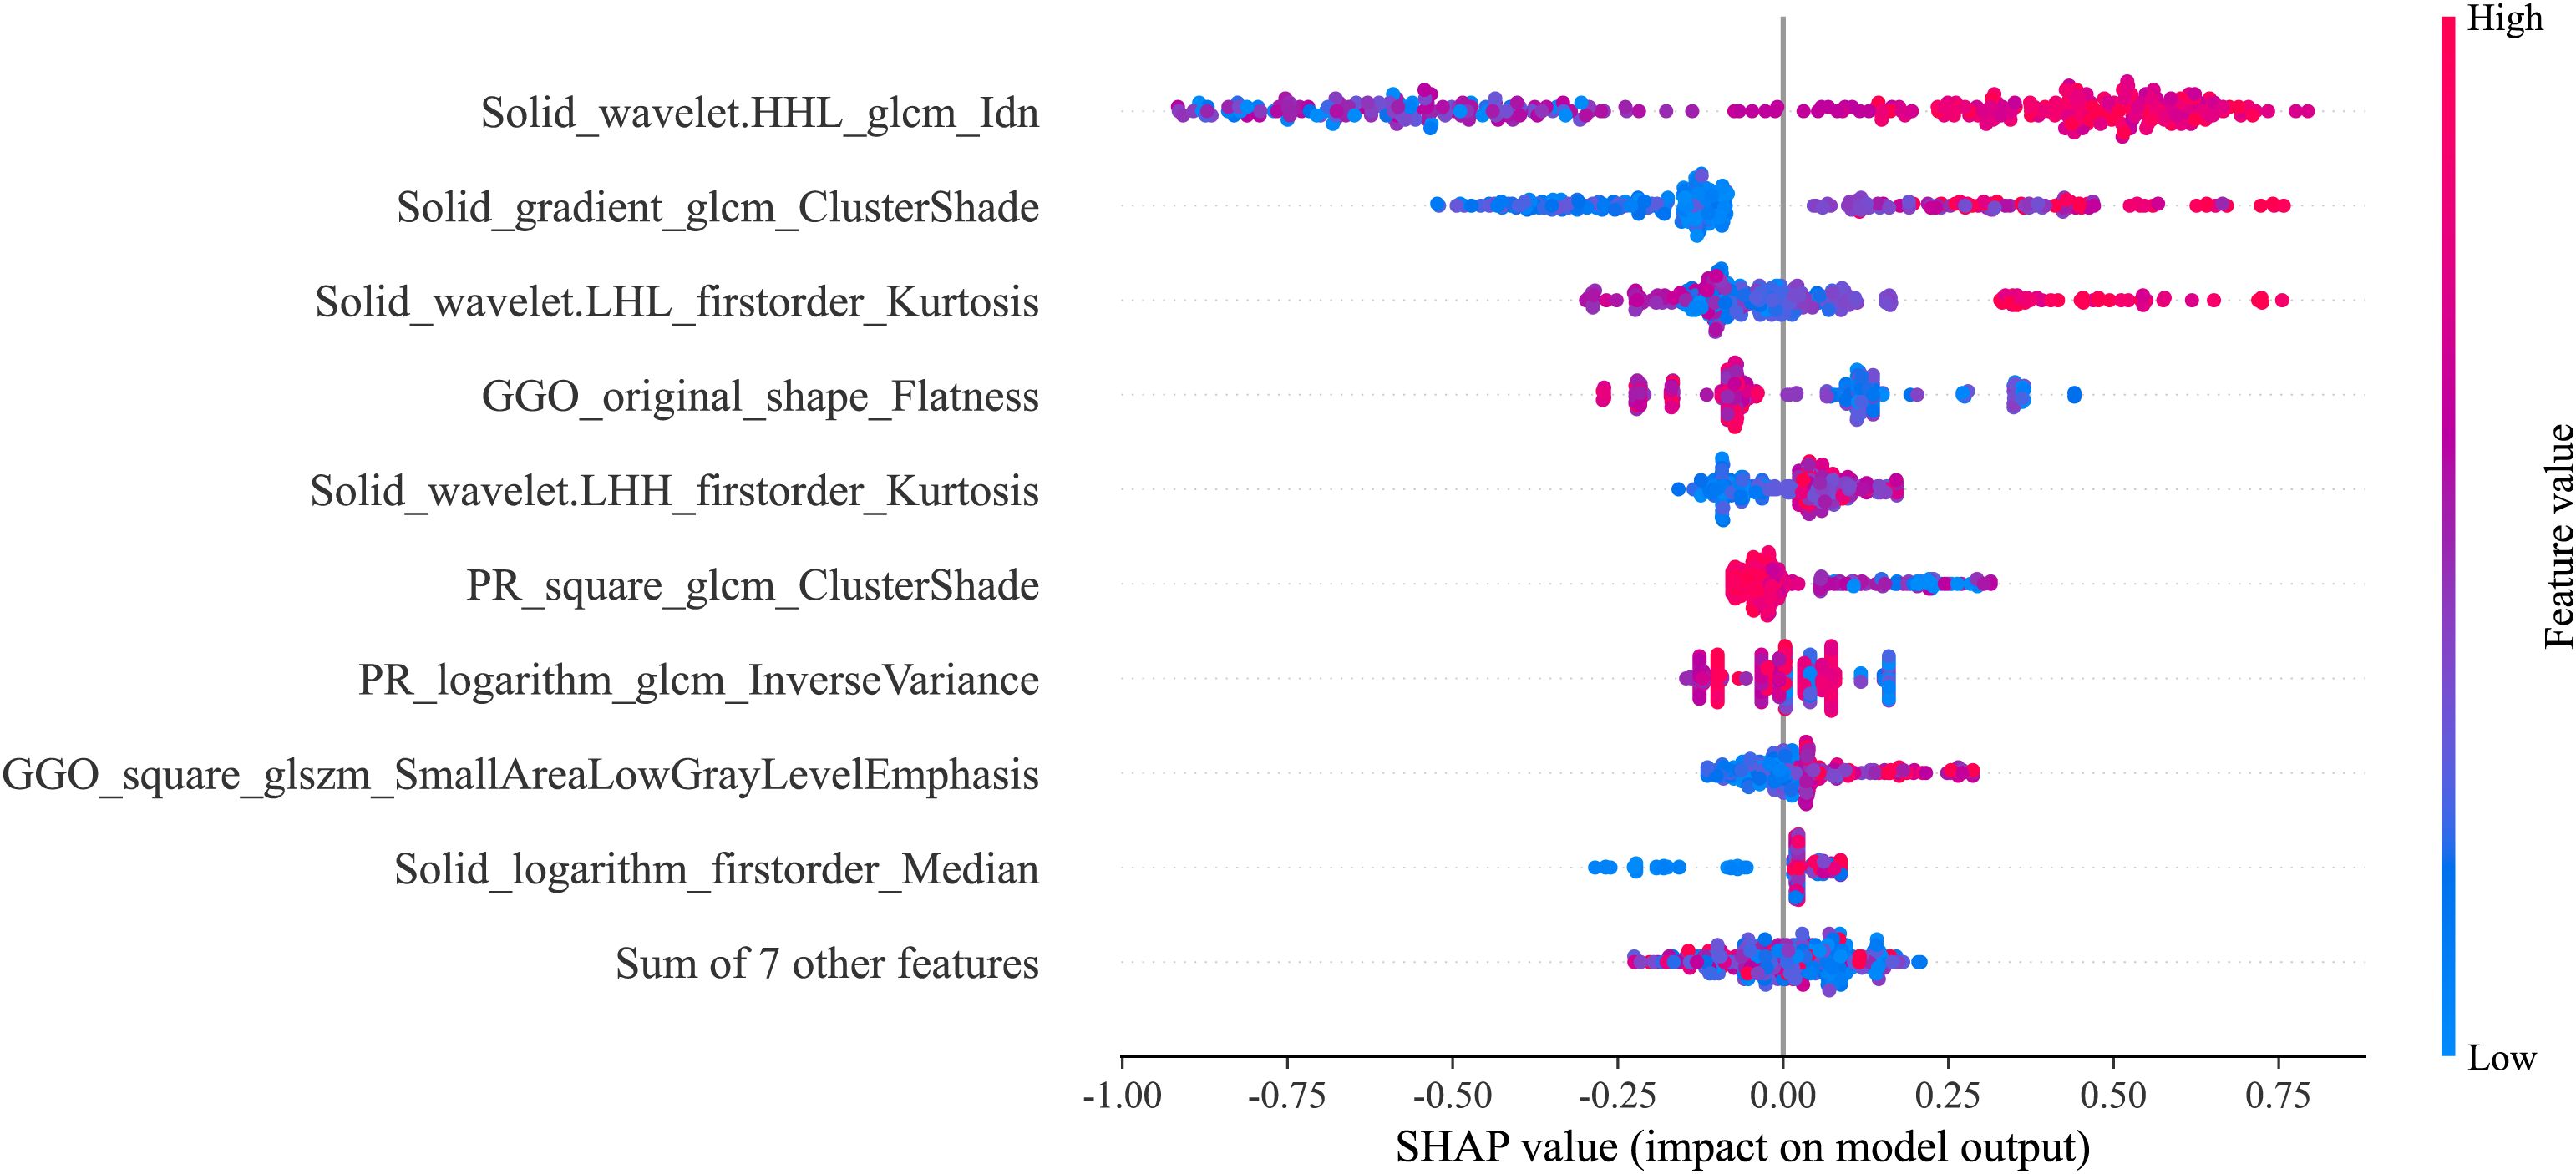
Figure 5. SHAP summary plot of best-performing model.
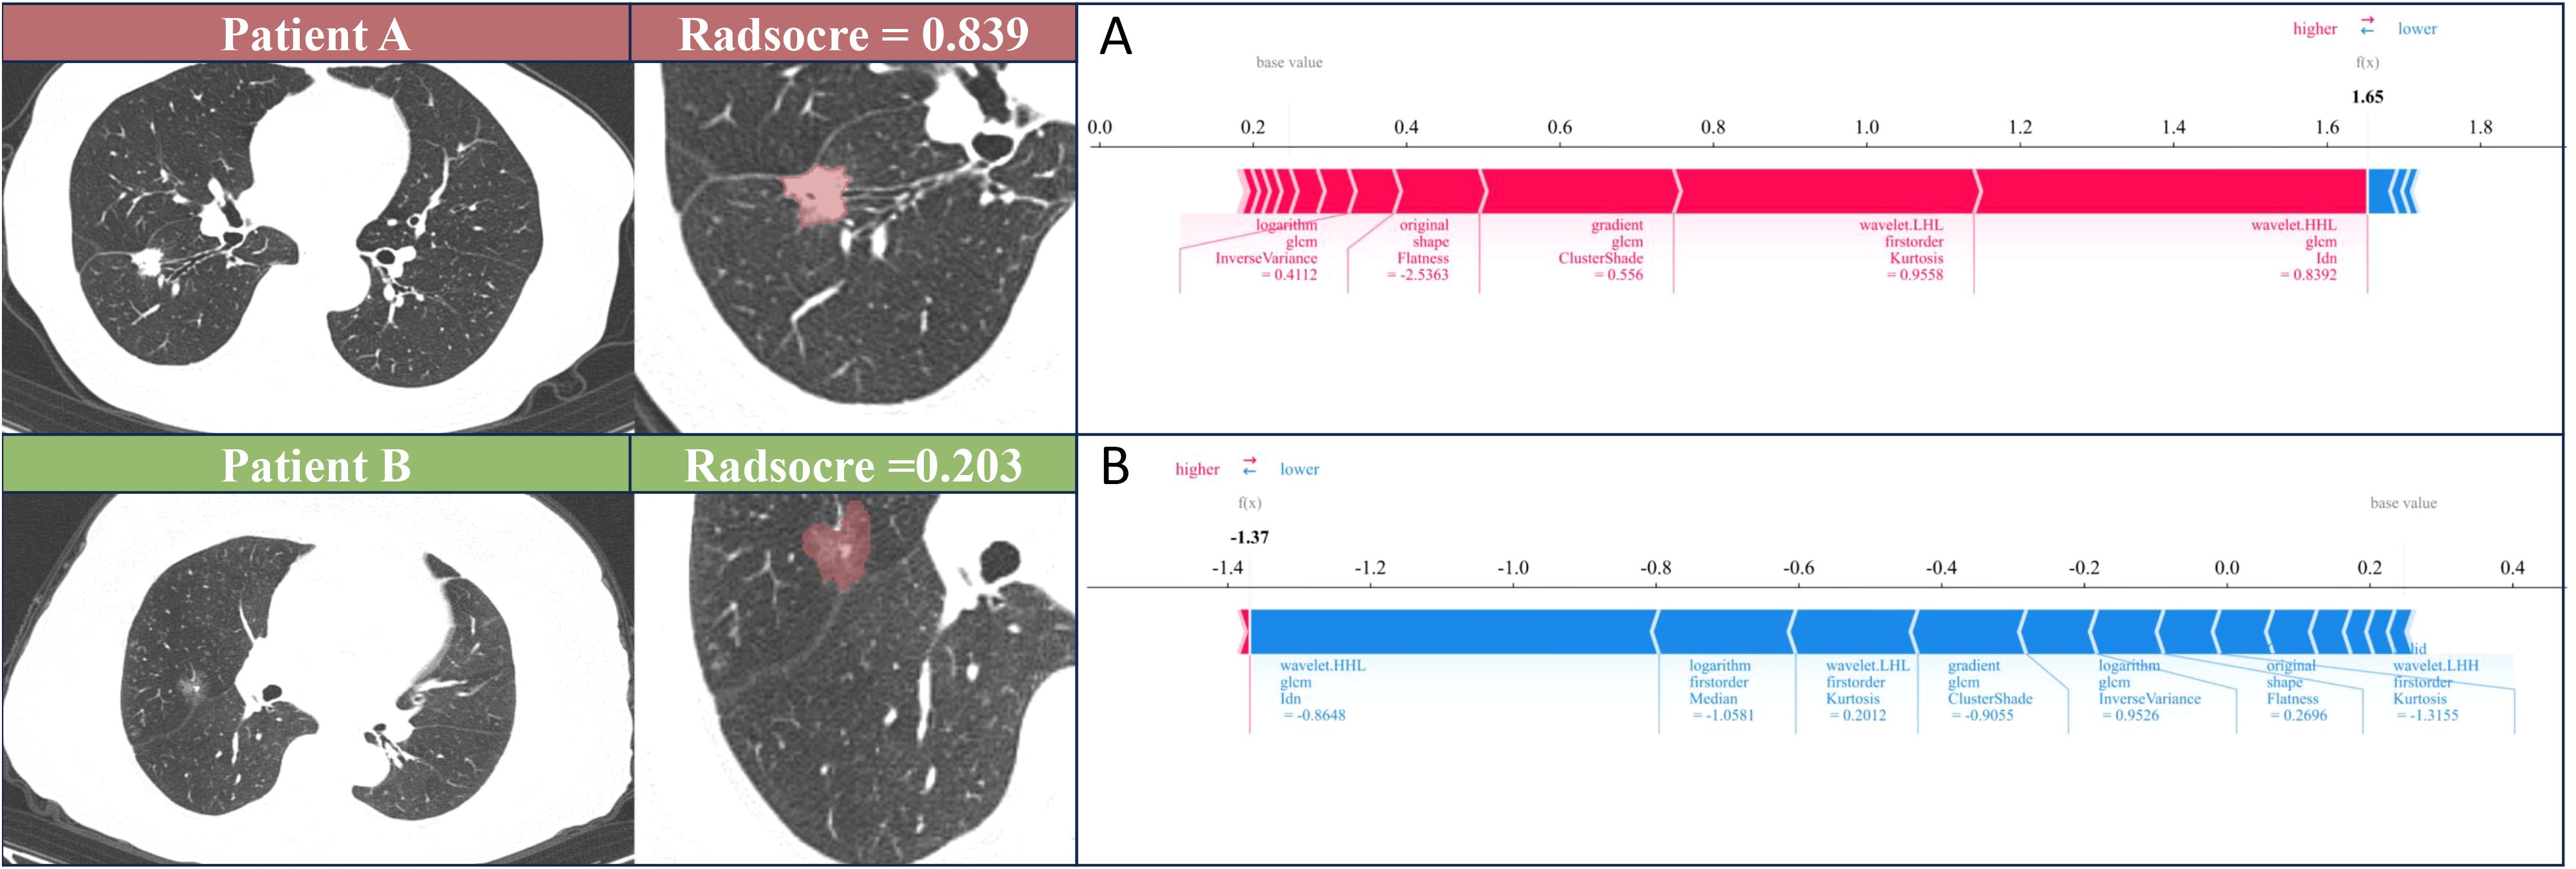
Figure 6. SHAP force plot illustrates the reasoning process behind two representative cases. (A) The STAS status was positive of patient A. (B) The STAS status was negative of patient B. The base value is the predicted value when no input is provided to the model, while the bold numbers represent the probability predicted value (f(x)). Blue features represent decreased risk, while red features represent increased risk. The length of the arrow reflects the degree of influence on the prediction. The longer the arrow, the greater the effect.
Discussion
In this study, we constructed several radiomics signatures using separate regions of nodules (ground-glass, solid, gross, and perinodular) individually and in combination, and explored the potential of these radiomic features for predicting STAS status in lung adenocarcinoma. The GGR+SR+PR model exhibited the highest performance, achieving AUCs of 0.959 and 0.840, respectively, in the training and external test groups, indicating its potential as a valuable preoperative tool for clinical decision making.
STAS represents a crucial risk factor affecting patient survival and postoperative recurrence (6). The preoperative accurate prediction of the STAS status in lung adenocarcinoma is conducive to the selection of surgical approaches. Multiple studies have demonstrated that the solid tumor component is associated with STAS status (16, 33). In our study, the CTR emerged as an independent predictor of STAS, indicating that tumors positive for STAS tend to have a greater proportion of solid components, aligning with their observed findings. Additionally, the present research showed that CEA levels were frequently elevated in patients with STAS-positive lung adenocarcinoma, which is consistent with previous study finding (23). This suggests that this tumor marker may serve as an important indicator for STAS in lung adenocarcinoma. However, this factor was not an independent risk factor for STAS in our study.
Previous studies have used radiomics to assess STAS. Jiang et al. (21) built a CT-based radiomics signature using the random-forest classifier that predicted STAS with a specificity of 0.588, sensitivity of 0.880, and AUC of 0.754, demonstrating good diagnostic capability. However, this study was a single-center study. Chen et al. (34) extracted radiomic features from 233 stage I lung adenocarcinoma and constructed a CT-based predictive model for STAS that achieved AUCs of 0.63 and 0.69 in the internal and external validation cohorts, respectively. However, this model showed moderate predictive performance. Moreover, these studies only extracted radiomic features from the gross tumor region. In our study, we extracted radiomic features from different regions of nodules, and found that the radiomics model based on combined features from GGR, SR, and PR showed good discrimination ability (AUC = 0.840) and was the best-performance model. By analyzing these radiomic features, we observed that the predictive performance of the GGR+SR model (AUC = 0.832) outperformed the GNR model (AUC = 0.674) when applied to the external test cohort. This result may indicate that the combined features of GGR and SR had additional value compared with the GNR features alone. Additionally, we also found that the predictive performance of the SR model (AUC = 0.831) was superior to that of the GGR model (AUC = 0.659) and GNR model (AUC = 0.674). Radiomics can reflect the heterogeneity of tumors, this result demonstrates that radiomic features from SR were useful in predicting STAS, reflecting the relationship between STAS and the solid components of the tumor. STAS is mainly distributed around the primary tumor lesion, and studies (23, 35) have demonstrated that radiomic features extracted from the peritumoral area were feasible for predicting STAS status. In our study, the prediction performance of the model was improved when combined radiomic features from SR, GGR and PR, indicating PR features had a certain predictive value.
Effective and dependable machine learning classifiers aid in enhancing the successful use of radiomics within clinical practice (36). To enhance the robustness of our research, we chose 3 machine learning classifiers. The primary benefit of LightGBM is the substantial speed-up in the training process, which leads to the creation of more effective models (37, 38). Our best-performing radiomics signature contained a high proportion of SR features (9/16), and these had significant predictive weight, suggesting that the solid regions contain important information reflecting the STAS status. This further illustrates the association between STAS and solid components. The SHAP analysis provides explanations and visualizations for the LighGBM model through SHAP summary plots and SHAP force plots. In this study, we found that the wavelet-HHL_glcm_Idn feature based on SR was the top feature that contributed the most to the best radiomics signature. Wavelet features can reflect heterogeneity within the tumor and better represent the image information (39). A previous study showed that wavelet features are capable of effectively predicting the STAS status in lung adenocarcinoma (40).
Our research is subject to several limitations. First, this study was based on retrospective analysis, which inherently has selection bias. Second, employing a manual and semi-automatic method for segmenting the ROI introduces a level of subjectivity that could influence the findings. Third, the sample size is relatively small and is need a larger prospective study to validate our findings. Fourth, this study only analyzed the perinodular area extending 5 mm from the edge of the nodule to the periphery, and a wider range of perinodular area needs to be further explored in the future. Finally, this study utilized only non-enhanced CT images, and future work should integrate contrast-enhanced CT to further explore the value of radiomics for predicting STAS.
Conclusion
In conclusion, CT radiomic features based on SR can contribute to identifying the STAS status in lung adenocarcinoma. Combined radiomic features from ground-glass, solid, and perinodular areas of PSNs enhances the prediction ability of the model.
Data availability statement
The original contributions presented in the study are included in the article/Supplementary Material. Further inquiries can be directed to the corresponding authors.
Ethics statement
The studies involving humans were approved by The Ethics Committee of the Affiliated Hospital of Qingdao University. The studies were conducted in accordance with the local legislation and institutional requirements. The ethics committee/institutional review board waived the requirement of written informed consent for participation from the participants or the participants’ legal guardians/next of kin because this study is a retrospective study.
Author contributions
SC: Conceptualization, Investigation, Writing – original draft, Writing – review & editing. HS: Formal analysis, Investigation, Supervision, Writing – review & editing. FL: Data curation, Investigation, Writing – review & editing. XH: Data curation, Methodology, Software, Writing – review & editing. BW: Data curation, Methodology, Writing – review & editing. LZ: Data curation, Investigation, Software, Writing – review & editing. FH: Formal analysis, Validation, Writing – review & editing. EK: Formal analysis, Validation, Writing – review & editing. JL: Conceptualization, Formal analysis, Methodology, Project administration, Writing – review & editing. HL: Conceptualization, Data curation, Formal analysis, Methodology, Project administration, Resources, Writing – review & editing.
Funding
The author(s) declare that no financial support was received for the research, and/or publication of this article.
Conflict of interest
The authors declare that the research was conducted in the absence of any commercial or financial relationships that could be construed as a potential conflict of interest.
Generative AI statement
The author(s) declare that no Generative AI was used in the creation of this manuscript.
Any alternative text (alt text) provided alongside figures in this article has been generated by Frontiers with the support of artificial intelligence and reasonable efforts have been made to ensure accuracy, including review by the authors wherever possible. If you identify any issues, please contact us.
Publisher’s note
All claims expressed in this article are solely those of the authors and do not necessarily represent those of their affiliated organizations, or those of the publisher, the editors and the reviewers. Any product that may be evaluated in this article, or claim that may be made by its manufacturer, is not guaranteed or endorsed by the publisher.
Supplementary material
The Supplementary Material for this article can be found online at: https://www.frontiersin.org/articles/10.3389/fonc.2025.1700843/full#supplementary-material
Supplementary Table 1 | The parameters of CT scans.
Supplementary Table 2 | Performance of three machine learning classifiers with reference to individual ROIs.
Supplementary Table 3 | Performance of three machine learning classifiers with reference to multiple ROIs.
References
1. Bray F, Laversanne M, Sung H, Ferlay J, Siegel RL, Soerjomataram I, et al. Global cancer statistics 2022: GLOBOCAN estimates of incidence and mortality worldwide for 36 cancers in 185 countries. CA Cancer J Clin. (2024) 74:229–63. doi: 10.3322/caac.21834
2. Meza R, Meernik C, Jeon J, and Cote ML. Lung cancer incidence trends by gender, race and histology in the United States, 1973-2010. PLoS One. (2015) 10:e0121323. doi: 10.1371/journal.pone.0121323
3. Shi L, Sheng M, Wei Z, Liu L, and Zhao J. CT-based radiomics predicts the Malignancy of pulmonary nodules: A systematic review and meta-analysis. Acad Radiol. (2023) 30:3064–75. doi: 10.1016/j.acra.2023.05.026
4. Church TR, Black WC, Aberle DR, Berg CD, Clingan KL, Duan F, et al. Results of initial low-dose computed tomographic screening for lung cancer. N Engl J Med. (2013) 368:1980–91. doi: 10.1056/NEJMoa1209120
5. Travis WD, Brambilla E, Nicholson AG, Yatabe Y, Austin JHM, Beasley MB, et al. The 2015 world health organization classification of lung tumors: impact of genetic, clinical and radiologic advances since the 2004 classification. J Thorac Oncol. (2015) 10:1243–60. doi: 10.1097/jto.0000000000000630
6. Warth A, Muley T, Kossakowski CA, Goeppert B, Schirmacher P, Dienemann H, et al. Prognostic impact of intra-alveolar tumor spread in pulmonary adenocarcinoma. Am J Surg Pathol. (2015) 39:793–801. doi: 10.1097/pas.0000000000000409
7. Dai C, Xie H, Su H, She Y, Zhu E, Fan Z, et al. Tumor Spread through Air Spaces Affects the Recurrence and Overall Survival in Patients with Lung Adenocarcinoma >2 to 3cm. J Thorac Oncol. (2017) 12:1052–60. doi: 10.1016/j.jtho.2017.03.020
8. Cao C, Chandrakumar D, Gupta S, Yan TD, and Tian DH. Could less be more?-A systematic review and meta-analysis of sublobar resections versus lobectomy for non-small cell lung cancer according to patient selection. Lung Cancer. (2015) 89:121–32. doi: 10.1016/j.lungcan.2015.05.010
9. Okada M, Koike T, Higashiyama M, Yamato Y, Kodama K, and Tsubota N. Radical sublobar resection for small-sized non-small cell lung cancer: a multicenter study. J Thorac Cardiovasc Surg. (2006) 132:769–75. doi: 10.1016/j.jtcvs.2006.02.063
10. Kadota K, Nitadori JI, Sima CS, Ujiie H, Rizk NP, Jones DR, et al. Tumor Spread through Air Spaces is an Important Pattern of Invasion and Impacts the Frequency and Location of Recurrences after Limited Resection for Small Stage I Lung Adenocarcinomas. J Thorac Oncol. (2015) 10:806–14. doi: 10.1097/jto.0000000000000486
11. Shiono S, Endo M, Suzuki K, Yarimizu K, Hayasaka K, and Yanagawa N. Spread through air spaces is a prognostic factor in sublobar resection of non-small cell lung cancer. Ann Thorac Surg. (2018) 106:354–60. doi: 10.1016/j.athoracsur.2018.02.076
12. Chae M, Jeon JH, Chung JH, Lee SY, Hwang WJ, Jung W, et al. Prognostic significance of tumor spread through air spaces in patients with stage IA part-solid lung adenocarcinoma after sublobar resection. Lung Cancer. (2021) 152:21–6. doi: 10.1016/j.lungcan.2020.12.001
13. Ren Y, Xie H, Dai C, She Y, Su H, Xie D, et al. Prognostic impact of tumor spread through air spaces in sublobar resection for 1A lung adenocarcinoma patients. Ann Surg Oncol. (2019) 26:1901–8. doi: 10.1245/s10434-019-07296-w
14. Villalba JA, Shih AR, Sayo TMS, Kunitoki K, Hung YP, Ly A, et al. Accuracy and reproducibility of intraoperative assessment on tumor spread through air spaces in stage 1 lung adenocarcinomas. J Thorac Oncol. (2021) 16:619–29. doi: 10.1016/j.jtho.2020.12.005
15. Walts AE and Marchevsky AM. Current evidence does not warrant frozen section evaluation for the presence of tumor spread through alveolar spaces. Arch Pathol Lab Med. (2018) 142:59–63. doi: 10.5858/arpa.2016-0635-OA
16. Kim SK, Kim TJ, Chung MJ, Kim TS, Lee KS, Zo JI, et al. Lung adenocarcinoma: CT features associated with spread through air spaces. Radiology. (2018) 289:831–40. doi: 10.1148/radiol.2018180431
17. Qin L, Sun Y, Zhu R, Hu B, and Wu J. Clinicopathological and CT features of tumor spread through air space in invasive lung adenocarcinoma. Front Oncol. (2022) 12:959113. doi: 10.3389/fonc.2022.959113
18. de Margerie-Mellon C, Onken A, Heidinger BH, VanderLaan PA, and Bankier AA. CT manifestations of tumor spread through airspaces in pulmonary adenocarcinomas presenting as subsolid nodules. J Thorac Imaging. (2018) 33:402–8. doi: 10.1097/rti.0000000000000344
19. Ye T, Deng L, Wang S, Xiang J, Zhang Y, Hu H, et al. Lung adenocarcinomas manifesting as radiological part-solid nodules define a special clinical subtype. J Thorac Oncol. (2019) 14:617–27. doi: 10.1016/j.jtho.2018.12.030
20. Lambin P, Rios-Velazquez E, Leijenaar R, Carvalho S, van Stiphout RG, Granton P, et al. Radiomics: extracting more information from medical images using advanced feature analysis. Eur J Cancer. (2012) 48:441–6. doi: 10.1016/j.ejca.2011.11.036
21. Jiang C, Luo Y, Yuan J, You S, Chen Z, Wu M, et al. CT-based radiomics and machine learning to predict spread through air space in lung adenocarcinoma. Eur Radiol. (2020) 30:4050–7. doi: 10.1007/s00330-020-06694-z
22. Han X, Fan J, Zheng Y, Ding C, Zhang X, Zhang K, et al. The value of CT-based radiomics for predicting spread through air spaces in stage IA lung adenocarcinoma. Front Oncol. (2022) 12:757389. doi: 10.3389/fonc.2022.757389
23. Liao G, Huang L, Wu S, Zhang P, Xie D, Yao L, et al. Preoperative CT-based peritumoral and tumoral radiomic features prediction for tumor spread through air spaces in clinical stage I lung adenocarcinoma. Lung Cancer. (2022) 163:87–95. doi: 10.1016/j.lungcan.2021.11.017
24. Liu C, Meng A, Xue XQ, Wang YF, Jia C, Yao DP, et al. Prediction of early lung adenocarcinoma spread through air spaces by machine learning radiomics: a cross-center cohort study. Transl Lung Cancer Res. (2024) 13:3443–59. doi: 10.21037/tlcr-24-565
25. Xu Y, Liu X, Cao X, Huang C, Liu E, Qian S, et al. Artificial intelligence: A powerful paradigm for scientific research. Innovation (Camb). (2021) 2:100179. doi: 10.1016/j.xinn.2021.100179
26. Lundberg SM and Lee S-I. (2017). A unified approach to interpreting model predictions. In: Paper presented at the 31st international conference on neural information processing systems Neural Information Processing Systems, Neural Information Processing Systems Foundation, Inc. (NlPS), Long Beach, CA.
27. Rodríguez-Pérez R and Bajorath J. Interpretation of compound activity predictions from complex machine learning models using local approximations and shapley values. J Med Chem. (2020) 63:8761–77. doi: 10.1021/acs.jmedchem.9b01101
28. Ma L, Xiao Z, Li K, Li S, Li J, and Yi X. Game theoretic interpretability for learning based preoperative gliomas grading. Future Gen Comput Sys. (2020) 112:1–10. doi: 10.1016/j.future.2020.04.038
29. Li R, Shinde A, Liu A, Glaser S, Lyou Y, Yuh B, et al. Machine learning-based interpretation and visualization of nonlinear interactions in prostate cancer survival. JCO Clin Cancer Inform. (2020) 4:637–46. doi: 10.1200/cci.20.00002
30. Nicholson AG, Tsao MS, Beasley MB, Borczuk AC, Brambilla E, Cooper WA, et al. The 2021 WHO classification of lung tumors: impact of advances since 2015. J Thorac Oncol. (2022) 17:362–87. doi: 10.1016/j.jtho.2021.11.003
31. Wu G, Woodruff HC, Shen J, Refaee T, Sanduleanu S, Ibrahim A, et al. Diagnosis of invasive lung adenocarcinoma based on chest CT radiomic features of part-solid pulmonary nodules: A multicenter study. Radiology. (2020) 297:451–8. doi: 10.1148/radiol.2020192431
32. Orlhac F, Frouin F, Nioche C, Ayache N, and Buvat I. Validation of A method to compensate multicenter effects affecting CT radiomics. Radiology. (2019) 291:53–9. doi: 10.1148/radiol.2019182023
33. Toyokawa G, Yamada Y, Tagawa T, Kamitani T, Yamasaki Y, Shimokawa M, et al. Computed tomography features of resected lung adenocarcinomas with spread through air spaces. J Thorac Cardiovasc Surg. (2018) 156:1670–1676.e1674. doi: 10.1016/j.jtcvs.2018.04.126
34. Chen D, She Y, Wang T, Xie H, Li J, Jiang G, et al. Radiomics-based prediction for tumour spread through air spaces in stage I lung adenocarcinoma using machine learning. Eur J Cardiothorac Surg. (2020) 58:51–8. doi: 10.1093/ejcts/ezaa011
35. Zhuo Y, Feng M, Yang S, Zhou L, Ge D, Lu S, et al. Radiomics nomograms of tumors and peritumoral regions for the preoperative prediction of spread through air spaces in lung adenocarcinoma. Transl Oncol. (2020) 13:100820. doi: 10.1016/j.tranon.2020.100820
36. Parmar C, Grossmann P, Bussink J, Lambin P, and Aerts H. Machine learning methods for quantitative radiomic biomarkers. Sci Rep. (2015) 5:13087. doi: 10.1038/srep13087
37. Ke G, Meng Q, Finley T, Wang T, Chen W, Ma W, et al. LightGBM: A highly efficient gradient boosting decision tree. 31st International Conference on Neural Information Processing Systems, Dec 2017, Long Beach, United States. (2017).
38. Basha SM, Rajput DS, and Vandhan V. Impact of gradient ascent and boosting algorithm in classification. IJoIE Syst. (2018) 11:41–9. doi: 10.22266/ijies2018.0228.05
39. Liang W, Xu L, Yang P, Zhang L, Wan D, Huang Q, et al. Novel nomogram for preoperative prediction of early recurrence in intrahepatic cholangiocarcinoma. Front Oncol. (2018) 8:360. doi: 10.3389/fonc.2018.00360
40. Qi L, Li X, He L, Cheng G, Cai Y, Xue K, et al. Comparison of diagnostic performance of spread through airspaces of lung adenocarcinoma based on morphological analysis and perinodular and intranodular radiomic features on chest CT images. Front Oncol. (2021) 11:654413. doi: 10.3389/fonc.2021.654413
Keywords: lung adenocarcinoma, spread through air spaces, part-solid nodules, tomography, X-ray computed, radiomics
Citation: Cui S, Song H, Lin F, Han X, Wang B, Zhang L, Hou F, Kang E, Lin J and Lou H (2025) To predict the spread through air spaces in lung adenocarcinoma using radiomic features from different regions of part-solid nodules: a multicenter study. Front. Oncol. 15:1700843. doi: 10.3389/fonc.2025.1700843
Received: 19 September 2025; Accepted: 17 October 2025;
Published: 31 October 2025.
Edited by:
Zhenwei Shi, Guangdong Academy of Medical Sciences, ChinaReviewed by:
Yanfen Cui, Chinese Academy of Medical Sciences/Cancer Hospital Affiliated to Shanxi Medical University, ChinaGuanchao Ye, First Affiliated Hospital of Zhengzhou University, China
Copyright © 2025 Cui, Song, Lin, Han, Wang, Zhang, Hou, Kang, Lin and Lou. This is an open-access article distributed under the terms of the Creative Commons Attribution License (CC BY). The use, distribution or reproduction in other forums is permitted, provided the original author(s) and the copyright owner(s) are credited and that the original publication in this journal is cited, in accordance with accepted academic practice. No use, distribution or reproduction is permitted which does not comply with these terms.
*Correspondence: Jizheng Lin, bGluaml6aGVuZ0BxZHUuZWR1LmNu; Henan Lou, bG91aGVuYW5AcWR1aG9zcGl0YWwuY24=
†These authors have contributed equally to this work and share first authorship