 Seyifemickael Amare Yilema
 Yegnanew A. Shiferaw
 Najmeh Nakhaeirad
 Ding-Geng Chen
- 1Department of Statistics, College of Natural and Computational Science, Debre Tabor University, Debre Tabor, Ethiopia
- 2Department of Statistics, University of Pretoria, Pretoria, South Africa
- 3Department of Statistics, University of Johannesburg, Johannesburg, South Africa
- 4College of Health Solution, Arizona State University, Phoenix, AZ, United States
Background: Globally, anemia poses a serious health challenge for children under the age of five, and Ethiopia is one of the countries significantly affected by this issue. The 2016 Ethiopian Demographic and Health Survey (DHS) data sets were employed to evaluate anemia risk among children aged 6–59 months. Due to limited research has been conducted on childhood anemia spatial disparities at the Ethiopian zonal level, and it is essential for developing zonal-level interventions for inform policy recommendations.
Methods: This study was examined the geospatial disparities in anemia prevalence among children aged 6–59 months. We used a semi-parametric additive model with spatial smoothing to assess zone-level variation in anemia risk while adjusting for key covariates. Each predictor variable was spatially adjusted using non-parametric smoothing techniques based on geolocation parameters, and corresponding maps for each predictor.
Results: A regularized random forest techniques was employed to identify the most influential predictors of childhood anemia and enhance the model predictive performance. Our findings revealed that the regional states of Somalia, Afar, and Dire Dawa exhibit the highest risk levels for childhood anemia. Furthermore, the risk of anemia in children varies spatially across different zones in Ethiopia. The most prominent hotspots for childhood anemia were in the country's Northeastern, Eastern, and Southeastern regions. In contrast, the areas with the lowest risk were in Northwestern, Western, and Southwestern zones of Ethiopia.
Conclusion: The significant spatial disparities in anemia risk across the administrative zones of Ethiopia, indicating that the distribution of each predictor variable is not uniform. These findings provide valuable insights for policymakers, enabling the development of geographically targeted interventions to mitigate anemia risk at the zonal level.
1 Introduction
Anemia is a medical condition defined by a decrease in hemoglobin concentration or a reduction in red blood cell (RBC), falling below the normal range observed in healthy individuals. This condition presents a significant global health challenge, particularly among children. The consequences of anemia in children are significant with including growth retardation, compromised immune systems, and increased vulnerability to diseases, potentially leading to fatal outcomes (1–6). Furthermore, anemia harmfully affects mental, physical, and language development and scholastic performance (1–7). In female, the long-term implications of anemia include the risk of low birth weight infants and postpartum hemorrhage, particularly among low-income families (8, 9). In addition, anemia often associated with inadequate nutrition and poor overall health (8–10).
According to the World Health Organization (WHO) global report, 39.8% of under children five were anemic worldwide, with 60.2% of these cases occurring in Africa (9). In East Africa, the situation is even more concerning, as anemia have been affected more than 75% of children under five, with prevalence rates varying from 44% to 76% (11). In Ethiopia, the 2016 Demographic and Health Survey (EDHS) revealed that 57% of children under five were anemic, with regional differences ranging from 42% in the Amhara to 83% in the Somali regions (12). Furthermore, various studies conducted in different regions of Ethiopia have reported varying prevalence rates of anemia among children under five, research from Northeast Ethiopia, North Showa, the Tigray region, Hawassa Referral Hospital, and Gondar shows prevalence rates varying from 21.6% to 41.7% (13–17). In 2021, the Ethiopian government launched its second health sector transformation plan, aiming to significantly lower child mortality rates and address related complications, with the goal of fostering healthier communities by 2025 (18).
Mapping the spatial distributions of disease incidence and prevalence has long been a vital tool in spatial epidemiology research. Therefore, the methodology has been used in characterizing spatial patterns of risk, identifying public health risk factors, and predicting disease outcomes in diverse geographical contexts (19–22). In Ethiopia, some studies have explored in traditional spatial analysis and the identification of associated covariates at national and subnational levels (23–29). However, there is limited research examining how the non-parametric smoothing effects of each predictor variable relate to the spatial variations in children anemia risk across Ethiopian administrative zones.
This paper aims to map and visualize the covariate-adjusted spatial effects of childhood anemia prevalence in these zones, specifically focusing on children aged 6–59 months and employing robust statistical models, such as semiparametric additive models. Therefore, the novelty of this work has two folds over previous research. First, we explore the geographical differences in the prevalence of childhood anemia among the local administrations (zones) in Ethiopia. Second, our innovative approach utilizes individual-level data to map and visualize the covariate-adjusted spatial effects of childhood anemia in local Ethiopian administrative zones.
2 Methods and materials
2.1 Data sources
2.1.1 Survey data sources
The 2016 Ethiopian Demographic and Health Surveys (DHS) provided the data used in this investigation. After fulfilling the requirements, these surveys were obtained from the DHS program website https://dhsprogram.com. The DHS employed a multistage sampling design. Enumeration areas (EAs), established during the 2007 Population and Housing Census, were randomly selected in the first stage. In the second stage, households were systematically chosen from the selected clusters. For the 2016 Ethiopian DHS, 10,641 households were randomly selected, averaging 28 households per EA from a total of 645 EAs, creating a nationally representative sample (30). Additionally, stratified sampling was utilized to consider residential status (rural vs. urban households).
2.1.2 Spatial data sources
The DHS Program first made Georeferenced Global Positioning System (GPS) datasets publicly available in 2003. Individual records from DHS household surveys can be linked to these georeferenced datasets using unique survey identifiers. Since the early 2000s, recording GPS coordinates during surveys has become increasingly common. Over 120 surveys, including one conducted in Ethiopia, utilize GPS data.
To safeguard the privacy of respondents, the locations in these datasets undergo alterations through a process known as geo-masking or geo-scrambling (31). In this process, the latitude and longitude of survey clusters are relocated to new coordinates while adhering to specific guidelines: urban areas are displaced by 0–2 km, rural locations by 0–5 km, and 1% of the points (or every 100th point) are displaced by up to 10 km from their original locations.
For more detailed information on the geographic displacement of DHS georeferenced data and the associated spatial variability, please refer to Spatial Analysis Reports 7–10 (31–33). The EA GPS datasets can be accessed from https://dhsprogram.com by submitting a reasonable request to the DHS program. Additionally, zonal shapefiles can be explored on the website https://www.diva-gis.org. Figure 1 illustrates the zonal and regional maps of Ethiopia, highlighting the anemia datasets within the EA.
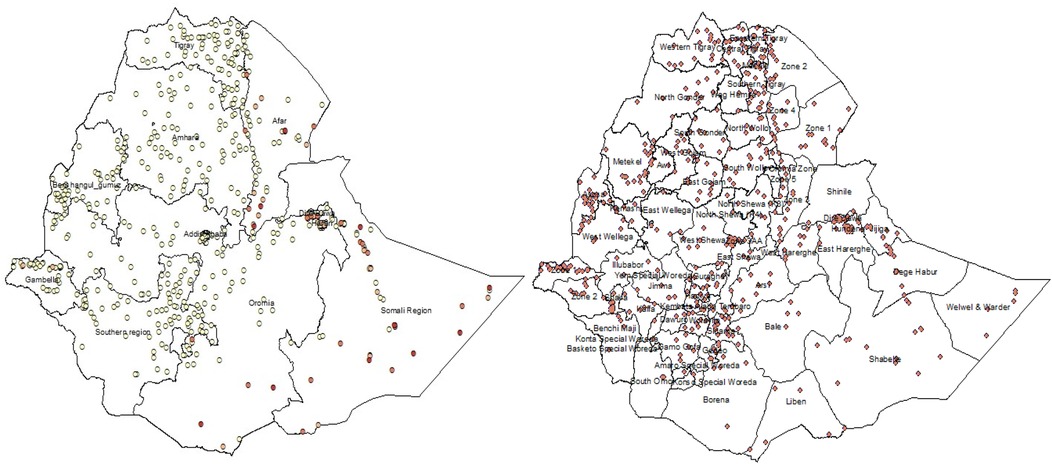
Figure 1. The EA datasets overlay across the regional and zonal maps of Ethiopia.
2.2 Study variables
2.2.1 Outcome variable: childhood anemia
Children aged 6–59 months who obtained consent from their parents, or another responsible guardian were subjected to anemia testing. Blood was drawn via a heel prick for children aged 6–11 months and from the palm side of the fingertip for those aged 12–59 months. Blood samples were collected using a hemoglobin HemoCue photometer, and the results were recorded immediately. In this study, the outcome variable, child anemia, is categorized as follows: a child's anemia is either present (yes = 1) or absent (no = 0). According to the World Health Organization's guidelines, children are considered anemic if their altitude-adjusted hemoglobin level is less than 11 g/dl (30).
2.2.2 Independent variables (covariates)
The potential variables for children under the age of five (6–59 months) are extracted from the 2016 DHS children's data to analyze the prevalence of anemia in children (30). These variables are selected using random forest feature importance methods. The entire dataset is examined with these methods, which effectively identify and eliminate unnecessary variables, thereby enhancing the model's predictive capability. By evaluating the relative significance of various variables within the dataset, this technique improves the effectiveness and performance of the statistical model. The variables included in this statistical analysis are illustrated in the framework below (Figure 2).
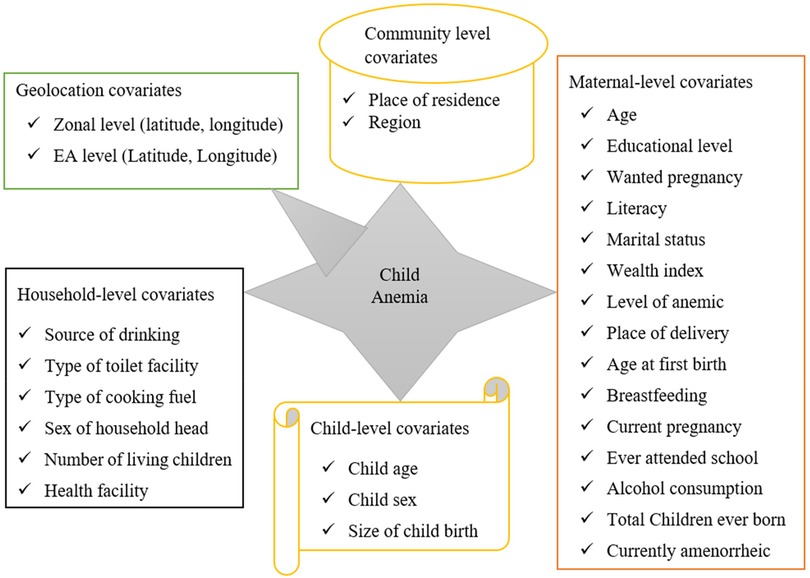
Figure 2. Conceptual framework for variable discerptions.
2.3 Inclusion and exclusion criteria
For the response variables, children aged 6–59 months who lived in the specified enumeration areas (community) met the inclusion requirements. Whereas children aged 6–59 months who did not have a hemoglobin test result were excluded. In addition, the covariates (independent variables) are selected based on literatures and the accessibility of the covariates in the DHS dataset. The candidate covariates for children under age 5 years (6–59 months) are obtained at different levels from the 2016 DHS kids' record for the analysis of child anemia prevalence. The potential candidate covariates displayed in Figure 2, are based on different literatures as follows: Child-level factors are age of child (in months), sex of child, size of child at birth, and pregnancy of the child wanted are chosen from these literatures (24, 34, 35). Maternal-level factors are age of mothers, mother's highest educational level, literacy, marital status of mothers, wealth index, mother's anemia level, place of delivery, maternal age at child birth, mother's breastfeeding, currently amenorrhea, currently abstaining from consuming alcohol, ever attended school, and mother's currently pregnancy (35, 36). Household-level factors are source of drinking water, type of toilet facility, type of cooking fuel, sex of household head, number of living children in the household (23, 25, 37). And finally community-level factors are place of residence, and region (35).
2.4 Importance variable selection
Variable importance is a method used in variable selection procedures. The regularized random forest variable importance algorithm is commonly used to identify the most important variables for machine learning and advanced statistical models (38). A regularized random forest model was employed to identify the most influential predictors of childhood anemia, as it effectively handles high-dimensional data and reduces overfitting by penalizing less important variables. Furthermore, it is resilient when dealing with nonlinear interactions and multicollinearity. This method made it possible to choose precisely which of the most significant predictors to incorporate into the geo additive model. The most significant variables typically emerge from the highest ranks of the predictor variable selections. This indicates each variable's statistical significance in relation to its impact on the constructed model. Furthermore, it ranks each independent variable based on its contribution to the model. Data scientists and statisticians utilize variable importance methods to filter out specific independent variables that provide value, rather than those that unnecessarily increase processing time (39–41).
In this study, we explored random forest variable importance methods to minimize the risk of leaving out useful variables while keeping a substantial contributing variable and eliminating the less contributing variables. We examined different literatures to identify the variables for this study (39, 42, 43), and on average, we observed that the retained variables typically had importance scores ranging from 5% to 30% of the maximum importance score. There are no widely accepted particular threshold hold values, despite the fact that these research offer insightful information (e.g., 5%–30% of the highest significance score) (41, 44). To keep a substantially contributing variable, the retaining variable significance score needs to be larger than 30% of the variable with the greatest important scores .
2.5 Geospatial statistical models
When the outcome of interest is binary, a generalized linear model (GLM) serves as a methodological framework for developing and applying models in disease mapping. GLMs are composed of random and systematic components that are interconnected through a link function. The probability distribution of the response variable Y is defined by the random component, which is assumed to belong to the exponential family and is characterized by a specific density function of the form given by
In the above density, is termed the canonical or natural parameter, the data function and the dispersion parameter, is a function of the dispersion parameter , and represents a nuisance parameter that characterizing the dispersion of response Y. Let us define the respondents of anemia risk for in ith EA as
follows a Bernoulli distribution with being the probability that the anemia risk of the child in the geographical location is anemic and is the probability that the anemia status of the child in the geographical location is non-anemic.
Estimating and mapping the spatial impacts of disease data at the individual level necessitate the application of various statistical models. Generalized additive models (GAMs), an extension of generalized linear models (GLMs), were first proposed by Hastie and Tibshirani (45). These models have become widely adopted for mapping point-based epidemiological data and are now regarded as indispensable tools in epidemiological analysis.
In the realm of geographical analysis, GAMs typically include smooth terms for spatial parameters (specifically, x and y coordinates) alongside a linear predictor for adjustment variables. Smooth terms effectively capture complex interactions, including those between the outcome and spatial elements, without imposing specific parametric forms on the relationships. GAMs provide a robust statistical framework for distributing illness risk across geographic areas by utilizing various covariates (46).
To encourage the use of GAMs for spatial disease mapping, the modeling of observations dispersed across a map with location coordinates and representing the location parameters for the respondents is taken into consideration. Let denote the anemic outcome variables and represent the adjustment variables, which assumes that the anemia's distribution is a member of the exponential family. For a spatial effect analysis, the GAM can be defined as
where is the link function for the mean of the outcome and the variance of the outcome is defined by the assumed probability model and denoted as a function of the mean and nuisance parameter . The linear predictor by , the spatial effects of interest are represented by the nonlinear smoothing function s and indicates a vector of coefficients associated with the adjustment covariate and finally , and are the coordinates of longitude and latitude respectively. When fitting the model, the spatial effect model is decomposed into parametric and nonparametric parts:
Therefore, the GAM model redefined as
The parametric component of the spatial effect is fitted jointly with other adjustment variables using least squares, while the nonparametric term is fitted using a nonparametric smoother. A semi-parametric geo-additive model was applied to a variety of linear and nonlinear functional forms while accounting for spatial variability, making it ideal for assessing spatially structured on the anemia risk data. The semi-parametric geo-additive model has an advantage over parametric models in its functional flexibility, which improves accuracy and reduces biases, leading to more accurate estimates and findings. In addition, the semi-parametric geo-additive model offers a key benefit by allowing the simultaneous estimation of fixed, nonlinear, and spatial effects, thereby providing greater flexibility in capturing unobserved heterogeneity and spatial autocorrelation over the conventional GLMs.
A locally weighted scatterplot smoother (LOESS) is commonly used as the bivariate smoothing function for two geolocations, u and v, due to the significant variation in population densities across geographic areas (47–49). LOESS is particularly suitable because it retains the smooth characteristics of a kernel while adapting the size of the smoothing neighborhood to the local density. The smoothing parameter that defines the neighborhood can either be automatically selected by minimizing the Akaike Information Criterion (AIC) or the residual deviance (50). The AIC is commonly used for the optimal span size selection in this analysis for GAM model.
GAMs were used to smooth the predictor variables with a two-dimensional predictor (geolocation) and adjust linearly for confounding variables, resulting in a heatmap of odds ratios and other effect estimates (19). Permutation tests were performed for the null hypothesis to examine the relationship between the two-dimensional predictor and anemia status while controlling for adjusted covariates (13, 19). We set the default number of permutations to test the significance of the two-dimensional predictors as it saves calculation time.
Considering this, a p-value for testing the globally adjusted spatial effects is provided by the permutation test. The null distribution is represented by the distribution of deviance statistics from the permuted data sets, and the p-value is based on the deviance statistic when comparing models without geolocation.
For a test of hypothesis
H0: geolocation is unassociated with the child anemia risk for adjusting covariates (reject H0 if the percentile rank is below alpha (default alpha value = 0.05).H1: geolocation is associated with child anemia risk.In this study, R software with MapGap package is used for fitting a GAM with a two-dimensional smooth function (5–7). Typical spatial applications in the MapGAM package begin with the predgrid() function, which generates a regular grid of points inside the study area, potentially limited to points inside map boundaries (i.e., zonal maps imported from a shapefile or retrieved from the maps package). Then, crude or covariate-adjusted odds ratio effect estimates are generated for each grid point using the modgam() function to smooth by geolocation. The optimal span size, which indicates the percentage of the data included in the neighborhood for the LOESS smoother, can be determined using the optspan() function. The sensitivity analysis is applied with the AIC criteria for selecting the smoothing parameters in the MapGAM R packages for modgam() function. The optimal span sizes for the two-dimensional location predictor's LOESS smooth are chosen from a range of values between 0.05 and 0.95, with each increment of 0.05 (13, 19) for which the minimum values of AIC is the optimal span.
It is advisable to interpret the smoothed spatial terms visually. By utilizing the modgam plotting procedure, a call to the colormap() function can generate a heatmap illustrating the estimated predictions of the spatial effect. This heatmap represents the odds ratio, comparing the probabilities at each site to the median odds across all locations (51).
3 Results
3.1 Descriptive statistics for socio-demographic characteristics
In this study, anemia status and associated covariates were derived from the 2016 EDHS dataset. Table 1 displays the anemia status for all potential candidate variables along with their corresponding variable importance rank values. To select the variables to our analysis we preferred at least 30% of the maximum variable importance score. This is since 30% rule of thumb is a heuristic, which keeps variables that are at least 30% important closer to the top. When looking Figure 3 and Table 1, there is a wide gap in importance scores between the variables age at first birth (72.91) and cooking fuel (56.53) and therefore we prefer variable importance greater than 67 (i.e., ). Where 225 is the maximum importance score for current age of child in months.
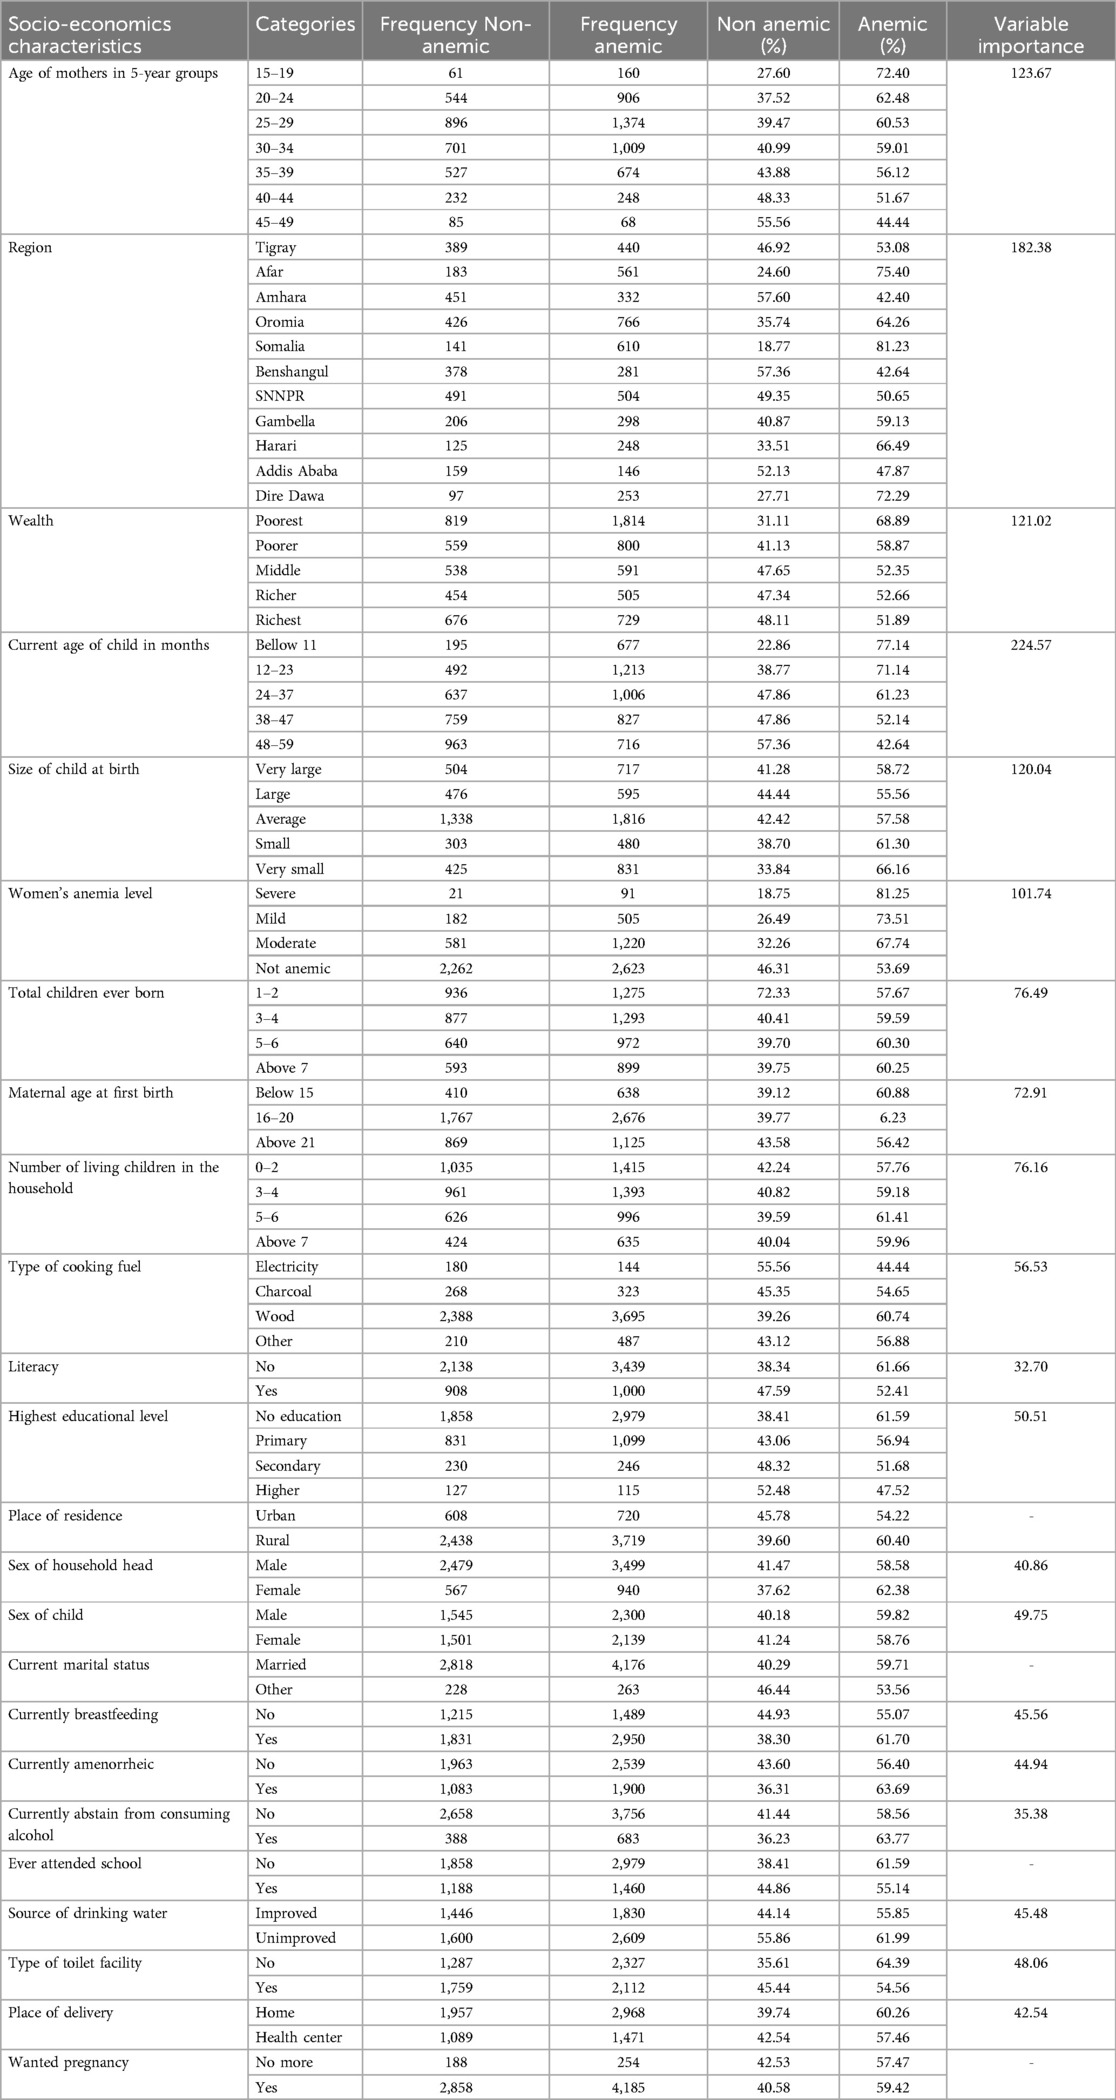
Table 1. Random forest-based variable importance rankings for socioeconomic predictors of child anemia, with category frequencies and proportions.
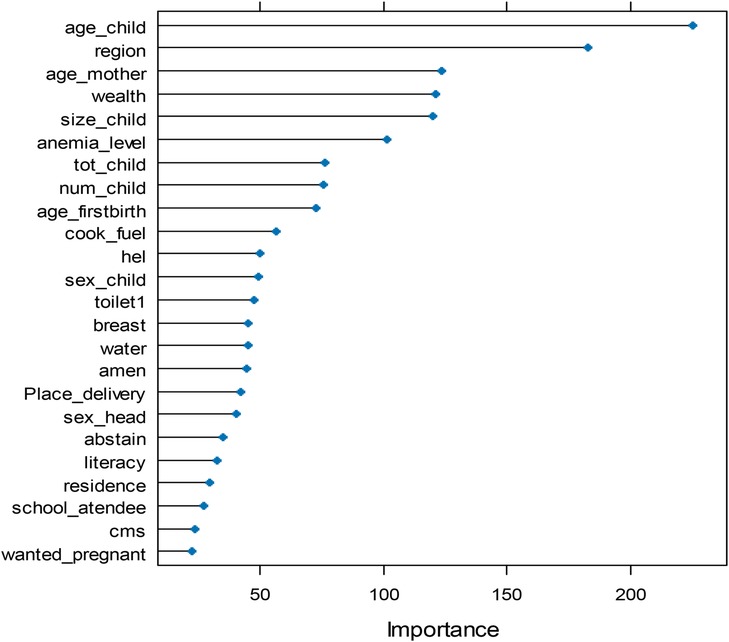
Figure 3. Feature importance scores based on random forest algorithm.
Consequently, the important biological variables, current age of child in months (225), size of child at birth (120), women's anemia status (102), total number of children ever born (77), maternal age at first birth (73), and number of living children in the household (76), and the socioeconomic variables such as age of mothers in 5-year intervals (124), region (182), wealth index (121) are retained in the final model. These variables were selected for fitting the specified model (see Figure 3 and Table 1). In contrast, other covariates with low importance values were excluded from the study. The numbers in parentheses indicate the importance of scores for each variable.
We observed that the prevalence of anemia varies significantly at the regional level. Somalia has the highest rate at 81%, followed by Afar at 75% and Dire Dawa at 72% (1). In contrast, Amhara has a lower prevalence of 42%, followed by Benishangul at 43% and Addis Ababa at 48%. Economic status also plays a crucial role in anemia risk. Children from the poorest families are at the highest risk of anemia, followed by those from poorer families. Additionally, children aged 6–11 months have the highest risk of anemia, while those aged 48–59 months have a lower risk. Furthermore, the anemia risk in children is significantly associated with the severe anemic status of their mothers, who exhibit the highest rates of anemia compared to mothers with less severe anemia.
3.2 Estimating and mapping spatial effects adjusted for covariates
GAMs were employed to smooth the covariates, specifically focusing on two-dimensional predictors associated with geolocations while also adjusting for covariates. The crude and adjusted for covariates analysis statistics test values are presented in Table 2. According to the crude analysis, the prevalence of childhood anemia had a significant association with the respondents’ spatial locations (longitude, latitude), as indicated by the p-value (0.000) used to evaluate the global spatial effect. Geographic variations were statistically significant prior to the variables being adjusted for geographical geolocations. According to the findings in Table 2, the ideal span size that reduced the AIC was 0.15, by selecting by sensitivity analysis, meaning that 15% of the nearby dataset was utilized to smooth the geolocation parameters. Considering that the p-value to assess the global spatial effect of children anemia is 0.000, the findings showed that, after controlling for variables, there were significantly significant spatial differences between location and childhood anemia prevalence (Table 2).
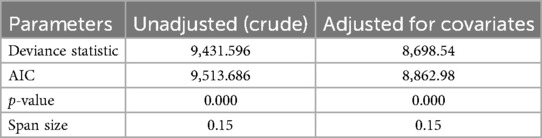
Table 2. Optimal span size selection for crude and covariate adjusted spatial effects.
Estimating and mapping the spatial distribution of anemia risk is crucial for identifying health disparities. Epidemiologists are particularly interested in creating risk surfaces that account for individual-level confounding variables (52). The adjusted odds ratios (AOR) and their corresponding p-values, which reflect potential covariate-adjusted spatial effects using GAMs, are detailed in Table 3.
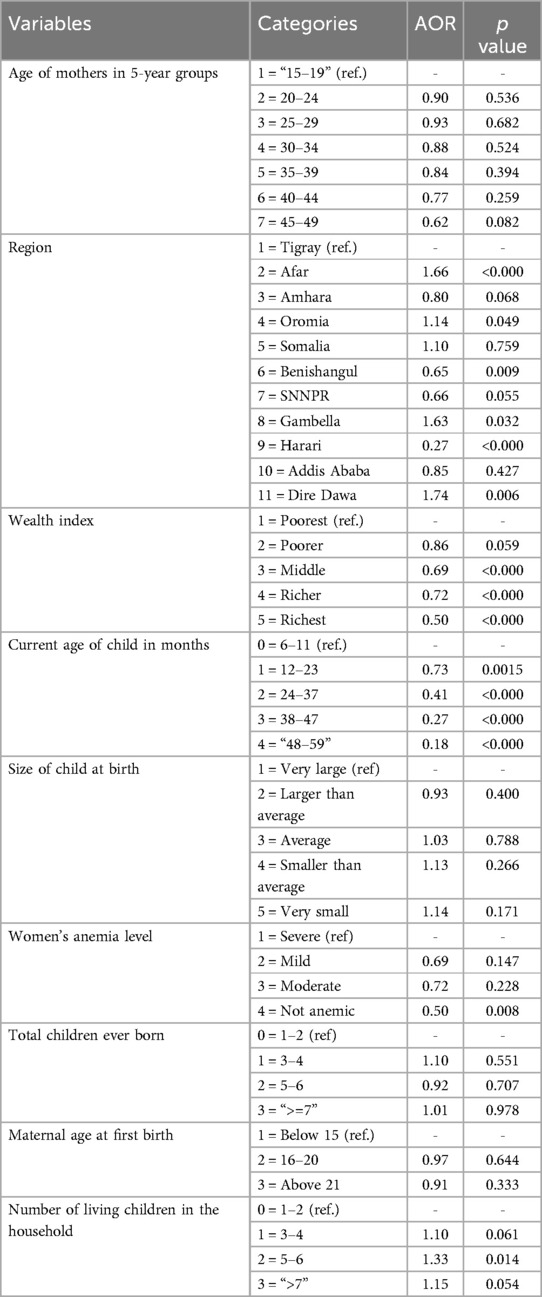
Table 3. Adjusted covariate spatial effects odds ratios for socioeconomic variables using a generalized additive model.
Children residing in the Afar region are 1.66 times more likely to develop childhood anemia (AOR = 1.66, p-value = 0.000) than those in the Tigray region. Similarly, children in Oromia have a 1.14 times higher likelihood (AOR = 1.14, p-value = 0.049), those in Gambella are 1.63 times more likely (AOR = 1.63, p-value = 0.032), and children in Dire Dawa are 1.74 times more likely (AOR = 1.74, p-value = 0.006) to develop anemia when compared to their counterparts in Tigray. In contrast, children living in Benishangul are statistically significantly less likely to develop anemia (AOR = 0.65, p-value = 0.009). At the same time, those in Harari show an even lower likelihood (AOR = 0.27, p-value = 0.000) compared to children in Tigray.
Children aged 12–23 months (AOR = 0.73, p-value = 0.0015), 24–37 months (AOR = 0.41, p-value < 0.0001), 38–47 months (AOR = 0.27, p-value < 0.0001), and 48–59 months (AOR = 0.18, p-value < 0.0001) were statistically significantly less likely to develop anemia when compared to those aged 6–11 months.
Additionally, the likelihood of developing anemia decreased by 31% (AOR = 0.69, p-value < 0.0001) for children from families with a middle wealth index, by 28% (AOR = 0.72, p-value < 0.0001) for those from richer families, and by 50% (AOR = 0.50, p-value < 0.0001) for children from the wealthiest families, in comparison to those from the poorest families.
Moreover, children of non-anemic mothers had a 50% lower risk of developing anemia (AOR = 0.50, p-value = 0.008) compared to children of mothers with severe anemia. Finally, children living in households with 5–6 siblings were 1.33 times more likely to develop anemia compared to those with only 1–2 siblings.
The Ethiopian zonal maps illustrating the locations where survey datasets were collected, based on the 2016 EDHS, are shown in Figure 4. This map presents the geolocations of child anemia observations across various administrative zones in Ethiopia. Anemic cases are marked in red on the map, while non-anemic cases are indicated in black.
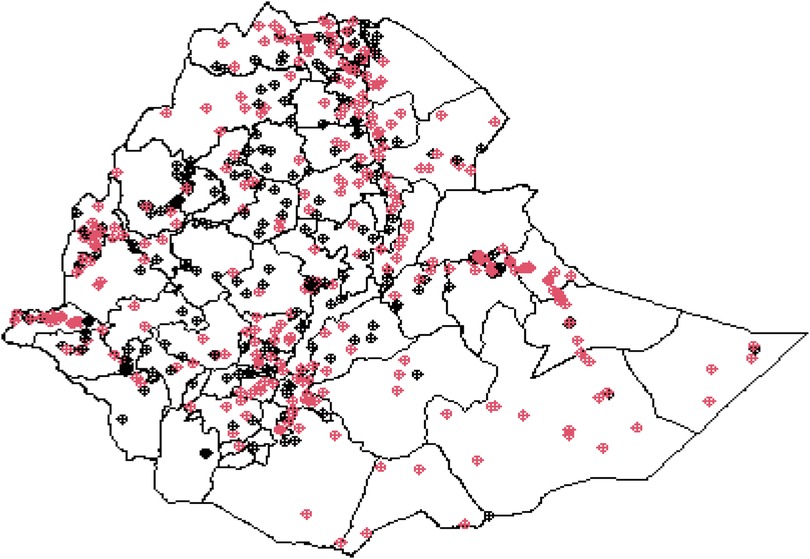
Figure 4. Geolocation of child anemia observations across the local zones in Ethiopia.
The connection between spatial locations and the risk of childhood anemia is depicted in Figure 5, which features a heatmap illustrating both crude and covariate-adjusted spatial effects. The crude odds ratio map (Figure 5, left) is based exclusively on two spatial characteristics (geolocation) that define a geographic smoothing term related to the risk of child anemia. In contrast, the adjusted odds ratio map (Figure 5, right) accounts for all covariate data to provide a more comprehensive estimate of the spatial impacts.
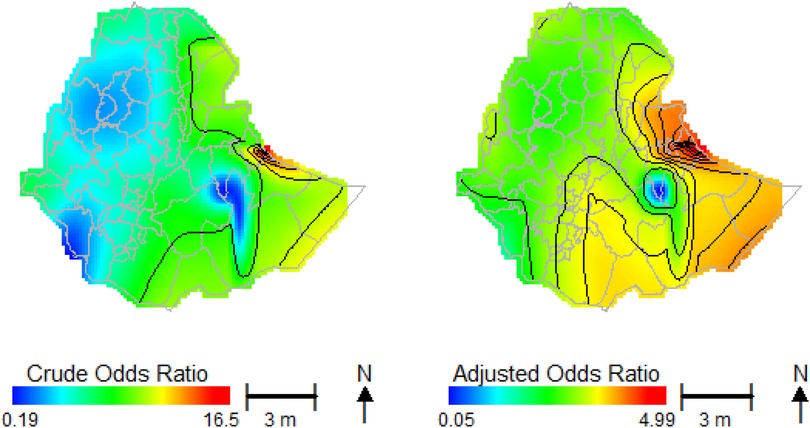
Figure 5. The crude and adjusted odds ratio of spatial effect predictions.
Evaluating the smoothed spatial terms visually, as shown in Figure 5, is particularly effective. The heatmap represents the spatial disparities in anemia across Ethiopian administrative zones, displaying the estimated spatial effect predictions. This visualization compares the odds ratio for each location against the median odds across all locations. In Figure 5, regions with a higher likelihood of child anemia are indicated in red, while those with a lower likelihood are represented in blue.
MapGAM provides point estimates for each spatial location, along with point-wise standard errors and confidence intervals. Significant regions are identified using the 95% probability intervals of the non-parametric smoothing effects, as illustrated in Figure 6. To visualize the inference for spatial effects, the “plot” function displays all point estimates alongside their corresponding lower and upper confidence interval bounds. Areas where the confidence intervals do not include 0 (on the log estimated effect scale) can be represented on the map by plotting contours of an indicator vector. This vector indicates whether 0 is positioned below, within, or above the confidence intervals at the grid points.
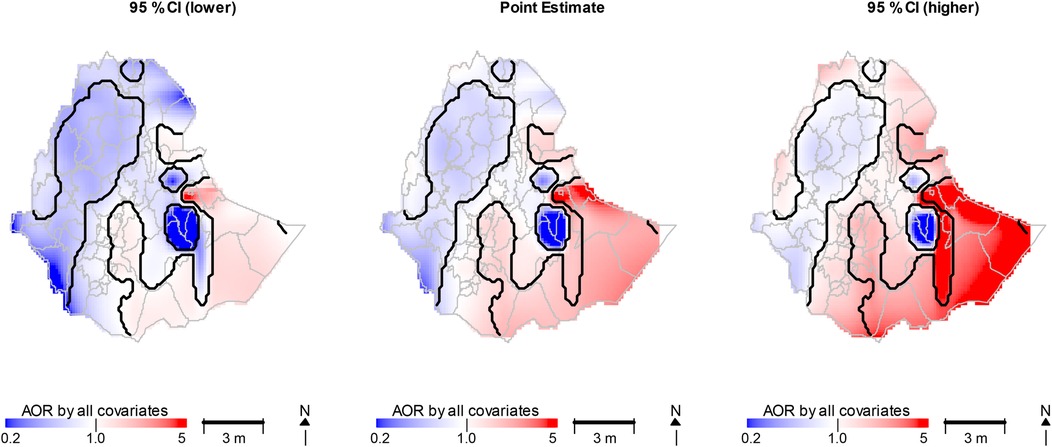
Figure 6. The confidence interval and point estimates of AOR with all covariates adjusted spatial effects.
Table 4 presents the summary statistics for spatial effect predictions, including the residual deviance and the AIC for potential predictor variables contributing to anemia prevalence. The results include the minimum AIC (where a smaller value indicates a better fit), the residual deviance, and the spatial prediction effects.
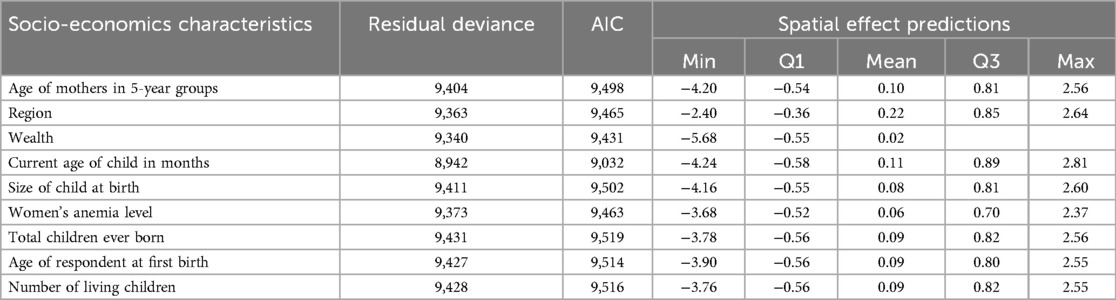
Table 4. Residual deviance, AIC, and summary statistics for covariate-adjusted spatial effect predictions of anemia by socioeconomic variables.
The potential contribution of each variable to the risk of child anemia, adjusted for geolocation (latitude and longitude) in each zone, is displayed in Figure 7. This figure illustrates the contributions of various risk predictor variables to the geographic patterns of anemia odds ratios for children aged 6–59 months while controlling for other factors.
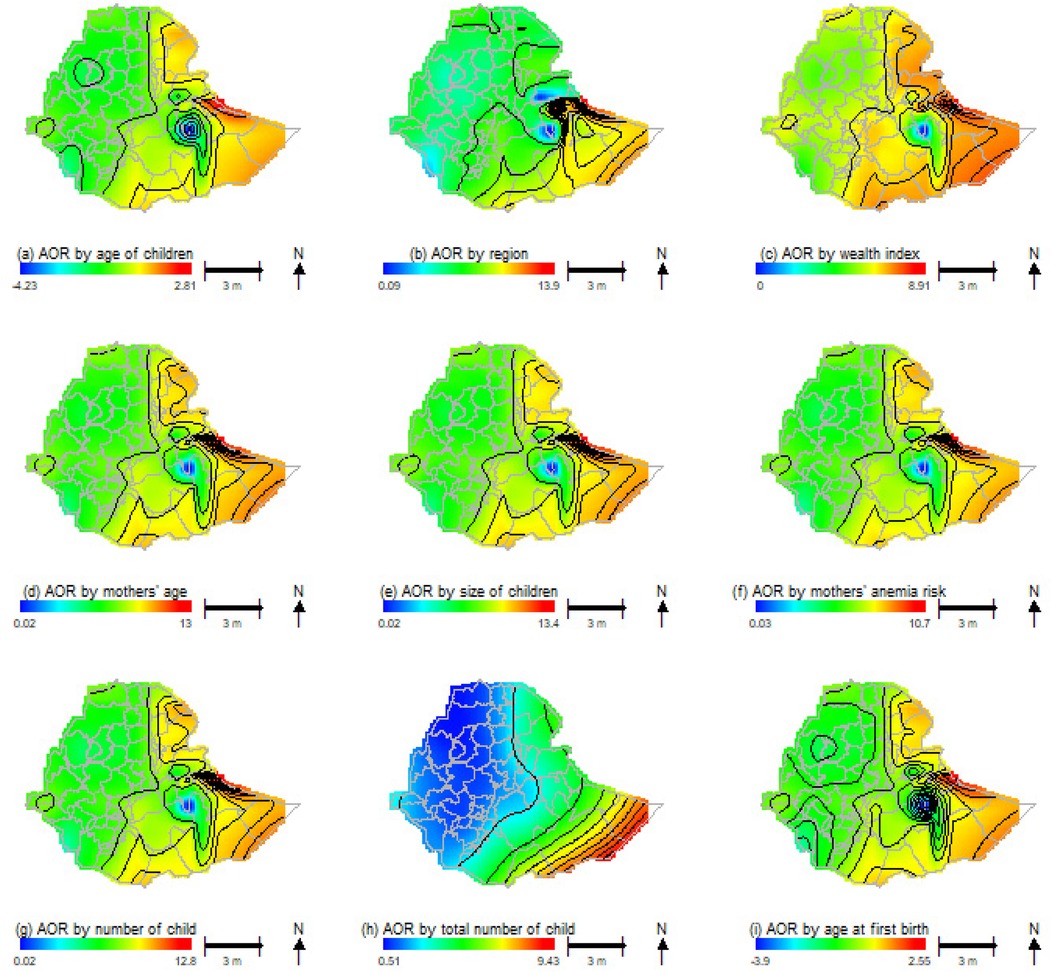
Figure 7. Nine maps display the Adjusted Odds Ratio (AOR) in Ethiopia by various factors: (a) children's age, (b) region, (c) wealth index, (d) mothers' age, (e) size of children, (f) mothers' anemia risk, (g) number of children, (h) total number of children, and (i) age at first birth. Each map uses a color gradient to represent AOR values, with a scale bar and north arrow for reference.
In the figure, key predictor variables including the child's current age in months, region, wealth index, maternal age, birth size of children, maternal anemia risk, number of children in the household, maternal age at first birth, and total number of children born show differing effects on anemia prevalence across various zones in Ethiopia when compared to their reference groups. Some regions exhibit a positive impact from these predictor variables, while others show negative effects.
The regions with the highest risk of child anemia are in the Northeastern, Eastern, and Southeastern parts of the country. In contrast, areas with the lowest risk can be found in the Northwestern, Western, and Southwestern regions. For instance, when factors such as wealth index, maternal anemia levels, and the age of the child are considered, the odds ratio for childhood anemia is considerably elevated in the Northeastern, Eastern, and Southeastern areas. On the other hand, the odds ratio for childhood anemia is significantly reduced in the Northwestern, Western, and central regions of the country.
4 Discussion
The purpose of this study is to consider the spatial inequalities and factors that influence childhood anemia in Ethiopian children aged 6–59 months from various zones. Though there were studies in spatial distributions of anemia prevalence at the regional and national levels (24, 34, 35), we are aware of that there was limited investigations explored on the spatial disparities across the zones using individual level data for smoothing the geolocation variables and adjusting linearly for confounding variables. Accordingly, the current study involved in mapping and visualizing the spatial effects adjusted for covariates, explicitly focusing on the risk of child anemia within the various administrative zones of Ethiopia. In contrast to other studies (24, 34, 35), the current analysis was mapped individual-level odds ratios across the zones, the third administration layer of the country. The odds ratios of the potential risk factors were estimated in relation to the zonal level geographical distributions of the prevalence of anemia among children aged 6–59 months. The odds ratios for the individual level variables, as indicated in Figure 7, linked to the geolocations were plotted in the administrative zones of Ethiopia (53, 54).
This study was in line with previous findings from HIV data conducted in South Africa and Ethiopia (52, 55). However, research in low- and middle-income nations were mapping the prevalence of anemia in those nations (56–58). Furthermore, other research on the prevalence of anemia in Ethiopia has mapped it across the second administration level (59). However, this methodology enabled spatially adjust the odds of individual variables to assess their spatial effects on the risk of anemia. Our findings are also consistent with research conducted in sub-Saharan Africa (60) providing additional validation for our conclusions.
The geospatial analysis reveals that most anemia hotspot areas were in zones of Somali, Afar, and Dire Dawa city administration, whereas the lowest anemia hotspots were primarily observed in zones of Amhara, Benishangul, and Addis Ababa. Anemia prevalence exhibited considerable variation among local administrations zones of Ethiopia. In the Afar region, the zones identified as high hotspots for anemia include Zone 1, Zone 5, and Shinile. Furthermore, Jijiga, East Hararge, Degahabur, Welewel, Shabelle, Liben, and Bale zones in Somalia region ranked among the highest hotspot areas. This was since these zones were primarily inhabited by pastoralist communities, experience seasonal mobility for livelihood, were frequently affected by drought, and were geographically remote, which limited access to transportation and health services. These indicated that, in comparison to other places, pastoralist communities are at a higher risk of anemia. These were due to different factors such as food insecurity, lower economic status, and nutritional deficiency (61, 62). In contrast, most zones in Amhara and Tigray regions were classified as low hotspot areas.
The observed regional and zonal variations may be attributed to differences in dietary habits, the distribution of infectious diseases, and the accessibility of maternal and child health care services (63). The socio-economic status of a household was significantly linked to the prevalence of anemia among children under 5 years of age. Children from households in the poorest and poorer wealth quantiles faced a higher risk of anemia, with probabilities exceeding 68.8% and 58.87%, respectively, when compared to their peers in the wealthiest quantile. This finding aligns with studies conducted in Ethiopia (25, 64–67), Sub-Saharan Africa (68), Nigeria (69), and Brazil (70, 71). This association may be attributed to the fact that children from wealthier households were more likely to have access to a balanced diet rich in macro and micronutrients, including essential vitamins and minerals, and appropriate medical care.
Research studies indicated that children from lower socioeconomic backgrounds were more susceptible to easily preventable diseases and various nutritional deficiencies, including anemia (61, 62, 72, 73). This was a consequence of the limited dietary variety often seen in rural households, which struggle with inadequate resources to provide balanced meals (23). In this study, over 80% of participants were from rural areas (74–78). Consequently, children from the poorest families were less likely to have access to a balanced diet, as they cannot afford or utilize a range of foods. This lack of dietary diversity increased their risk of poor health conditions, including anemia caused by factors such as parasitic infections.
Children aged 6–11 months were more likely to develop anemia compared to those older than 12 months. Studies conducted in Ethiopia (59, 79–81), Uganda (82), Sub-Saharan Africa (75), Togo (83), Bangladesh (74, 84), Brazil (85), Asia and India (86), Burma (71), Sydney (87), and Nepal (88) support this conclusion. One reason for this increased risk is that younger children had a higher need for micronutrients as they grow (72, 89). If they did not receive these essential nutrients, they may become anemic (72). Another explanation is that older children tend to have a more diversified diet, which often includes sufficient iron-rich foods, helping to prevent anemia (74, 90). Children over the age of one typically consumed a variety of iron-rich foods such as cereals, meats, poultry, and fish (91, 92). Moreover, nutritional issues were more prevalent in younger children than in older ones. Younger children, especially those living in unhygienic environments were also more vulnerable to infectious diseases like intestinal helminthes, as they may put contaminated objects in their mouths (93–95).
Children from households with more than two family members were more likely to be anemic compared to children from households with two or fewer family members. This finding was supported by research from Ethiopia (67, 79, 96, 97), Uganda (82), Sub-Saharan Africa (SSA) (75), Brazil (70, 98), India (99), Switzerland (90), and Burma (71). The higher incidence of anemia in larger families may be attributed to several factors, including increased transmission of communicable diseases, inadequate nutrient intake, and competition for food. Additionally, larger families may face challenges in accessing appropriate health care services, which can lead to infections and nutritional deficiencies (74, 100). These issues can worsen the quality of care for children and increase their risk of developing anemia (76).
Maternal anemia was significantly linked to the onset of childhood anemia, a correlation supported by studies conducted in Ethiopia (97), Togo (83), Cuba (101), Burma (71), Brazil (85, 98), Kuwait (102), and Nepal (88). This relationship can be attributed to children often sharing common environmental, socioeconomic, and dietary conditions with their mothers (103). Furthermore, inadequate maternal iron reserves during pregnancy and lactation can adversely affect the iron levels in their children (86, 99, 104). Additionally, maternal anemia increases the risks of low birth weight, premature delivery, and maternal mortality (105), all of which contribute to a higher likelihood of childhood anemia.
4.1 Limitations
EDHS collects data in every 5 years, however, due to national instability and the COVID-19 pandemic's effects, data was not gathered in 2021 after the 2016 round, and no further polls have been carried out. In 2011, the World Health Assembly (WHA) established goals to cut the risk of anemia in half by 2025. The Ethiopian government strives to meet the WHA targets, however we are uncertain if this has been accomplished or not because the data was not timely collected. In fact, there will be an expected discrepancies of the anemia prevalence within this 9 years gap. However, academicians, stakeholders, and national policy makers continue to use the 2016 EDHS data to inform policy decisions for the government's legislative body.
Geo-masking or geo-privacy might be impacted the estimations of the spatial effect by introducing bias and inaccuracy, which could result in incorrect interpretations of the spatial pattern or relationship. In this study, the latitude and longitude of survey clusters are moved by 0–2 km for urban regions and 0–5 km for rural areas. The focus of this study is spatial effects estimates at bigger area levels (zones and regions), therefore moving individuals’ location for privacy within certain distance might have an negative impact on the analysis.
5 Conclusion
This study found that children anemia in Ethiopia is highly influenced by both individual-level factors such as age of the child, age of the mother, wealth index, mother's anemia risk, age of first birth, and number of children in the family, and spatial determinants, notably in pastoralist zones in Afar and Somalia. These findings underscore the importance of using spatial models to uncover hidden zonal vulnerabilities. The significant geographical variation in childhood anemia risk over zones differed based on the spatially adjusted covariates. Notably, hotspot areas were predominantly located within pastoralist communities, especially in several zones of Ethiopia's Afar and Somali regions. Regional differences in anemia risk were shaped by factors such as maternal health, wealth index, and age of child, which varied across zones. These findings will aid policymakers in developing geographically targeted strategies to address and mitigate anemia risks effectively across the Ethiopian local level administrations.
Data availability statement
Publicly available datasets were analyzed in this study. This data can be found here: https://www.dhsprogram.com.
Ethics statement
The procedures and questionnaires for standard DHS surveys have been reviewed and approved by the ICF Institutional Review Board (IRB). Additionally, the country-specific DHS survey protocols are reviewed by the ICF IRB, as well as typically by an IRB in the host country. The ICF IRB ensures that the survey complies with U.S. Department of Health and Human Services regulations for the protection of human subjects (45 CFR 46), while the host country IRB ensures compliance with the laws and norms of that nation. In Ethiopia, the Central Statistical Agency (CSA) serves as the national statistical agency with a mandate to produce timely and accurate official statistics that support democracy, economic growth, and development in collaboration with international stakeholders. The CSA's ethics council has authorized the use of all DHS data. Before participating in the survey, all participants provided written informed consent. While the requirement for informed consent was waived for this study, no medical records were utilized, as it relied solely on the DHS dataset. We received formal permission from the DHS program to use the data for research purposes. The data is available at https://www.dhsprogram.com.
Author contributions
SY: Writing – original draft, Software, Investigation, Conceptualization, Supervision, Visualization, Data curation, Formal analysis, Writing – review & editing, Validation, Methodology. YS: Writing – review & editing, Supervision, Visualization, Validation. NN: Writing – review & editing, Supervision. D-GC: Writing – review & editing, Supervision.
Funding
The author(s) declare that no financial support was received for the research and/or publication of this article.
Acknowledgments
This work is partially supported by research from the South Africa National Research Foundation (NRF) and the South Africa Medical Research Council (SAMRC) through the South Africa DST-NRF-SAMRC SARCHI Research Chair in Biostatistics, Grant number 114613. The opinions expressed and the conclusions drawn in this work are solely those of the authors and do not necessarily reflect the views of the NRF and SAMRC.
Conflict of interest
The authors declare that the research was conducted in the absence of any commercial or financial relationships that could be construed as a potential conflict of interest.
Generative AI statement
The author(s) declare that no Generative AI was used in the creation of this manuscript.
Any alternative text (alt text) provided alongside figures in this article has been generated by Frontiers with the support of artificial intelligence and reasonable efforts have been made to ensure accuracy, including review by the authors wherever possible. If you identify any issues, please contact us.
Publisher's note
All claims expressed in this article are solely those of the authors and do not necessarily represent those of their affiliated organizations, or those of the publisher, the editors and the reviewers. Any product that may be evaluated in this article, or claim that may be made by its manufacturer, is not guaranteed or endorsed by the publisher.
Supplementary material
The Supplementary Material for this article can be found online at: https://www.frontiersin.org/articles/10.3389/fped.2025.1559140/full#supplementary-material
References
1. Walter T. Effect of iron-deficiency anemia on cognitive skills and neuromaturation in infancy and childhood. Food Nutr Bull. (2003) 24(4_suppl_1):S104–10. doi: 10.1177/15648265030244S107
2. Santos JN, Rates SPM, Lemos SMA, Lamounier JA. Consequences of anemia on language development of children from a public day care center. Rev Paul Pediatr. (2009) 27:67–73. doi: 10.1590/S0103-05822009000100011
3. Haas JD, Brownlie T 4th. Iron deficiency and reduced work capacity: a critical review of the research to determine a causal relationship. J Nutr. (2001) 131(2):676S–90S. doi: 10.1093/jn/131.2.676S
4. Lozoff B. Iron deficiency and child development. Food Nutr Bull. (2007) 28(4_suppl4):S560–71. doi: 10.1177/15648265070284S409
5. Oppenheimer SJ. Iron-deficiency anemia: reexamining the nature and magnitude of the public health problem. J Nutr. (2001) 131(2):616–35. doi: 10.1093/jn/131.2.697S
6. Grantham-McGregor S, Baker-Henningham H. Iron deficiency in childhood: causes and consequences for child development. Ann Nestlé. (2010) 68(3):105–19. doi: 10.1159/000319670
7. Birhan NA, Workineh AY, Wolde ZM, Abich E, Alemayehu GM, Nigussie A, et al. Determinants of community-acquired pneumonia among under-five children in Awi zone, northwest Ethiopia. Front Public Health. (2025) 13:1511263. doi: 10.3389/fpubh.2025.1511263
8. Kliegman RM, Blum NJ. Nelson Textbook of Pediatrics. 21th ed. Philadelphia, PA: Elsevier – Health Sciences Division (2021).
9. Estimates WGA. Edition global anaemia estimates in women of reproductive age, by pregnancy status, and in children aged 6–59 months (2021).
10. Warssamo BB, Belay DB, Chen D-G. Determinants of child malnutrition and morbidity in Ethiopia: a structural equation modeling approach. Front Pediatr. (2025) 13:1535957. doi: 10.3389/fped.2025.1535957
11. McLean E, Cogswell M, Egli I, Wojdyla D, De Benoist B. Worldwide prevalence of anaemia, WHO vitamin and mineral nutrition information system, 1993–2005. Public Health Nutr. (2009) 12(4):444–54. doi: 10.1017/S1368980008002401
12. Central Statistical Agency (CSA) [Ethiopia], ICF. Ethiopia demographic and health survey, Addis Ababa, Ethiopia and Calverton, Maryland, USA. (2016); 1.
13. Gebreweld A, Ali N, Ali R, Fisha T. Prevalence of anemia and its associated factors among children under five years of age attending at Guguftu health center, South Wollo, Northeast Ethiopia. PLoS One. (2019) 14(7):e0218961. doi: 10.1371/journal.pone.0218961
14. Melku M, Alene KA, Terefe B, Enawgaw B, Biadgo B, Abebe M, et al. Anemia severity among children aged 6–59 months in Gondar town, Ethiopia: a community-based cross-sectional study. Ital J Pediatr. (2018) 44(1):107. doi: 10.1186/s13052-018-0547-0
15. Engidaye G, Melku M, Yalew A, Getaneh Z, Asrie F, Enawgaw B. Under nutrition, maternal anemia and household food insecurity are risk factors of anemia among preschool aged children in Menz Gera Midir district, Eastern Amhara, Ethiopia: a community based cross-sectional study. BMC Public Health. (2019) 19(1):968. doi: 10.1186/s12889-019-7293-0
16. Wasihun AG, Teferi M, Negash L, Marugán J, Yemane D, McGuigan KG, et al. Intestinal parasitosis, anaemia and risk factors among pre-school children in Tigray region, northern Ethiopia. BMC Infect Dis. (2020) 20(1):379. doi: 10.1186/s12879-020-05101-8
17. Gebereselassie Y, BirhanSelassie M, Menjetta T, Alemu J, Tsegaye A. Magnitude, severity, and associated factors of anemia among under-five children attending Hawassa University teaching and referral hospital, Hawassa, Southern Ethiopia, 2016. Anemia. 2020. (2020).
18. Ministry of Health. Health sector transformation plan II (HSTP- II). Addis Ababa February. (2021).
19. Fenta HM, Zewotir T, Muluneh EK. Spatial data analysis of malnutrition among children under-five years in Ethiopia. BMC Med Res Methodol. (2021) 21(1):232. doi: 10.1186/s12874-021-01391-x
20. Wand H, Whitaker C, Ramjee G. Geoadditive models to assess spatial variation of HIV infections among women in local communities of Durban, South Africa. Int J Health Geogr. (2011) 10:28. doi: 10.1186/1476-072X-10-28
21. Xiang D. Fitting generalized additive models with the GAM procedure. SUGI Proceedings; Citeseer (2001).
22. Belay DB, Fenta HM, Birhan NA, Rad NN, Chen D-G. Spatial disparities of antenatal care utilization among pregnant women in sub-Saharan Africa: Bayesian geo-additive modelling approach. Front Public Health. (2025) 13:1517724. doi: 10.3389/fpubh.2025.1517724
23. Gebrehaweria Gebremeskel M, Lemma Tirore L. Factors associated with anemia among children 6–23 months of age in Ethiopia: a multilevel analysis of data from the 2016 Ethiopia demographic and health survey. Pediatric Health Med Ther. (2020) 11:347–57. doi: 10.2147/PHMT.S258114
24. Hailegebreal S, Nigatu AM, Mekonnen ZA, Endehabtu BF. Spatio-temporal distribution and associated factors of anaemia among children aged 6–59 months in Ethiopia: a spatial and multilevel analysis based on the EDHS 2005–2016. BMJ Open. (2021) 11(8):e045544. doi: 10.1136/bmjopen-2020-045544
25. Gebremeskel MG, Mulugeta A, Bekele A, Lemma L, Gebremichael M, Gebremedhin H, et al. Individual and community level factors associated with anemia among children 6–59 months of age in Ethiopia: a further analysis of 2016 Ethiopia demographic and health survey. PLoS One. (2020) 15(11):e0241720. doi: 10.1371/journal.pone.0241720
26. Birhan NA, Belay DB. Associated risk factors of underweight among under-five children in Ethiopia using multilevel ordinal logistic regression model. Afr Health Sci. (2021) 21(1):362–72. doi: 10.4314/ahs.v21i1.46
27. Enbeyle W, Bitew D, Marzo RR, Pandey D, Abebaw S, Belay A. Multilevel analysis of factors associated with underweight among under-five children in Ethiopia. J Pediatr Neuropsychol. (2022) 8(1):45–51. doi: 10.1007/s40817-021-00118-6
28. Tegegne AS, Belay DB. Predictors for time to recovery from sever acute malnutrition among under-five children admitted to therapeutic feeding unit at Dubti referral hospital, Afar region, Ethiopia. BMC Pediatr. (2021) 21(1):562. doi: 10.1186/s12887-021-03043-x
29. Alamirew WG, Belay DB, Zeru MA, Derebe MA, Adegeh SC. Prevalence and associated factors of neonatal mortality in Ethiopia. Sci Rep. (2022) 12(1):12124. doi: 10.1038/s41598-022-16461-3
30. Central Statistical Agency (CSA) [Ethiopia], ICF. Ethiopia demographic and health survey 2016. Addis Ababa, Ethiopia, and Rockville, Maryland, USA: CSA and ICF. Addis Ababa: Central Statistical Agency (CSA), Ethiopia and ICF, USA (2016).
31. Burgert CR, Colston J, Roy T, Zachary B. Geographic displacement procedure and georeferenced data release policy for the demographic and health surveys: ICF International. (2013).
32. Perez-Heydrich C, Warren JL, Burgert CR, Emch M. Guidelines on the use of DHS GPS data: ICF International. (2013).
33. Burgert CR, Prosnitz D. Linking DHS household and SPA facility surveys: data considerations and geospatial methods: ICF International. (2014).
34. Wasswa R, Kananura RM, Muhanguzi H, Waiswa P. Spatial variation and attributable risk factors of anaemia among young children in Uganda: evidence from a nationally representative survey. PLoS Global Public Health. (2023) 3(5):e0001899. doi: 10.1371/journal.pgph.0001899
35. Kuse KA, Jima DS, Chikako TU, Hagan JE Jr, Seidu A-A, Aboagye RG, et al. Individual, maternal, household, and community level variability in determining inequalities in childhood anaemia within Ethiopia: four-level multilevel analysis approach. Children. (2022) 9(9):1415. doi: 10.3390/children9091415
36. Frank TD, Carter A, Jahagirdar D, Biehl MH, Douwes-Schultz D, Larson SL, et al. Global, regional, and national incidence, prevalence, and mortality of HIV, 1980–2017, and forecasts to 2030, for 195 countries and territories: a systematic analysis for the global burden of diseases, injuries, and risk factors study 2017. Lancet HIV. (2019) 6(12):e831–59. doi: 10.1016/S2352-3018(19)30196-1
37. Ahmed KY, Thapa S, Hassen TA, Tegegne TK, Dadi AF, Odo DB, et al. Population modifiable risk factors associated with neonatal mortality in 35 sub-Saharan Africa countries: analysis of data from demographic and health surveys. EClinicalMedicine. (2024) 73:102682. doi: 10.1016/j.eclinm.2024.102682
38. Barber D. Bayesian Reasoning and Machine Learning. Cambridge: Cambridge University Press (2012).
39. Wei P, Lu Z, Song J. Variable importance analysis: a comprehensive review. Reliab Eng Syst Saf. (2015) 142:399–432. doi: 10.1016/j.ress.2015.05.018
40. Inglis A, Parnell A, Hurley CB. Visualizing variable importance and variable interaction effects in machine learning models. J Comput Graph Stat. (2022) 31(3):766–78. doi: 10.1080/10618600.2021.2007935
41. Wies C, Miltenberger R, Grieser G, Jahn-Eimermacher A. Exploring the variable importance in random forests under correlations: a general concept applied to donor organ quality in post-transplant survival. BMC Med Res Methodol. (2023) 23(1):209. doi: 10.1186/s12874-023-02023-2
42. Genuer R, Poggi J-M, Tuleau-Malot C. Variable selection using random forests. Pattern Recognit Lett. (2010) 31(14):2225–36. doi: 10.1016/j.patrec.2010.03.014
43. Nam Y, Han S. Random forest variable importance-based selection algorithm in class imbalance problem. arXiv preprint arXiv:231210573. (2023).
44. Epifanio I. Intervention in prediction measure: a new approach to assessing variable importance for random forests. BMC Bioinform. (2017) 18:230. doi: 10.1186/s12859-017-1650-8
45. Hastie TJ. Generalized additive models. In: Chambers JM, Hastie TJ, editors. Statistical Models in S. London: Routledge (2017). p. 249–307.
46. Bai L. Statistical methods for quantifying spatial effects on disease incidence using individual-level data. (2016).
47. Hurvich CM, Simonoff JS, Tsai C-L. Smoothing parameter selection in nonparametric regression using an improved akaike information criterion. J R Stat Soc Ser B Stat Method. (1998) 60(2):271–93. doi: 10.1111/1467-9868.00125
48. Bekara M, Hafidi B, Fleury G. Smoothing parameter selection in nonparametric regression using an improved Kullback information criterion. Proceedings of the Eighth International Symposium on Signal Processing and Its Applications; IEEE (2005).
49. Cleveland WS, Devlin SJ. Locally weighted regression: an approach to regression analysis by local fitting. J Am Stat Assoc. (1988) 83(403):596–610. doi: 10.1080/01621459.1988.10478639
50. Webster T, Vieira V, Weinberg J, Aschengrau A. Method for mapping population-based case-control studies: an application using generalized additive models. Int J Health Geogr. (2006) 5(1):26. doi: 10.1186/1476-072X-5-26
51. Bai L, Gillen DL, Scott MB, Verónica MV. Mapping smoothed spatial effect estimates from individual-level data: MapGAM. R J. (2020) 12(1):32. doi: 10.32614/RJ-2020-001
52. Ugwu CLJ, Ncayiyana JR. Spatial disparities of HIV prevalence in South Africa. Do sociodemographic, behavioral, and biological factors explain this spatial variability? Front Public Health. (2022) 10:994277. doi: 10.3389/fpubh.2022.994277
53. Yilema SA, Shiferaw YA, Zewotir T, Muluneh EK. Small area estimation of undernutrition under age five children based on spatial-temporal models. Sci World J. (2022) 2022(1):6882047. doi: 10.1155/2022/6882047
54. Yilema SA, Shiferaw YA, Zewotir TT, Muluneh EK. Spatial small area estimates of undernutrition for under five children in Ethiopia via combining survey and census data. Spat Spatiotemporal Epidemiol. (2022) 42:100509. doi: 10.1016/j.sste.2022.100509
55. Yilema SA, Shiferaw YA, Belay AT, Belay DB. Mapping the spatial disparities of HIV prevalence in Ethiopian zones using the generalized additive model. Sci Rep. (2024) 14(1):6215. doi: 10.1038/s41598-024-55850-8
56. Balarajan Y, Ramakrishnan U, Özaltin E, Shankar AH, Subramanian S. Anaemia in low-income and middle-income countries. Lancet. (2011) 378(9809):2123–35. doi: 10.1016/S0140-6736(10)62304-5
57. Seiler J, Wetscher M, Harttgen K, Utzinger J, Umlauf N. High-resolution spatial prediction of anemia risk among children aged 6 to 59 months in low-and middle-income countries. Commun Med. (2025) 5(1):57. doi: 10.1038/s43856-025-00765-2
58. Stevens GA, Paciorek CJ, Flores-Urrutia MC, Borghi E, Namaste S, Wirth JP, et al. National, regional, and global estimates of anaemia by severity in women and children for 2000–19: a pooled analysis of population-representative data. Lancet Glob Health. (2022) 10(5):e627–39. doi: 10.1016/S2214-109X(22)00084-5
59. Jember TA, Teshome DF, Gezie LD, Agegnehu CD. Spatial variation and determinants of childhood anemia among children aged 6 to 59 months in Ethiopia: further analysis of Ethiopian demographic and health survey 2016. BMC Pediatr. (2021) 21(1):497. doi: 10.1186/s12887-021-02901-y
60. Magalhães RJS, Clements AC. Spatial heterogeneity of haemoglobin concentration in preschool-age children in sub-Saharan Africa. Bull World Health Organ. (2011) 89:459–68. doi: 10.2471/BLT.10.083568
61. Ashenafi G, Aliyo A, Tesfa B. Burden and determinants of anemia among 6 to 59-month-old children in the pastoral communities of Borana, Borana zone, Southern Ethiopia. Sage Open Pediatr. (2025) 12:30502225251310547. doi: 10.1177/30502225251310547
62. Sahiledengle B, Mwanri L, Agho KE. Household environment associated with anaemia among children aged 6–59 months in Ethiopia: a multilevel analysis of Ethiopia demographic and health survey (2005–2016). BMC Public Health. (2024) 24(1):315. doi: 10.1186/s12889-024-17780-y
63. Woldemichael A, Takian A, Akbari Sari A, Olyaeemanesh A. Inequalities in healthcare resources and outcomes threatening sustainable health development in Ethiopia: panel data analysis. BMJ Open. (2019) 9(1):e022923. doi: 10.1136/bmjopen-2018-022923
64. Negussie ST, Nigatu RG. Trends in regional inequalities in childhood anemia in Ethiopia: evidence from the 2005–2016 Ethiopian demographic and health surveys. Discov Soc Sci Health. (2023) 3(1):7. doi: 10.1007/s44155-023-00038-0
65. Zegeye B, Ahinkorah BO, Ameyaw EK, Seidu A-A, Keetile M, Yaya S. Determining prevalence of anemia and its associated factors in Cameroon: a multilevel analysis. Biomed Res Int. (2021) 2021:9912549. doi: 10.1155/2021/9912549
66. Gari T, Loha E, Deressa W, Solomon T, Atsbeha H, Assegid M, et al. Anaemia among children in a drought affected community in south-central Ethiopia. PLoS One. (2017) 12(3):e0170898. doi: 10.1371/journal.pone.0170898
67. Woldie H, Kebede Y, Tariku A. Factors associated with anemia among children aged 6–23 months attending growth monitoring at Tsitsika health center, Wag-Himra Zone, Northeast Ethiopia. J Nutr Metab. (2015) 2015:928632. doi: 10.1155/2015/928632
68. Amegbor PM, Borges SS, Pysklywec A, Sabel CE. Effect of individual, household and regional socioeconomic factors and PM2. 5 on anaemia: a cross-sectional study of sub-Saharan African countries. Spat Spatiotemporal Epidemiol. (2022) 40:100472. doi: 10.1016/j.sste.2021.100472
69. Gayawan E, Arogundade ED, Adebayo SB. Possible determinants and spatial patterns of anaemia among young children in Nigeria: a Bayesian semi-parametric modelling. Int Health. (2014) 6(1):35–45. doi: 10.1093/inthealth/iht034
70. Cardoso MA, Scopel KK, Muniz PT, Villamor E, Ferreira MU. Underlying factors associated with anemia in amazonian children: a population-based, cross-sectional study. PLoS One. (2012) 7(5):e36341. doi: 10.1371/journal.pone.0036341
71. Zhao A, Zhang Y, Peng Y, Li J, Yang T, Liu Z, et al. Prevalence of anemia and its risk factors among children 6–36 months old in Burma. Am J Trop Med Hyg. (2012) 87(2):306. doi: 10.4269/ajtmh.2012.11-0660
72. Csoelle I, Felső R, Szabo E, Metzendorf M-I, Schwingshackl L, Ferenci T, et al. Health outcomes associated with micronutrient-fortified complementary foods in infants and young children aged 6–23 months: a systematic review and meta-analysis. Lancet Child Adolesc Health. (2022) 6(8):533–44. doi: 10.1016/S2352-4642(22)00147-X
73. Tessema ZT, Tesema GA, Ahern S, Earnest A. Bayesian spatio-temporal modelling of child anemia in Ethiopia using conditional autoregressive model. Sci Rep. (2022) 12(1):20297. doi: 10.1038/s41598-022-24475-0
74. Khan JR, Awan N, Misu F. Determinants of anemia among 6–59 months aged children in Bangladesh: evidence from nationally representative data. BMC Pediatr. (2016) 16:3. doi: 10.1186/s12887-015-0536-z
75. Moschovis PP, Wiens MO, Arlington L, Antsygina O, Hayden D, Dzik W, et al. Individual, maternal and household risk factors for anaemia among young children in sub-Saharan Africa: a cross-sectional study. BMJ Open. (2018) 8(5):e019654. doi: 10.1136/bmjopen-2017-019654
76. Habyarimana F, Zewotir T, Ramroop S. Structured additive quantile regression for assessing the determinants of childhood anemia in Rwanda. Int J Environ Res Public Health. (2017) 14(6):652. doi: 10.3390/ijerph14060652
77. Iglesias Vázquez L, Valera E, Villalobos M, Tous M, Arija V. Prevalence of anemia in children from Latin America and the Caribbean and effectiveness of nutritional interventions: systematic review and meta–analysis. Nutrients. (2019) 11(1):183. doi: 10.3390/nu11010183
79. Kawo KN, Asfaw ZG, Yohannes N. Multilevel analysis of determinants of anemia prevalence among children aged 6–59 months in Ethiopia: classical and Bayesian approaches. Anemia. (2018) 2018:3087354. doi: 10.1155/2018/3087354
80. Asresie MB, Fekadu GA, Dagnew GW. Determinants of anemia among children aged 6–59 months in Ethiopia: further analysis of the 2016 Ethiopian demographic health survey. Adv Public Health. (2020) 2020:3634591. doi: 10.1155/2020/3634591
81. Anteneh ZA, Van Geertruyden JP. Spatial variations and determinants of anemia among under-five children in Ethiopia, EDHS 2005-2016. PLoS One. (2021) 16(4):e0249412. doi: 10.1371/journal.pone.0249412
82. Kuziga F, Adoke Y, Wanyenze RK. Prevalence and factors associated with anaemia among children aged 6 to 59 months in Namutumba district, Uganda: a cross-sectional study. BMC Pediatr. (2017) 17(1):25. doi: 10.1186/s12887-017-0782-3
83. Nambiema A, Robert A, Yaya I. Prevalence and risk factors of anemia in children aged from 6 to 59 months in Togo: analysis from Togo demographic and health survey data, 2013–2014. BMC Public Health. (2019) 19:215. doi: 10.1186/s12889-019-6547-1
84. Uddin M, Sardar MH, Hossain M, Alam M, Bhuya MF, Uddin MM, et al. Prevalence of anaemia in children of 6 months to 59 months in Narayanganj, Bangladesh. J Dhaka Med Coll. (2010) 19(2):126–30. doi: 10.3329/jdmc.v19i2.7084
85. Osório MM, Lira PI, Batista-Filho M, Ashworth A. Prevalence of anemia in children 6-59 months old in the state of Pernambuco, Brazil. Rev Panam Salud Publica. (2001) 10(2):101–7. doi: 10.1590/S1020-49892001000800005
86. Kotecha PV. Nutritional anemia in young children with focus on Asia and India. Indian J Community Med. (2011) 36(1):8. doi: 10.4103/0970-0218.80786
87. Karr M, Alperstein G, Causer J, Mira M, Lammi A, Fett MJ. Iron status and anaemia in preschool children in Sydney. Aust N Z J Public Health. (1996) 20(6):618–22. doi: 10.1111/j.1467-842X.1996.tb01076.x
88. Khanal V, Karkee R, Adhikari M, Gavidia T. Moderate-to-severe anaemia among children aged 6–59 months in Nepal: an analysis from Nepal demographic and health survey, 2011. Clin Epidemiol Glob Health. (2016) 4(2):57–62. doi: 10.1016/j.cegh.2015.07.001
89. Malako BG, Teshome MS, Belachew T. Anemia and associated factors among children aged 6–23 months in Damot Sore District, Wolaita Zone, South Ethiopia. BMC Hematol. (2018) 18:14. doi: 10.1186/s12878-018-0108-1
90. Prieto-Patron A, Van der Horst K, Hutton ZV, Detzel P. Association between anaemia in children 6 to 23 months old and child, mother, household and feeding indicators. Nutrients. (2018) 10(9):1269. doi: 10.3390/nu10091269
91. James-McAlpine JM. Micronutrient supplementation and birth outcomes in south-east Queensland. Griffith University (2019).
92. UNICEF. The State of the World’s Children 2019: Children, Food and Nutrition: Growing Well in a Changing World. New York, NY: UNICEF (2019).
93. Kanan SO, Swar MO. Prevalence and outcome of severe malnutrition in children less than five-year-old in Omdurman paediatric hospital, Sudan. Sudan J Paed. (2016) 16(1):23.
94. Weatherhead JE, Hotez PJ. Worm infections in children. Pediatr Rev. (2015) 36(8):341–52; quiz 53. doi: 10.1542/pir.36.8.341
95. Montresor A, Mupfasoni D, Mikhailov A, Mwinzi P, Lucianez A, Jamsheed M, et al. The global progress of soil-transmitted helminthiases control in 2020 and world health organization targets for 2030. PLoS Negl Trop Dis. (2020) 14(8):e0008505. doi: 10.1371/journal.pntd.0008505
96. Gebreegziabiher G, Etana B, Niggusie D. Determinants of anemia among children aged 6–59 months living in Kilte Awulaelo Woreda, Northern Ethiopia. Anemia. (2014) 2014:245870. doi: 10.1155/2014/245870
97. Muchie KF. Determinants of severity levels of anemia among children aged 6–59 months in Ethiopia: further analysis of the 2011 Ethiopian demographic and health survey. BMC Nutr. (2016) 2(1):1–8. doi: 10.1186/s40795-016-0093-3
98. Gondim SSR, Diniz ADS, Souto RAD, Bezerra RGDS, Albuquerque ECD, Paiva ADA. Magnitude, time trends and factors associate with anemia in children in the state of Paraíba, Brazil. Rev Saude Publica. (2012) 46:649–56. doi: 10.1590/S0034-89102012005000055
99. Pasricha S-R, Black J, Muthayya S, Shet A, Bhat V, Nagaraj S, et al. Determinants of anemia among young children in rural India. Pediatrics. (2010) 126(1):e140–9. doi: 10.1542/peds.2009-3108
100. Feleke BE. Nutritional status and intestinal parasite in school age children: a comparative cross-sectional study. Int J Pediatr. (2016) 2016:1962128. doi: 10.1155/2016/1962128
101. Pita GM, Jiménez S, Basabe B, García RG, Macías C, Selva L, et al. Anemia in children under five years old in Eastern Cuba, 2005-2011. MEDICC Rev. (2014) 16:16–23. doi: 10.37757/MR2014.V16.N1.5
102. Al-Qaoud NM, Al-Shami E, Prakash P. Anemia and associated factors among Kuwaiti preschool children and their mothers. Alex J Med. (2015) 51(2):161–6. doi: 10.1016/j.ajme.2014.06.006
103. Shukla AK, Srivastava S, Verma G. Effect of maternal anemia on the status of iron stores in infants: a cohort study. J Family Community Med. (2019) 26(2):118. doi: 10.4103/jfcm.JFCM_115_18
104. Menon KC, Ferguson EL, Thomson CD, Gray AR, Zodpey S, Saraf A, et al. Effects of anemia at different stages of gestation on infant outcomes. Nutrition. (2016) 32(1):61–5. doi: 10.1016/j.nut.2015.07.009
Keywords: geolocations, semi-parametric, spatial, anemia, Ethiopia
Citation: Yilema SA, Shiferaw YA, Nakhaeirad N and Chen D-G (2025) Mapping the covariate-adjusted spatial effects of childhood anemia in Ethiopia using a semi-parametric additive model. Front. Pediatr. 13:1559140. doi: 10.3389/fped.2025.1559140
Received: 11 January 2025; Accepted: 31 July 2025;
Published: 21 August 2025.
Edited by:
Andrew S. Day, University of Otago, Christchurch, New ZealandReviewed by:
Zelalem Getahun Dessie, University of KwaZulu-Natal, South AfricaEmrullah Sonuç, Karabük University, Türkiye
Copyright: © 2025 Yilema, Shiferaw, Nakhaeirad and Chen. This is an open-access article distributed under the terms of the Creative Commons Attribution License (CC BY). The use, distribution or reproduction in other forums is permitted, provided the original author(s) and the copyright owner(s) are credited and that the original publication in this journal is cited, in accordance with accepted academic practice. No use, distribution or reproduction is permitted which does not comply with these terms.
*Correspondence: Seyifemickael Amare Yilema, c2FtYXJleTE5ODFAZ21haWwuY29t
†ORCID:
Seyifemickael Amare Yilema
orcid.org/0000-0002-9445-6038