 Balsam Said Abu Ghazza1
 Abdel Hamid El Bilbeisi
- 1Master Program of Clinical Nutrition, Faculty of Pharmacy, Al Azhar University of Gaza, Gaza Strip, Palestine
- 2Department of Clinical Nutrition, Faculty of Pharmacy, Al Azhar University of Gaza, Gaza Strip, Palestine
- 3Department of Nutrition, School of Medicine and Health Sciences, University of Palestine, Gaza Strip, Palestine
- 4Faculty of Pharmacy, Al Azhar University of Gaza, Gaza Strip, Palestine
Objective: This study aimed to examine the role of inflammation in the relationship between body mass index (BMI)-for-age and insulin resistance among first-grade students in the Gaza Strip.
Materials and methods: A cross-sectional study conducted between March and April 2023 involved 185 students, aged six, from five primary schools. Data were collected via structured questionnaires covering demographics, socio-economic status, lifestyle, and medical history. Anthropometric measurements, including BMI-for-age percentile, waist and hip circumferences, and blood pressure, were recorded. Biochemical analyses measured inflammatory markers (Hs-CRP, IL-6, adiponectin), fasting insulin, fasting plasma glucose, HDL-c, triglycerides, hemoglobin, and HOMA-IR. Statistical analysis was performed using SPSS version 25.
Results: The study found that 74.6% of students had normal BMI-for-age, while 14.1% were overweight, 8.1% obese, and 3.2% underweight. BMI categories were significantly associated with socio-economic factors, especially place of residence and paternal education. Paternal employment was linked to insulin resistance. A significant association was found between BMI-for-age and insulin resistance, with higher insulin resistance in overweight and obese children. Waist and hip circumferences were significantly linked to BMI and insulin resistance. Hs-CRP and fasting insulin were significantly associated with insulin resistance (P values > 0.05 for all).
Conclusion: The study confirms that childhood obesity is closely associated with both inflammation and insulin resistance. Elevated levels of IL-6, Hs-CRP, and insulin in obese children highlight the metabolic risks of childhood obesity. Socio-economic factors, including paternal education and place of residence, significantly influence BMI-for-age, suggesting the need for socio-economic considerations in obesity prevention efforts.
Introduction
Childhood obesity has emerged as a significant public health concern worldwide, with its prevalence rising in both developed and developing countries (1). The global prevalence of childhood obesity has been steadily rising, with nearly 340 million children and adolescents classified as overweight or obese (2). In the Gaza Strip, this trend has been driven by a combination of environmental, socioeconomic, and dietary factors (3).
Childhood obesity is associated with a range of health complications, including insulin resistance, which serves as a key precursor to type 2 diabetes and other metabolic disorders (4). One significant cluster of these obesity-related complications is pediatric metabolic syndrome, a condition characterized by a combination of abdominal obesity, hypertension, dyslipidemia, and impaired glucose metabolism. This syndrome not only reflects metabolic dysfunction in childhood but also serves as a predictor of future health issues, including type 2 diabetes and cardiovascular disease (5). Evidence suggests that children diagnosed with metabolic syndrome are more likely to carry these risk factors into adulthood, thereby significantly increasing their risk of developing cardiovascular conditions later in life. The early onset of these metabolic abnormalities underscores the importance of identifying and addressing contributing factors such as insulin resistance during childhood (6). Insulin resistance in children can lead to long-term health consequences, such as metabolic syndrome and cardiovascular diseases, highlighting the importance of understanding the contributing factors (5). Insulin resistance is a metabolic condition in which normal or elevated insulin levels fail to elicit the expected biological response, particularly in glucose metabolism (6). It is a significant risk factor for type 2 diabetes and is influenced by genetic and environmental factors, including poor diet, physical inactivity, and obesity (7). In children, obesity has emerged as the primary risk factor for insulin resistance, reflecting the complex relationship between excess adiposity and metabolic dysregulation (8). In this study, insulin resistance was assessed using the Homeostasis Model Assessment for Insulin Resistance (HOMA-IR), with a value greater than 3.16 used as the diagnostic threshold for identifying insulin resistance (9). Body Mass Index (BMI) is widely used to assess the nutritional status of children and adolescents. Specifically, BMI-for-age is a valuable tool for classifying children into weight status categories, such as underweight, normal weight, overweight, and obese. However, BMI does not fully reflect the metabolic disturbances associated with obesity (10). Consequently, examining biomarkers that indicate metabolic dysfunction is essential for better understanding the link between weight status and insulin resistance (11).
Inflammation is a key factor influencing insulin resistance. Obesity often leads to a chronic low-grade inflammatory state, marked by elevated levels of pro-inflammatory cytokines such as interleukin-6 (IL-6) and high-sensitivity C-reactive protein (Hs-CRP). These inflammatory markers interfere with insulin signaling, contributing to insulin resistance (12). While the connection between inflammation and obesity-related insulin resistance is well established, the specific mechanisms and the extent of inflammation's role in this relationship remain unclear (13).
In the context of the Gaza Strip, a region facing challenges like political instability, limited healthcare access, and food insecurity, childhood obesity and insulin resistance are pressing concerns (14). To the best of our knowledge, while the relationship between BMI and insulin resistance in children is gaining attention, there is limited research on the role of inflammation in this connection within the Gaza Strip population. Understanding how inflammation impact the link between BMI-for-age and insulin resistance is critical for developing targeted interventions to address obesity and its related metabolic disorders in this vulnerable group. Additionally, the findings may offer valuable insights into potential strategies for early intervention and the prevention of insulin resistance, particularly in regions where childhood obesity is on the rise and healthcare resources are limited. Therefore, the current study was conducted to investigate the role of inflammation in the association between BMI-for-age percentile and insulin resistance among first-grade students, aged six, in primary governmental schools in the Gaza Strip.
Materials and methods
Study design
This observational, descriptive, and analytical cross-sectional study aimed to investigate the role of inflammation in the association between BMI-for-age percentile and insulin resistance among first-grade students, aged six, in primary governmental schools in the Gaza Strip.
Study setting and period
The study took place between March 25 and April 27, 2023, before the Gaza war, and involved first-grade students from primary schools in the five Gaza governorates.
Study population
The study focused on six-year-old first-grade students of both genders from primary schools across the five Gaza governorates: North Gaza, Gaza City, Middle Area, Khan Yunis, and Rafah Governorates.
Eligibility criteria
In the current study, the inclusion criteria consisted of six-year-old first-grade students of both genders who were healthy, free from mental disabilities, and had parental consent. In contrast, children with psychiatric disorders, chronic illnesses, diabetes, medications affecting weight, endocrine or inflammatory conditions, and twins were excluded.
Sample size and sampling technique
Sample size: According to a recent report from the Palestinian Ministry of Education, the projected number of first-grade students in governmental primary schools across the five Gaza governorates was approximately 22,917 (15). In this study, a representative sample of 185 first-grade students from primary governmental schools was selected, with the sample size calculated using the Charan and Biswas formula (16).
Sample technique: After applying the inclusion and exclusion criteria, a total of 185 six-year-old participants of both genders were proportionally selected from first-grade students at the five main primary governmental schools across the Gaza Strip's five governorates, based on population density. The distribution was as follows: 31 from North Gaza, 75 from Gaza City, 36 from the Middle Area, 28 from Khan Yunis, and 15 from Rafah.
Data collection
Interview-based questionnaire
A pre-tested, interview-based questionnaire collected data on demographic, socio-economic, medical history, lifestyle factors, anthropometric, and biochemical measurements from the study participants.
Demographic socio-economic variables
The demographic and socio-economic section of the questionnaire collected information on family background, including the mother's and child's details, school stage, family income, parental employment, residence, education levels, and family size. This data was crucial for interpreting the study's results.
Medical history variables
The medical history section of the questionnaire collected data on the child's health, including any medical conditions, food allergies, weight changes, and appetite. It also reviewed maternal health during pregnancy, asking about complications like hypertension or gestational diabetes. This information provided key insights into the child's health.
Life style variables (breastfeeding, physical activity and nutritional behavior)
The lifestyle section of the questionnaire gathered data on infant feeding practices, including breastfeeding duration, and identified the family member responsible for meals. It also asked about the child's daily meals and snacks, providing insights into nutritional behavior and family involvement in feeding.
Assessment of physical activity
The lifestyle section of the questionnaire assessed physical activity using the physical activity questionnaire for children (PAQ-C), which measures activity over the past week. It covers various activities, including sports and physical education. The responses are scored on a 5-point scale, with the final score indicating the child's physical activity level. Based on this, children were classified into low, moderate, or high physical activity levels (17).
Assessment of dietary intakes and nutritional behavior
The Food Frequency Questionnaire (FFQ), validated in Arabic and adapted for the Palestinian context, was used to assess the children's food consumption over the past year (18, 19). Parents provided information on food groups like carbohydrates, vegetables, fruits, meats, dairy, beverages, and snacks. Responses were rated on a 4-point Likert scale from 1 (“Once a day”) to 4 (“Do not consume”). Based on the total score for 13 items, children were categorized as having Unhealthy (score < 60%), Moderate (score 60%–79%), or Healthy (score 80%–100%) eating practices, following Bloom's Taxonomy (20, 21).
Anthropometric measurements
Weight (kg): Children's weight was measured using a digital scale (SECA, Germany), with two readings taken and averaged for accuracy. The scale was calibrated at the start and end of each day, with adjustments made if calibration errors exceeded 0.1 kg. Weight was interpreted using age- and sex-specific World Health Organization (WHO) growth reference percentiles for children aged 5 to 19 years (22).
Height (cm): Children's height was measured using a stadiometer, following standard procedures, to the nearest 0.5 cm. Two measurements were taken, and the average was used. The height data were also evaluated according to WHO age- and sex-specific growth percentiles (23).
Body Mass Index (kg/m2): BMI was calculated by dividing weight in kilograms by height in meters squared. The BMI-for-age percentiles were determined using the WHO AnthroPlus software, which classifies children into underweight (<5th percentile), normal weight (5th–84.9th percentile), overweight (85th–94.9th percentile), and obese (≥95th percentile) (24).
Waist circumference (cm): Waist circumference was measured with a stretch-resistant tape, with children standing relaxed and breathing normally. The tape was placed at the midpoint between the rib and iliac crest, and the measurement was recorded after the child exhaled. The measurement was taken twice, and the average was used (25).
Hip circumference (cm): Hip circumference was measured with a stretch-resistant tape at the level of the greater trochanter. The child stood relaxed with feet apart, and the measurement was taken after ensuring the tape was level and the child was breathing normally (26). The measurement was recorded twice, with the average as the final result.
Blood pressure (mmHg): Blood pressure was measured three times using a mercury sphygmomanometer in a quiet setting, with the child seated and relaxed. The average of the three readings was recorded. Blood pressure values were interpreted using age-, sex-, and height-specific percentiles based on international pediatric blood pressure reference charts, with elevated blood pressure defined as systolic or diastolic blood pressure ≥ the 90th percentile for age, sex, and height (27).
Child's biochemical measurements
Venous blood samples were collected after 12 h of fasting for various biochemical analyses, including: Fasting insulin (µU/ml), fasting plasma glucose (mg/dl), hemoglobin (g/dl), interlukin_6 (pg/ml), adiponectin (µg/ml), high-sensitivity C-reactive protein (Hs CRP) (mg/L), high-density lipoprotein-cholesterol (HDL-c) (mg/dl), and triglyceride (mg/dl). The tests were performed using a Mindray BS-300 chemistry analyzer with ELISA kits, and the processing was done at a licensed private laboratory.
Fasting plasma glucose (mg/dl): In healthy six-year-old children, the typical range for normal fasting blood glucose is below 100 mg/dl. A level between 100 and 125 mg/dl is considered impaired fasting glucose, often referred to as prediabetes. Levels above 126 mg/dl usually indicate diabetes (28).
Hemoglobin (g/dl): In healthy six-year-old children, the normal hemoglobin level typically ranges between 11.5 and 15.5 g/dl (29).
Interlukin_6 (pg/ml): In healthy six-year-old children, IL-6 levels are typically below 10 pg/ml. Levels above 10 pg/ml can indicate inflammation, as seen in conditions like obesity, chronic inflammation, or sepsis (30).
Adiponectin (µg/ml): In healthy six-year-old children, adiponectin levels typically range from 3 to 30 µg/ml. Lower levels are often seen in children with higher BMI and insulin resistance (31).
Hs-CRP (mg/L): In healthy six-year-old children, Hs-CRP levels are typically below 1 mg/L. Levels between 1 and 3 mg/L indicate minor infections or low-grade inflammation, often seen with viral infections or mild obesity-related inflammation (32).
HDL-c (mg/dl): In healthy six-year-old children, HDL-c levels are typically above 45 mg/dl, as it is considered the “good” cholesterol (33).
Triglyceride (mg/dl): In healthy six-year-old children, normal triglyceride levels are below 75 mg/dl. Levels between 75 and 99 mg/dl are borderline high, and levels above 100 mg/dl are considered high (34).
Homeostasis Model Assessment of Insulin Resistance (HOMA-IR): In the current study, HOMA-IR was calculated to define insulin resistance using the following formula: HOMA-IR = (Fasting plasma glucose × Fasting insulin)/405 (35). For healthy six-year-old children, a HOMA-IR >3.16 is considered the diagnostic threshold for insulin resistance (9).
Pilot study
A pilot study involving twenty participants was conducted to evaluate the questionnaire and data collection methods. Feedback from this pilot led to adjustments in the questionnaire to improve clarity and accuracy for the main study.
Statistical analysis
Statistical analysis was performed using the Statistical Package for Social Sciences (SPSS) version 25. Data are expressed as means ± standard deviations (SD) for continuous variables and as percentages for categorical variables. Differences between means were tested using the independent sample t-test and one-way ANOVA. The chi-square test was used to examine differences in the prevalence of categorical variables. A P-value of less than 0.05 was considered statistically significant.
Results
The study, involving 185 six-year-old children, with 43.8% males and 56.2% females. Most families (98.4%) had a monthly income below 1974 NIS, and a higher percentage of fathers (17.8%) were employed compared to mothers (2.2%). Most children (84.3%) lived in urban areas, particularly Gaza City (40.5%). In terms of BMI-for age, 74.6% were of normal weight, 14.1% overweight, 8.1% obese, and 3.2% underweight. No significant relationship was found between gender, family income, parental employment, or the number of family members and BMI-for age categories. However, significant differences were noted in BMI based on place of residence (P = 0.001), governorate (P = 0.008), and the father's education level (P = 0.047). Obesity was more common in cities, especially Gaza City, while underweight was more prevalent in villages, particularly Khan Younis. The father's education level was associated with BMI, with children of illiterate fathers having higher obesity rates. The mother's education level did not show a significant association with BMI. These findings highlight the influence of socio-economic factors, particularly place of residence and paternal education, on childhood BMI-for age as shown in Table 1.
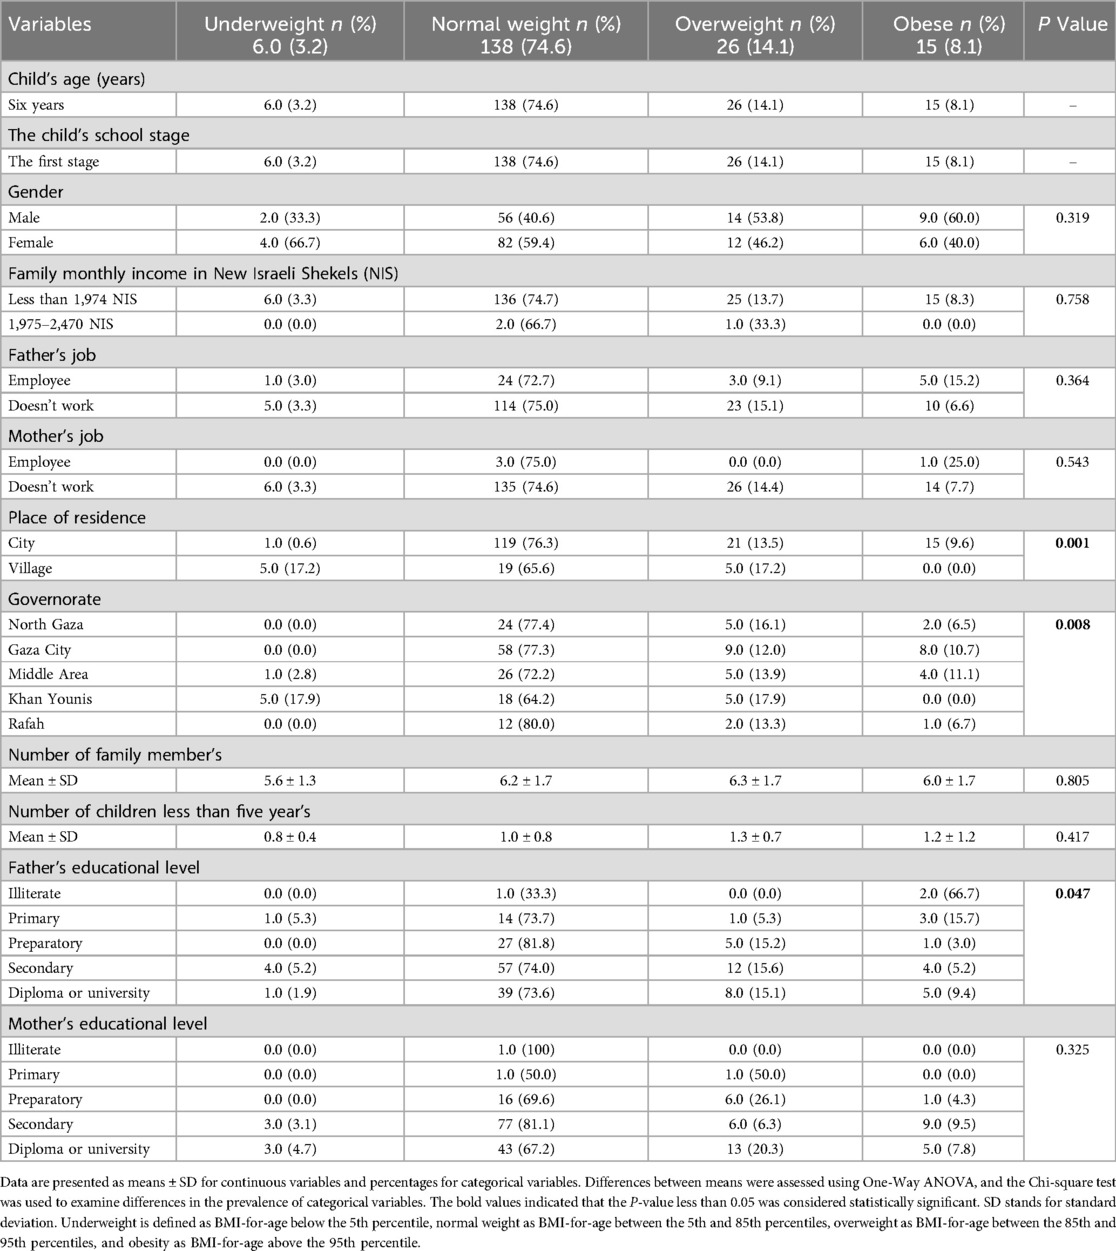
Table 1. The relationship between demographic socio-economic variables and body mass index for age categories of the study participants.
Table 2 reveals significant differences across BMI categories in weight, height, waist circumference, and hip circumference, with weight showing a progressive increase from underweight (18.3 ± 1.1 kg) to obese children (29.6 ± 6.1 kg) and significant differences in height (P = 0.002), waist (P = 0.001), and hip circumference (P = 0.001). However, no significant differences were found in systolic (P = 0.427) or diastolic (P = 0.300) blood pressure across BMI categories. Additionally, no significant associations were found between BMI-for-age and variables such as pathological problems, food allergies, recent weight changes, or type of delivery (P > 0.05). Children with poor appetite showed a slightly higher obesity prevalence (13.8%), but this was not statistically significant (P = 0.275). Pregnancy complications, childbirth issues, and birth weight did not significantly affect BMI-for-age, although mean birth weight increased from underweight to obese categories without statistical significance (P = 0.307). These findings suggest that medical history factors did not significantly influence BMI-for-age in this sample.
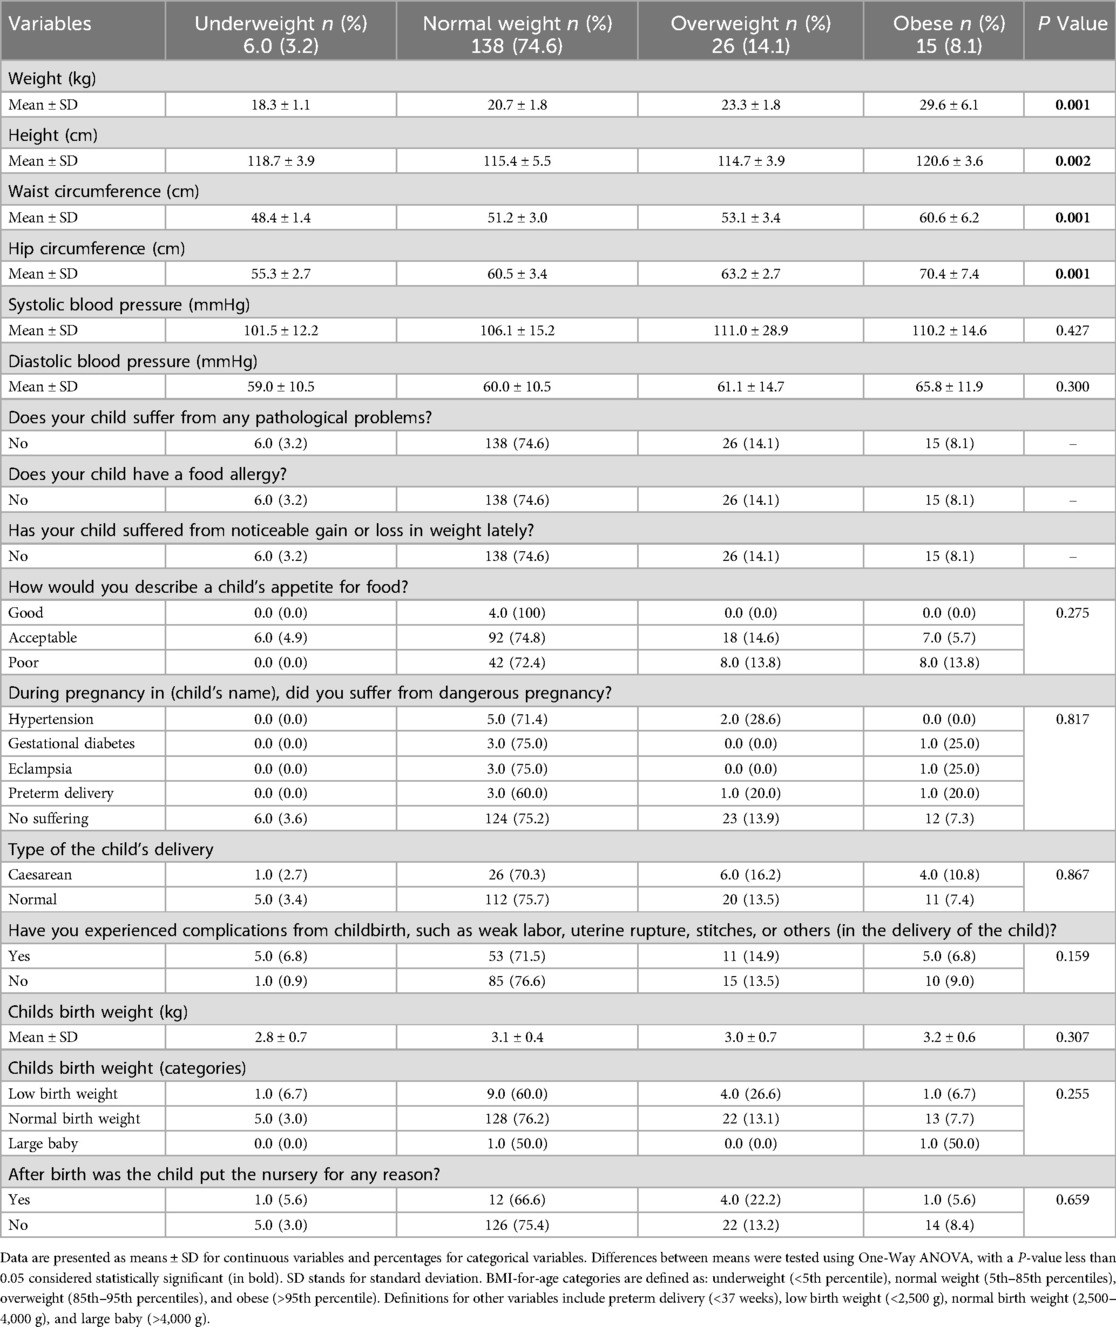
Table 2. The relationship between anthropometric measurements and medical history variables and body mass index for age categories of the study participants.
Table 3 found no statistically significant associations between various life style variables and BMI categories, as all P-values exceeded 0.05. Most participants were breastfed naturally, with a higher percentage in the normal weight category. Formula-fed children had a slightly higher prevalence of overweight, but this was not statistically significant. Exclusive breastfeeding for over six months was linked to a lower overweight rate compared to mixed feeding. The duration of breastfeeding had no significant effect on BMI categories, although longer breastfeeding durations were associated with higher mean BMI values. Feeding practices and meal frequency showed no significant relationship with BMI. Physical activity levels did not show a significant correlation with BMI; however, children with higher levels of physical activity had a higher prevalence of overweight, whereas those with lower activity levels had a lower prevalence (P = 0.263).
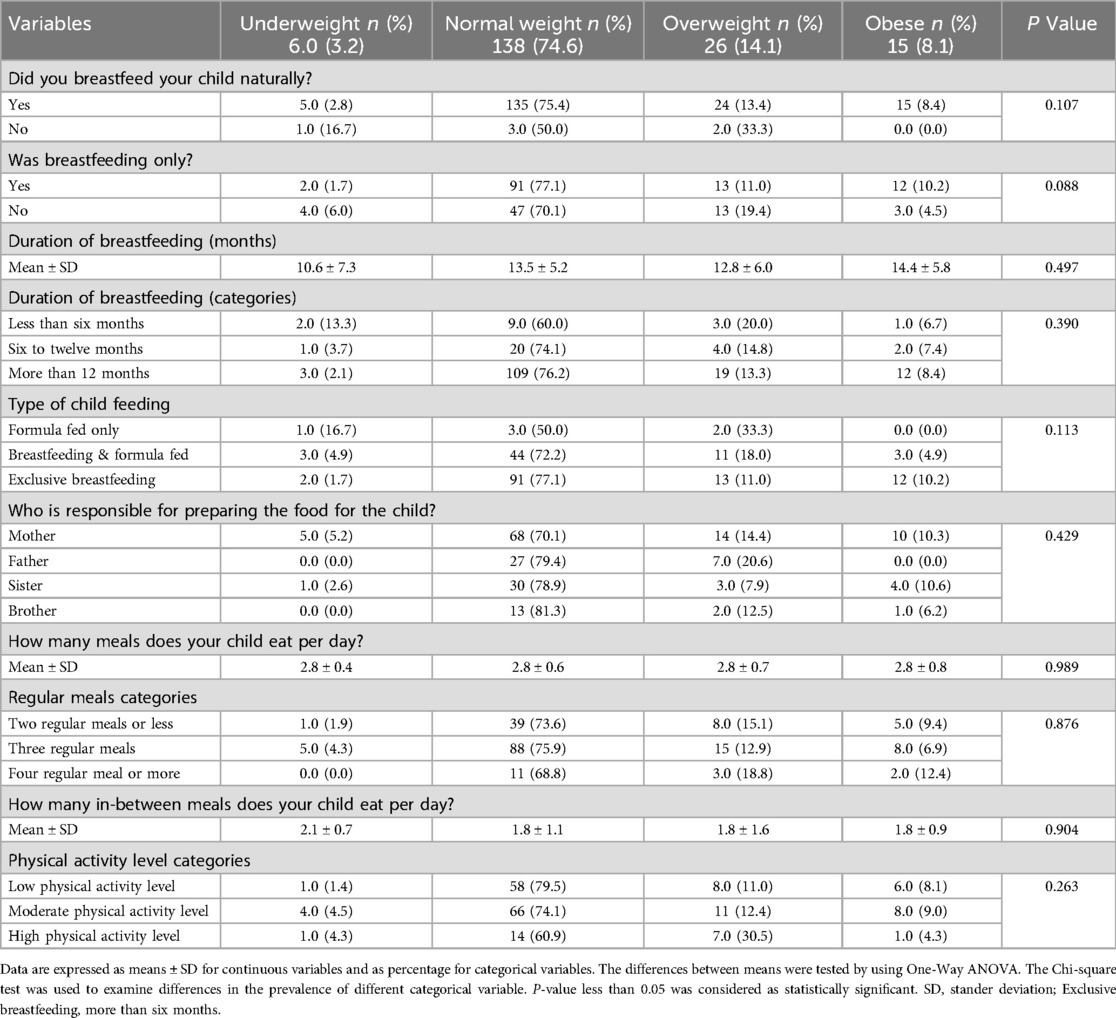
Table 3. The relationship between life style variables (breastfeeding, and physical activity levels) and body mass index for age categories of the study participants.
Table 4 examines eating habits across various food groups and finds no statistically significant associations between individual food groups and BMI-for-age categories (P-values ranging from 0.118 to 0.886). However, trends showed that children in the underweight category had distinct eating patterns, such as higher adherence to healthy eating practices for vegetables and salads (5.3%). Despite this, no significant differences were found in fast food or fruit consumption. When assessing overall eating practices, a significant difference in the average eating practice score was found (P = 0.025), with the underweight category reporting the highest score (2.3 ± 0.2) compared to other BMI categories. Unhealthy eating practices were most common in the normal weight group. These findings suggest that while individual food group consumption did not correlate with BMI-for-age, the underweight group reported better overall eating habits.
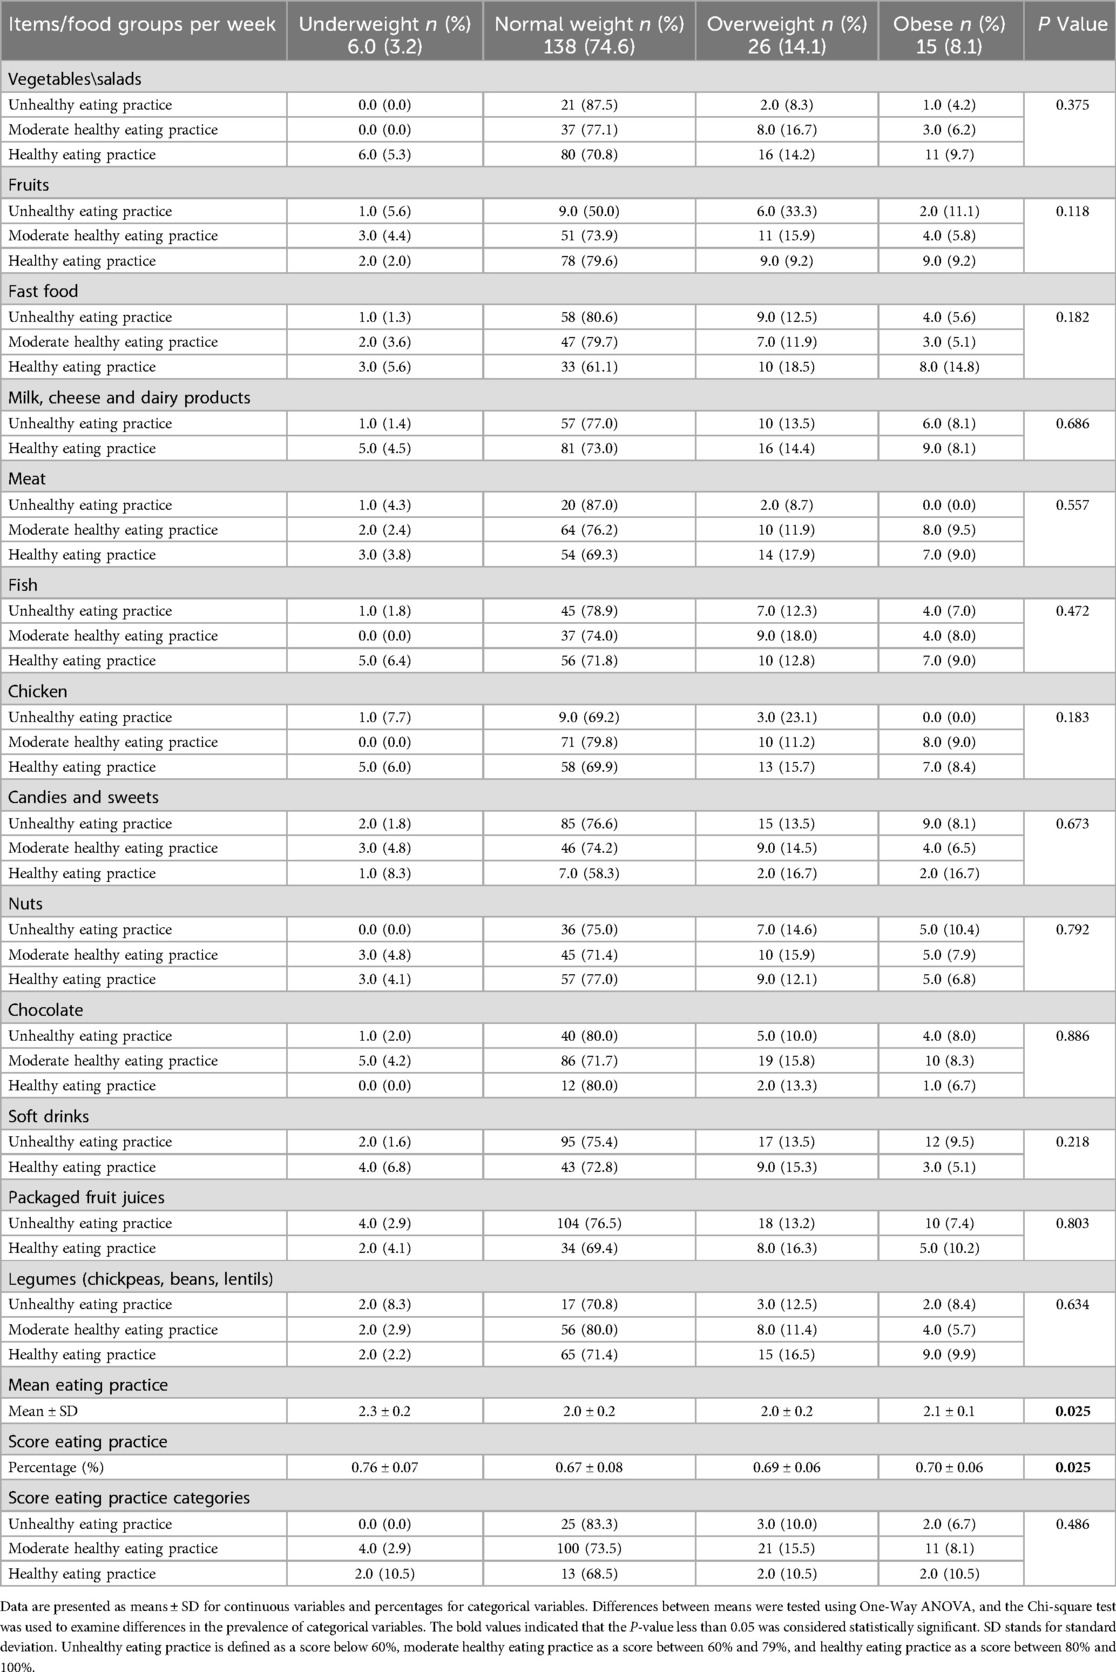
Table 4. The relationship between eating practices using the food frequency questionnaire and body mass index for age categories of the study participants.
Table 5 analyzes biochemical markers across different BMI categories (underweight, normal weight, overweight, and obese children). Fasting plasma glucose and hemoglobin levels showed no significant differences across BMI categories. However, IL-6 levels were significantly higher in obese children (P = 0.001), indicating a link between obesity and inflammation. Hs-CRP levels were also significantly higher in obese children (P = 0.033), with a large proportion of obese children having elevated levels (P = 0.001). Adiponectin levels did not differ significantly across BMI categories (P = 0.462).
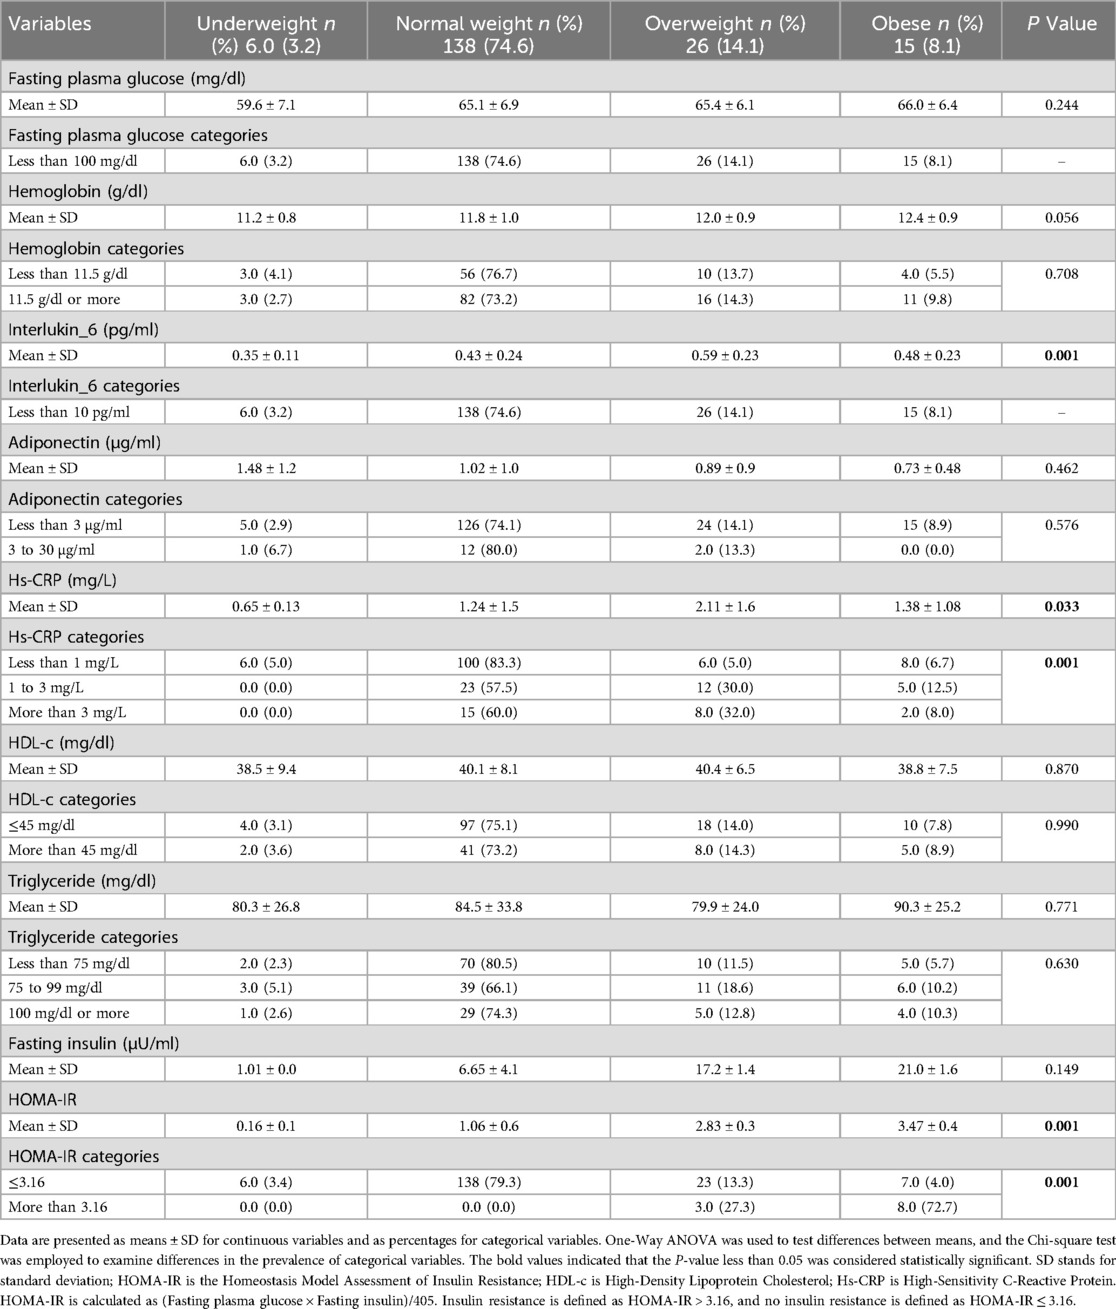
Table 5. The relationship between biochemical measurements and body mass index for age categories of the study participants.
There were no significant differences for HDL-c and triglycerides (P = 0.870 and P = 0.771), but fasting insulin and HOMA-IR levels were significantly associated with BMI (P = 0.001). Overweight and obese children had higher fasting insulin levels, and obese children had the highest HOMA-IR values, indicating insulin resistance. A significant proportion of obese children (72.7%) exhibited insulin resistance, confirming the link between obesity and metabolic changes.
In conclusion, markers of inflammation and insulin resistance, including IL-6, Hs-CRP, fasting insulin, and HOMA-IR, were significantly associated with BMI-for-age categories, with obese children showing higher levels of both inflammation and insulin resistance. Other markers, such as fasting plasma glucose, hemoglobin, adiponectin, HDL-c, and triglycerides, showed no significant associations with BMI.
Discussion
To the best of our knowledge, this is one of the first study in the Gaza Strip, which investigated the role of inflammation in the relationship between BMI-for-age and insulin resistance among the first-grade students in the Gaza Strip. The main results reveal significant associations between obesity, inflammation, and insulin resistance, which align with existing research linking childhood obesity to inflammatory biomarkers and metabolic issues (36, 37). In addition, this study also highlights socio-economic influences on BMI in the Gaza Strip, particularly the impact of paternal education and urban vs. rural living.
However, beyond understanding the immediate relationship between obesity, inflammation, and insulin resistance, these findings also have significant clinical relevance, particularly concerning the long-term risk of cardiovascular disease. As evidenced by a recent study (38), childhood obesity, characterized by increased BMI, insulin resistance, and hyperinsulinemia, is associated with early cardiovascular morbidity and mortality. Given the high prevalence of obesity, insulin resistance, and inflammation in the pediatric population of the Gaza Strip, it is crucial to implement early prevention strategies to reduce long-term cardiovascular risks. Key approaches include promoting healthy diets and physical activity, especially in urban areas with high access to processed foods, and creating safe spaces for exercise. Targeted interventions should focus on at-risk populations, particularly children from lower socio-economic backgrounds, by educating parents and improving access to healthy food and healthcare. Early screening and monitoring of metabolic risk factors, such as insulin resistance and inflammatory markers, are essential for timely interventions. Additionally, integrating cardiovascular risk education into school programs and establishing community-based initiatives offering resources like healthy food and fitness programs can further support healthier lifestyles across all socio-economic groups.
The study found that two critical inflammatory markers, IL-6 and Hs-CRP, were significantly higher in obese children. These findings are consistent with prior research that has shown childhood obesity is often linked to chronic low-grade inflammation (39, 40). IL-6 and Hs-CRP are well-known indicators of inflammation, and their elevated levels in obese children suggest that obesity is not only a result of poor diet and inactivity but also an inflammatory condition (41). Gokulakrishnan et al. (42) in a previous study have reported similar findings, where higher IL-6 and CRP levels were seen in obese children, with links to insulin resistance and other metabolic problems. The results of the current study support these findings.
The association between increased IL-6 and Hs-CRP levels and obesity in this study supports the hypothesis that inflammation plays a significant role in obesity-related metabolic dysfunctions. This is crucial because adipose tissue inflammation can disrupt insulin signaling, contributing to insulin resistance (43). This study found that 72.7% of obese children had insulin resistance, which aligns with studies like those of Cheng et al. (44), where higher BMI was associated with elevated fasting insulin and HOMA-IR, indicating insulin resistance.
This study also highlighted the role of socio-economic factors in BMI-for-age categories, particularly place of residence and paternal education level. Children from urban areas, especially Gaza City, were more likely to be obese, while those from rural areas like Khan Younis showed higher rates of underweight. These results are in line with previous study that has found urbanization to be a factor in higher obesity rates, often due to greater access to processed foods and more sedentary lifestyles in urban settings (45). Additionally, paternal education level was found to influence children's BMI, with those having less-educated fathers more likely to be obese. This supports the idea that parental education plays a significant role in shaping children's health behaviors and nutrition (46). The low socio-economic status of the families, with most earning below 1974 NIS per month, further suggests that limited access to healthy food, healthcare, and opportunities for physical activity can significantly influence children's BMI. The study found no significant associations between physical activity, eating habits, or breastfeeding practices and BMI categories. While breastfeeding duration has been shown in some studies to help prevent obesity, this study found no significant effect, although there were trends suggesting that exclusive breastfeeding for over six months might reduce overweight prevalence. The lack of a clear correlation between physical activity levels and BMI in this study could be due to confounding factors such as diet, sedentary behaviors, and genetic influences, which may mask the expected benefits of physical activity. Despite increased physical activity, children might still consume unhealthy diets or engage in excessive screen time, undermining the positive effects of exercise. This highlights the complexity of childhood obesity, emphasizing the need for a holistic approach that includes promoting physical activity, improving dietary habits, reducing sedentary behaviors, and addressing socio-economic barriers to healthier living.
Regarding dietary habits, the study found no significant links between specific food groups and BMI categories, although children in the underweight category appeared to have healthier eating practices. This suggests that while diet may not directly influence BMI in this cohort, children who are underweight might be more likely to engage in health-conscious eating behaviors. This observation warrants further exploration, as children in the underweight category may have different eating habits compared to those in the normal or obese categories. In the current study, children with poor appetite showed a slightly higher obesity prevalence. The paradoxical finding that children with poor appetite have a slightly higher obesity prevalence may be due to factors like altered satiety regulation or caregiver misperception. Children with poor appetite may eat irregularly, consuming small amounts of calorie-dense foods, or caregivers may offer larger portions to compensate, leading to excess calorie intake. Hormonal imbalances affecting hunger and fullness signals could also contribute to overeating, despite a lack of initial hunger. This highlights the complex relationship between appetite, eating behavior, and obesity, influenced by both physiological and caregiver factors. Previous research also examines the connection between birth weight and BMI, highlighting how birth weight impacts the risk of childhood obesity, with both low and high birth weight leading to distinct patterns of BMI development as children grow (47, 48).
The study also analyzed biochemical markers, finding no significant differences in fasting plasma glucose and hemoglobin levels across BMI categories. However, insulin resistance was markedly higher in obese children, as indicated by elevated fasting insulin and HOMA-IR levels. These findings are consistent with other research showing that elevated insulin levels are commonly seen in obese children and serve as early indicators of metabolic issues such as type 2 diabetes (49). Conversely, markers like HDL-c, triglycerides, and adiponectin did not differ significantly across BMI categories, suggesting that while obesity is linked to inflammation and insulin resistance, it may not yet cause substantial alterations in lipid metabolism or adipokine levels in children of this age group. While obesity is associated with inflammation and insulin resistance, it may not significantly impact lipid metabolism or adipokine levels in younger children. However, the relationship between inflammation and dyslipidemia is well-established, particularly in obese adults. Chronic mild inflammation can disrupt lipid metabolism, leading to imbalances in lipid profiles and increasing the risk of dyslipidemia and cardiovascular diseases later in life (5). This highlights the potential long-term metabolic consequences of childhood obesity, even before substantial lipid changes occur.
Actually, the cause-and-effect relationship between obesity and inflammation is not yet fully understood, and there appears to be a complex, cyclical interaction between the two. Obesity often leads to a chronic low-grade inflammatory state, with excess adipose tissue producing pro-inflammatory cytokines that impair insulin signaling and contribute to metabolic dysfunction. In turn, this inflammation exacerbates obesity by disrupting metabolic processes, further promoting fat accumulation. This creates a vicious cycle where obesity induces inflammation, and inflammation, in turn, worsens obesity and its associated health risks, making it difficult to break the cycle without targeted interventions (6). Understanding this interplay is crucial for addressing obesity-related health issues.
Strength and limitations
The main strength of our study lies in being one of the first to explore the role of inflammation in the association between BMI-for-age percentile and insulin resistance among first-grade students in primary governmental schools in the Gaza Strip. However, the study's limitations include the use of non-probability sampling techniques and the inherent limitations of a cross-sectional design, which make it difficult to establish causal associations and limit the generalizability of the findings. Longitudinal studies are needed to track how these metabolic changes progress over time. Additionally, while the study examined socio-economic and lifestyle factors, a more detailed analysis of dietary intake, physical activity levels, and genetic factors could provide deeper insights into the causes of childhood obesity in this population.
Conclusion
In conclusion, this study supports the notion that childhood obesity is strongly linked to both inflammation and insulin resistance. Elevated levels of IL-6, Hs-CRP, and insulin in obese children underscore the metabolic risks associated with childhood obesity. Socio-economic factors, including place of residence and paternal education, were found to significantly influence BMI-for-age categories, suggesting that efforts to combat childhood obesity should consider these socio-economic factors.
Data availability statement
The raw data supporting the conclusions of this article will be made available by the authors, without undue reservation.
Ethics statement
The studies involving humans were approved by Approval was obtained from Al-Azhar University, the Ministry of Education, and the Palestinian Health Research Council (Helsinki Committee No. PHRC/HC/1206/22) before the study began. Informed consent was also obtained from each participant's parent. The studies were conducted in accordance with the local legislation and institutional requirements. Written informed consent for participation in this study was provided by the participants' legal guardians/next of kin.
Author contributions
BA: Conceptualization, Data curation, Formal analysis, Investigation, Methodology, Project administration, Writing – original draft, Writing – review & editing. AHE: Conceptualization, Data curation, Methodology, Supervision, Validation, Visualization, Writing – review & editing. AE: Conceptualization, Data curation, Formal analysis, Investigation, Methodology, Project administration, Writing – original draft, Writing – review & editing.
Funding
The author(s) declare that no financial support was received for the research and/or publication of this article.
Acknowledgments
The authors wish to thank and appreciate the study participants and their parents for their significant participation in the study.
Conflict of interest
The authors declare that the research was conducted in the absence of any commercial or financial relationships that could be construed as a potential conflict of interest.
Generative AI statement
The author(s) declare that no Generative AI was used in the creation of this manuscript.
Publisher's note
All claims expressed in this article are solely those of the authors and do not necessarily represent those of their affiliated organizations, or those of the publisher, the editors and the reviewers. Any product that may be evaluated in this article, or claim that may be made by its manufacturer, is not guaranteed or endorsed by the publisher.
References
1. Ng M, Dai X, Cogen RM, Abdelmasseh M, Abdollahi A, Abdullahi A, et al. National-level and state-level prevalence of overweight and obesity among children, adolescents, and adults in the USA, 1990–2021, and forecasts up to 2050. Lancet. (2024) 404(10469):2278–98. doi: 10.1016/S0140-6736(24)01548-4
2. Ahmed B, Konje JC. The epidemiology of obesity in reproduction. Best Pract Res Clin Obstet Gynaecol. (2023) 89:102342. doi: 10.1016/j.bpobgyn.2023.102342
3. El Bilbeisi AH, Al-Jawaldeh A, Albelbeisi A, Abuzerr S, Elmadfa I, Nasreddine L. Association of household food insecurity with dietary intakes and nutrition-related knowledge, attitudes, and practices among parents, aged ≥ 18 years in Gaza strip, Palestine: a descriptive study. Heliyon. (2022) 8(6):e09582. doi: 10.1016/j.heliyon.2022.e09582
4. Hertiš Petek T, Marčun Varda N. Childhood cardiovascular health, obesity, and some related disorders: insights into chronic inflammation and oxidative stress. Int J Mol Sci. (2024) 25(17):9706. doi: 10.3390/ijms25179706
5. Farag HA, Hosseinzadeh-Attar MJ, Muhammad BA, Esmaillzadeh A, Bilbeisi AH. Comparative effects of vitamin D and vitamin C supplementations with and without endurance physical activity on metabolic syndrome patients: a randomized controlled trial. Diabetol Metab Syndr. (2018) 10:1–2. doi: 10.1186/s13098-018-0384-8
6. El Bilbeisi AH, Hosseini S, Djafarian K. Association of dietary patterns with diabetes complications among type 2 diabetes patients in Gaza Strip, Palestine: a cross sectional study. J Health Popul Nutr. (2017) 36:1–1. doi: 10.1186/s41043-017-0115-z
7. Zhao X, An X, Yang C, Sun W, Ji H, Lian F. The crucial role and mechanism of insulin resistance in metabolic disease. Front Endocrinol. (2023) 14:1149239. doi: 10.3389/fendo.2023.1149239
8. García-Hermoso A, López-Gil JF, Izquierdo M, Ramírez-Vélez R, Ezzatvar Y. Exercise and insulin resistance markers in children and adolescents with excess weight: a systematic review and network meta-analysis. JAMA Pediatr. (2023) 177(12):1276–84. doi: 10.1001/jamapediatrics.2023.4038
9. Peplies J, Börnhorst C, Günther K, Fraterman A, Russo P, Veidebaum T, et al. Longitudinal associations of lifestyle factors and weight status with insulin resistance (HOMA-IR) in preadolescent children: the large prospective cohort study IDEFICS. Int J Behav Nutr Phys Act. (2016) 13:1–2. doi: 10.1186/s12966-016-0424-4
10. Albelbeisi AH, Albelbeisi A, El Bilbeisi AH, Taleb M, Takian A, Akbari-Sari A. Barriers toward the practice of healthy behaviors among patients with non-communicable diseases in Gaza Strip, Palestine. SAGE Open Med. (2021) 9:20503121211029179. doi: 10.1177/20503121211029179
11. Baneu P, Văcărescu C, Drăgan SR, Cirin L, Lazăr-Höcher AI, Cozgarea A, et al. The triglyceride/HDL ratio as a surrogate biomarker for insulin resistance. Biomedicines. (2024) 12(7):1493. doi: 10.3390/biomedicines12071493
12. Zahedi AS, Daneshpour MS, Akbarzadeh M, Hedayati M, Azizi F, Zarkesh M. Association of baseline and changes in adiponectin, homocysteine, high-sensitivity C-reactive protein, interleukin-6, and interleukin-10 levels and metabolic syndrome incidence: tehran lipid and glucose study. Heliyon. (2023) 9(9):e19911. doi: 10.1016/j.heliyon.2023.e19911
13. Miao P, Ruiqing T, Yanrong L, Zhuwen S, Huan Y, Qiong W, et al. Pyroptosis: a possible link between obesity-related inflammation and inflammatory diseases. J Cell Physiol. (2022) 237(2):1245–65. doi: 10.1002/jcp.30627
14. Albelbeisi A, Zinszer K, El Bilbeisi AH, Abuzerr S. The burden of acute malnutrition among children under five in conflict-afflicted Gaza strip: prevalence and associated factors. Front Nutr. (2024) 11:1478485. doi: 10.3389/fnut.2024.1478485
15. Iriqat D, Alousi R, Aldahdouh TZ, AlDahdouh A, Dankar I, Alburai D, et al. Educide amid conflict: the struggle of the Palestinian education system. Q Educ All. (2025) 2(1):1–9. doi: 10.1108/QEA-10-2024-0120
16. Charan J, Biswas T. How to calculate sample size for different study designs in medical research? Indian J Psychol Med. (2013) 35(2):121–6. doi: 10.4103/0253-7176.116232
17. Kowalski KC, Crocker PR, Donen RM. The physical activity questionnaire for older children (PAQ-C) and adolescents (PAQ-A) manual. Coll Kinesiol Univ Saskatchewan. (2004) 87(1):1–38. Available at: https://www.prismsports.org/UserFiles/file/PAQ_manual_ScoringandPDF.pdf
18. Millen AE, Midthune D, Thompson FE, Kipnis V, Subar AF. The national cancer institute diet history questionnaire: validation of pyramid food servings. Am J Epidemiol. (2006) 163(3):279–88. doi: 10.1093/aje/kwj031
19. Mumena WA, Kutbi HA. Development of a food frequency questionnaire for assessing habitual intake of free sugar among children in Saudi Arabia. Front Nutr. (2022) 8:742737. doi: 10.3389/fnut.2021.742737
20. Luo Y, Li X, Li J, Gong X, Wu T, Li X, et al. Prenatal exposure of PFAS in cohorts of pregnant women: identifying the critical windows of vulnerability and health implications. Environ Sci Technol. (2024) 58(31):13624–35. doi: 10.1021/acs.est.4c00453
21. Gonzalez-Ramirez I, Ramirez-Amador V, Irigoyen-Camacho ME, Sánchez-Pérez Y, Anaya-Saavedra G, Granados-Garcia M, et al. hMLH1 promoter methylation is an early event in oral cancer. Oral Oncol. (2011) 47(1):22–6. doi: 10.1016/j.oraloncology.2010.10.002
22. El Bilbeisi AH, Al-Jawaldeh A, Albelbeisi A, Abuzerr S, Elmadfa I, Nasreddine L. Households’ food insecurity and their association with dietary intakes, nutrition-related knowledge, attitudes and practices among under-five children in Gaza strip, Palestine. Front Public Health. (2022) 10:808700. doi: 10.3389/fpubh.2022.808700
23. El Bilbeisi AH, Al-Jawaldeh A, Albelbeisi A, Abuzerr S, Elmadfa I, Nasreddine L. Association of household food insecurity with dietary intakes and nutrition-related knowledge, attitudes, and practices among school-aged children in Gaza Strip, Palestine. Front Nutr. (2022) 9:890850. doi: 10.3389/fnut.2022.890850
24. World Health Organization. AnthroPlus for personal computers. Manual: Software for Assessing Growth of the World’s Children and Adolescents. (2009).
25. Farag HA, Baqi HR, Qadir SA, El Bilbeisi AH, Hamafarj KK, Taleb M, et al. Effects of ramadan fasting on anthropometric measures, blood pressure, and lipid profile among hypertensive patients in the Kurdistan region of Iraq. SAGE Open Med. (2020) 8:2050312120965780. doi: 10.1177/2050312120965780
26. Sooragonda BG, Sridharan K, Benjamin RN, Prabhakar AT, Sivadasan A, Kapoor N, et al. Do bone mineral density, trabecular bone score, and hip structural analysis differ in Indian men with Parkinson’s disease? A case-control pilot study from a tertiary center in Southern India. Ann Indian Acad Neurol. (2023) 26(4):496–501. doi: 10.4103/aian.aian_29_23
27. El Bilbeisi AH, Abo Khosa SM, Taleb MH, El Afifi AM. Assessment of serum, dietary zinc levels, and other risk factors during the third trimester among pregnant women with and without pregnancy-induced hypertension: a case-control study. Front Nutr. (2023) 10:1155529. doi: 10.3389/fnut.2023.1155529
28. ElSayed NA, Aleppo G, Bannuru RR, Bruemmer D, Collins BS, Ekhlaspour L, et al. 14. Children and adolescents: standards of care in diabetes—2024. Diabetes Care. (2024) 47:S258–81. doi: 10.2337/dc24-S014
29. Assaf EA, Al Sabbah H, Al-Jawadleh A. Analysis of the nutritional status in the Palestinian territory: a review study. Front Nutr. (2023) 10:1206090. doi: 10.3389/fnut.2023.1206090
30. Mohany KM, Al Rugaie O, Al-Wutayd O, Alsharidah M, Al-Nafeesah A. Circulating miR-15b, annexin A1, procalcitonin and interleukin-6 levels differentiate children with metabolically unhealthy obesity from those with metabolically healthy obesity: a case-control study. Exp Ther Med. (2022) 23(6):403. doi: 10.3892/etm.2022.11330
31. Baldelli S, Aiello G, Mansilla Di Martino E, Campaci D, Muthanna FM, Lombardo M. The role of adipose tissue and nutrition in the regulation of adiponectin. Nutrients. (2024) 16(15):2436. doi: 10.3390/nu16152436
32. Paul P, Kaul R, Abdellatif B, Arabi M, Upadhyay R, Saliba R, et al. The promising role of microbiome therapy on biomarkers of inflammation and oxidative stress in type 2 diabetes: a systematic and narrative review. Front Nutr. (2022) 9:906243. doi: 10.3389/fnut.2022.906243
33. Marateb HR, Mansourian M, Koochekian A, Shirzadi M, Zamani S, Mansourian M, et al. Prevention of cardiometabolic syndrome in children and adolescents using machine learning and noninvasive factors: the CASPIAN-V study. Information. (2024) 15(9):564. doi: 10.3390/info15090564
34. Fiorentino R, Chiarelli F. Treatment of dyslipidaemia in children. Biomedicines. (2021) 9(9):1078. doi: 10.3390/biomedicines9091078
35. Nasrat H, Patra SK, Goswami B, Jain A, Raghunandan C. Study of association of leptin and insulin resistance markers in patients of PCOS. Indian J Clin Biochem. (2016) 31:104–7. doi: 10.1007/s12291-015-0499-8
36. Ciężki S, Odyjewska E, Bossowski A, Głowińska-Olszewska B. Not only metabolic complications of childhood obesity. Nutrients. (2024) 16(4):539. doi: 10.3390/nu16040539
37. Singer K, Lumeng CN. The initiation of metabolic inflammation in childhood obesity. J Clin Invest. (2017) 127(1):65–73. doi: 10.1172/JCI88882
38. Sodero G, Rigante D, Pane LC, Sessa L, Quarta L, Candelli M, et al. Cardiometabolic risk assessment in a cohort of children and adolescents diagnosed with hyperinsulinemia. Diseases. (2024) 12(6):119. doi: 10.3390/diseases12060119
39. Polak-Szczybyło E. Low-grade inflammation and role of anti-inflammatory diet in childhood obesity. Int J Environ Res Public Health. (2023) 20(3):1682. doi: 10.3390/ijerph20031682
40. Muscogiuri G, Bettini S, Boschetti M, Barrea L, Savastano S, Colao A. Low-grade inflammation, COVID-19, and obesity: clinical aspect and molecular insights in childhood and adulthood. Int J Obes. (2022) 46(7):1254–61. doi: 10.1038/s41366-022-01111-5
41. Calcaterra V, Regalbuto C, Porri D, Pelizzo G, Mazzon E, Vinci F, et al. Inflammation in obesity-related complications in children: the protective effect of diet and its potential role as a therapeutic agent. Biomolecules. (2020) 10(9):1324. doi: 10.3390/biom10091324
42. Gokulakrishnan R, Delhikumar CG, Senthilkumar GP, Sahoo J, Kumar RR. Chronic inflammatory markers in overweight and obese children: a cross-sectional analytical study. Indian J Endocrinol Metab. (2024) 28(5):542–7. doi: 10.4103/ijem.ijem_353_23
43. Yan K. Recent advances in the effect of adipose tissue inflammation on insulin resistance. Cell Signal. (2024) 120:111229. doi: 10.1016/j.cellsig.2024.111229
44. Cheng L, Zhou J, Zhao Y, Wang N, Jin M, Mao W, et al. The associations of insulin resistance, obesity, and lifestyle with the risk of developing hyperuricaemia in adolescents. BMC Endocr Disord. (2024) 24(1):220. doi: 10.1186/s12902-024-01757-4
45. Tymochkin S, Bayliak M. Global trends in obesity: socio-economic and regional influences. J Vasyl Stefanyk Precarpath Nat Univ Biol. (2024) 11:66–77. Available at: https://journals.pnu.edu.ua/index.php/jpnubio/article/view/8664
46. Xu J. The roles of family and school members in influencing children’s eating behaviours in China: a narrative review. Children. (2022) 9(3):315. doi: 10.3390/children9030315
47. Bhargava SK, Sachdev HS, Fall CH, Osmond C, Lakshmy R, Barker DJ, et al. Relation of serial changes in childhood body-mass index to impaired glucose tolerance in young adulthood. N Engl J Med. (2004) 350(9):865–75. doi: 10.1056/NEJMoa035698
48. Ou-Yang MC, Sun Y, Liebowitz M, Chen CC, Fang ML, Dai W, et al. Accelerated weight gain, prematurity, and the risk of childhood obesity: a meta-analysis and systematic review. PLoS One. (2020) 15(5):e0232238. doi: 10.1371/journal.pone.0232238
Keywords: body mass index, children, Gaza Strip, inflammation, insulin resistance
Citation: Abu Ghazza BS, El Bilbeisi AH and El Afifi A (2025) Uncovering the inflammatory profile of obese children: examining the link between body mass index for age and insulin resistance in the Gaza Strip. Front. Pediatr. 13:1570803. doi: 10.3389/fped.2025.1570803
Received: 6 February 2025; Accepted: 10 June 2025;
Published: 26 June 2025.
Edited by:
Melania Manco, Bambino Gesù Children’s Hospital (IRCCS), ItalyReviewed by:
Giorgio Sodero, Azienda Sanitaria Locale di Brindisi, ItalyBogdana Virgolici, Carol Davila University of Medicine and Pharmacy, Romania
Copyright: © 2025 Abu Ghazza, El Bilbeisi and El Afifi. This is an open-access article distributed under the terms of the Creative Commons Attribution License (CC BY). The use, distribution or reproduction in other forums is permitted, provided the original author(s) and the copyright owner(s) are credited and that the original publication in this journal is cited, in accordance with accepted academic practice. No use, distribution or reproduction is permitted which does not comply with these terms.
*Correspondence: Abdel Hamid El Bilbeisi, YWJlZF9hekBob3RtYWls