 Hazzaa M. Al-Hazzaa
 Amal Alhakami
 Ahlam M. Alotaibi4,5
- 1Lifestyle and Health Research Center, Health Sciences Research Center, Princess Nourah Bint Abdulrahman University, Riyadh, Saudi Arabia
- 2School of Sport Sciences, University of Jordan, Amman, Jordan
- 3Department of Pediatrics, College of Medicine, Princess Nourah Bint Abdulrahman University, Riyadh, Saudi Arabia
- 4Division of Pediatric Endocrinology, Department of Pediatrics, College of Medicine, King Saud University, Riyadh, Saudi Arabia
- 5The University Diabetes Centre, King Saud University Medical City, King Saud University, Riyadh, Saudi Arabia
Purpose: To compare two BMI classifications (the IOTF and WHO references) in assessing overweight/obesity prevalence among Saudi adolescents and to evaluate the ability of the two standards to detect risks of unhealthy lifestyle behaviors.
Methods: Healthy Saudi adolescents (15–19 years) were drawn from two data sets (n = 2,263) collected previously in 2009 and 2019, using a random multistage stratified cluster sampling technique. Measurements included weight, height, waist circumference (WC), wais to height ratio (WHtR), and selected lifestyle behaviors, including physical activity (PA), screen time, sleep duration, and dietary habits, using the Arab Teen Lifestyle Study (ATLS) questionnaire.
Results: The proportions (%) of adolescents classified as underweight, normal weight, overweight, and with obesity varied according to the classification used. The IOTF system produces slightly lower overweight/obesity prevalence than the WHO standards (IOTF: 38.8%; WHO: 40.0%), with females exhibited lower overweight/obesity prevalence than males. The Kappa agreement between overweight/obesity in the two references was high (0.973), with high sensitivity (99.8%) and high specificity (98.0%). Kappa values between central obesity and both IOTF (0.691) and WHO (0.687) were moderate with moderate sensitivity and high specificity. In both classification system, intakes >4 days/week of French fries/potato chips, and chocolates/candy showed higher odds of overweight/obesity.
Conclusion: Although overweight/obesity exhibited high Kappa agreement between the two classifications, variations were observed when estimating the prevalence of BMI classification using IOTF or WHO standards. Selected lifestyle behaviors showed significant associations with overweight/obesity in both classification standards.
Background
Worldwide, childhood obesity is perhaps the most serious public health challenge, and the prevalence of pediatric obesity has considerably increased globally across different countries (1). It is well recognized that there are many major negative consequences of pediatric obesity (2, 3). Overweight and obesity in childhood and adolescence are associated with greater risk and earlier onset of chronic medical conditions, such as type 2 diabetes (2). Excess body weight in childhood and adolescence is more likely to persist in adulthood (4). Additionally, childhood and adolescence obesity have been found to have adverse psychosocial consequences and lower educational attainment (3). In a recent multi-country research, the economic burden of obesity was reported to be considerable in all the eight participating countries, regardless of geographical or economic setting, ranging from 0.8% of gross domestic product in India to as much as 2.4% in Saudi Arabia (5).
Data from the Non-Communicable Disease Risk Factor Collaboration (1) showed that obesity in children and adolescents was still more predominant than thinness among girls in 133 countries and boys in 125 countries. The increases in double burden were the consequences of upsurges in obesity (1). In Saudi Arabia, the percentage of children and adolescents classified as overweight or obese has significantly increased in the past decades (6–9). Indeed, a recent systematic review among Saudi children and adolescents reported that the ranges of overweight and obesity were greater in boys (19.3%–35.6%) than in girls (11.8%–19.2%), and that lifestyle behaviors were the most common risk factor for overweight and obesity in school-age children (8).
It is well acknowledged that the most common methods used to assess overweight or obesity among children, youth, and adults are the use of specific classification systems based on body mass index (BMI) or the use of waist circumference and waist-to-height ratio (WHtR) (1, 10–12). The implementation of school-based BMI measurement has become common as a potential method for addressing overweight and obesity among youth (13). However, defining overweight and obesity in children and adolescents is not as straightforward as it is in adults. Typically, the International Obesity Task Force (IOTF) BMI age and gender cutoff values are used to classify overweight and obesity. The classification uses a set of data collected from six countries (10). Another method is the use of the World Health Organization's (WHO) reference standards for children and adolescents aged 5–19 years, which are based on weight-for-height Z-scores (11). Both systems are generally valid for classifying overweight and obesity in children and adolescents. However, they often generate different findings. Within the same sample, the IOTF references tend to have the lowest prevalence (14–16). For example, a study included Saudi national data described major differences between the use of Saudi growth charts of weight for age and the WHO references (13). The study indicated that the use of the WHO standards among young Saudi children raise the prevalence of undernutrition, stunting, and wasting, which possibly results in avoidable referrals, and parental concerns (13).
Thus, it is rather challenging to determine the real prevalence of underweight, overweight, and obesity in children and adolescents when such variation exists among the most common international classification systems (10, 11). Therefore, the present study aimed to compare the two commonly BMI classification systems (the IOTF age and gender cutoff values (10), and the WHO growth references (11) that are used to evaluate overweight and obesity among children and youth, using two sets of data for Saudi adolescents between the ages of 15 and 19 years from the Arab Teens Lifestyle Study (ATLS) (17, 18). Additional objectives of the study were to determine which cutoffs for obesity agree with the criteria for central obesity using WHtR and to evaluate the potential ability of the IOTF and WHO standards to detect lifestyle-related risk factors.
Methods
Ethical approval
Ethical approval was obtained from the Institutional Review Board (IRB) at King Saud University, Riyadh (IRB Log Number: 17/0064/IRB) for the study conducted in 2009, and Princess Nourah Bint Abdulrahman University, Riyadh (IRB Log Number: 19-0014) for the study conducted in 2019. The research was performed in accordance with the principles stated in the Declaration of Helsinki. Written informed consent was obtained from all parents/guardians of the participating children. In addition, approval for conducting this research in schools was attained from Riyadh directorates of schools, the Ministry of Education, and the principals of the selected schools.
Study design and participants
The present research is based on a secondary analysis of two sets of data from two studies conducted on Saudi adolescents 15–19 years of age (17, 18). The population in the two cross sectional studies was composed of healthy students of both sexes attending public and private secondary schools in Riyadh, Saudi Arabia. Riyadh city is a cosmopolitan city and the capital of Saudi Arabia. Both studies had a representative random sample size and similar design, methodology, and instrumentations. Detailed descriptions of the two studies' design and sample selection were previously published (17, 18). In brief, the required sample size was calculated assuming that the population proportion equaled 0.50, which yielded the largest possible sample size needed with a 95% confidence level and a margin of error equal to 4%. Adolescents were selected from secondary schools using a multistage stratified cluster sampling technique. Stratification was based on sex (male vs. female schools), public vs. private schools, and geographical location (east, west, north, and south). Participants were selected from the schools relative to the actual number of students in each of the public or private schools. Within each geographical location, one private and two public schools were randomly chosen. Then, classes were randomly selected from each of the three grades (10, 11, and 12). All Saudi students in the designated classes were invited to participate in the study, provided that they had no eating disorders, growth problem, or any medical condition that precluded them from engaging in physical activity.
Anthropometric measurement and BMI classification
Measurements of weight (to the nearest 100 g) and height (to the nearest 1 cm) were conducted in the morning at the schools by trained researchers using calibrated portable scales (Seca 869, UK) and height measuring rods, respectively, while students wore minimal clothing and without shoes. Body mass index (BMI) was computed as the ratio of body weight in kilograms divided by the squared height in meters. In addition, WHtR was calculated as the ratio between WC in cm and height in cm. A WHtR cut-off point of ≥0.50 was used to define abdominal obesity in both males and females (12, 19). The WHTR is a simple, noninvasive, and practical tool that correlates well with visceral fat (12), and contrary to waist circumference, WHTR has the advantage of not requiring population specific reference tables as well as age and sex specific cutoffs (19). The ratio of 0.5 was shown to identify overweight children with the highest metabolic and cardiovascular risks (20).
Two commonly used international reference cutoff values were used to classify the BMI data. The first was the extended IOTF age- and sex-specific BMI cutoff reference standards, which are constructed based on data from adolescents in six countries: USA, UK, Brazil, the Netherlands, Hong Kong, and Singapore (10). The IOTF references provide percentile cut-offs corresponding to a BMI of 18.5, 25, and 30 kg/m2 at 18 years of age for underweight, overweight, and obesity status, respectively (10). The second method was the WHO growth standards for children and adolescents between the ages of 5 and 19 years, which is based on weight-for-height Z-scores (11). The prevalence of underweight, overweight, and obesity are defined by the WHO cut-off values as BMI-for-age less than 2 standard deviations (SDs) scores below the mean, greater than 1 SD above the mean, and greater than 2 SDs above the mean, respectively (11). The two classification systems used are based on the lambda (L), mu (M), and sigma (S) method (21). The LMS parameters correspond to median BMI (M), coefficient of variation (S), and the power in the Box–Cox transformation (L), which transforms the data, so it closely resembles a normal distribution (21). Overweight plus obesity level was calculated based on BMI ≥ 25 kg/m2.
Assessment of lifestyle behaviors
Lifestyle behaviors included physical activity (PA), screen time, sleep duration, and dietary habits. They were assessed using the Arab Teen Lifestyle Study (ATLS) questionnaire (17, 22). The questionnaire has been widely used and was previously shown to be a reliable and valid instrument for assessing PA and other lifestyle habits in youth (17, 23, 24). In brief, the PA part of the questionnaire was designed to collect information on the frequency, duration and intensity of different PA during a typical week. The questionnaire covers all types of PA domains including household, transport, fitness, sporting and recreational activities. A range of diverse activities were included in the questionnaire such as walking, jogging, running, cycling, swimming, resistance training, martial arts, dancing, moderate- and vigorous-intensity sports and household PA. Time spent in all types of PA were scored in minutes per week. To classify the participants' levels of sufficient or insufficient PA, we used the WHO guidelines for PA for adolescents as reporting a total PA duration in minutes/week above or below 420 min of moderate-to-vigorous-intensity PA (25). This is equivalent to 60 min of daily PA.
The ATLS questionnaire also assesses sedentary behaviors and sleep duration. This includes questions designed to assess typical time in hours spent per day in sedentary activities (screen time), including television (TV) viewing, video games, and recreational use of computers, internet, and social media during weekdays and weekends. In addition, participants were asked to state their typical sleep duration in hours spent on weekday and weekend nights and the daily average was calculated. We used a total screen viewing time cut-off value of 3 h per day to express low and high screen time. Sufficient and insufficient sleep duration was computed as above or below 8 h per night, respectively (26). Frequency intakes of a set of dietary habits during a usual (typical) week were included in the questionnaire. They included questions about how frequently (from zero day to 7 days per week) consume breakfast, vegetables, fruits, milk/dairy products, sugar-sweetened drinks, fast foods, donuts/cakes, and sweets and chocolates. When categorizing dietary frequency, we compared daily vs. non-daily intakes of breakfast, vegetables, fruits, and milk/dairy products. Other dietary frequencies were categorized as intakes of less than 4 days per week vs. 4 plus days per week.
Statistical analysis
Data were entered into an SPSS data file, checked for accuracy, cleaned, and analyzed using the IBM-SPSS software, version 28 (Chicago, IL, USA). Descriptive statistics were obtained for the selected variables and reported as percentages or means and standard errors. Differences between males and females in selected anthropometric and lifestyle measurements were tested using the t-test for independent samples. Chi-square tests of proportions were used to test the differences in BMI classifications (prevalence rates) based on the IOTF or WHO relative to underweight, normal weight, overweight, and obesity status. Agreements between BMI classification systems for detecting overweight/obesity were evaluated by Kappa measure of agreement and sensitivity and specificity were reported. We also determine which cutoff values for overweight/obesity agree with the criteria for central obesity (from WHtR data) using Kappa agreement. Finally, logistic regression analysis, adjusted for age, was used to test the associations of selected lifestyle behavioral risks with overweight/obesity vs. non-overweight/non-obesity among adolescents using each of IOTF or WHO method. The alpha level was set at ≤0.05 for significance testing.
Results
The current study included 2,263 participants between the ages of 15 and 19 years with males representing 51.0%. The mean (SE) of age was 16.7 (0.02) years with significant differences between males and females (p = 0.009). Table 1 presents the anthropometric and lifestyle behaviors of the participants relative to sex. The differences between males and females were significant for all anthropometric measurements (p < 0.001), total physical activity (p = 0.005), screen time (p > 0.001), sleep duration (p > 0.001), breakfast intake (p > 0.001), and all other dietary habits (p > 0.001) except vegetable intake (p = 0.759).
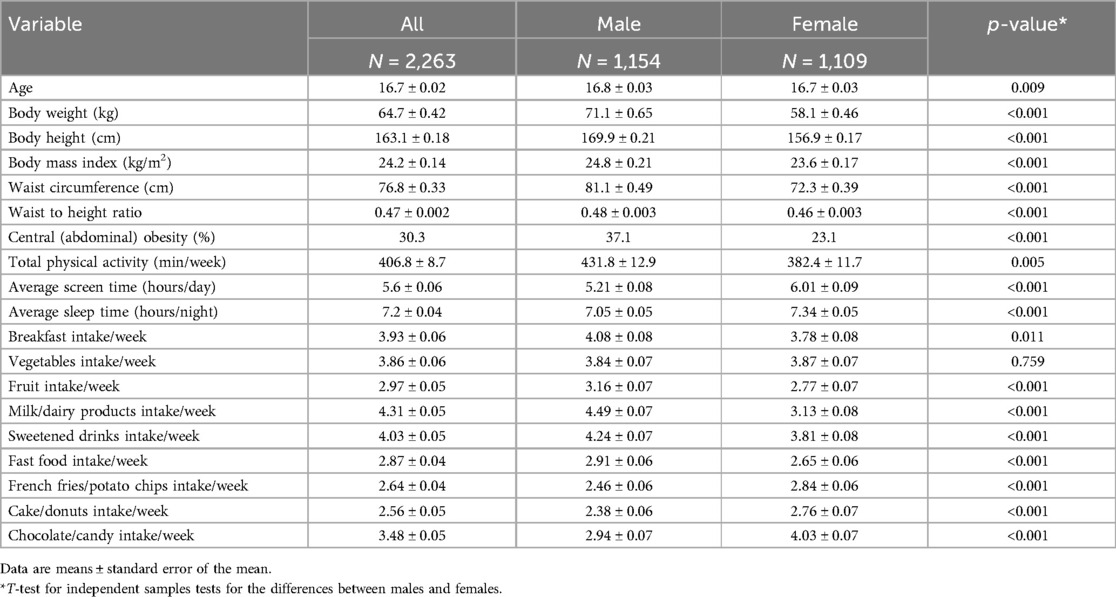
Table 1. Description of anthropometric and lifestyle behaviors of the participants relative to sex.
The prevalence (%) of underweight, normal weight, overweight, and obesity among Saudi adolescents using IOTF or WHO references relative to age and sex is shown in Table 2. Generally, females' findings were significantly lower than those of males in both classifications at most of age categories. Overall, the average values of overweight/obesity using IOTF and WHO standards were 38.8% and 40.0%, respectively, with significant (p < 0.001) differences relative to sex. The results of Kappa agreement (not shown in the table) indicated that Kappa coefficient for the combined overweight and obesity between IOTF and WHO references was 0.973 (p < 0.001) with sensitivity of 99.8% and specificity of 98.0%. In addition, Kappa coefficient between central obesity and overweight/obesity by IOTF was 0.691 (p < 0.001) with sensitivity of 71.1% and specificity of 95.3%. On the other hand, Kappa coefficient between central obesity and combined overweight and obesity by WHO was 0.687 (p < 0.001) with sensitivity of 70.0% and specificity of 95.9%.
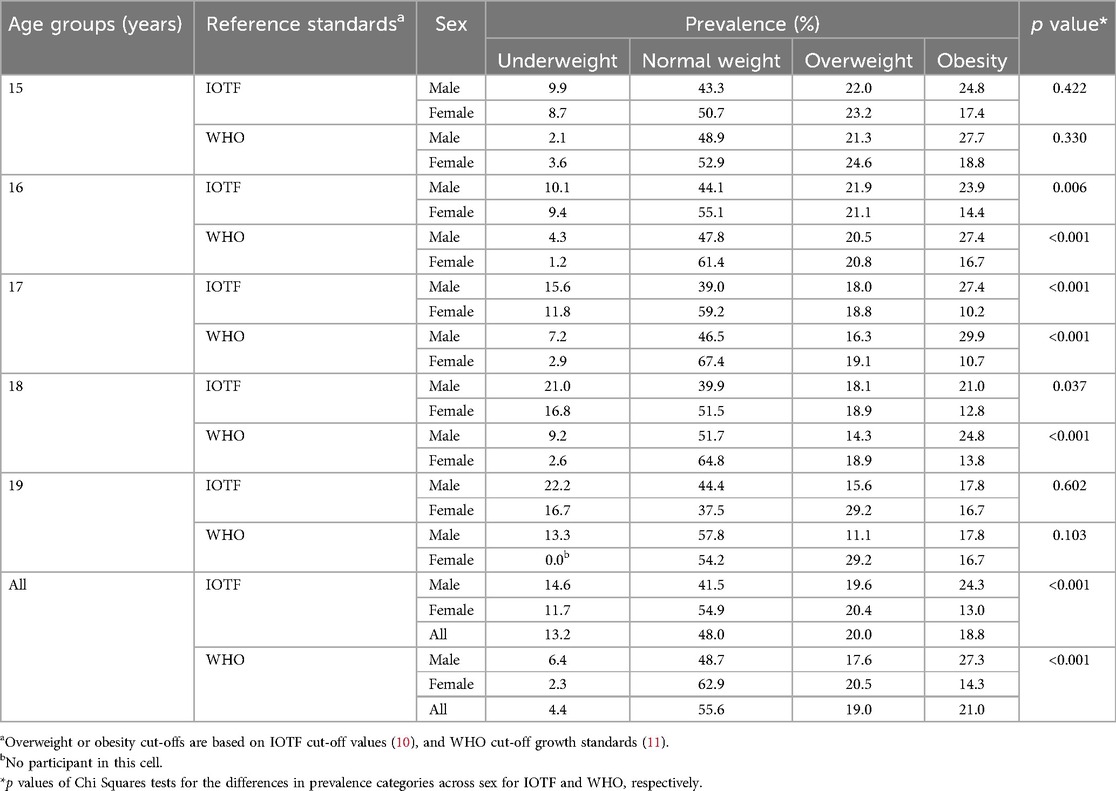
Table 2. The prevalence (%) of underweight, normal weight, overweight, and obesity among Saudi adolescents using IOTF or WHO reference standards relative to age groups and sex.
Table 3 displays the prevalence (%) of overweight/obesity among adolescents using IOTF or WHO reference standards relative to age groups using the two sets of data collected from the studies conducted in 2009 and 2019, separately and combined. Although there are some variations between the prevalence rates relative to ages, the findings from WHO standards exhibited significant differences relative to age categories among adolescents from data set in year 2009 (p = 0.045) as well as from the combined data set of 2009 and 2019 years (p = 0.023).
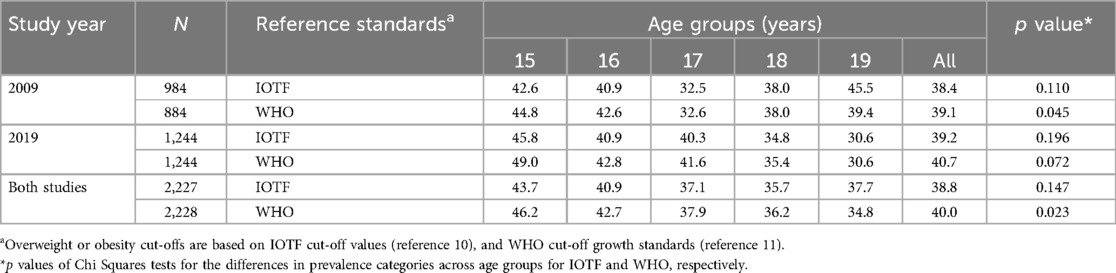
Table 3. The prevalence (%) of overweight/obesity among Saudi adolescents using IOTF or WHO reference standards relative to age groups and the two sets of data from studies in 2009 (reference no. 17) and 2019 (reference no. 18).
Table 4 presents the results of logistic regression analysis, adjusted for age, of selected lifestyle behaviors relative to overweight/obesity vs. non-overweight/non-obesity among participants using each of IOTF or WHO standards. Non-overweight/non-obesity was used as a reference category. There were significant negative associations (p < 0.001) between overweight/obesity status and increasing age when the two classification standards were used. Also, females were significantly (p < 0.001) less likely to have overweight, or obesity compared to males in both classification standards (IOTF: aOR = 0.647, 95% CI = 0.538–0.778; WHO: aOR = 0.658, 95% CI = 0.548–0.790). Adolescents attending public schools appeared significantly (p < 0.001) less likely to be overweight or have obesity compared to those in private schools. In addition, intakes ≥4 days per week of French fries/potato chips and chocolates/candy resulted in increased odds of having overweight or obesity. We also performed logistic regression analysis between those participants with obesity only vs. the other group (not shown in the table). The findings were almost like the current analysis, except that there was an additional significant (p = 0.033) association with breakfast intake while the associations for French fries/potato chips intake (p = 0.059) and chocolates/candy intake (p = 0.132) disappeared in the case of IOTF classification. As to WHO classification, again the association with breakfast intake became significant (p = 0.019), while the association with French fries/potato chips intake disappeared (p = 0.188).
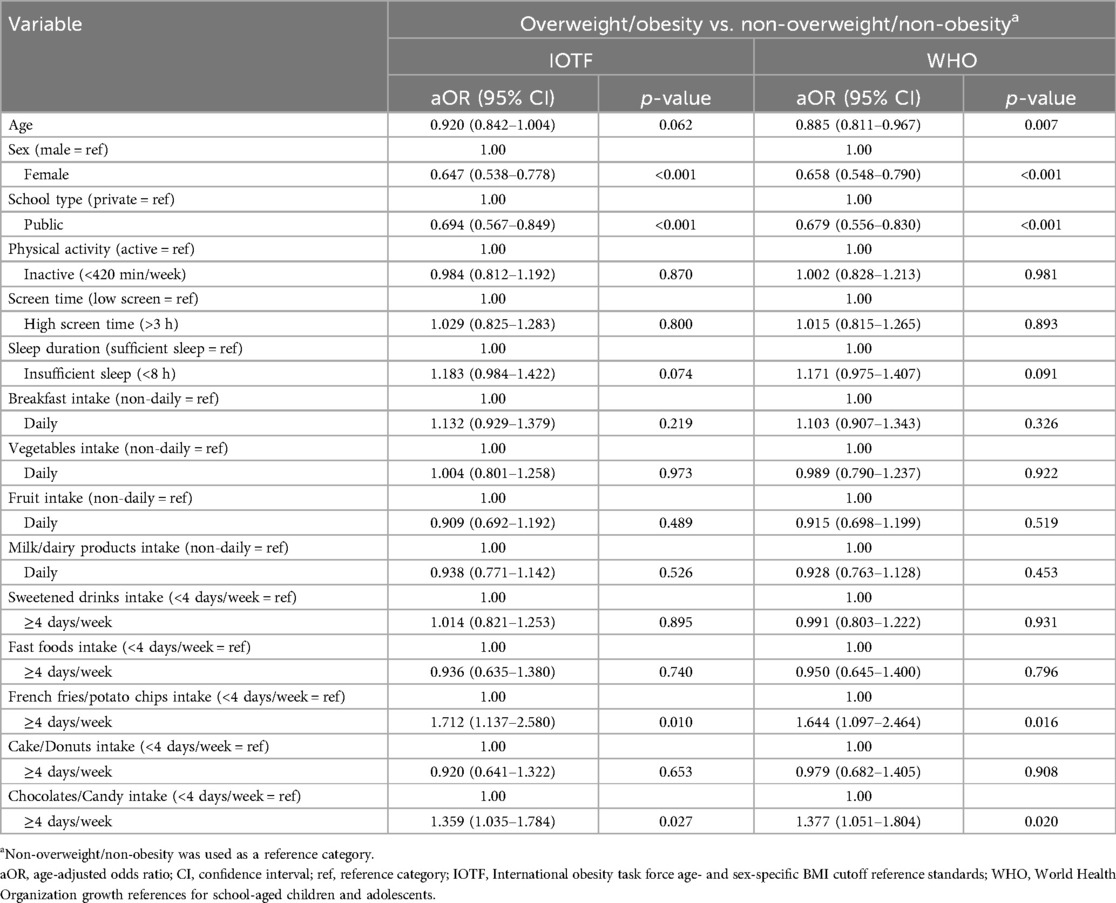
Table 4. Results of logistic regression analysis, adjusted for age, of selected lifestyle behaviors relative to overweight/obesity vs. non-overweight/non-obesity among Saudi adolescents using each of IOTF or WHO.
Discussion
The present study intended to compare the two BMI classification systems commonly used to evaluate overweight and obesity among children and youth. Namely the IOTF (10) and the WHO references (11). For this purpose, we used two sets of data for Saudi adolescents between the ages of 15 and 19 years from ATLS research (17, 18). It was also the intent of the study to determine which cutoffs for obesity agree with the criteria for central obesity, and to evaluate the potential ability of the IOTF and WHO standards to detect lifestyle-related risks. The findings showed that the average values of combined overweight and obesity using IOTF and WHO standards were 38.8% and 40.0%, respectively, with significant (p < 0.001) differences relative to sex.
Regardless of the BMI reference standards used, we observed a high prevalence of overweight and obesity among Saudi adolescents (IOTF = 38.8% and WHO = 40.0%), with somewhat variable but lower levels of underweight status using the WHO references. In general, compared with the results of the 2009 data set, overweight/obesity appeared somewhat higher in the results of the 2019 data sets. It is noticeable that the prevalence of overweight/obesity among Saudi adolescents has been rising over the past decades (7, 13, 18). It seems that obesity and other cardiovascular risk factors are significantly impacting on abnormal glucose metabolism in Saudi children and adolescents (27). Therefore, efforts to prevent overweight and obesity in adolescents must focus primarily on early risk identification followed by appropriate interventions.
It is rather challenging to estimate overweight and obesity prevalence when the most common international classification systems reveal different results (14–16). Overall, a higher prevalence of overweight and obesity has been reported when using WHO rather than IOTF reference values in children and adolescents from various countries across the world (14, 16, 28–33), but higher prevalence of overweight/obesity was obtained among Ukrainian children and adolescents when using IOTF classification (34). Furthermore, a school-based study conducted in eight Arab countries, including Saudi Arabia, involving adolescents aged 15–18 years reported that the use of the WHO standard yields a lower value of overweight but a higher prevalence of obesity than the use of the IOTF references (35).
Different studies have shown varying degrees of consistency when using IOTF and WHO standards for assessing overweight and obesity in children and adolescents. Among Canadian children and adolescents, the prevalence of the combined overweight/obese category is higher (35%) when based on the WHO reference compared with the IOTF standards (26%) (15). Also, a study conducted on Cree youth showed that participants classified as overweight by the IOTF system, but not by the WHO references, exhibited less severe clinical obesity (16). In other words, false-positive youth labelled with obesity status by WHO cutoffs were effectively classified as overweight by IOTF (16).
Possible explanations for the variations between IOTF and WHO methods may be attributed to the different populations, time periods, and methodologies and the approaches used to define the cutoffs used (36). It is also important to understand how the IOTF and WHO BMI standards for children and adolescents are constructed and an explanation of their inherent limitations. Adult anthropometric cutoffs are based on mortality outcomes (37). However, BMI cutoffs for children and adolescents under the age of 18 years are statistically determined (10, 11). The IOTF method uses smooth sex-specific BMI curves, constructed to match the values of 25 kg/m2 for overweight and 30 kg/m2 for obesity at 18 years. We also noticed that WHO standards underestimated “underweight” category among Saudi adolescents. This is in contrast to previous national study findings conducted on young Saudi children less than 6 years (13). This difference may be due to the fact that our sample was adolescents between 15- and 19-year-olds and the national study was conducted on children younger than 6 years. Also, our study included a sample from urban population, while the national study involved samples from rural and urban children.
In the present study, the prevalence of overweight/obesity using either IOTF or WHO standards showed higher values for males than for females. This finding aligns with those results reported in some previous studies that used the IOTF or WHO cutoff references (8). Recently, a large global study reported that a higher prevalence of overweight and obesity among school-aged boys appears more common (1). Similar results were found among a French school children (29). Other studies have reported mixed results (9, 16). However, no significant differences relative to sexes were reported among Swedish children (38). It is tempting to explain the differences in overweight and obesity between males and females shown in our study as well as in a recent local systematic review (8). The timing of pubertal onset may differently alter the body composition during adolescence. Moreover, as shown in the present study, although males are more physically active, they spend significantly more time in screen activity and have a shorter sleep duration than females. They also exhibited significantly less favorable adherence to healthy eating habits.
The Kappa coefficient between the overweight and obesity using the two reference standards was found to be high with high sensitivity and high specificity. In fact, it indicates almost perfect agreement (39). In the current study, values for Kappa agreement between central obesity and overweight and obesity using each of IOTF and WHO were considered moderate (39) along with moderate sensitivity and high specificity. Among Brazilian adolescents, a lower Kappa coefficient (0.72) was reported between the IOTF and WHO standards (28). Moreover, among French children, agreement between IOTF and WHO standards with those of French references ranged from moderate (Kappa = 0.43) to perfect (Kappa = 1.00) (29). In comparison, findings from an Italian study involving children and adolescents aged 5–17 years showed that the WHO references had the highest sensitivity, while the IOTF classification had the highest specificity when identifying subjects with obesity yet having clustered cardiometabolic risk factors (40). Moderate agreements were also observed between body fat of South American children estimated by dual-energy x-ray absorptiometry and by the IOTF (Kappa = 0.61) and WHO (Kappa = 0.63) references, with the IOTF cutoffs showing the highest specificity (0.98) (41).
The prevalence of central obesity in our study was 30.3%, with similar results for Kappa coefficient and sensitivity and specificity between central obesity and overweight and obesity using IOTF and WHO classification systems. The WHtR has gained interest as a measure of central obesity in children and adolescents (42, 43). WHtR may carry an advantage over the use of BMI alone. The WHtR association with age is weak, thus, the same cutoff value of 0.5 for central obesity has been proposed as useful across all age-groups in children (12, 42). As a result, population-specific references and age- and sex-specific cutoff values are not necessarily needed. In addition, the WHtR is considered a more reliable predictor of cardiovascular disease risk in children than BMI (43).
In the present study, we assessed the ability of the IOTF and WHO classification references to detect the association with lifestyle risk factors. Both classification systems showed significantly similar consistency of increased risks for French fries/potato chips and chocolates/Candy consumption by those adolescents with overweight or obesity. These findings agreed with the results reported by previous studies (44, 45). In fact, IOTF classification had the highest specificity in identifying participants with obesity along with clustered cardiometabolic risks (46). Also, research elsewhere showed that the means of body fat and cardiometabolic risk factors were significantly higher from normal weight to obesity, regardless of the classification system used (16).
Strengths and limitations
The strengths of the present study include a relatively large sample size and a representative of Saudi adolescents from both public and private schools in Riyadh Additionally, BMI data came from measurements of weight and height directly and did not rely on self-report. Further, the present research is also the first to test the performance of these two reference systems against an external measure of central obesity using Saudi data. However, the present study has some limitations. First, the findings are limited to adolescents aged 15–19 years and cannot be generalized to adolescents younger than 15-year-olds. Second, the sample was drawn from an urban area and cannot be generalized to adolescents residing in rural areas, where their growth and lifestyle behaviors may be different from youth living in the cities. Third, the cross-sectional design of the present study does not imply any cause and effect between the use of BMI classification system and lifestyle risks. Fourth, we did not have data on the pubertal stages of our sample. Assessment of maturation differences within the sample and between males and females would have been useful.
Conclusion
The IOTF classification system produces slightly lower overweight/obesity prevalence and higher rate of underweight compared with WHO references. Regardless of the classification system used, the prevalence of overweight or obese appeared to be high (IOTF = 38.8% and WHO = 40.0%). Males showed higher values than females. The Kappa coefficient of agreement for the overweight/obesity between the two references was found to be high with high sensitivity and high specificity. However, values for Kappa coefficient between central obesity (using WHtR) and overweight/obesity using each of IOTF and WHO were considered moderate along with moderate sensitivity and high specificity. In both classification systems, adolescents attending public schools were significantly less likely to be overweight or have obesity compared with adolescents attending private schools. In addition, intakes ≥4 days per week of French fries/potato chips and chocolates/candy resulted in increased odds of having overweight or obesity in both classification standards. In conclusion, despite high Kappa agreement between the two classification systems, variations were observed when estimating the prevalence of BMI classification using IOTF or WHO standards. The choice of the available BMI classification systems has important implications for adolescent's health and the assessment of clinical obesity among Saudi adolescents. Intervention to reduce overweight or obesity among Saudi adolescents is recommended.
Data availability statement
The raw data supporting the conclusions of this article will be made available by the authors, without undue reservation.
Ethics statement
The studies involving humans were approved by Institutional Review Board (IRB) at King Saud University, Riyadh (IRB Log Number: 17/0064/IRB) and Princess Nourah bint Abdulrahman University, Riyadh (IRB Log Number: 19-0014). The studies were conducted in accordance with the local legislation and institutional requirements. Written informed consent for participation in this study was provided by the participants' legal guardians/next of kin.
Author contributions
HA-H: Conceptualization, Data curation, Formal analysis, Investigation, Methodology, Writing – original draft, Writing – review & editing. AA: Conceptualization, Investigation, Methodology, Writing – review & editing. AMA: Conceptualization, Investigation, Methodology, Writing – review & editing.
Funding
The author(s) declare that no financial support was received for the research and/or publication of this article.
Acknowledgments
We acknowledge the support of Princess Nourah Bint Abdulrahman University Researchers Supporting Project (number: PNURSP2025R375), Princess Nourah bint Abdulrahman University, Riyadh, Saudi Arabia (Dr. Amal Alhakami).
Conflict of interest
The authors declare that the research was conducted in the absence of any commercial or financial relationships that could be construed as a potential conflict of interest.
Generative AI statement
The author(s) declare that no Generative AI was used in the creation of this manuscript.
Any alternative text (alt text) provided alongside figures in this article has been generated by Frontiers with the support of artificial intelligence and reasonable efforts have been made to ensure accuracy, including review by the authors wherever possible. If you identify any issues, please contact us.
Publisher's note
All claims expressed in this article are solely those of the authors and do not necessarily represent those of their affiliated organizations, or those of the publisher, the editors and the reviewers. Any product that may be evaluated in this article, or claim that may be made by its manufacturer, is not guaranteed or endorsed by the publisher.
Abbreviations
aOR, adjusted odd ratio; ATLS, Arab teens lifestyle study; BMI, body mass index; IOTF, international obesity task force; PA, physical activity; SE, standard error; WC, waist circumference; WHO, World Health Organization; WHtR, waist-to-height ratio.
References
1. NCD Risk Factor Collaboration (NCD-RisC). Worldwide trends in underweight and obesity from 1990 to 2022: a pooled analysis of 3663 population-representative studies with 222 million children, adolescents, and adults. Lancet. (2024) 403(10431):1027–50. doi: 10.1016/S0140-6736(23)02750-2
2. Park M, Falconer C, Viner R, Kinra S. The impact of childhood obesity on morbidity and mortality in adulthood: a systematic review. Obes Rev. (2012) 13:985–1000. doi: 10.1111/j.1467-789X.2012.01015.x
3. Quek YH, Tam WW, Zhang MW, Ho R. Exploring the association between childhood and adolescent obesity and depression: a meta-analysis. Obes Rev. (2017) 18:742–54. doi: 10.1111/obr.12535
4. Singh AS, Mulder C, Twisk JW, Van Mechelen W, Chinapaw MJM. Tracking of childhood overweight into adulthood: a systematic review of the literature. Obes Rev. (2008) 9:474–88. doi: 10.1111/j.1467-789X.2008.00475.x
5. Okunogbe A, Nugent R, Spencer G, Ralston J, Wilding J. Economic impacts of overweight and obesity: current and future estimates for eight countries. BMJ Glob Health. (2021) 6(10):e006351. doi: 10.1136/bmjgh-2021-006351
6. Al-Hazzaa HM. Prevalence and trends in obesity among school boys in central Saudi Arabia between 1988 and 2005. Saudi Medical J. (2007) 28:1569–74.
7. Al-Hazzaa HM, Abahussain N, Al-Sobayel H, Qahwaji DM, Alsulaiman NA, Musaiger AO. Prevalence of overweight, obesity and abdominal obesity among urban Saudi adolescents: gender and regional variations. J Health Popul Nutr. (2014) 32:634–45.25895197
8. Hammad SS, Berry DC. The child obesity epidemic in Saudi Arabia: a review of the literature. J Transcult Nurs. (2017) 28:505–15. doi: 10.1177/1043659616668398
9. Al-Hussaini A, Bashir MS, Khormi M, Al-Hussaini A, AlTuraiki M, Alkhamis W, et al. Overweight and obesity among Saudi children and adolescents: where do we stand today? Saudi J Gastroenterol. (2019) 25:229–35. doi: 10.4103/sjg.SJG_617_18
10. Cole TJ, Lobstein T. Extended international (IOTF) body mass index cut-offs for thinness, overweight and obesity. Pediatr Obes. (2012) 7:284–94. doi: 10.1111/j.2047-6310.2012.00064.x
11. de Onis M, Onyango A, Borghi E, Siyam A, Nishida C, Siekmann J. Development of a WHO growth reference for school-aged children and adolescents. Bull World Health Organ. (2007) 85:661–8. doi: 10.2471/BLT.07.043497
12. McCarthy HD, Ashwell MA. Study of central fatness using waist-to-height ratios in UK children and adolescents over two decades supports the simple message—‘keep your waist circumference to less than half your height’. Int J Obes. (2006) 30:988–92. doi: 10.1038/sj.ijo.0803226
13. El Mouzan MI, Foster PJ, Al Herbish AS, Al Salloum AA, Al Omar AA, Qurachi MM, et al. The implications of using the world health organization child growth standards in Saudi Arabia. Nutr Today. (2009) 44(2):62–70. doi: 10.1097/NT.0b013e31819dc6c5
14. Minghelli B, Nunes C, Oliveira R. Body mass index and waist circumference to define thinness, overweight and obesity in Portuguese adolescents: comparison between CDC, IOTF, WHO references. Pediatr Endocrinol Rev. (2014) 12(1):35–41.25345083
15. Shields M, Tremblay MS. Canadian childhood obesity estimates based on WHO, IOTF and CDC cut-points. Int J Pediatr Obes. (2010) 5(3):265–73. doi: 10.3109/17477160903268282
16. St-Jean A, Meziou S, Ayotte P, Lucas M. Overweight and obesity prevalence among Cree youth of Eeyou Istchee according to three body mass index classification systems. BMC Pediatr. (2017) 17(1):196. doi: 10.1186/s12887-017-0951-4
17. Al-Hazzaa HM, Abahussain N, Al-Sobayel H, Qahwaji DM, Musaiger AO. Physical activity, sedentary behaviors and dietary habits among Saudi adolescents relative to age, gender and region. Int J Behav Nutr Phys Act. (2011) 8:140. doi: 10.1186/1479-5868-8-140
18. Al-Hazzaa HM, Alothman SA, Alghannam AF, Almasud AA. Anthropometric measurements, sociodemographics, and lifestyle behaviors among Saudi adolescents living in Riyadh relative to sex and activity energy expenditure: findings from the Arab teens lifestyle study 2 (ATLS-2). Nutrients. (2021) 14(1):110. doi: 10.3390/nu14010110
19. Maffeis C, Banzato C, Talamini G. Waist-to-height ratio, a useful index to identify high metabolic risk in overweight children. J Pediatr. (2008) 152:207–13. doi: 10.1016/j.jpeds.2007.09.021
20. Taylor RW, Jones IE, Williams SM, Goulding A. Evaluation of waist circumference, waist-to-hip ratio, and the conicity index as screening tools for high trunk fat mass, as measured by dual-energy x-ray absorptiometry, in children aged 3–19 y. Am J Clin Nutr. (2000) 72:490–5. doi: 10.1093/ajcn/72.2.490
21. Cole TJ, Green PJ. Smoothing reference centile curves: the LMS method and penalized likelihood. Stat Med. (1992) 11(10):1305–19. doi: 10.1002/sim.4780111005
22. Al-Hazzaa HM, Musaiger AO, ATLS Group. Arab teens lifestyle study (ATLS): objectives, design, methodology and implications. Diabetes Metab Syndr Obes Targets Therapy. (2011) 4:417. doi: 10.2147/DMSO.S26676
23. Al-Hazzaa HM, Al-Ahmadi MA. Self-reported questionnaire for the assessment of physical activity in youth 15–25 years: development, reliability and construct validity. Arab J Food Nutr. (2003) 4:279–91.
24. Al-Hazzaa HM, Al-Sobayel HI, Musaiger AO. Convergent validity of the Arab teens lifestyle study (ATLS) physical activity questionnaire. Int J Environ Res Public Health. (2011) 8:3810–20. doi: 10.3390/ijerph8093810
25. World Health Organization. World Health Organization Guidelines on Physical Activity and Sedentary Behavior. Geneva, Switzerland: World Health Organization (2020).
26. Hirshkowitz M, Whiton K, Albert S, Alessi C, Bruni O, DonCarlos L, et al. National sleep foundation’s sleep time duration recommendations: methodology and results summary. Sleep Health. (2015) 1:40–50. doi: 10.1016/j.sleh.2014.12.010
27. Al-Rubeaan K. National surveillance for type 1, type 2 diabetes and prediabetes among children and adolescents: a population-based study (SAUDI-DM). J Epidemiol Community Health. (2015) 69(11):1045–51. doi: 10.1136/jech-2015-205710
28. Pelegrini A, Silva DAS, Gaya ACA, Petroski EL. Comparison of three criteria for overweight and obesity classification in Brazilian adolescents. Nutr J. (2013) 12:5. doi: 10.1186/1475-2891-12-5
29. Kêkê LM, Samouda H, Jacobs J, di Pompeo C, Lemdani M, Hubert H, et al. Body mass index and childhood obesity classification systems: a comparison of the French, international obesity task force (IOTF) and world health organization (WHO) references. Rev Epidemiol Sante Publique. (2015) 63(3):173–82. doi: 10.1016/j.respe.2014.11.003
30. Sarkkola C, Viljakainen J, de Oliveira Figueiredo RA, Saari A, Lommi S, Engberg E. Prevalence of thinness, overweight, obesity, and central obesity in Finnish school-aged children: a comparison of national and international reference values. Obes Facts. (2022) 15(2):240–7. doi: 10.1159/000521170
31. Asif M, Qureshi HAI, Seyal SM, Aslam M, Sultan MT, Elwahab MEA, et al. Assessing disparities about overweight and obesity in Pakistani youth using local and international standards for body mass index. J Clin Med. (2024) 13(10):2944. doi: 10.3390/jcm13102944
32. Al-Hazzaa HM, Alrasheedi AA, Alsulaimani RA, Jabri L, Alhowikan AM, Alhussain MH, et al. Prevalence of overweight and obesity among Saudi children: a comparison of two widely used international standards and the national growth references. Front Endocrinol. (2022) 13:954755. doi: 10.3389/fendo.2022.954755
33. Llorca-Colomer F, Murillo-Llorente MT, Legidos-García ME, Palau-Ferré A, Pérez-Bermejo M. Differences in classification standards for the prevalence of overweight and obesity in children. A systematic review and meta-analysis. Clin Epidemiol. (2022) 14:1031–52. doi: 10.2147/CLEP.S375981
34. Dereń K, Wyszyńska J, Nyankovskyy S, Nyankovska O, Yatsula M, Łuszczki E, et al. Assessment of body mass index in a pediatric population aged 7-17 from Ukraine according to various international criteria-a cross-sectional study. PLoS One. (2020) 15(12):e0244300. doi: 10.1371/journal.pone.0244300
35. Musaiger AO, Al-Mannai M, Al-Haifi AR, Nabag F, Elati J, Abahussain N, et al. Prevalence of overweight and obesity among adolescents in eight Arab countries: comparison between two international standards (ARABEAT-2). Nutr Hosp. (2016) 33(5):567. doi: 10.20960/nh.567
36. Neovius M, Linné Y, Barkeling B, Rössner S. Discrepancies between classification systems of childhood obesity. Obes Rev. (2004) 5(2):105–14. doi: 10.1111/j.1467-789X.2004.00136.x
37. Bhaskaran K, Dos-Santos-Silva I, Leon DA, Douglas IJ, Smeeth L. Association of BMI with overall and cause-specific mortality: a population-based cohort study of 3·6 million adults in the UK. Lancet Diabetes Endocrinol. (2018) 6(12):944–53. doi: 10.1016/S2213-8587(18)30288-2
38. Nilsen BB, Yngve A, Sjöberg A, Moraeus L, Lissner L, Werner B. Using different growth references to measure thinness and overweight among Swedish primary school children showed considerable variations. Acta Paediatr. (2016) 105(10):1158–65. doi: 10.1111/apa.13400
39. Landis JR, Koch GG. The measurement of observer agreement for categorical data. Biometrics. (1977) 33(1):159–74. doi: 10.2307/2529310
40. Valerio G, Balsamo A, Baroni MG, Brufani C, Forziato C, Grugni G, et al. Childhood obesity classification systems and cardiometabolic risk factors: a comparison of the Italian, world health organization and international obesity task force references. Ital J Pediatr. (2017) 43(1):19. doi: 10.1186/s13052-017-0338-z
41. Anzolin CC, Silva DA, Zanuto EF, Cayres SU, Codogno JS, Costa Junior P, et al. Accuracy of different cutoff points of body mass index to identify overweight according to body fat values estimated by DEXA. J Pediatr. (2017) 93(1):58–63. doi: 10.1016/j.jped.2016.04.010
42. Savva SC, Tornaritis M, Savva ME, Kourides Y, Panagi A, Silikiotou N, et al. Waist circumference and waist-to-height ratio are better predictors of cardiovascular disease risk factors in children than body mass index. Int J Obes. (2000) 24(11):1453–8. doi: 10.1038/sj.ijo.0801401
43. Ashwell M, Hsieh SD. Six reasons why the waist-to-height ratio is a rapid and effective global indicator for health risks of obesity and how its use could simplify the international public health message on obesity. Int J Food Sci Nutr. (2005) 56(5):303–7. doi: 10.1080/09637480500195066
44. Yoo EG. Waist-to-height ratio as a screening tool for obesity and cardiometabolic risk. Korean J Pediatr. (2016) 59(11):425–31. doi: 10.3345/kjp.2016.59.11.425
45. Valerio G, Maffeis C, Balsamo A, Del Giudice EM, Brufani C, Grugni G, et al. Severe obesity and cardiometabolic risk in children: comparison from two international classification systems. PLoS One. (2013) 8:e83793. doi: 10.1371/journal.pone.0083793
Keywords: BMI, adolescent, IOTF, overweight, lifestyle behaviors, obesity, underweight, WHO standards
Citation: Al-Hazzaa HM, Alhakami A and Alotaibi AM (2025) Classification of overweight/obesity among Saudi adolescents relative to lifestyle behaviors using the IOTF or WHO reference standards. Front. Pediatr. 13:1607811. doi: 10.3389/fped.2025.1607811
Received: 8 April 2025; Accepted: 28 July 2025;
Published: 11 August 2025.
Edited by:
Maurizio Delvecchio, University of L'Aquila, ItalyReviewed by:
Alessio Pellegrino, University of Florence, ItalySamah El Shemy, Cairo University, Egypt
Copyright: © 2025 Al-Hazzaa, Alhakami and Alotaibi. This is an open-access article distributed under the terms of the Creative Commons Attribution License (CC BY). The use, distribution or reproduction in other forums is permitted, provided the original author(s) and the copyright owner(s) are credited and that the original publication in this journal is cited, in accordance with accepted academic practice. No use, distribution or reproduction is permitted which does not comply with these terms.
*Correspondence: Hazzaa M. Al-Hazzaa, aGFsaGF6emFhQGhvdG1haWwuY29t
†ORCID:
Hazzaa M. Al-Hazzaa
orcid.org/0000-0002-3099-0389