 Xiao Xu
 Ling Liu
 Yuedi Zhang1
 Pengxiang Zhou
 Pan Wang
 Jiansuo Zhou
 Wei Zhou
- 1Department of Pediatrics, Peking University Third Hospital, Beijing, China
- 2Department of Pharmacy, Peking University Third Hospital, Beijing, China
- 3Institute for Drug Evaluation, Peking University Health Science Center, Beijing, China
- 4Department of Laboratory Medicine, Peking University Third Hospital, Beijing, China
- 5Department of Laboratory Medicine, Peking University Third Hospital-Chongli, Zhangjiakou, Hebei, China
Background: This study aimed to assess the relationship of allergen-specific IgE (sIgE) levels and the ratio of sIgE to total IgE (sIgE/tIgE) with the results of the oral food challenge (OFC).
Methods: We retrospectively analysed the medical records of children diagnosed with or suspected of having food allergies in the Department of Paediatrics of Peking University Third Hospital between January 2012 and July 2023. Spearman's correlation, receiver operating characteristic (ROC) curves, and logistic regression models were used to compare the sIgE levels, sIgE/tIgE, and OFC results.
Results: Eighty-three children with 209 OFC trials were enrolled in this study; sIgE and tIgE levels were tested in 209 children. Among them, 69 children were tested for egg white allergy, 51 for cow's milk allergy, and 52 for wheat allergy. Using multifactorial logistic analysis, in all the samples, the regression coefficient of sIgE was 0.014 (p = 0.1), while that of the sIgE/tIgE was 0.026 (p < 0.01; OR = 1.026). In the egg white allergic group, the regression coefficient of sIgE was 0.032 (p = 0.26), while that of the sIgE/tIgE was 0.02 (p = 0.043; OR = 1.020). No significant differences were observed in the sIgE level or sIgE/tIgE between the cow's milk and wheat allergic groups.
Conclusions: The diagnostic value for food allergy sIgE/tIgE ratios, in the total sample and egg white group was better than that of sIgE alone; however, no significant differences were observed in the cow's milk and wheat allergic groups. Further studies with larger sample size or controlled studies are needed to validate these results.
1 Introduction
The prevalence of food allergies is increasing and has become a global public health concern (1). Immunoglobulin E (IgE)-mediated food allergies have received widespread attention because of their rapid progression and the risk of severe allergic reactions, which may be life-threatening. Therefore, diagnosing food allergies correctly is important. The oral food challenge (OFC) is the most reliable diagnostic method for food allergies and is recommended by many national guidelines (2), However, OFCs are difficult to promote in routine clinical practice because of its cumbersome process and needs to be performed by allergists. Recently, researchers have been looking at ratio analysis to find a reliable, in vitro diagnostic index, to replace the OFC or predict the risk of severe allergic reactions during the OFC to improve its safety.
IgE, a classical marker of type-2 inflammation, plays an important role in the pathogenesis of pediatric allergic disease. Allergen-specific IgE (sIgE) has a high sensitivity for predicting food allergies but lacks satisfactory specificity (3). Positive sIgE results represent sensitisation and should be combined with a history of food allergy to diagnose food allergy. In respiratory diseases associated with pollen allergy, the ratio of sIgE to total IgE (sIgE/tIgE) improves diagnostic sensitivity and specificity (4, 5). However, few studies on the use of sIgE/tIgE ratio for food allergy diagnosis exist. To the best of our knowledge, this is the first study in China that aimed to analyse the role of sIgE/tIgE ratio in food allergy diagnosis in children and compare the results with those of the OFC, considered the gold standard for diagnosis of food allergy, to explore the value of its clinical application.
2 Methods
2.1 Study population
This was a retrospective, non-interventional study. We reviewed the medical records of children who visited the Department of Paediatrics of Peking University Third Hospital between January 2012 and July 2023 with or suspected of having a food allergy. Data on sex, age, OFC results, food type, sIgE/tIgE results were collected. The results for sIgE and tIgE levels were measured within six months (180 days) before the OFC. Data were collected from 166 children who underwent 365 OFC's. Patients lacking data on sIgE level, tIgE level, or OFC results were excluded. Finally, 83 children with 209 OFC results were enrolled in this study. The study protocol was approved by the Ethics Committee of the Peking University Third Hospital (approval number: 2022 No. 506-01), which waved the requirement for informed consent.
2.2 Ige testing
sIgE and tIgE were detected using the Phadia 250 analyser (Thermo Fisher Scientific Co., China) utilising ImmunoCAP® technology. For sIgE, the low and high cut-off values were 0.1 kU/L and 100 kU/L, respectively. Any result >100 kU/L was recorded as 100 kU/L. For tIgE, the low and high cut-off values were 0 and 5,000 kU/L, respectively. Any result >5,000 kU/L was recorded as 5,000 kU/L. Some children underwent repeated sIgE tests; however, the interval between two consecutive tests was >6 months.
2.3 OFC
An open OFC was used in this study. The OFC was performed following the procedures in the “Expert Consensus on Standardised Procedures for Oral Food Challenge”, which was based on national and international literature. The OFC was performed by qualified workers from the author's department with experience in conducting OFC tests. Because of individual differences in the duration of cow's milk, egg white, and wheat allergies, some children in this study underwent repeated OFC's to determine food tolerance. Therefore, the number of OFC's performed was higher than the number of children.
2.4 Calculation of sIgE/tIgE ratio
2.5 Statistical analysis
Categorical variables are expressed as numbers (percentages), and continuous variables are expressed as medians [ranges]. Analyses were performed using the SPSS statistical package (version 22.0; IBM Corporation, Armonk, NY).
Nonparametric tests were applied to compare the differences in sIgE, tIgE, and ratios among different subgroups of OFC results; Spearman correlation analysis and ROC curves were applied to verify the consistency and diagnostic value of sIgE, sIgE/tIgE, and OFC results. Logistic regression modeling was used to assess the relationship between sIgE levels and sIgE/tIgE on OFC outcomes. Statistical significance was defined as p < 0.05.
3 Results
3.1 Patient characteristics
In this study, 83 children were enrolled. Among them, 209 OFC results and 209 serum sIgE and tIgE measurements were obtained. Results about OFC were obtained for 69 tests for egg white, 51 for milk, 52 for wheat, 17 for peanuts, 4 for shrimp, and 1 for crab. The patient characteristics are described in Table 1.
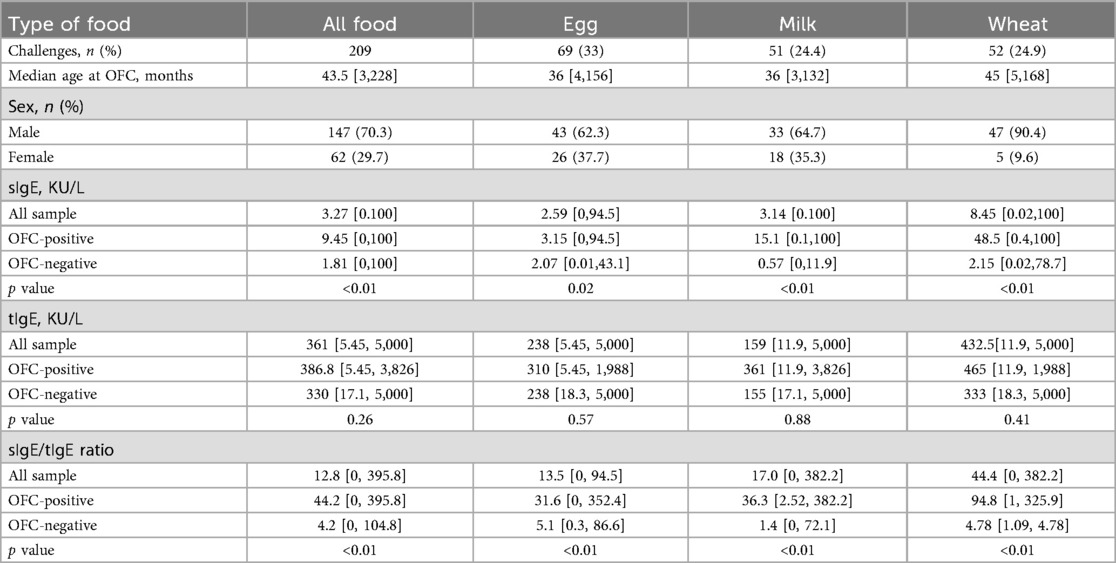
Table 1. Summary of patient characteristics, IgE levels and sIgE/tIgE.
Among the 209 cases of obtained results, the median age was 43.5 months (ranging from, 3–228 months). Among the 69 cases of egg protein results, the median age was 36 months (ranging from 4 to 156 months). Among the 51 cases of milk protein results, the median age of 36 months (ranging from 3 to 132 months), while the median age in the 51 cases of obtained test results for wheat allergy was 45 months (ranging from 5 to 168 months).
Among the 209 cases, the OFC results were positive in 111 cases (53.1%) and negative in 98 cases (46.9%). The results were positive in 44 cases (63.8%) and negative in 25 (36.2%) in the egg white group; positive in 29 cases (56.9%) and negative in 22(43.1%) in the milk group; and positive in 29 cases (55.8%) and negative in 23(44.2%) in the wheat group.
sIgE, tIgE, and sIgE/tIgE ratios results also were described in Table 1.
The median sIgE level for all samples was 3.27 kU/L (0–100 kU/L), tIgE of 361 kU/L (5.45–5,000 kU/L), sIgE/tIgE of 12.8 (0–395.8 kU/L); the median sIgE level for egg white group was 2.59 kU/L (0–94.5 kU/L), tIgE was 283 kU/L (5.45–5,000 kU/L), and sIgE/tIgE was 13.5 (0–352.4); the median sIgE level for milk group was 3.14 kU/L (0–100 kU/L), tIgE was 159 kU/L (11.9–5,000 kU/L), and sIgE/tIgE was 17.0 (0–382.2).; the median sIgE in the wheat group was 8.45 kU/L (0.02–100 kU/L), tIgE was 432.5 kU/L (11.9–5,000 kU/L), and sIgE/tIgE was 44.4 (0–382.2).
The tIgE levels were not statistically different in the negative and positive OFC result groups, but both sIgE and sIgE/tIgE ratio suggested a statistically significant difference by nonparametric tests. However, this method was not able to compare the differences between sIgE and ratios.
3.2 Comparison of correlation test and diagnostic value of sIgE, sIgE/tIgE, and OFC results
3.2.1 All samples
Correlation analyses were performed for sIgE, sIgE/tIgE ratio, and the OFC results. The correlation coefficient between sIgE and the OFC results was 0.398 (p < 0.05), and that between the sIgE/tIgE ratio and the OFC results was 0.542 (p < 0.05). ROC curve analyses showed that the sIgE level corresponded to an area under the ROC curve (AUC) of 0.730 (p < 0.05) and an optimal cut-off value of 0.362 (sensitivity, 0.505; specificity, 0.857), while the ratio value corresponding to an AUC of 0.814 (p < 0.05) and an optimal cut-off value of 0.500 (sensitivity, 0.766; specificity, 0.735). The sIgE level and sIgE/tIgE ratio had high diagnostic values for the OFC results. A comparison of the AUC between the two groups showed no significant difference between the two methods (Figure 1a).
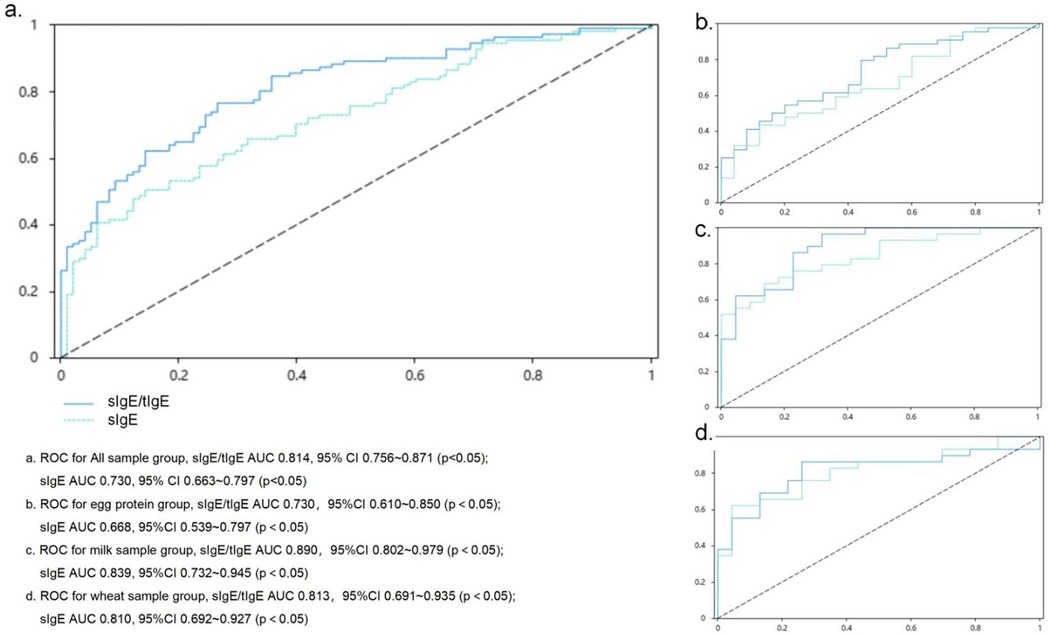
Figure 1. ROC curve assessing the relationship of the sIgE level and sIgE/tIgE ratio with oral food challenge results sIgE, allergen-specific IgE. (a) ROC for All sample group, sIgE/tIgE AUC 0.814, 95% CI: 0.756–0.871 (p < 0.05); sIgE AUC 0.730, 95% CI: 0.663–0.797 (p < 0.05). (b) ROC for egg protein group, slgE/tlgE AUC 0.730, 95% CI: 0.610–0.850 (p < 0.05); sIgE AUC 0.668, 95% CI: 0.539–0.797 (p < 0.05). (c) ROC for milk sample group, sIgE/tIgE AUC 0.890, 95% CI: 0.802–0.979 (p < 0.05); sIgE AUC 0.839, 95% CI: 0.732–0.945 (p < 0.05). (d) ROC for wheat sample group, sIgE/tIgE AUC 0.813, 95% CI: 0.691–0.935 (p < 0.05); sIgE AUC 0.810, 95% CI: 0.692–0.927 (p < 0.05).
3.2.2 Egg white group
The correlation coefficient between sIgE level and the OFC results was 0.279 (p < 0.05), and that between the sIgE/tIgE ratio and OFC results was 0.383 (p < 0.05). ROC curve analysis showed that the sIgE value corresponded to an AUC value of 0.668 (p < 0.05), which was of low diagnostic value for OFC results. The ratio value corresponded to an AUC value of 0.730 (p < 0.05), which was of limited diagnostic value for OFC results, and the corresponding optimal cut-off value was 0.355 (sensitivity, 0.795; specificity, 0.560). A comparison of the differences in the AUC between the two groups showed no significant differences (Figure 1b).
3.2.3 Cow's milk group
The correlation coefficient between sIgE level and the OFC results was 0.581 (p < 0.05), and that between the sIgE/tIgE ratio and the OFC result was 0.670 (p < 0.05). ROC curve analyses were performed, and the AUC value corresponding to the sIgE level was 0.839 (p < 0.05), which corresponded to an optimal cut-off value of 0.553 (sensitivity, 0.690; specificity, 0.864). The AUC value corresponding to the sIgE/tIgE was 0.890 (p < 0.05), which corresponded to an optimal cut-off value of 0.647 (sensitivity, 0.966; specificity, 0.682). The sIgE level and sIgE/tIgE ratio had high diagnostic values for the OFC results. A comparison of the AUC between the two groups showed no significant differences (Figure 1c).
3.2.4 Wheat group
The correlation coefficient between sIgE level and the OFC results was 0.533 (p < 0.05), and that between the sIgE/tIgE and the OFC results was 0.538 (p < 0.05). ROC curve analyses showed that the AUC value corresponding to the sIgE level was 0.810 (p < 0.05), which corresponded to an optimal cut-off value of 0.577 (sensitivity, 0.621; specificity, 0.957). The AUC value corresponding to the sIgE/tIgE was 0.813 (p < 0.05), which corresponded to an optimal cut-off value of 0.601 (sensitivity, 0.862; specificity, 0.739). The AUC value corresponding to the sIgE/tIgE was 0.538 (p < 0.05) (sensitivity, 0.862; specificity, 0.739). The sIgE level and sIgE/tIgE had high diagnostic values for the OFC results. A comparison of the AUC between the two groups showed no significant differences (Figure 1d).
3.3 Predictive value of sIgE and sIgE/tIgE for OFC results
3.3.1 All samples
The sIgE level and sIgE/tIgE were used as independent variables, and the OFC results were substituted into a single factor logistic regression analysis as the dependent variable to explore the predictive value of the two examination methods on the OFC results. The regression coefficient of the sIgE level was 0.038 (p < 0.05), and the OR was 1.039 (95% CI: 1.022–1.056) and the regression coefficient of sIgE/tIgE was 0.032 (p < 0.05), and the OR was 1.032 (95% CI: 1.020–1.045), suggesting that the sIgE level and sIgE/tIgE among all the samples had a significant positive influence on the OFC results and could predict the OFC results to an extent (Table 2).
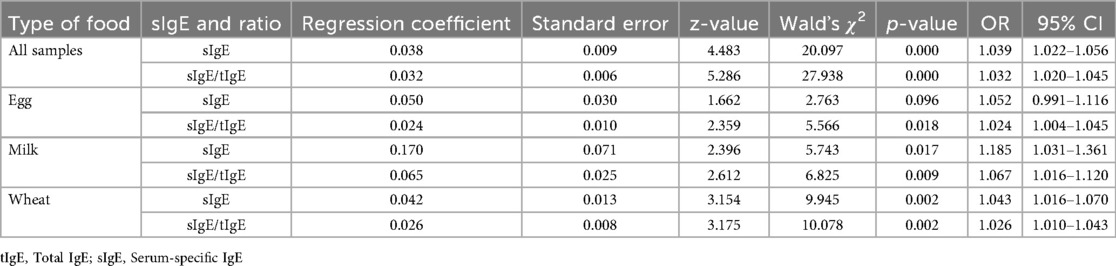
Table 2. Results of single-factor logistic analysis.
Furthermore, when the sIgE level and sIgE/tIgE were used as independent variables and the OFC results were substituted into a multifactorial logistic regression analysis as the dependent variable, the regression coefficient of the sIgE level was 0.014; however, no significant difference was observed, suggesting that the sIgE value cannot predict the OFC results very well. Meanwhile, the regression coefficient of the sIgE/tIgE was 0.026 (p < 0.05), and the OR was 1.026, implying that the sIgE/tIgE has a significant positive influence on the OFC results, and when the sIgE/tIgE was increased by one unit, the odds of obtaining a positive OFC result were 1.026 times higher (Table 3).
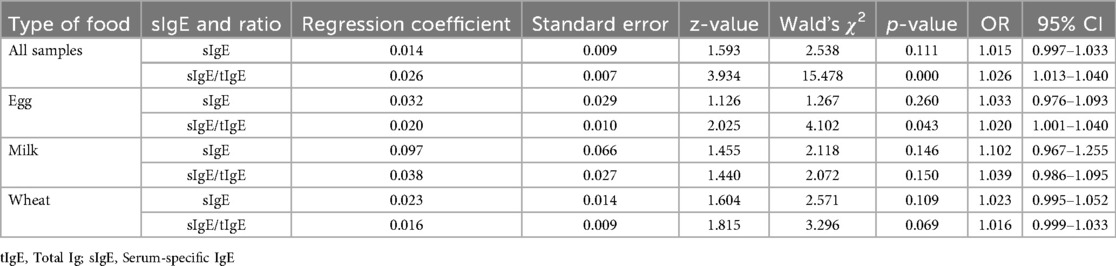
Table 3. Results of multifactor logistic analysis.
3.3.2 Egg white group
The regression coefficient of the sIgE level in the one-way logistic regression analysis of egg protein was 0.050 (p > 0.05). The regression coefficient of the sIgE/tIgE was 0.024 (p < 0.05), and the OR was 1.024, indicating a significant positive relationship with the OFC results; when the sIgE/tIgE was increased by one unit, the odds of obtaining a positive OFC result were 1.024 times higher (Table 2).
When the sIgE level and sIgE/tIgE were used as independent variables, and the OFC results were substituted into the multifactorial logistic regression analysis as the dependent variable, the sIgE level did not predict the OFC results meaningfully. The regression coefficient of the sIgE/tIgE was 0.020 (p < 0.05), the OR was 1.020, and the sIgE/tIgE had a positive influence on the OFC results. When the sIgE/tIgE value was increased by one unit, the odds of obtaining a positive OFC result were 1.020 times higher (Table 3).
3.3.3 Cow's milk group
In the one-way logistic regression analysis in the milk group, the regression coefficient of the sIgE level was 0.170 (p < 0.05), and the OR was 1.185 (95% CI:1.031–1.361). The regression coefficient of the sIgE/tIgE was 0.065 (p < 0.05), and the OR was 1.067 (95% CI: 1.016–1.120), suggesting that the sIgE level and sIgE/tIgE had a significant positive effect on the OFC results and could predict the OFC results to an extent (Table 2). In the multifactorial logistic regression analysis, neither the sIgE level nor the sIgE/tIgE was significant (p > 0.05) (Table 3).
3.3.4 Wheat group
In the one-way logistic regression analysis in the wheat group, the regression coefficient of the sIgE level was 0.042 (p < 0.01), and the OR was 1.043 (95% CI: 1.016–1.070). The regression coefficient of the sIgE/tIgE was 0.026 (p < 0.01), and the OR was 1.026 (95% CI: 1.010–1.043), suggesting that the sIgE level and sIgE/tIgE had a significant positive influence on the OFC results and could predict the OFC results to an extent (Table 2). When analysed using multifactorial logistic regression, the results of both the sIgE levels and sIgE/tIgE were not significant (p > 0.05) (Table 3).
4 Discussion
The OFC is a reliable means of diagnosing food allergies; however, the process is relatively cumbersome and needs to be performed by allergists. Children with positive OFC results are at a high risk of rapid or severe allergic reactions. Although fatal incidents caused by OFCs have rarely been reported, a case of death in a patient who had undergone an OFC was reported in 2017 (6), serving as a wake-up call for allergists to emphasise the safety of the OFC. Recently, in vitro diagnostic methods have become a popular research topic worldwide (2). Researchers are trying to find more suitable risk assessment indicators before OFC to avoid serious allergic reactions during the OFC process and reduce the difficulty of diagnosing food allergies. Or search for more suitable indicators to evaluate whether children diagnosed with IgE mediated food allergies can undergo OFC, assess whether such foods can be reintroduced, and optimize the management process of food allergies.
The sIgE level has high sensitivity but lacks satisfactory specificity in predicting food allergies, and a comprehensive study with a clear history of food allergies is necessary for its clinical application. We propose sIgE/tIgE because when the specificity ratio of a particular IgE antibody is higher, the surface density of IgE antibody molecules on mast cells and basophils with the same allergen specificity is higher; therefore, the likelihood of inducing mediator release upon encountering the allergen is higher. This ratio more accurately reflects the specific binding capacity on the surface of mast cells and basophils and the likelihood of allergen cross-linking and subsequent activation (7). This reduces the rate of false-positive detections that may be associated with non-IgE and confounding immunolabelling, which is not present in the assay.
Analysis of the sIgE/tIgE can determine food allergenicity, and this ratio is more valuable in patients with very low (<20 kU/L) or high tIgE values (8). In this study, we analysed the sIgE/tIgE with OFC results and verified that this ratio may have a better predictive value for OFC positivity than sIgE alone does.
Herein, we found that sIgE levels and the sIgE/tIgE were significantly positively correlated with the OFC results, suggesting that sIgE levels and the sIgE/tIgE were predictive of the OFC test results. However, via ROC analysis, the AUC corresponding to the sIgE/tIgE was not significantly different from that corresponding to the sIgE level when all foods were analysed together or when a single food group, such as egg white, milk, or wheat, was analysed. The OFC should still be the gold standard for diagnosing food allergies.
Whether it is possible to predict OFC outcomes using in vitro tests, determining OFC safety, and choose the appropriate timing for an OFC was also assessed in this study. Gupta et al. (9). found that sIgE/tIgE could predict OFC outcomes. Multifactorial regression analysis in the present study suggested that the predictive value of sIgE/tIgE for OFC outcomes was better than that of sIgE alone in the total sample and egg allergic groups; however, no significant results were obtained for single samples, such as milk and wheat. This is inconsistent with the findings of a study involving 501 children with 992 cases of OFC results (10), which revealed a large discrepancy between the median age of the present study's participants and those reported in the literature. Further refinement of the age subgroups may be needed to validate our results in subsequent studies.
We explored the optimal cut-off value between the sIgE/tIgE and the predicted outcome of the OFC and found that the positivity rate of OFCs was higher when the sIgE/tIgE was >10.42. This suggests that physicians should be cautious in scheduling OFCs when the sIgE/tIgE exceeds 10.42, or they should be more prepared to provide adequate treatment in the event of an OFC to improve safety. For IgE-mediated food allergies, such as those to milk and eggs, a degree of tolerance occurs with age (11, 12), and a decrease in sIgE level may indicate the onset of food tolerance (13). The sIgE/tIgE may be of value in assessing food tolerance and should be investigated in subsequent studies.
Current research suggests that there is no single biomarker that can accurately predict clinical issues such as whether there is an allergy, multiple allergic reactions, or natural remission. However, combining several potential biomarkers can significantly improve the accuracy of allergy disease diagnosis and risk stratification. The classic process of diagnosing food allergies includes a positive medical history, skin prick test, positive results of food specific IgE, and if necessary, assessing the need for OFC based on risk and diagnostic value, and ultimately determining the diagnosis based on the OFC results. The diagnostic value of sIgE/tIgE is discussed in this article, and the results suggest that to some extent, the ratio can predict positive results of OFC or indicate the risk of OFC.
The currently widely recognized potential allergy markers and their detection value include: the value of changes in trypsin in diagnosing severe allergic reactions, the diagnostic value of basophil activation test(BAT) in food allergies, and the diagnostic value of allergen component detection in food allergies or cross allergic reactions (14). But the above tests cannot be conducted in every diagnostic institution. It seems that the clinical diagnostic value of the ratio is not superior to the potential biomarkers mentioned above, but the ratio still has the advantages of being easy to obtain and having certain significance for predicting OFC positive results and risk assessment. But clear results may still require further expansion of the sample size for research.
This study had certain limitations. It was a single-centre retrospective study with a small sample size, lack of detailed differentiation of food characteristics, and lack of grouping according to age. A larger sample size and controlled studies are necessary to validate our results.
In conclusion, the sIgE/tIgE show some promise as a diagnostic and predictive tool for food allergies, particularly in assessing OFC outcomes. Despite the need for further validation with larger cohorts, these findings suggest the potential of the sIgE/tIgE to enhance food allergy diagnosis and management. Future studies should validate the diagnostic and predictive capabilities of the sIgE/tIgE in larger, diverse cohorts.
Data availability statement
The raw data supporting the conclusions of this article will be made available by the authors, without undue reservation.
Ethics statement
The studies involving humans were approved by Ethics Committee of the Peking University Third Hospital. The studies were conducted in accordance with the local legislation and institutional requirements. Written informed consent for participation in this study was provided by the participants' legal guardians.
Author contributions
XX: Writing – original draft, Investigation, Data curation. LL: Methodology, Data curation, Supervision, Writing – original draft, Conceptualization. YZ: Data curation, Writing – original draft. PZ: Conceptualization, Supervision, Writing – review & editing, Methodology, Formal analysis, Investigation. PW: Data curation, Writing – review & editing. JZ: Data curation, Writing – review & editing. WZ: Methodology, Conceptualization, Investigation, Writing – review & editing, Resources, Formal analysis.
Funding
The author(s) declare that financial support was received for the research and/or publication of this article. This work was supported by grants from Central Guiding Local Science and Technology Development Fund Projects of Hebei Province (236Z7734G).
Acknowledgments
We would like to thank all patients who participated in this study, as well as the Laboratory and Information Center for their help in sample collection, testing, and result compilation. We would also like to thank Editage (https://www.editage.cn) for English language editing. This work was supported by Peking University Third Hospital and Central Guiding Local Science and Technology Development Fund Projects of Hebei Province funded this study [grant number 236Z7734G].
Conflict of interest
The authors declare that the research was conducted in the absence of any commercial or financial relationships that could be construed as a potential conflict of interest.
Generative AI statement
The author(s) declare that no Generative AI was used in the creation of this manuscript.
Any alternative text (alt text) provided alongside figures in this article has been generated by Frontiers with the support of artificial intelligence and reasonable efforts have been made to ensure accuracy, including review by the authors wherever possible. If you identify any issues, please contact us.
Publisher's note
All claims expressed in this article are solely those of the authors and do not necessarily represent those of their affiliated organizations, or those of the publisher, the editors and the reviewers. Any product that may be evaluated in this article, or claim that may be made by its manufacturer, is not guaranteed or endorsed by the publisher.
Abbreviations
AUC, area under the ROC curve; OFC, oral food challenge; IgE, immunoglobulin E; sIgE, allergen-specific IgE; tIgE, total IgE; sIgE/tIgE, ratio of allergen-specific IgE to total IgE.
References
1. Ebisawa M, Ito K, Fujisawa T. Japanese Guidelines for food allergy 2020. Allergol Int. (2020) 69:370–86. doi: 10.1016/j.alit.2020.03.004
2. Sicherer SH, Sampson HA. Food allergy: a review and update on epidemiology, pathogenesis, diagnosis, prevention, and management. J Allergy Clin Immunol. (2018) 141:41–58. doi: 10.1016/j.jaci.2017.11.003
3. Sampson HA, Ho DG. Relationship between food-specific IgE concentrations and the risk of positive food challenges in children and adolescents. J Allergy Clin Immunol. (1997) 100:444–51. doi: 10.1016/S0091-6749(97)70133-7
4. Leynaert B, Sunyer J, Garcia-Esteban R, Svanes C, Jarvis D, Cerveri I, et al. Gender differences in prevalence, diagnosis and incidence of allergic and non-allergic asthma: a population-based cohort. Thorax. (2012) 67:625–31. doi: 10.1136/thoraxjnl-2011-201249
5. Pascal M, Moreno C, Dávila I, Tabar AI, Bartra J, Labrador M, et al. Integration of in vitro allergy test results and ratio analysis for the diagnosis and treatment of allergic patients (INTEGRA). Clin Transl Allergy. (2021) 11:e12052. doi: 10.1002/clt2.12052
6. Cox AL, Nowak-Wegrzyn A. Innovation in food challenge tests for food allergy. Curr Allergy Asthma Rep. (2018) 18:74. doi: 10.1007/s11882-018-0825-3
7. Brusselle GG, Koppelman GH. Biologic therapies for severe asthma. N Engl J Med. (2022) 386:157–71. doi: 10.1056/NEJMra2032506
8. Kleine-Tebbe J, Jakob T. Molecular allergy diagnostics using IgE singleplex determinations: methodological and practical considerations for use in clinical routine. Allergo J Int. (2015) 24:185–97. doi: 10.1007/s40629-015-0067-z
9. Gupta RS, Lau CH, Hamilton RG, Donnell A, Newhall KK. Predicting outcomes of oral food challenges by using the allergen-specific IgE–total IgE ratio. J Allergy Clin Immunol Pract. (2014) 2:300–5. doi: 10.1016/j.jaip.2013.12.006
10. Mehl A, Verstege A, Staden U, Kulig M, Nocon M, Beyer K, et al. Utility of the ratio of food-specific IgE/total IgE in predicting symptomatic food allergy in children. Allergy. (2005) 60:1034–9. doi: 10.1111/j.1398-9995.2005.00806.x
11. Fiocchi A, Brozek J, Schünemann H, Bahna SL, von Berg A, Beyer K, et al. World allergy organization (WAO) diagnosis and rationale for action against Cow’s milk allergy (DRACMA) guidelines. Pediatr Allergy Immunol. (2010) 21:S1–125. doi: 10.1111/j.1399-3038.2010.01068.x
12. Ohtani K, Sato S, Syukuya A, Asaumi T, Ogura K, Koike Y, et al. Natural history of immediate-type hen’s egg allergy in Japanese children. Allergol Int. (2016) 65:153–7. doi: 10.1016/j.alit.2015.10.005
13. Shek LP, Soderstrom L, Ahlstedt S, Beyer K, Sampson HA. Determination of food specific IgE levels over time can predict the development of tolerance in cow’s milk and hen’s egg allergy. J Allergy Clin Immunol. (2004) 114:387–91. doi: 10.1016/j.jaci.2004.04.032
Keywords: retrospective studies, oral food challenge, immunoglobulin E ratio, food hypersensitivity, child
Citation: Xu X, Liu L, Zhang Y, Zhou P, Wang P, Zhou J and Zhou W (2025) Allergen-specific IgE/total IgE ratio for food allergy diagnosis in children. Front. Pediatr. 13:1628506. doi: 10.3389/fped.2025.1628506
Received: 15 May 2025; Accepted: 26 September 2025;
Published: 17 October 2025.
Edited by:
Jonathan S. Tam, Children’s Hospital of Los Angeles, United StatesCopyright: © 2025 Xu, Liu, Zhang, Zhou, Wang, Zhou and Zhou. This is an open-access article distributed under the terms of the Creative Commons Attribution License (CC BY). The use, distribution or reproduction in other forums is permitted, provided the original author(s) and the copyright owner(s) are credited and that the original publication in this journal is cited, in accordance with accepted academic practice. No use, distribution or reproduction is permitted which does not comply with these terms.
*Correspondence: Wei Zhou, d2VpejY1NTNAdmlwLnNpbmEuY29t
†These authors have contributed equally to this work and share first authorship