 Qianqian Li
 Jia Zhou2†
 Zhenghao Xu
 Dehong Wu
- 1The Second Affiliated Hospital of Zhejiang Chinese Medical University, Hangzhou, China
- 2School of Basic Medical Sciences, Zhejiang Chinese Medical University, Hangzhou, China
Glucocorticoids (GCs) are commonly used to treat systemic lupus erythematosus (SLE). Unfortunately, excessive GCs can induce many side effects associated with disordered fatty acid (FA) metabolism. Although an increased level of total FA has been found after GCs treatment, it is not clear whether all FA species increased or only certain FA species were altered. A gas chromatography–mass spectrometry-based FA profiling approach was performed to reveal the alterations of FA species in SLE model mice (MRL/lpr) after treatment with 5 mg/kg of prednisone. The study showed a distinct FA profile in MRL/lpr mice compared to the controls, mainly manifested by elevated polyunsaturated FAs (arachidonate, docosahexaenoate, etc.), which are related to the inflammatory state; and altered (product FA/precursor FA) ratios representing the estimated activities of FA desaturase and elongase (higher activities of multiple elongases, △4 desaturase, △5 desaturase, △6 desaturase, and lower activity of △8 desaturase). Treatment with 5 mg/kg of prednisone decreased the total level of n-6 polyunsaturated FA in MRL/lpr mice; in particular, the level of arachidonate and estimated activity of △5 desaturase were reduced to the control level. Moreover, prednisone induced additional perturbations in FAs, including not only saturated FAs, but also monounsaturated FAs and n-3 polyunsaturated FAs, indicating that there was a strong effect of prednisone on FA metabolism. These results may be valuable for further studies of the side effects of GCs treatment.
Introduction
Systemic lupus erythematosus (SLE) is a typical, systemic autoimmune disease that causes damage to multiple organ systems (Lisnevskaia et al., 2014; Tsokos et al., 2016). Most SLE occurs in women of childbearing age, and environment, gene, infection and hormone factors are considered to contribute to the development of SLE. Although detailed research has been carried out, the pathogenesis of SLE is still not completely clear (Rekvig and Van der Vlag, 2014).
Epidemiological studies have shown that, compared with the general population, the prevalence of many metabolic disorders, such as abnormal glucose metabolism and disturbed lipid metabolism, has increased in patients with SLE (Tselios et al., 2016; Yan et al., 2016). Lipids are fundamental components of cells, and altered lipid metabolism can elevate the risk of cardiovascular disease and renal involvement in SLE patients (Frostegard et al., 2005; Teixeira and Tam, 2017). Fatty acid (FA) is an important kind of lipids with diverse functions, not only as part of cell membranes, but also as energy sources that can participate in a wide range of physiological and pathological conditions (Falomir-Lockhart et al., 2019). According to the saturation degree of hydrocarbon chains, FAs can be divided into three types: saturated fatty acids (SFAs), monounsaturated fatty acids (MUFAs) and polyunsaturated fatty acids (PUFAs).
Some species of FA can affect the inflammatory state of the body. For example, linoleic acid and arachidonic acid (AA) have pro-inflammatory effects (Alashmali et al., 2019), while docosahexaenoic acid (DHA) and eicosapentaenoic acid (EPA) have anti-inflammatory and immunomodulatory properties (Weylandt et al., 2012; Calder, 2015). Previous studies have found that abnormal FA levels are associated with insulin resistance and atherosclerosis (Lepretti et al., 2018; Steffen et al., 2018). Thus, it is speculated that the perturbations of FA metabolism may disrupt the metabolic homeostasis and immune balance of the body, and promote the development and progression of SLE complications. Currently, some researchers have shown altered FAs in patients with SLE (Aghdassi et al., 2011; Wu et al., 2012; Ormseth et al., 2013). However, due to the differences in disease activities and treatment strategies of patients, these studies have reached inconsistent conclusions.
Glucocorticoids (GCs) are widely used in the control and remission of SLE due to their effective anti-inflammatory and immunomodulatory effects. Recent studies have found that excessive GCs treatment can stimulate lipolysis, leading to an increase in the total level of FAs in the blood, which is one of the important factors of insulin resistance (Geer et al., 2014). Insulin resistance is not only associated with type 2 diabetes, but also with complications such as obesity and atherosclerosis (Bloomgarden, 2019). Although increased FA levels were found after GCs intervention, it was not clear whether all FA species increased or whether only certain FA species were altered. Therefore, a global analysis of FA profiles following treatment with GCs is necessary.
Metabolomics has the advantages of high throughout and high sensitivity, and is helpful to clarify the pathology of disease and the mechanism of drug action (Zhang et al., 2014; Luo et al., 2018; Tang et al., 2018). In this study, the FA metabolic profile of SLE model mice (MRL/lpr) was studied using the gas chromatography coupled with mass spectrometry (GC–MS) technique to reveal FA alterations related to SLE. In addition, the effects of prednisone (a kind of GCs) on FA metabolism were investigated.
Materials and Methods
Reagents
The 10% BF3/MeOH, the isotopically labeled internal standard (dodecanoic-12, 12, 12-d3 acid), sodium hydroxide (99.9%) and prednisone were purchased from Sigma-Aldrich (St. Louis, MO, USA). Methanol and n-hexane of HPLC grade were provided by Merck Chemicals (Darmstadt, Germany). Sodium chloride (99.9%) was purchased from Aladdin (Shanghai, China). A Milli-Q system (Millipore Corp, Millipore, MA, USA) was used to provide ultra-pure water.
Animal Model and Drug Treatment
Eight-week-old female MRL/lpr (n=10) and C57/BL6 (n=5) mice were purchased from the Experimental Animal Center of Zhejiang Chinese Medical University (Hangzhou, China). The experimental protocol was approved by the Experimental Animal Health Ethics Committee of Zhejiang Chinese Medical University (license no: SCXK (Shanghai) 2012-0005). Experimental animals were maintained under specific pathogen-free conditions according to agency guidelines. Mice were kept with a 12-h light/dark cycle and with access to water and food ad libitum. Considering that SLE has a marked female predominance, we included only female mice in the experimental design, and five individual mice were used for each group. C57/BL6 mice served as the control group (n = 5). MRL/lpr mice were divided randomly into two groups: SLE model group (MRL/lpr group, n = 5) and GC group (n = 5). From the age of 8–16 weeks, mice in the GC group were intragastrically administered 5 mg/kg of prednisone suspension per day, which is equivalent to 0.5 mg/kg in humans. Model group and control group received an equal volume of saline accordingly. Mice were sacrificed 8 weeks after drug treatment, blood samples were collected from the eye socket vein and centrifuged at 845 × g for 10 min. The isolated serum samples were stored at –80°C. A scheme of the study design is shown in Figure 1.
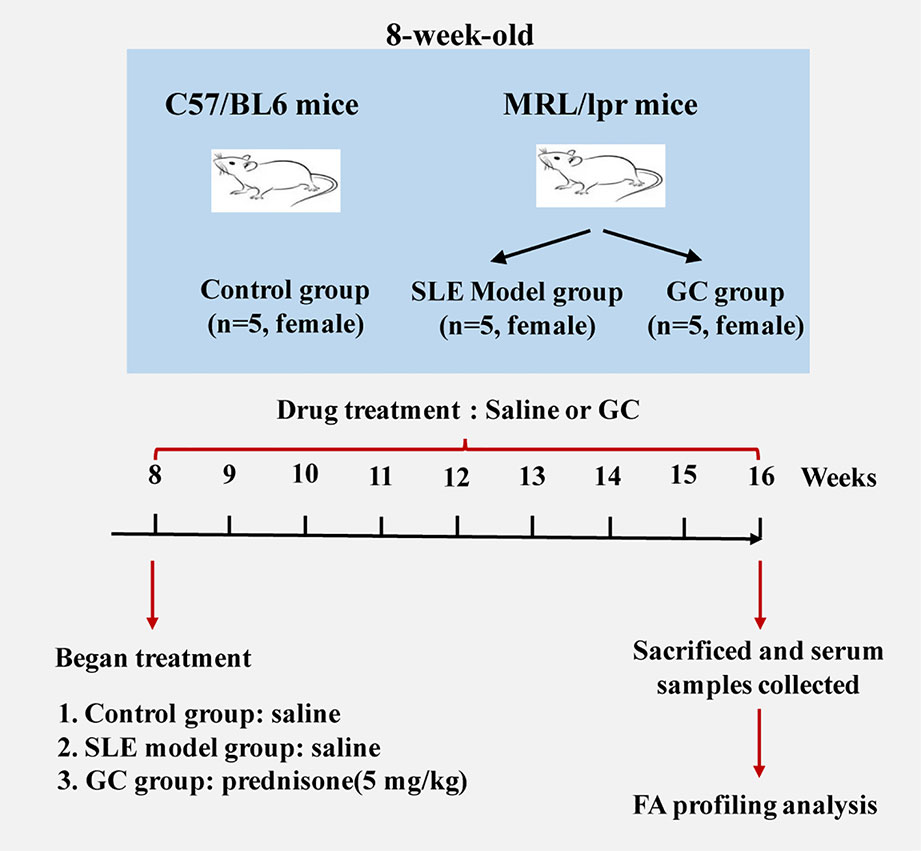
Figure 1 Schematic diagram of the study design (n = 5 for each group).
Sample Preparation for FA Profiling Analysis
A total of 20 μL of serum was added into a microcentrifuge tube containing 20 μL of internal standard solution (dodecanoic-12, 12, 12-d3 acid, 0.05 g/L). Subsequently, 200 μL of 0.5 mol/L NaOH/MeOH was added and mixed for 1 min. After incubation at 90°C for 5 min, 200 μL of 10% BF3/MeOH solution was added, and the mixture was incubated at 90°C for 5 min. After cooling, the sample was extracted using 200 μL n-hexane and 200 μL of saturated saltwater. The upper organic phase was concentrated and dried with a Labconco CentriVap system (Labconco, Kansas, MO, USA). Finally, 50 μL of n-hexane was added into the dried residue for reconstitution before GC–MS analysis.
GC–MS Analysis
GC–MS analysis was performed on an Agilent 7890/5975C GC–MS (Agilent Technologies, Santa Clara, CA, USA). FAs were separated using a 30 m × 0.25 mm × 0.25 μm DB-5 MS fused silica capillary column (J&W Scientific, Folsom, CA, USA). The sample injection volume was 1 μL with a split ratio of 10:1. Helium (99.9996%) was used as the carrier gas and the flow rate was 1.2 mL/min. The injector and transfer line temperatures were both 280°C. The oven temperature program was: 60°C for 1 min, then ramped to 200°C at 20°C/min, and held for 3 min; later, ramped to 280°C at 5°C/min, and held for 5 min. The metabolic data were collected at the mass scan range from 50 to 500 amu after a solvent delay of 3.5 min. All samples were analyzed in a random order.
In order to monitor the repeatability of sample analysis, quality control (QC) samples were added into the analysis sequence for every 3 samples. QC samples were prepared by equally mixing the tested serum samples, and processed together with samples.
Data Processing and Statistical Analysis
Serum FAs were identified and integrated by MSD ChemStation software (Agilent Technologies, Santa Clara, CA, USA). The peak area was normalized to the internal standard before further statistical analysis. Subsequently, the normalized data were subjected to a principal component analysis (PCA) using the SIMCA-P 11.0 version (Umetrics AB, Umea, Sweden) to display an overview of the difference of FA profiles among all groups. To further investigate the effects of different treatments (model or GC-treatment) on each FA, one-way analysis of variance (ANOVA) was performed with Tukey’s multiple comparisons test for post hoc comparison using SPSS 18.0 (International Business Machines Corp., Armonk, NY, USA). P values were adjusted using the Benjamini–Hochberg method. In addition, the ratio of product FA/precursor FA, an indicator of FA desaturase and elongase activity (Vessby et al., 2002; Warensjö et al., 2005), was calculated and compared between groups using ANOVA. Significantly changed FAs were clustered based on their Pearson correlation coefficients. All data were presented as mean ± SEM. Statistical significance was defined as P < 0.05, and a statistical trend was defined as P < 0.1.
Results
FA Metabolic Profiles of Mice Serum Samples
Thirty species of long chain FAs were detected in the serum samples (Figure 2A), including ten SFAs (C12:0, C14:0, C15:0, C16:0, C17:0, C18:0, C19:0 C20:0, C22:0 and C24:0), eight MUFAs (C16:1 n9, C16:1 n7, C17:1 n7, C18:1 n9, C18:1 n7, C20:1 n9, C22:1 n9, and C24:1 n9) and 12 PUFAs (C16:2 n6, C18:2 n6, C18:3 n3, C20:2 n6, C20:3 n6, C20:4 n6, C22:4 n6 iso, C20:5 n3, C22:4 n6, C22:5 n6, C22:5 n3, and C22:6 n3). The most abundant FAs included C12:0, C16:0, C18:0, C18:1 n7, C18:1 n9, C18:2, C22:5 n6, C20:5 n3, C18:2 n6, C22:6 n3, and C20:4 n6. After calculating the relative standard deviation (RSD) of each FA in QCs (n = 5), approximately 99.1% of the detected FAs showed an RSD below 10%, and all detected FAs had an RSD below 20% (Figure 2B), which demonstrated satisfactory robustness and reproducibility of the analytical method.
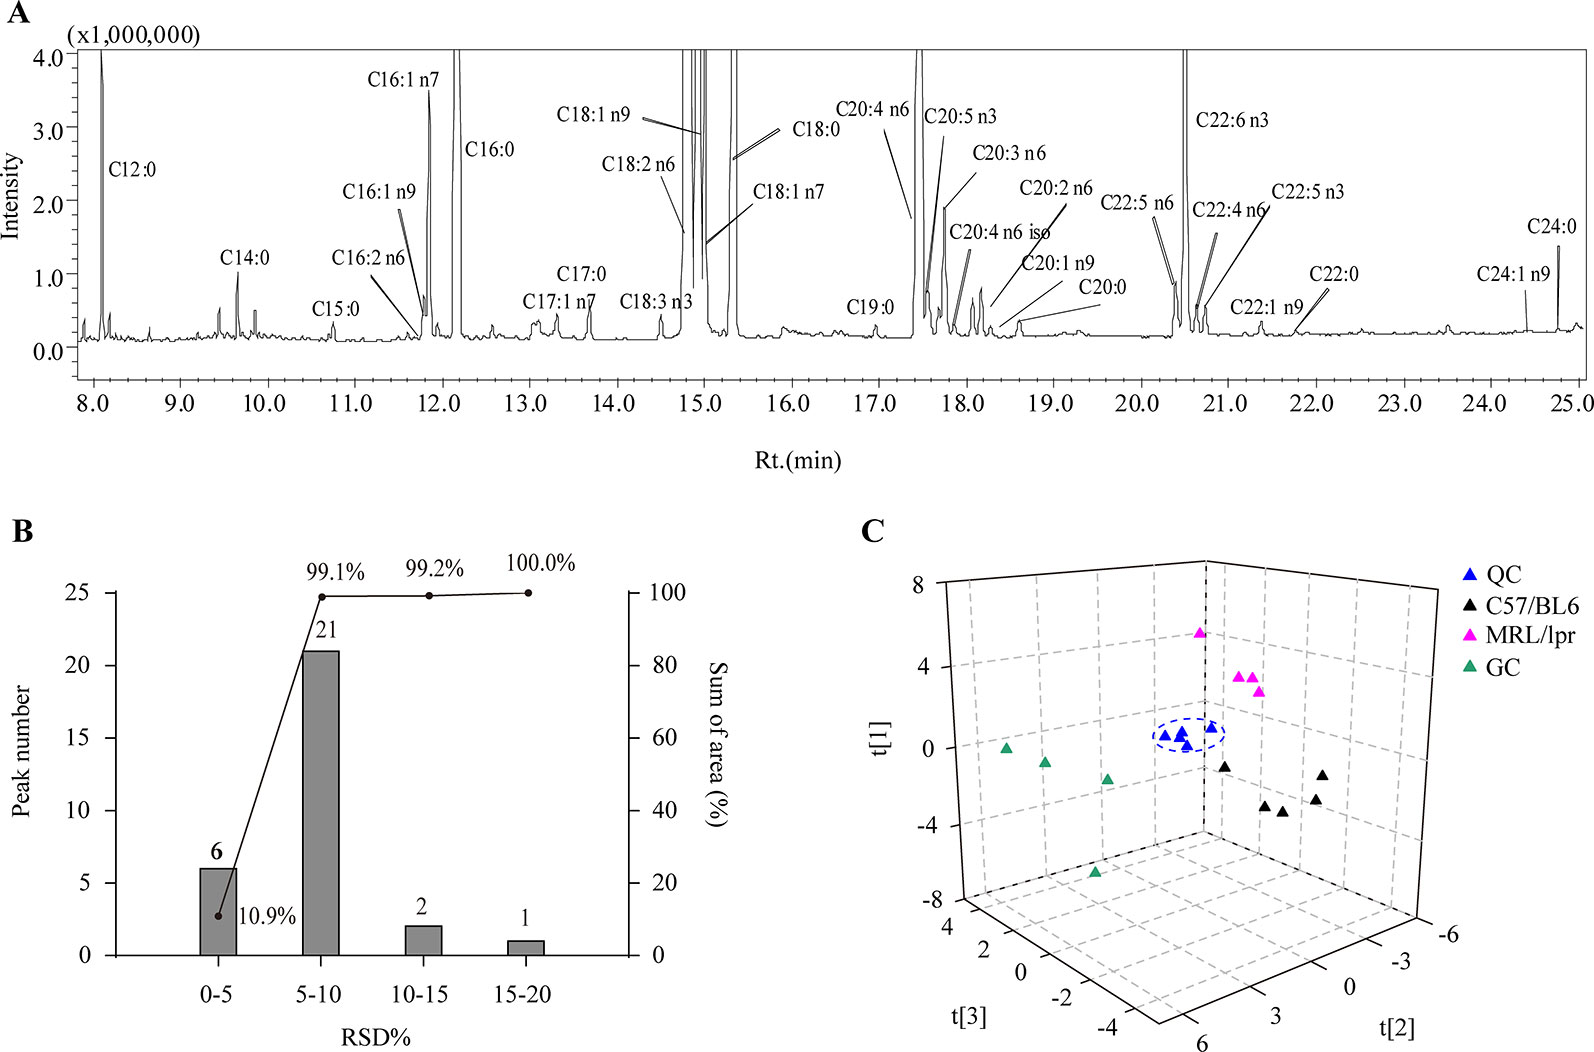
Figure 2 Analytical characteristics of the GC-MS-based FA profiling approach. (A) A representative total ion chromatogram of serum FAs. (B) RSD distribution plot of 30 species of FAs in five QCs; the columns indicate the number of FAs in the specified RSD range, and the line indicates the percentage of summed FA response in the specified RSD range. (C) PCA score plot of all samples based on FA profiles.
Overview of the Differences in FA Profiles Among Groups
In order to generally observe the differences of FA profiles in all samples, PCA was performed based on the serum FAs data from the control, model and GC groups. The 3D score plot showed a clear separation among the three groups, and QCs were clustered closely (Figure 2C). To further discriminate the effect of different treatments on FAs, PCAs of different pairwise groups were conducted. The distribution plots suggested that there was an obvious FA metabolic discrepancy between the control and MRL/lpr mice, and prednisone treatment caused significant perturbations in FA metabolism (Figure 3).
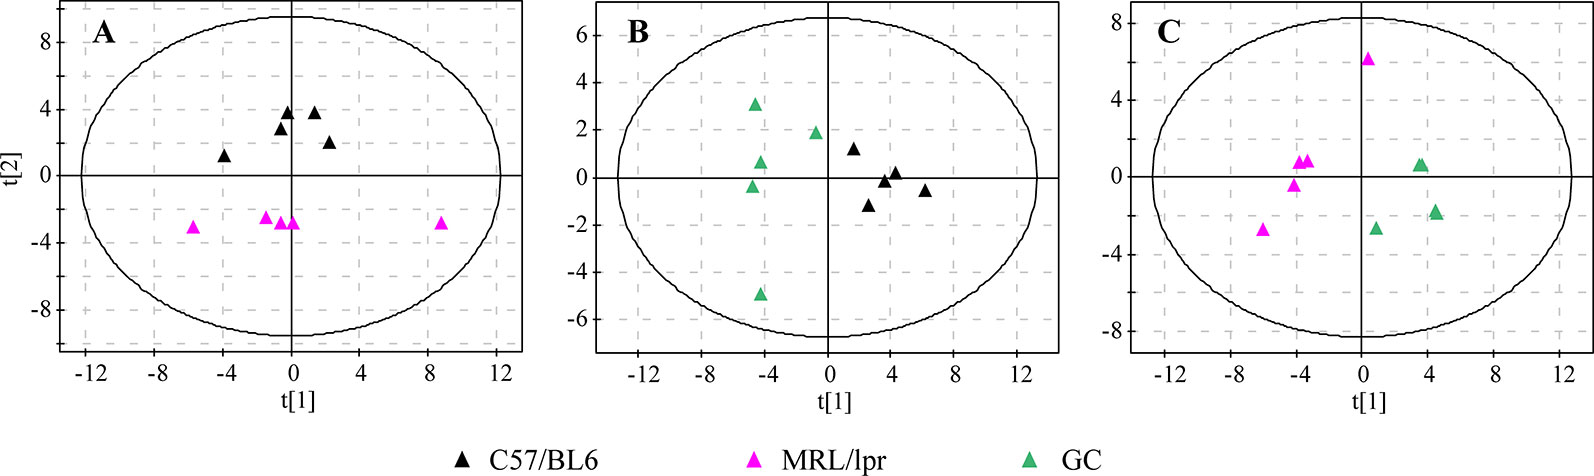
Figure 3 PCA score plots of different pairwise groups. (A) C57/BL6 and MRL/lpr groups, (B) C57/BL6 and GC groups, and (C) MRL/lpr and GC groups (n = 5 for each group).
Alterations in the Total Amount of FAs
The total levels of SFA, MUFA, PUFA, and TFA (total fatty acid) in serum samples were calculated separately for each mouse. Compared to the control group, there were no significant changes in the total levels of SFA and MUFA in the MRL/lpr group, but the total PUFA level was significantly elevated, with both n-3 PUFA and n-6 PUFA increasing significantly (P < 0.05); the total levels of SFA, MUFA, and PUFA were all elevated in the GC group, while n-6 PUFA was returned to the control level. The total SFA and MUFA levels were significantly different between the model group and GC group (P < 0.05) (Figure 4).
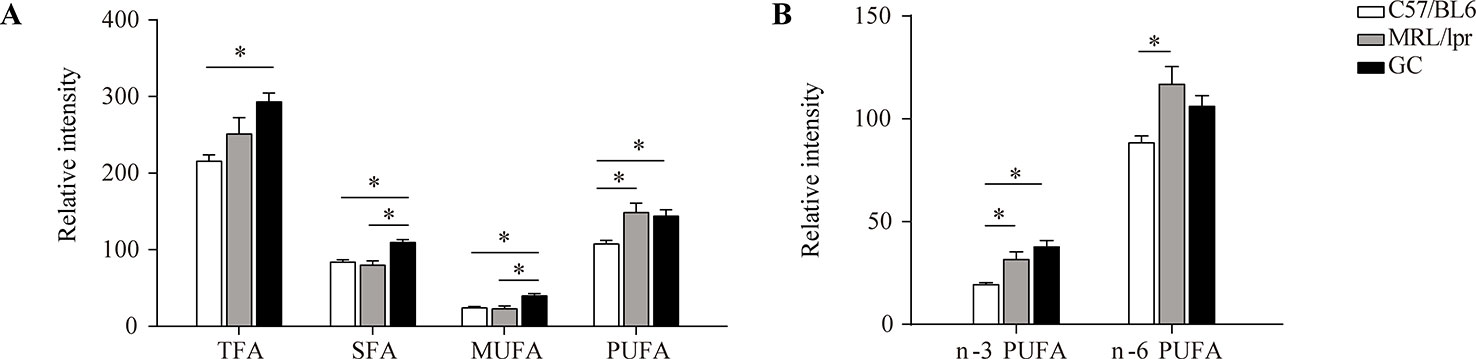
Figure 4 Changes in the total levels of various FAs. (A) TFA, SFA, MUFA and PUFA, and (B) n-3 PUFA and n-6 PUFA. Results are expressed as mean ± SEM (n = 5 for each group). The P values were obtained from ANOVA followed by Tukey’s post hoc test. *P < 0.05.
Changes of FA Species in MRL/lpr Mice
To reveal the FA changes related to SLE, we measured the difference of each FA species between the control and model groups. The level of serum C14:0 was slightly decreased in MRL/lpr mice compared to the controls (P < 0.1). After the treatment with prednisone, the level of C14:0 was up-regulated and was a little higher than that of controls (P < 0.1) (Figure 5A).
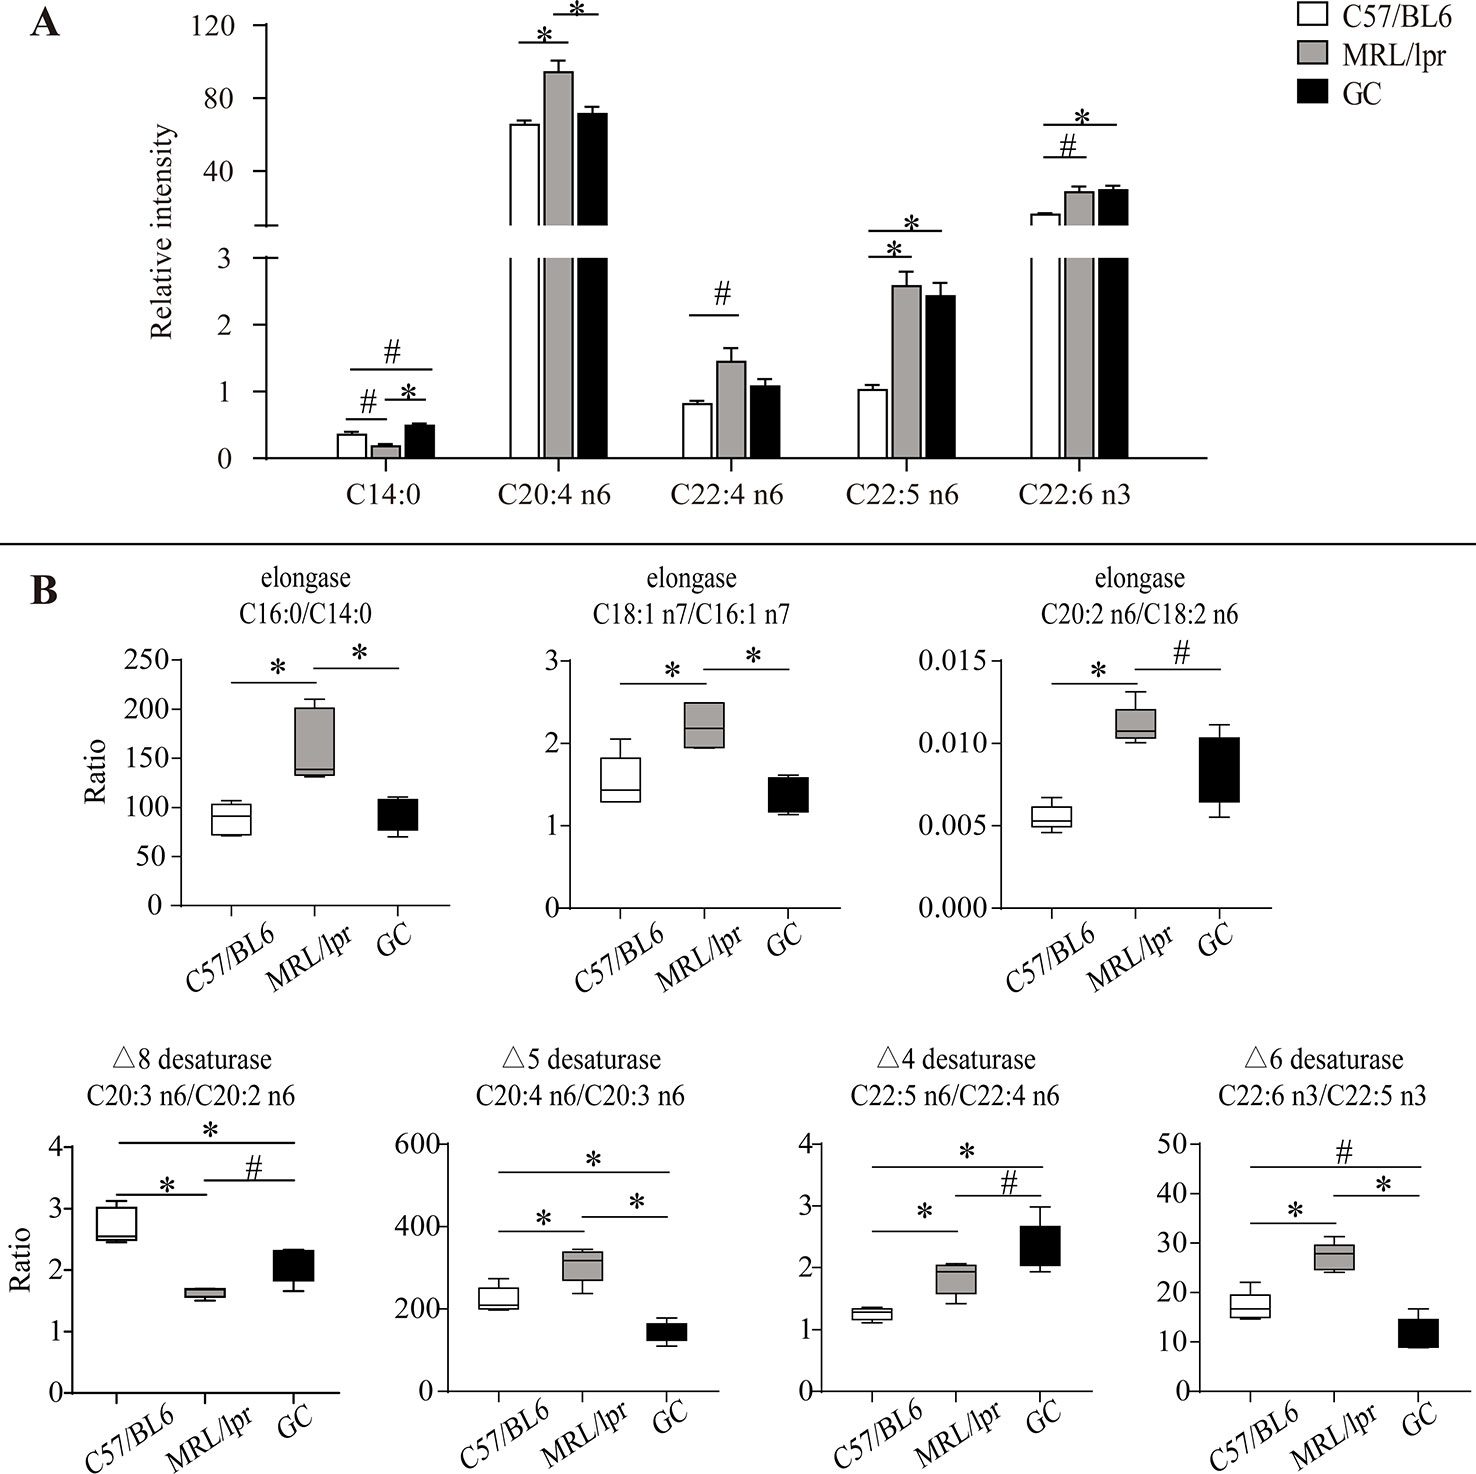
Figure 5 Alteration of serum FA species and product/precursor ratios in MRL/lpr mice compared to those in C57/BL6 mice. (A) Bar plots of changed FA species. Results are expressed as mean ± SEM (n = 5 for each group). (B) Box plots of changed product/precursor FA ratios (n = 5 for each group). The P values were obtained from ANOVA followed by Tukey’s post hoc test. *P < 0.05, #P < 0.1.
Compared to the control group, some changes occurred in four kinds of serum PUFAs (C20:4 n6, C22:4 n6, C22:5 n6, C22:6 n3) in MRL/lpr mice. Among them, the levels of C20:4 n6 and C22:5 n6 were significantly increased (P < 0.05); moreover, C22:4 n6 and C22:6 n3 showed an increasing trend (P < 0.1) in the model group. After treatment with prednisone, C20:4 n6 and C22:4 n6 were down-regulated to the levels of those of the control group, but no changes occurred in C22:5 n6 and C22:6 n3 (Figure 5A).
Estimation of Desaturase and Elongase Activities
The synthesis of unsaturated FAs is involved in several metabolic enzymes, such as desaturase and elongase. Desaturase can introduce double bonds, and elongase can lengthen carbon chains by adding two carbon atoms. Product/precursor FA ratios are generally employed to estimate the activities of FA desaturase and elongase (Vessby et al., 2002; Nakamura and Nara, 2004; Warensjö et al., 2005). In this study, the serum product/precursor FA ratios were computed and compared. As compared to the control group, seven ratios were significantly changed in the MRL/lpr group.
Three of these ratios were related to the estimated elongase activities, including (C16:0/C14:0), (C18:1 n7/C16:1 n7) and (C20:2 n6/C18:2 n6), which were significantly increased in MRL/lpr mice compared to those in C57/BL6 mice (P < 0.05) (Figure 5B). After treatment with prednisone, all three ratios were returned to the control group level.
The other four ratios were related to the estimated desaturase activities. Among them, (C20:4 n6/C20:3 n6), (C22:5 n6/C22:4 n6), and (C22:6 n3/C22:5 n3) were relatively higher in MRL/lpr mice than those in C57/BL6 mice, while (C20:3 n6/C20:2 n6) was decreased (P < 0.05). After treatment with prednisone, (C20:4 n6/C20:3 n6), and (C22:6 n3/C22:5 n3) were down-regulated, but (C20:3 n6/C20:2 n6) and (C22:5 n6/C22:4 n6) showed increases (Figure 5B).
Additional FA Metabolic Perturbations After Treatment With Prednisone
Except for the SLE-related FAs, prednisone intervention caused additional changes in 16 species of FAs, including six species of SFAs (C16:0, C18:0, C20:0, C22:0, C17:0, and C19:0), five species of MUFAs (C16:1 n7, C17:1 n7, C18:1 n9, C18:1 n7, and C20:1 n9) and five species of PUFAs (C18:2 n6, C20:2 n6, C20:3 n6, C20:5 n3, and C22:5 n3) (P < 0.05) (Figure 6). All these FAs showed significant increases compared to the control and model groups, indicating a powerful effect of prednisone on serum FA metabolism.
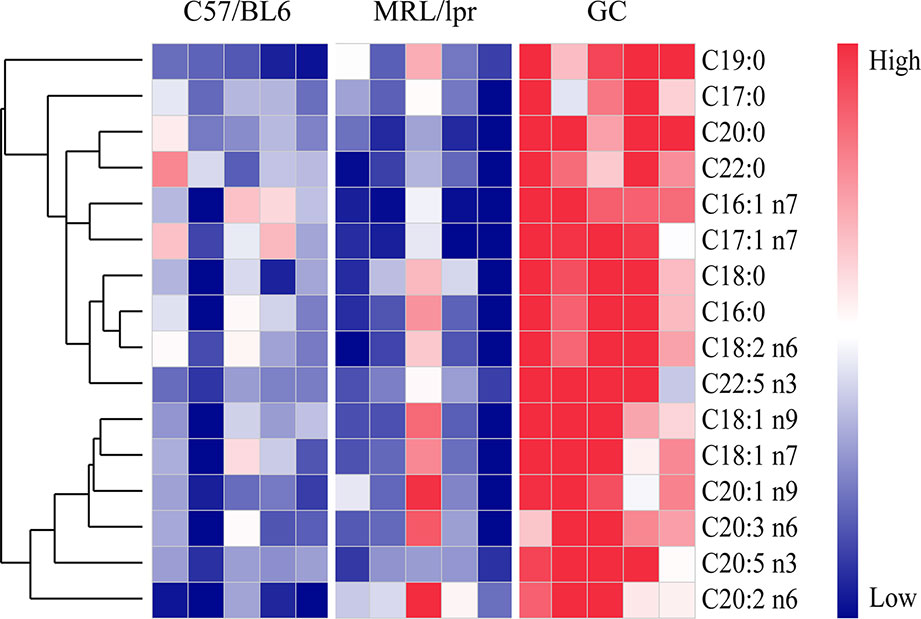
Figure 6 FA species with significant alterations under treatment with prednisone (n = 5 for each group). The FAs were clustered based on their Pearson correlation coefficients. Red represents higher concentrations, while blue represents lower concentrations.
Discussion
SLE is an autoimmune inflammatory disease characterized by aberrant antibody response to multiple self-antigens and chronic inflammation that can involve multiple organs. GCs are commonly used to treat SLE, but superphysiological dosing can cause many side effects. Recent studies have found that GCs can lead to an increase in the total level of FAs in the blood, which is one of the important GC side effects (Arner, 2002). However, it was not clear which species of FAs were changed by GCs. Here, a GC–MS based FA profiling analysis was performed to comprehensively explore the specific FA changes related to SLE and FA metabolic perturbations induced by GCs. Figure 7 summarizes the alterations of FAs and estimated desaturase/elongase activities in SLE model mice and GC-treated mice.
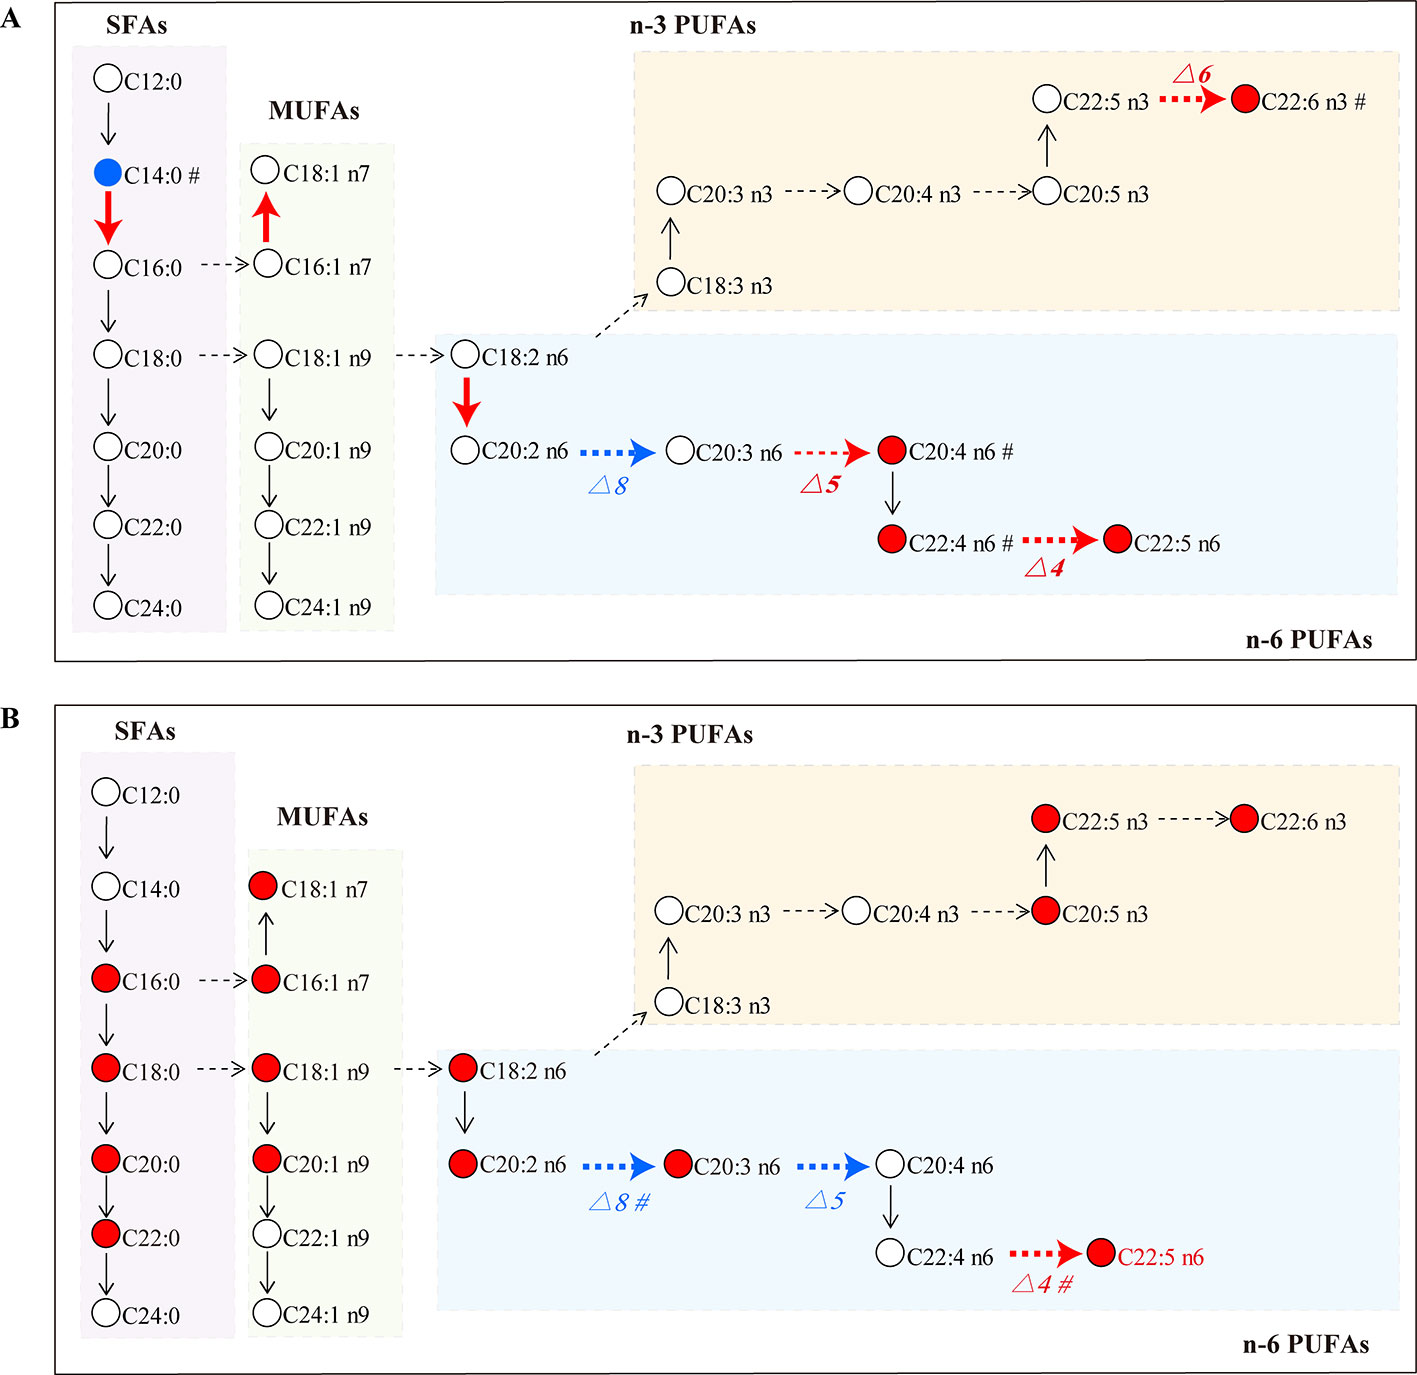
Figure 7 FA biosynthesis pathway changes in the MRL/lpr group (A) and the GC group (B) compared to the C57/BL6 group (n = 5 for each group). Dotted arrow: estimated desaturase activity; solid arrow: estimated elongase activity; red: significantly increased (P < 0.05); blue: significantly decreased (P < 0.05); #: slightly changed (P < 0.1).
This study found that the total level of n-6 PUFA was elevated in MRL/lpr mice. Similarly, Aghdassi et al. (2011) observed an increase in n-6 PUFA in SLE patients. PUFAs are classified as n-3 and n-6 PUFAs according to the location of the double bonds. The derivates from n-3 PUFAs have anti-inflammatory and immunomodulatory properties (Weylandt et al., 2012; Calder, 2015), whereas those from n-6 PUFAs are generally known to have pro-inflammatory effects (Alashmali et al., 2019). Some specific n-6 PUFA changes related to SLE were discovered in this study. C20:4 n6 (arachidonic acid, AA) is a kind of n-6 PUFA, and we found that the level of AA was much higher in SLE model mice than in control mice. When stimulated by various factors, especially when an inflammatory reaction occurs, AA is released from the cell membrane, and oxidized by enzymes to produce eicosanoids (prostaglandin, thromboxane, leukotriene, etc.) (Calder, 2006), which is an important mediator of inflammation and is implicated in regulating the magnitude and persistence of inflammatory responses. Thus, we speculated that increased AA may promote the biosynthesis of pro-inflammatory eicosanoids and related pro-inflammatory cytokines, which is associated with the increased inflammation response in SLE model mice.
The level of C22:6 n-3 (docosahexaenoic acid, DHA) was increased in MRL/lpr mice. DHA is a potent inhibitor of NF-κB (nuclear factor κ B). The elevated levels of reactive oxygen species or other inflammatory signaling molecules (e.g. eicosanoid) can promote NF-κB activation and up-regulate the expression of many pro-inflammatory genes (IL-2, IL-6, IL-8, TNFα, etc.). DHA can directly or indirectly inhibit NF-κB by affecting G protein-coupled receptors and decreasing the release of phospholipase A2 to decrease the synthesis of eicosanoids, thus reducing the level of systemic inflammation (Calder, 2006). Thus, increased DHA may protect against inflammation in the SLE model mice. However, some studies of SLE patients get discrepant results, which may be related to the disease status, drug treatment and diet (Wu et al., 2012; Shin et al., 2017).
Long-chain FAs are mainly produced by enzyme-catalyzed palmitic acid extension and desaturation; the involved enzymes are elongase and desaturase, respectively. Elongase lengthens carbon chains by adding two carbon atoms, and desaturase introduces double bonds at specific positions on the carbon chain to increase the degree of unsaturation (Nakamura and Nara, 2004; Jakobsson et al., 2006). The activities of elongase and desaturase affect FA synthesis in the body, and the ratio of product/precursor FA in serum was used to evaluate the activities of FA desaturase and elongase (Yang et al., 2016). In this study, the ratios of (C16:0/C14:0), (C18:1 n7/C16:1 n7) and (C20:2 n6/C18:2 n6) were significantly increased in MRL/lpr mice compared to those in C57/BL6 mice, which suggested that the activity of corresponding elongase may be enhanced in model mice. (C20:4 n6/C20:3 n6) reflecting the activity of △5 desaturase, (C22:5 n6/C22:4 n6) reflecting the activity of △4 desaturase and (C22:6 n3/C22:5 n3) reflecting the activity of △6 desaturase were increased in MRL/lpr mice compared to those in C57/BL6 mice, while (C20:3 n6/C20:2 n6) reflecting the activity of △8 desaturase was decreased. MRL/lpr mice were found to have higher activities of △4 desaturase, △5 desaturase, △6 desaturase, and lower activity of △8 desaturase than control mice. The alteration in estimated desaturase activities might thereby affect the levels of downstream FAs (C22:6 n3, C20:4 n6, C22:4 n6 and C22:5 n6).
Prednisone is a widely used GC drug for anti-inflammatory and immunomodulatory therapies. Our results showed that the total level of n-6 PUFA was returned to the control level after treatment with prednisone. In particular, AA, an important precursor of pro-inflammatory eicosanoids, was down-regulated to the control level; moreover, the estimated activity of △5 desaturase (C20:4 n6/C20:3 n6 ratio) was reduced by prednisone, which may contribute to the decreased biosynthesis of AA. Inhibition of AA biosynthesis might be one of the anti-inflammatory mechanisms of prednisone. Previous researchers have found that GCs stimulate the decomposition of triacylglycerol to increase serum FA level by permitting and enhancing the lipolysis response to catecholamines, thyroxine and growth hormone, or acting on GC receptors of adipose cells (Xu et al., 2009). In our study, a wide range of FA metabolic perturbations were induced by prednisone, including the abnormal up-regulation of many species of SFAs, MUFAs and n-3 PUFAs, thus resulting in the elevation of the total FA level in blood. A persistent high level of FA is involved in the pathogenesis of insulin resistance (Arner, 2002), which may raise the risk of some complications in patients, such as type 2 diabetes, obesity, hypertension and coronary heart disease (Zappia and Monczor, 2019). Therefore, the perturbation effect of GCs on FA metabolism should be measured when using GCs to treat SLE, which could be an important indicator of the side effects of GCs.
Conclusion
In this study, a GC–MS based FA profiling analysis was performed to reveal which species of FAs have been changed following disease and GCs treatment. The serum FA profile was altered in SLE model mice, mainly manifested by the increase of PUFAs, such as AA and DHA, which may be related to the inflammatory state. Moreover, some product/precursor FA ratios representing the estimated activities of desaturase and elongase were changed. Treatment with 5 mg/kg of prednisone reversed the change of n-6 PUFA, especially AA, which may be one of its anti-inflammatory mechanisms. Prednisone also induced a wide range of perturbations in FA metabolism; the FA level in blood was elevated, not just SFAs, but also MUFAs and n-3 PUFAs. These results may be valuable for further studies of the pathogenesis of SLE and the side effects of GC treatment.
Data Availability Statement
All datasets generated for this study are available from the corresponding author on reasonable request.
Ethics Statement
The animal study was reviewed and approved by the Experimental Animal Health Ethics Committee of Zhejiang Chinese Medical University.
Author Contributions
Authors’ contributions were as follows: conception and design of the study (JZ, DW); animal experiment (DZ, XZ); metabolomics analysis (QL, DZ, XZ); data analysis and interpretation (JZ, ZX); drafting the article (QL, DW); and critical revisions for important intellectual content (JZ, DW). All authors read and approved the final manuscript.
Funding
This study has been supported by the National Natural Science Foundation of China (No. 81403269, 81703966, 81873102), and Zhejiang Traditional Chinese Medicine Administration (No. 2017ZA064).
Conflict of Interest
The authors declare that the research was conducted in the absence of any commercial or financial relationships that could be construed as a potential conflict of interest.
References
Aghdassi, E., Ma, D. W., Morrison, S., Hillyer, L. M., Clarke, S., Gladman, D. D., et al. (2011). Alterations in circulating fatty acid composition in patients with systemic lupus erythematosus: a pilot study. J. Parenter Enteral Nutr. 35 (2), 198–208. doi: 10.1177/0148607110386378
Alashmali, S. M., Lin, L., Trepanier, M. O., Cisbani, G., Bazinet, R. P. (2019). The effects of n-6 polyunsaturated fatty acid deprivation on the inflammatory gene response to lipopolysaccharide in the mouse hippocampus. J. Neuroinflamm. 16 (1), 237. doi: 10.1186/s12974-019-1615-0
Arner, P. (2002). Insulin resistance in type 2 diabetes: role of fatty acids. Diabetes-Metab- Res. 18 (S2), S5–S9. doi: 10.1002/dmrr.254
Bloomgarden, Z. (2019). Insulin resistance: looking back, looking forward. J. Diabetes 2019, 1–3. doi: 10.1111/1753-0407.13014
Calder, P. C. (2006). n–3 Polyunsaturated fatty acids, inflammation, and inflammatory diseases. Am. J. Clin. Nutr. 83 (6), 1505S–1519S. doi: 10.1093/ajcn/83.6.1505S
Calder, P. C. (2015). Marine omega-3 fatty acids and inflammatory processes: effects, mechanisms and clinical relevance. Biochim. Biophys. Acta 1851 (4), 469–484. doi: 10.1016/j.bbalip.2014.08.010
Falomir-Lockhart, L. J., Cavazzutti, G. F., Gimenez, E., Toscani, A. M. (2019). Fatty acid signaling mechanisms in neural cells: fatty acid receptors. Front. Cell. Neurosci. 13, 162. doi: 10.3389/fncel.2019.00162
Frostegard, J., Svenungsson, E., Wu, R., Gunnarsson, I., Lundberg, I. E., Klareskog, L., et al. (2005). Lipid peroxidation is enhanced in patients with systemic lupus erythematosus and is associated with arterial and renal disease manifestations. Arthritis Rheumatol. 52 (1), 192–200. doi: 10.1002/art.20780
Geer, E. B., Islam, J., Buettner, C. (2014). Mechanisms of glucocorticoid-induced insulin resistance: focus on adipose tissue function and lipid metabolism. Endocrinol. Metab. Clinics North America 43 (1), 75–102. doi: 10.1016/j.ecl.2013.10.005
Jakobsson, A., Westerberg, R., Jacobsson, A. (2006). Fatty acid elongases in mammals: their regulation and roles in metabolism. Prog. Lipid Res. 45 (3), 237–249. doi: 10.1016/j.plipres.2006.01.004
Lepretti, M., Martucciello, S., Burgos Aceves, M. A., Putti, R., Lionetti, L. (2018). Omega-3 fatty acids and insulin resistance: focus on the regulation of mitochondria and endoplasmic reticulum stress. Nutrients 10 (3), 350. doi: 10.3390/nu10030350
Lisnevskaia, L., Murphy, G., Isenberg, D. (2014). Systemic lupus erythematosus. Lancet 384 (9957), 1878–1888. doi: 10.1016/S0140-6736(14)60128-8
Luo, P., Yin, P., Hua, R., Tan, Y., Li, Z., Qiu, G., et al. (2018). A Large-scale, multicenter serum metabolite biomarker identification study for the early detection of hepatocellular carcinoma. Hepatology 67 (2), 662–675. doi: 10.1002/hep.29561
Nakamura, M. T., Nara, T. Y. (2004). Structure, function, and dietary regulation of delta6, delta5, and delta9 desaturases. Annu. Rev. Nutr. 24, 345–376. doi: 10.1146/annurev.nutr.24.121803.063211
Ormseth, M. J., Swift, L. L., Fazio, S., Linton, M. F., Raggi, P., Solus, J. F., et al. (2013). Free fatty acids are associated with metabolic syndrome and insulin resistance but not inflammation in systemic lupus erythematosus. Lupus 22 (1), 26–33. doi: 10.1177/0961203312462756
Rekvig, O. P., Van der Vlag, J. (2014). The pathogenesis and diagnosis of systemic lupus erythematosus: still not resolved. Semin. Immunopathol. 36 (3), 301–311. doi: 10.1007/s00281-014-0428-6
Shin, T. H., Kim, H. A., Jung, J. Y., Baek, W. Y., Lee, H. S., Park, H. J., et al. (2017). Analysis of the free fatty acid metabolome in the plasma of patients with systemic lupus erythematosus and fever. Metabolomics 14 (1), 14. doi: 10.1007/s11306-017-1308-6
Steffen, B. T., Duprez, D., Szklo, M., Guan, W., Tsai, M. Y. (2018). Circulating oleic acid levels are related to greater risks of cardiovascular events and all-cause mortality: the multi-ethnic study of atherosclerosis. J. Clin. Lipidol. 12 (6), 1404–1412. doi: 10.1016/j.jacl.2018.08.004
Tang, L., Zeng, J., Geng, P., Fang, C., Wang, Y., Sun, M., et al. (2018). Global metabolic profiling identifies a pivotal role of proline and hydroxyproline metabolism in supporting hypoxic response in hepatocellular carcinoma. Clin. Cancer Res. 24 (2), 474–485. doi: 10.1158/1078-0432.CCR-17-1707
Teixeira, V., Tam, L. S. (2017). Novel insights in systemic lupus erythematosus and atherosclerosis. Front. Med. (Lausanne) 4, 262. doi: 10.3389/fmed.2017.00262
Tselios, K., Koumaras, C., Gladman, D. D., Urowitz, M. B. (2016). Dyslipidemia in systemic lupus erythematosus: just another comorbidity? Semin. Arthritis Rheum. 45 (5), 604–610. doi: 10.1016/j.semarthrit.2015.10.010
Tsokos, G. C., Lo, M. S., Reis, P. C., Sullivan, K. E. (2016). New insights into the immunopathogenesis of systemic lupus erythematosus. Nat. Revi Rheumatol. 12 (12), 716–730. doi: 10.1038/nrrheum.2016.186
Vessby, B., Gustafsson, I. B., Tengblad, S., Boberg, M., Andersson, A. (2002). Desaturation and elongation of fatty acids and insulin action. Ann. Ny Acad. Sci. 967, 183–195. doi: 10.1111/j.1749-6632.2002.tb04275.x
Warensjö, E., Risérus, U., Vessby, B. (2005). Fatty acid composition of serum lipids predicts the development of the metabolic syndrome in men. Diabetologia 48 (10), 1999–2005. doi: 10.1007/s00125-005-1897-x
Weylandt, K. H., Chiu, C. Y., Gomolka, B., Waechter, S. F., Wiedenmann, B. (2012). Omega-3 fatty acids and their lipid mediators: towards an understanding of resolvin and protectin formation. Prostag. Oth. Lipid M 97 (3–4), 73–82. doi: 10.1016/j.prostaglandins.2012.01.005
Wu, T., Xie, C., Han, J., Ye, Y., Weiel, J., Li, Q., et al. (2012). Metabolic disturbances associated with systemic lupus erythematosus. PloS One 7 (6), e37210. doi: 10.1371/journal.pone.0037210
Xu, C., He, J., Jiang, H., Zu, L., Zhai, W., Pu, S., et al. (2009). Direct effect of glucocorticoids on lipolysis in adipocytes. Mol. Endocrinol. 23 (8), 1161–1170. doi: 10.1210/me.2008-0464
Yan, B., Huang, J., Zhang, C., Hu, X., Gao, M., Shi, A., et al. (2016). Serum metabolomic profiling in patients with systemic lupus erythematosus by GC/MS. Mod. Rheumatol. 26 (6), 914–922. doi: 10.3109/14397595.2016.1158895
Yang, B., Ding, F., Wang, F. L., Yan, J., Ye, X. W., Yu, W., et al. (2016). Association of serum fatty acid and estimated desaturase activity with hypertension in middle-aged and elderly Chinese population. Sci. Rep. 6, 23446. doi: 10.1038/srep23446
Zappia, C. D., Monczor, F. (2019). Therapeutic utility of glucocorticoids and antihistamines cotreatment. Rationale and perspectives. Pharmacol. Res. Perspect. 7 (6), e00530. doi: 10.1002/prp2.530
Keywords: systemic lupus erythematosus, prednisone, fatty acid, side effects, metabolic profiling
Citation: Li Q, Zhou J, Zhang D, Zhang X, Xu Z and Wu D (2020) Metabolic Profiling Reveals an Abnormal Pattern of Serum Fatty Acids in MRL/lpr Mice Under Treatment With Prednisone. Front. Pharmacol. 11:115. doi: 10.3389/fphar.2020.00115
Received: 01 November 2019; Accepted: 28 January 2020;
Published: 25 February 2020.
Edited by:
Gerard Bannenberg, GOED, United StatesReviewed by:
Cristina López-Vicario, Hospital Clínic de Barcelona, SpainClaudio Ferrante, Università degli Studi G. d’Annunzio Chieti e Pescara, Italy
Copyright © 2020 Li, Zhou, Zhang, Zhang, Xu and Wu. This is an open-access article distributed under the terms of the Creative Commons Attribution License (CC BY). The use, distribution or reproduction in other forums is permitted, provided the original author(s) and the copyright owner(s) are credited and that the original publication in this journal is cited, in accordance with accepted academic practice. No use, distribution or reproduction is permitted which does not comply with these terms.
*Correspondence: Dehong Wu, d2RoNDM1ODAzM0AxNjMuY29t
†These authors have contributed equally to this work