 Anusree DasNandy†
 Vishal S. Patil
 Harsha V. Hegde
 Subarna Roy
- Indian Council of Medical Research-National Institute of Traditional Medicine, Belagavi, Karnataka, India
Introduction: Adipose tissue functions as a key endocrine organ which releases multiple bioactive substances and regulate obesity-linked complications. Dysregulation of adipocyte differentiation, triglyceride metabolism, adipokines production and lipid transport contributes to impaired lipid metabolism resulting in obesity, insulin resistance and type 2 diabetes. Gymnema sylvestre plant is frequently used in Ayurveda for treatment of diabetes and obesity. Gymnemagenin is a major bioactive compound of Gymnema sylvestre. The present study was undertaken to elucidate the role of gymnemagenin in lipid metabolism by in vitro and computational approaches.
Methods: A panel of twelve genes viz., Fasn, Lipe, Lpl, Pparg, Plin2, Cidea, Scd1, Adipoq, Lep, Ccl2, Fabp4, and Slc2a4, essential in lipid metabolism were selected and gene expression pattern and triglyceride content were checked in adipocytes (3T3L1 cells) with/without treatment of gymnemagenin by Real time PCR and colorimetric estimation, respectively. Mode of action of gymnemagenin on Pparg and Fabp4 was accomplished by computational studies. Gene set enrichment and network pharmacology were performed by STRING and Cytoscape. Molecular docking was performed by AutoDock vina by POAP pipeline. Molecular dynamics, MM-PBSA were done by Gromacs tool.
Results: In vitro study showed that gymnemagenin improved triglyceride metabolism by up regulating the expression of lipase genes viz., Lipe and Lpl which hydrolyse triglyceride. Gymnemagenin also up regulated the expression of anti-inflammatory gene Adipoq. Importantly, gymnemagenin treatment up regulated the expression of Pparg gene and the downstream target genes (Plin2, Cidea, and Scd1) which are associated with adipogenesis. However, gymnemagenin has no effect on expression of Fabp4, codes for a lipid transport protein. In silico study revealed that gymnemagenin targeted 12 genes were modulating 6 molecular pathways involved in diabetes and obesity. Molecular docking and dynamics revealed that gymnemagenin stably bind to active site residue of Pparg and failed to bind to Fabp4 active site compared to its standard molecules throughout 100 ns MD production run. Gymnemagenin scored binding free energy of −177.94 and −25.406 kJ/mol with Pparg and Fabp4, respectively.
Conclusion: Gymnemagenin improved lipid metabolism by increasing triglyceride hydrolysis (lipolysis), up regulating the crucial gene of adipogenesis and increasing the expression of anti-inflammatory adipokine proving its therapeutic importance as anti-obesity and anti-diabetic phytocompound.
1 Introduction
Type 2 diabetes (T2D) is a prevalent metabolic disorder. More than 95% of people having diabetes are diagnosed with T2D. T2D is commonly asymptomatic and frequently recognized by the manifestation of excess body weight and elevation of random blood glucose. It is often diagnosed several years after the onset, when many other complications have already arisen (Cole and Florez, 2020). T2D starts with the onset of insulin resistance, which is a cumulative health consequence of obesity, dysfunctional adipose tissue, chronic inflammation, and decrease in pancreatic β-cell mass and consecutive failure in the production of insulin. In addition, prolonged uncontrolled blood glucose levels have harmful effects on multiple tissues, including kidney, cardiovascular tissue, eye, neurons, skeletal muscles, and lower limbs (Davoudi and Sobrin, 2015; Sheleme et al., 2020). This disease is associated with several regulatory factors that affect various metabolic pathways in different important organs of the human body. It is evident that obesity plays a crucial role in the etiology of T2D.
According to the data of the National Family Health Survey (2019–2021) obtained from the Global Obesity Observatory, the prevalence of obesity is 22.9% for men and 24% for women, whereas it was 11% and 15% in men and women, respectively, in the 2014–2015 report. These data clearly indicate that the global impact of obesity is increasing at an alarming rate. Thus, this disease requires multifactorial risk reduction strategies and continuous physical and medical care (Altaf et al., 2015).
Plants have been used as medicine since the beginning of civilization. Recently, there is a global thrust in the usage of natural products such as herbs. These natural herbal products contain phytocompounds, which are the chemical compounds synthesized and preserved by plants through their various secondary metabolic pathways. Several of these phytocompounds have medicinal value, are used as crude ingredients in numerous pharmaceuticals and also have a foundational role in modern drug development (Wang et al., 2013; Tran et al., 2020; Jugran et al., 2021). Gymnema sylvestre R. Br. is one of the major botanicals used to treat diabetes and obesity in Ayurveda, an Indian traditional system of medicine. Several group of scientists have investigated different formulations of this plant as well as different phytocompounds of which gymnemagenin is the most potent compound used in several antidiabetic Indian traditional AYUSH formulations (Ayurveda, Unani, Siddha, and Homeopathy) as well as nutraceuticals and food supplements (Tiwari et al., 2014). Although numerous scientific studies have been carried out focusing on the hypoglycemic bioactivity of gymnemagenin, there are lacunae in the detailed scientific reports on antiobesity activity. Because obesity and T2D is correlated to a great extent, there is an urgent need to study the role of gymnemagenin in lipid metabolism in correlation with T2D, which could lead to cost-effective targeted phytomedicines with lesser side effects.
The structure and function of adipose tissue are key regulatory factors in lipid metabolism. Adipocyte differentiation, lipid droplet biosynthesis, and lipid droplet size are directly linked with lipolysis, that is, triglyceride metabolism (Albert et al., 2014; Sanjabi et al., 2015). Adipokines, the cell signaling molecules secreted mainly by adipocytes, carry out inter-tissue communication functions, and an imbalance of pro- and anti-inflammatory adipokines contributes to metabolic dysfunction (Ouchi et al., 2011). Lipid transport is associated with muscle insulin sensitivity, which, in turn, regulates glucose transporters and glucose disposal (Hagberg et al., 2012). In this present study, a panel of twelve genes, Fatty acid synthase (Fasn), Lipase (Lipe), Lipoprotein lipase (Lpl), Peroxisome proliferator-activated receptor gamma (Pparg), Perilipin 2 (Plin2), Cell death-inducing DNA fragmentation factor, alpha subunit-like effector A (Cidea), Stearoyl-Coenzyme A desaturase 1 (Scd1), Adiponectin (Adipoq), Leptin (Lep), Chemokine (C-C motif) ligand 2 (Ccl2), Fatty acid binding protein 4 (Fabp4), Adipocyte solute carrier family 2 (facilitated glucose transporter), and member 4 (Slc2a4/GLUT4), which are essential in lipid metabolism and T2D, was selected from literature survey and taken for analysis by in vitro and computational approaches to elucidate the role of gymnemagenin in lipid metabolism.
2 Materials and methods
2.1 Cell culture and treatment
The 3T3L1 mouse embryonic fibroblast cell line was obtained from NCCS, Pune, India. 3T3L1 pre-adipocytes were maintained in Dulbecco’s Modified Eagle’s Medium (DMEM) supplemented with 10% fetal bovine serum (FBS) in a humidified atmosphere containing 5% CO2 at 37 °C. Cells were subcultured before the culture reached 70% confluence (Rathinasabapathy et al., 2017).
3T3L1 pre-adipocytes were differentiated into adipocytes following the protocol developed by Rubin, Lai, and Rosen (1977) with minor modifications. Post-confluent pre-adipocytes were supplemented with DMEM (with 10% FBS) media having 1 µM dexamethasone (DEX), 0.5 mM L-methyl-3-isobutylxanthine (MIX) and10 µg/ml insulin. After 3 days, fresh media was added containing DMEM/10% FBS supplemented with 10 µg/ml insulin. The media was changed on alternate days until fully differentiated adipocytes showing well-developed lipid droplets were observed. 3T3L1 pre-adipocytes were plated in 12-well plates and kept for differentiation. Terminally differentiated adipocytes were treated with gymnemagenin in different concentrations (50, 25, 12.5, 6.25, 3.125, 1.56 μM) based on the cell viability data and incubated for 6 h at 37 °C in an incubator with 5% CO2. After the incubation, cells were used for RNA isolation and subsequent real-time PCR.
2.2 Cytotoxicity assay
3T3L1 cells (5,000 cells/well) were seeded in a 96-well plate and incubated in different concentrations of gymnemagenin (400, 200, 100, 50, 25, 12.5, 6.25 μM) for 24 h. A 10-μL aliquot of MTT (5 mg/ml) was added to each well and incubated for 4 h. Later, formazan crystals were dissolved in 100 μL DMSO, and OD values were taken at 570 nm. OD values were normalized with the blank, and the cell viability percentage was calculated and plotted in a graph.
2.3 Determination of triglyceride content by colorimetric estimation
3T3L1 cells were plated in 12-well plates and kept for differentiation. On Day 1 of differentiation, cells were treated with gymnemagenin at different concentrations (50, 25, 12.5, 6.25, 3.125, 1.56 μM). Triglyceride was measured on Day 4 and Day 8 of differentiation using a triglyceride colorimetric assay kit following the manufacturer’s protocol (Elabscience).
2.4 RNA preparation and real-time PCR analysis
Total RNA was extracted from cells using TRI reagent (Sigma-Aldrich) following the manufacturer’s protocol with minor modifications. The RNA pellet was dissolved in nuclease-free water. RNA was quantified using Nanodrop. RNA integrity was checked by running the samples in 1% agarose/formaldehyde gel containing 0.5 µg/ml ethidium bromide. cDNAs were synthesized using 1 μg of RNA for each sample using PrimeScript RT Reagent Kit (DSS Takara Bio India), following the manufacturer’s protocol. cDNA was amplified by real-time quantitative PCR (RT PCR) using SYBR green PCR Master Mix (DSS Takara Bio India). Primers of selected genes under this study were procured from Merck (KiCqStart® SYBR® Green Primers) (tabulated in Table 1). RT PCR amplifications were performed on BIORAD CFX Maestro (Version 1.1). Cycle conditions were 95 °C for 30 s, followed by 40 cycles at 95 °C for 15 s and 54°C for 30 s and 72°C for 30 s. mRNA expression was analyzed using the ΔΔCT method and normalized with respect to the expression of the μ-actin using BIORAD CFX Maestro Software (Version 1.1). Amplification of specific transcripts was further confirmed by obtaining dissociation (melting) curve profiles with 1 cycle of 1 min at 95 °C, 30 s at 55 °C, and 30 s at 95 °C (Cho et al., 2009).
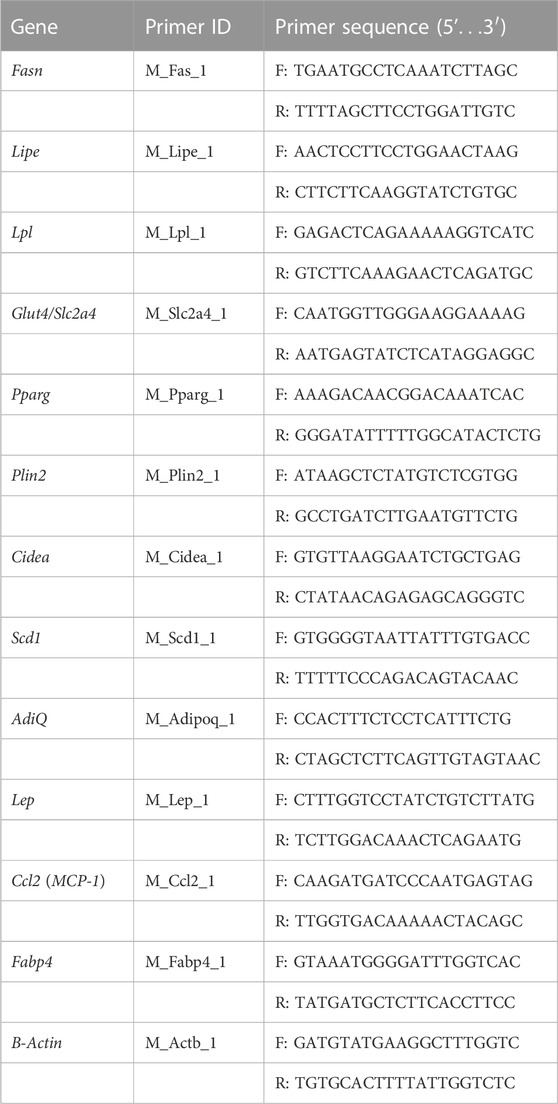
TABLE 1. Sequences of primers used for RT PCR.
2.5 Enrichment analysis of gymnemagenin-regulated targets
Based on the in vitro analysis, we subjected 12 genes expressed by gymnemagenin in 3T3L1 cells, Fabp4, Fasn, Lipe, Lpl, Slc2a4, Pparg, Plin2, Cidea, Scd1, Adiq, Lep, and Ccl2, to molecular pathway enrichment analysis. The 12 genes were queried into STRING (Szklarczyk et al., 2016; https://string-db.org/) for Homo sapiens, Mus musculus, and Rattus norvegicus (Khanal et al., 2020). Furthermore, we identified modulated pathways with reference to the Kyoto Encyclopedia of Genes and Genomes (KEGG; https://www.genome.jp/kegg/) pathway database. The pathways associated with diabetes mellitus and obesity were traced (Patil et al., 2020).
2.6 Network construction and analysis
The network of gymnemagenin, regulated genes, and modulated pathways in Homo sapiens, Mus musculus, and Rattus norvegicus was constructed by Cytoscape (Shannon et al., 2003) ver. 3.6.1 (https://cytoscape.org/). During analysis, the network was treated as direct and analyzed using the edge count topological parameter. To find the hub gene and pathway within the network, the node color and size were set as “low values to bright colors” and “low values to small size,” respectively (Dwivedi et al., 2022).
2.7 Molecular docking
Based on the in vitro and network analysis, we prioritized Pparg and Fabp4 for molecular docking studies using gymnemagenin and respective standard compounds as ligand molecules. Pioglitazone (Charbonnel, 2009) and BMS-309403 (Lan et al., 2011) compounds were used as standard molecules of Pparg and Fabp4, respectively. PubChem was used to retrieve the 3D structure of phytocompounds. The compounds were prepared using POAP ligand preparation “POAP_lig.bash” script (Samdani and Vetrive, 2018). The structures were minimized by MMFF94 force field using the conjugate gradients algorithm and finally converted into a pdbqt molecule by adding the gasteiger charges and polar hydrogens for further molecular docking study. The 3D x-ray crystallographic structures of Pparg (PDB: 5Y2O) and Fabp4 (PDB: 3JS1) were retrieved from the Protein Data Bank. The PDB ID 5Y2O consisted of missing residues and was remodeled by the SWISS-MODEL (Greenfield and Pietruszko, 1977) web server (https://swissmodel.expasy.org/) using Uniprot ID P37231 as the query sequence and 5Y2O chain A as a template. Furthermore, P2Rank (Krivák and Hoksza, 2018) was employed to retrieve the active site residues information. AutoDock vina was executed using the POAP pipeline (Samdani and Vetrive, 2018; Patil et al., 2020) to perform the molecular docking. During docking, the exhaustiveness was set to 100 and generated nine docked conformations, of which the conformation with the lowest BE and least RMSD was chosen. The interaction between the compound and target was analyzed by BIOVIA Discovery Studio Visualizer 2019 (https://discover.3ds.com/discovery-studio-visualizer-download).
2.8 Stability of the docked complexes
To examine the docked complex structural and intermolecular interaction stabilities, an all-atom molecular dynamics (MD) simulation for 100 ns in an explicit solvent was performed. The GROMACS (Van Der Spoel et al., 2005) ver 2021.3 (https://www.gromacs.org) package was utilized to run MD simulations using the Amber ff99SB-ildn force field. The topological parameters of the ligands and the whole complex were generated using the AmberTools xleap module (https://ambermd.org/AmberTools.php), and the partial charges of the ligand were generated using an antechamber with a “bcc” charge model. The prepared systems were solvated using the three-site water (TIP3P) model in a rectangular box with 10.0 Å boundary conditions from the protein edges in all directions. The prepared systems were neutralized by adding the required number of counter ions. The steepest descent and conjugate gradient energy minimization methods were used to obtain the near-global state least energy conformations. The systems were equilibrated using “canonical (NVT) and isobaric (NPT)” ensembles for 1 ns. A modified Berendsen thermostat method was used in NVT equilibration to keep the volume and temperature (300 K) constant. A Parrinello–Rahman barostat was used to keep the pressure constant at 1 bar during NPT equilibration. In addition, the particle–mesh Ewald approximation was used with a cut-off value of 1 nm to calculate the long-range electrostatic, van der Waals, and coulomb interactions. Similarly, bond length was constrained using the LINear Constraint Solver method. Finally, the system was subjected to a 100-ns MD production run, and the coordinates were recorded every 2 fs. The trajectories produced were examined using the built-in gromacs tools. RMSD, RMSF, Rg, SASA, and H-bond were used to investigate the stability and fluctuations of ligand-protein interactions using MD simulation.
2.9 Molecular mechanics Poisson–Boltzmann surface area (MM-PBSA): Investigation of binding affinity
In MD simulations and thermodynamic calculations, the relative binding energies were calculated using the MM-PBSA method using the “g_mmpbsa” tool (Kumari and Kumar, 2014). The parameters from past research were considered while calculating the binding energy (Bhandare et al., 2019; Dwivedi et al., 2022; Khanal et al., 2022). The binding energy was determined throughout the steady trajectory observed between 50 and 100 ns using 50 representative snapshots. Binding free energy obtained from MM-PBSA was represented in kJ/mol units.
2.10 Analysis of principal component
Principal component analysis (PCA) investigates molecular motion using MD trajectories. The “least square fit” to the reference structure is used to eliminate the molecule’s translational and rotational motion. A set of eigenvectors that reflect the motion of the molecule is produced by diagonalizing a covariance matrix generated by a linear transformation of cartesian coordinate space. The energy contribution of each eigenvector to the motion is shown by the eigenvalue associated with that eigenvector. The “time-dependent motions” that the components carry out in a certain vibrational mode are demonstrated by projecting the trajectory onto a particular eigenvector. The atomic vibrational components’ contribution to this form of coordinated motion is shown by the projection’s temporal average. Using the built-in gromacs utility “g_covar,” the eigenvectors and eigenvalues of the trajectory were produced by computing and diagonalizing the covariance matrix. Additionally, the eigenvectors were examined and shown using the “g_anaeig” tool (Amadei et al., 1993; Van Aalten et al., 1995; Amadei et al., 1996; Bhandare and Ramaswamy, 2018). The least squares fit, gromacs inbuilt utility g_covar, and g_anaeig tools were used for PCA.
2.11 Statistical analysis
All experiments were done in triplicate. All statistical analyses were done by analyzing two-variable data with a simple t-test and using a one-way analysis of variance (ANOVA). The value of p < 0.05 was considered statistically significant. The network was analyzed by the “Edge count” topological parameter. The docking score was represented in kcal/mol units.
3 Results
3.1 Cytotoxicity assay
The cytotoxic effects of gymnemagenin were tested in 3T3L1 cells by MTT assay. Only metabolically viable cells convert tetrazolium salts to formazan dye by cellular enzymes. Thus, the amount of formazan dye formed directly correlates to the number of viable cells in the culture and can be measured in a spectrophotometer, whereas cells exposed to toxins will have decreased activity. At the highest concentration of gymnemagenin, 86.8% of the cells were viable (Figure 1).
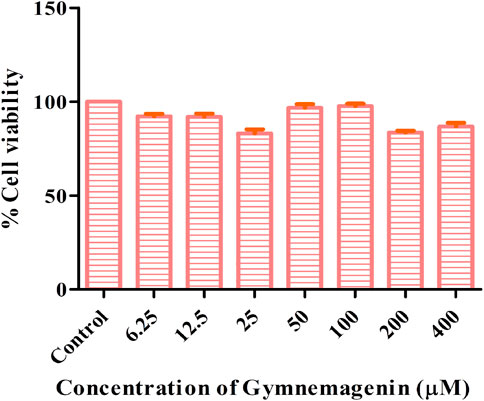
FIGURE 1. Determination of cytotoxic effects of gymnemagenin in 3T3L1 cells. 3T3L1 cell viability upon gymnemagenin treatment was assessed by MTT assay.
3.2 Gymnemagenin promotes triglyceride metabolism in 3T3L1 cells
To examine the effects of gymnemagenin on triglyceride metabolism, the triglyceride content of 3T3L1 adipocytes differentiated from gymnemagenin untreated and treated pre-adipocytes was measured by colorimetric estimation. The triglyceride content of the gymnemagenin-treated group was less than that of the untreated group on the fourth day of the differentiation stage (Figure 2A) as well as on the eighth day of the differentiation stage (Figure 2B), depicting hydrolysis of more triglyceride by Lpl into glycerol and free fatty acids due to induction of gymnemagenin. This was further confirmed by gene expression studies.
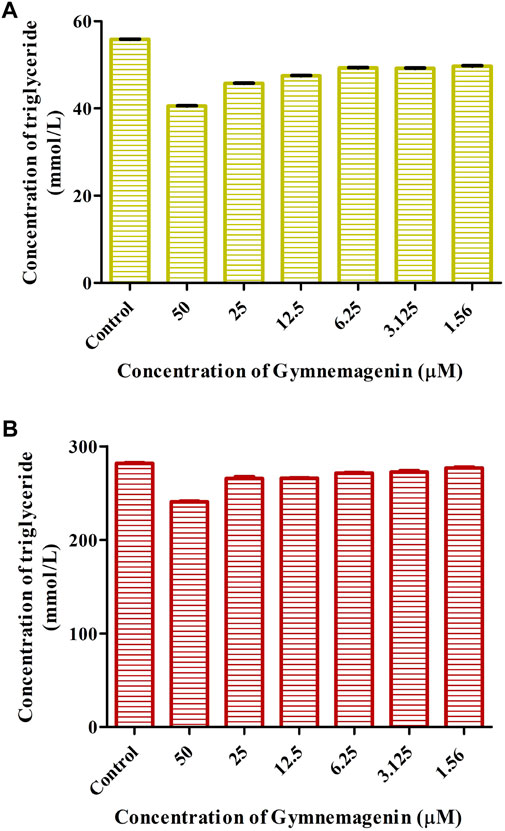
FIGURE 2. Effect of gymnemagenin on triglyceride content of adipocytes. (A) Triglyceride content after gymnemagenin treatment on the 4th day of differentiation in 3T3L1 adipocytes. (B) Triglyceride content after gymnemagenin treatment on the 8th day of differentiation in 3T3L1 adipocytes.
3.3 Gymnemagenin improves lipid metabolism in 3T3L1 cells
To elucidate the effect of gymnemagenin on lipid metabolism, we examined the expression of 12 genes with and without gymnemagenin treatment in 3T3L1 adipocytes. Twelve genes were categorized into five categories: lipolysis or triglyceride metabolism, adipocyte differentiation, adipokine/adipocyte function, lipid transport, and insulin signaling. Table 2 describes the function of selected genes and their expression pattern in obesity and T2D. In addition, the expression pattern of those genes after gymnemagenin treatment has also been tabulated in Table 2.
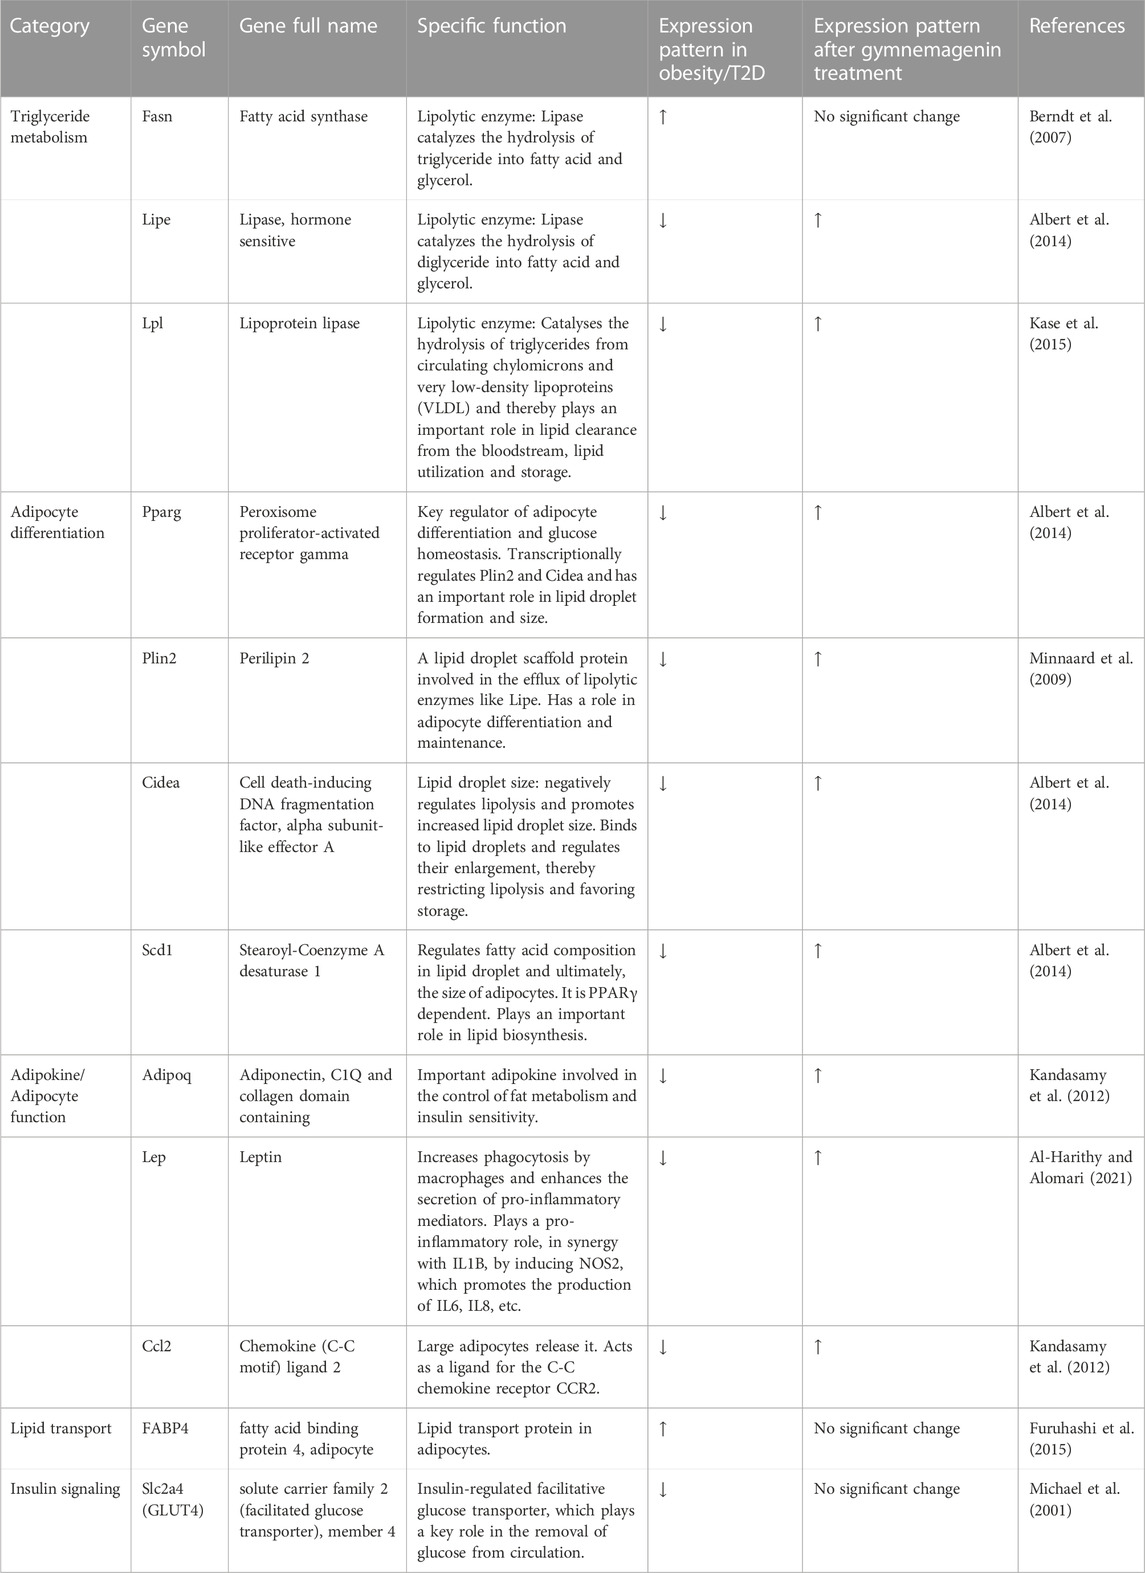
TABLE 2. Effect of gymnemagenin on the 12 gene panel of lipid metabolism and T2D.
Three genes, Fasn, Lipe and Lpl, are key regulators of lipolysis or triglyceride metabolism. Gymnemagenin upregulated the expression pattern of Lipe and Lpl by 1.4 and threefold, respectively. However, the expression of Fasn was unaltered due to gymnemagenin (Figure 3).
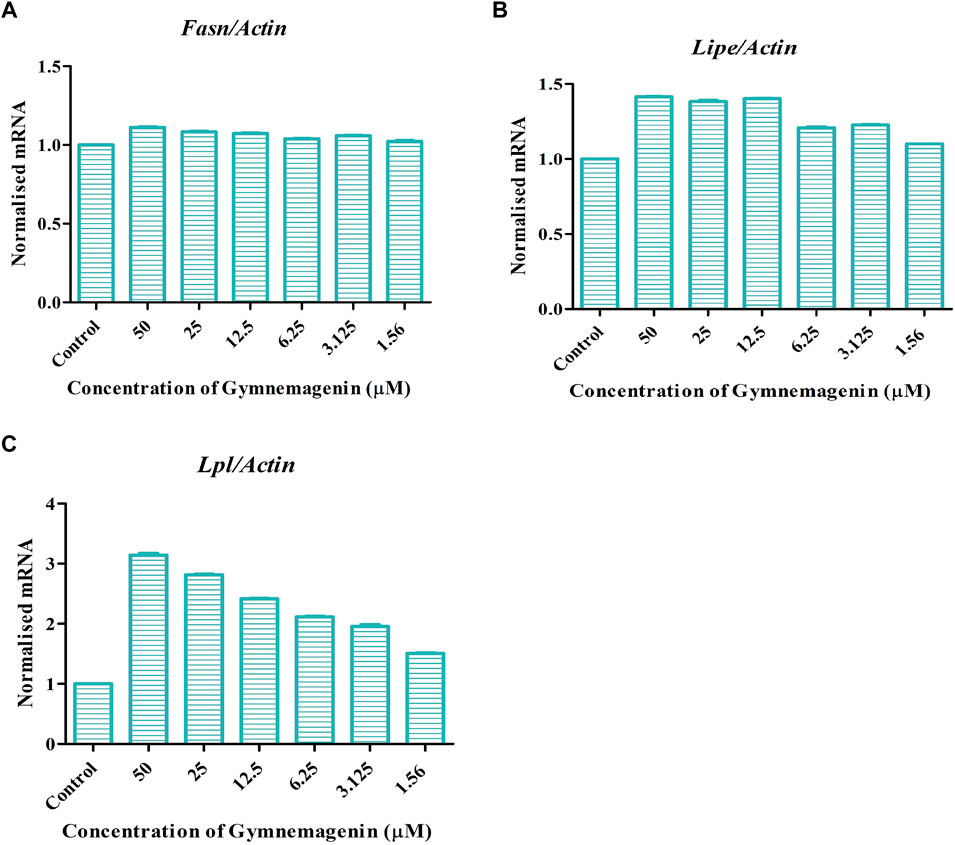
FIGURE 3. Effect of gymnemagenin treatment on lipase enzyme coding genes expressed in 3T3L1 adipocytes. Data represent the mean ± SE. n = 3 per group. (A) Gymnemagenin showed no effect on the expression of Fasn gene, (B) Gymnemagenin showed no effect on the expression of Lipe in treated cells, (C) Gymnemagenin increased the expression of Lpl gene in the treated cells.
Adipocyte differentiation (adipogenesis) is highly regulated by four genes, Pparg, Plin2, Cidea, and Scd1 (Albert et al., 2014). It is reported that in obesity and T2D disease conditions, the expression of these genes was decreased (Minnaard et al., 2009). In our study, it was found that gymnemagenin upregulated the expression of Pparg, Plin2, Cidea and Scd1 (Figure 4).
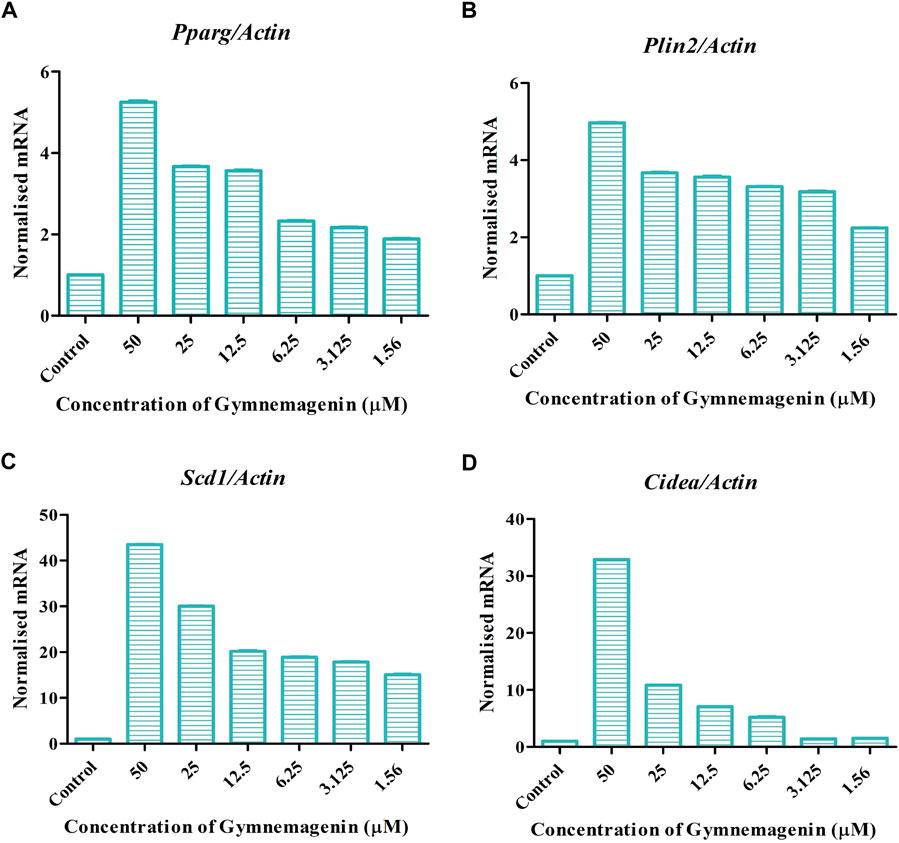
FIGURE 4. Effect of gymnemagenin on genes actively involved in adipogenesis expressed in 3T3L1 adipocytes. (A) Gymnemagenin increased the expression of Pparg in treated cells more than in control cells. (B) Gymnemagenin escalated the expression of Plin2. (C) Gymnemagenin increased the expression of Scd1. (D) Gymnemagenin increased the expression of Cidea. Data represent the mean ± SE. n = 3 per group.
Adipokines are cell-signaling molecules produced by the adipose tissue that play functional roles in obesity, energy metabolism and inflammation (Kandasamy et al., 2012). Adipoq, Lep, and Ccl2 are vital adipokines that have a crucial role in the maintenance of body mass, immune responses, fatty acid storage, and metabolic balance. At the onset of obesity, all three adipokines showed decreased gene expression. Induction of gymnemagenin resulted in the upregulation of all three genes in 3T3L1 adipocytes (Figure 5).
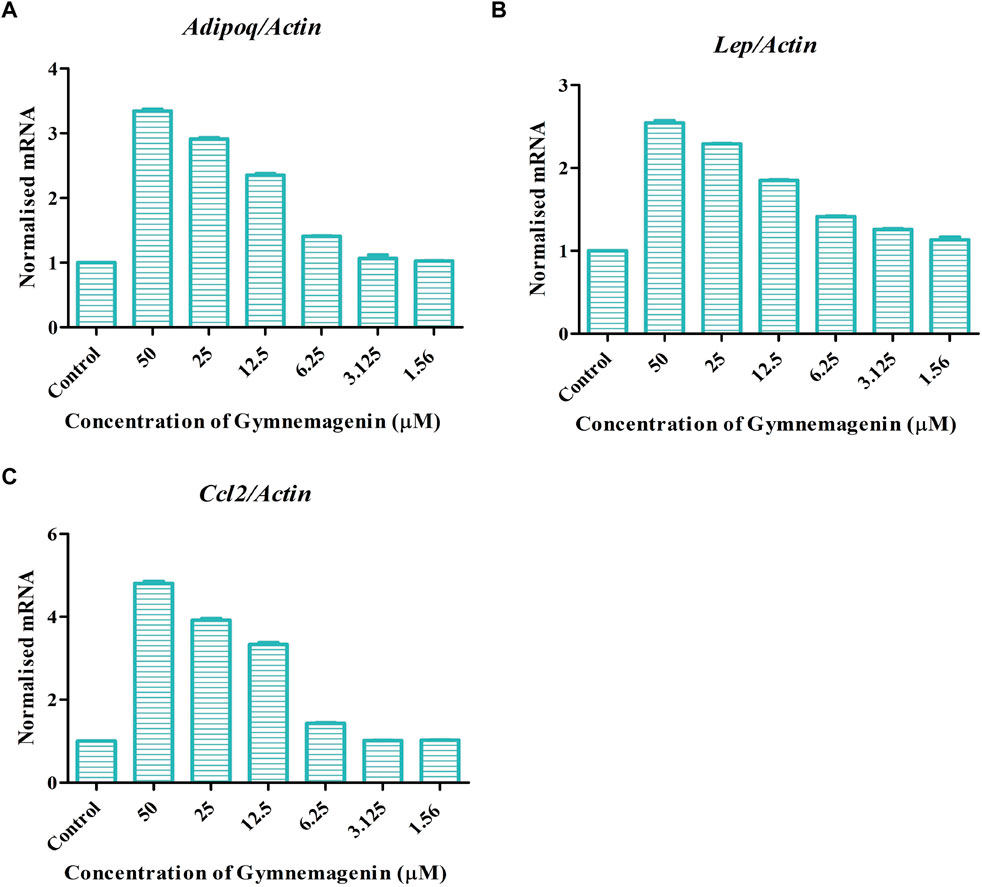
FIGURE 5. Effect of gymnemagenin treatment on expression of adipokines secreted by adipocytes. (A) Gymnemagenin increased the expression of Adipoq in treated cells more than in control cells. (B) Gymnemagenin increased the expression of Lep. (C) Gymnemagenin increased the expression of Ccl2. Data represent the mean ± SE. n = 3 per group.
Fabp4 is an intracellular lipid chaperone that regulates lipid trafficking and lipolysis in adipocytes. The present study showed that gymnemagenin had no effect on the expression of Fabp4 in 3T3L1 adipocytes (Figure 6A). Solute carrier family 2 (facilitated glucose transporter) member 4 (Slc2a4/GLUT4) is a facilitative glucose transporter regulated by insulin. The data showed that gymnemagenin had no significant effect on the expression of Slc2a4 (Figure 6B).
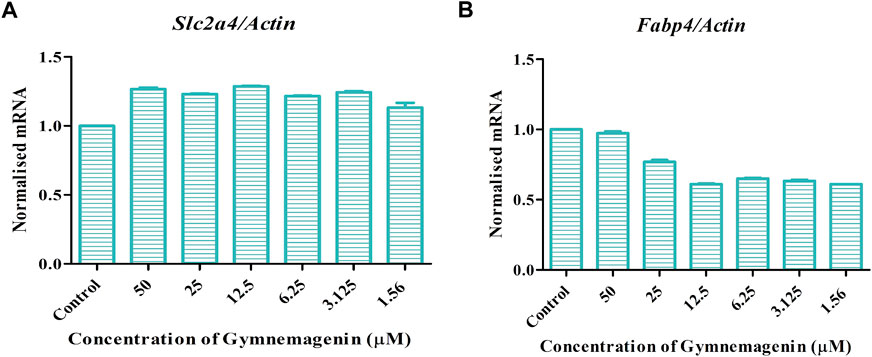
FIGURE 6. (A) Effect of gymnemagenin treatment on expression of Slc2a4. (B) Expression of Fabp4 in adipocytes was unchanged after gymnemagenin treatment. Data represent the mean ± SE. n = 3 per group.
3.4 Gymnemagenin-modulated gene pathways enrichment analysis
From the in vitro study, twelve genes were targeted by gymnemagenin. Among them, 11 were upregulated, and one was downregulated. Gene set enrichment of twelve genes was predicted to modulate six molecular pathways: AMPK, PPAR, insulin, Adipocytokine signalling and Fatty acid metabolism are different and considered as two pathways, and regulation of lipolysis in adipocytes in Homo sapiens, Mus musculus, and Rattus norvegicus. The pathway strength and FDR value were found to be different in the three species, and all six pathways were found to be similar. Figure 7 summarizes the network representation of gymnemagenin, its modulated targets, and pathways. Table 3 summarizes the gene set enrichment of individual pathways of each species.
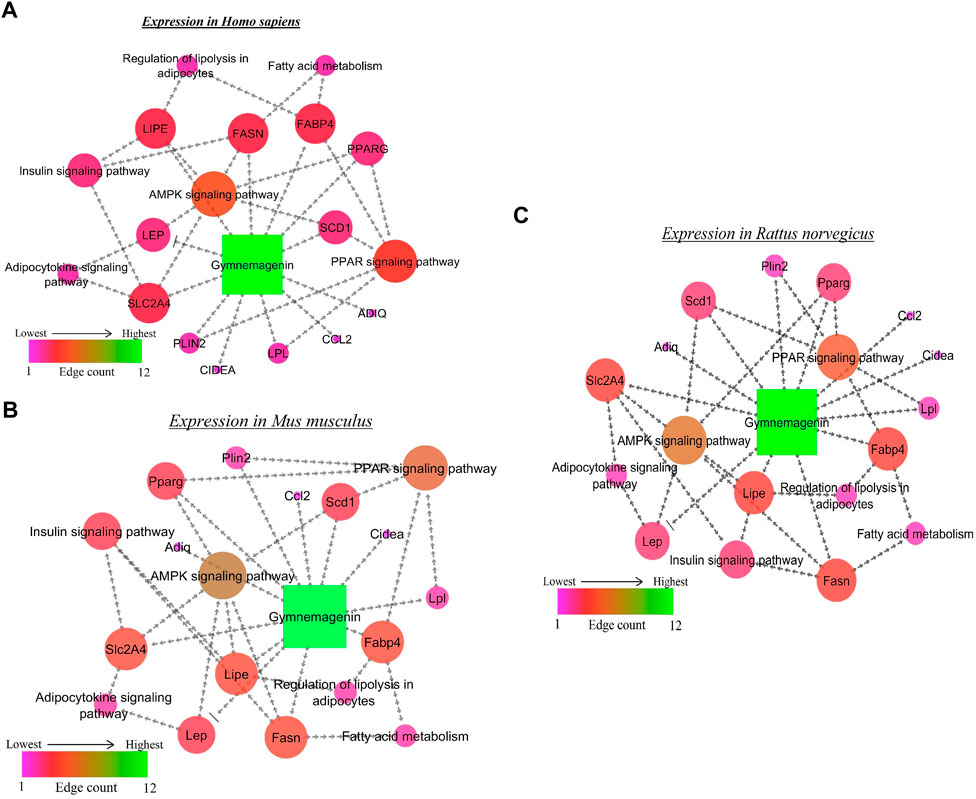
FIGURE 7. Network representation of gymnemagenin-modulated genes and pathways in (A) Homo sapiens, (B) Mus musculus, and (C) Rattus norvegicus. In the network interaction, the node with the higher edge is represented with green color, which gradually decreases to pink.
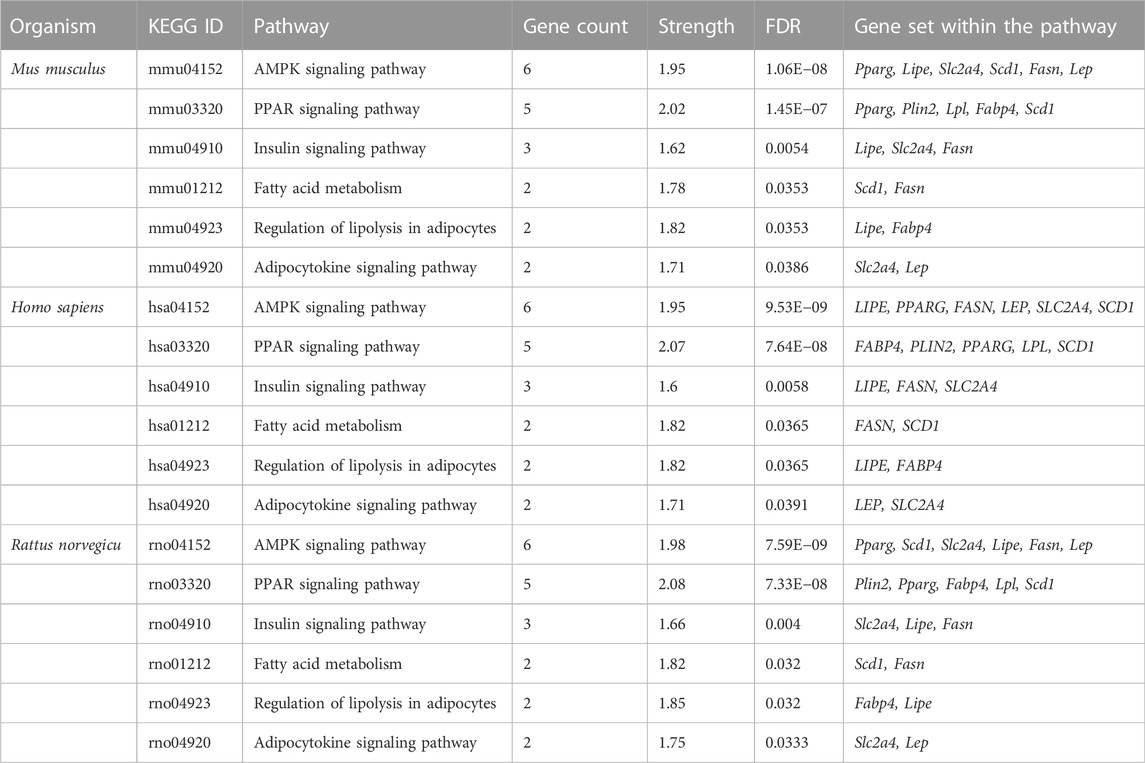
TABLE 3. Gymnemagenin-modulated 12-gene enrichment analysis in Mus musculus, Homo sapiens, and Rattus norvegicus.
3.5 Molecular docking
In the in vitro study, gymnemagenin significantly upregulated Pparg compared to other genes, and it also transcriptionally regulated other genes. Hence, we initially prioritized performing molecular docking of gymnemagenin with Pparg. Additionally, we also selected another protein, Fabp4, which was found to be involved in the Pparg signaling pathway but not significantly modulated by gymnemagenin. In the remodeled Pparg structure, about 99.1 and 8.1% of residues were in the most favored and additionally allowed region. The RMSD of the template and model was found to be 0.064 (Supplementary Figure S1). The active site residue numbers of Pparg are Phe254, Pro255, Leu256, Ile277, Leu283, Gly286, Glu287, Phe292, Ile295, Ile309, Phe310, Gly312, Cys313, Gln314, Arg316, Ser317, Ala320, Glu323, Ile354, Tyr355, Met357, Leu358, Leu361, val367, Leu368, Ile369, Ser370, Glu371, Met376, Leu381, Phe391, Met392, His477, Leu481, Leu497, and Tyr501. The active site residue numbers of Fabp4 are Phe17, Tyr20, Met21, Val26, Ala34, Pro39, Met41, Ile52, Ser54, Ser56, Phe58, Lys59, Thr61, Ile63, Glu73, Thr75, Ala76, Asp77, Gln94, Gln96, Ile105, Arg107, Val116, Cys118, Arg127, and Tyr129. Docking of compounds with Pparg revealed that a standard molecule pioglitazone scored the lowest BE of −8.7 kcal/mol via forming four hydrogen bond interactions with Ser317, His351, Gln314, and Ile354 and five non-hydrogen bond interactions with Cys313, Leu358, Met357, and Phe254. Meanwhile, gymnemagenin scored the lowest BE of −9.1 kcal/mol via forming three hydrogen bonds with Leu256, Glu323, and Cys313 and 18 non-hydrogen bonds with Met357 (2), Leu256, Glu323, Leu361 (4), Ile354 (4), Cys313, Tyr355, and Leu358 (4). Figure 8 represents the interaction of pioglitazone and gymnemagenin with Pparg.
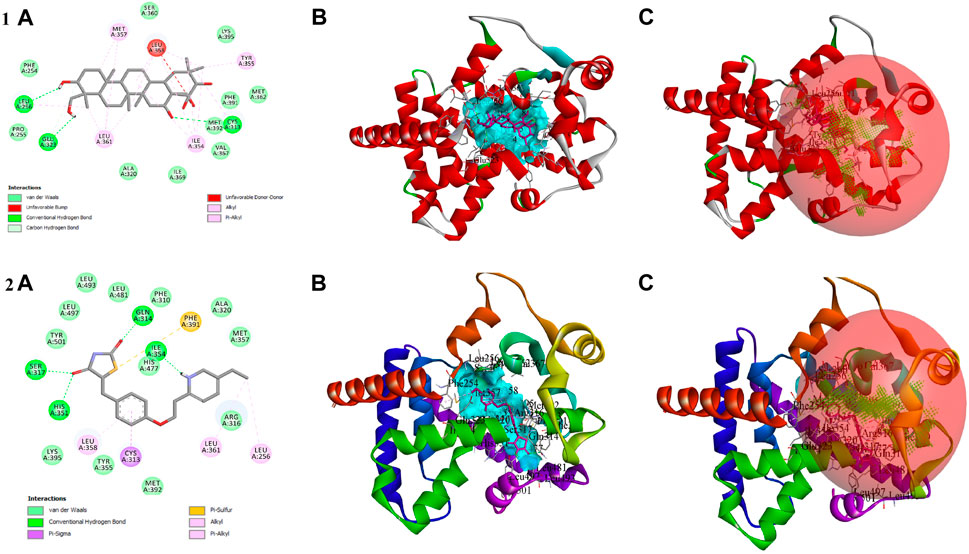
FIGURE 8. Shows (1A) the 2D interaction of the binding mode of gymnemagenin with Pparg, (1B) 3D binding mode of gymnemagenin with Pparg, (1C) active site representation of gymnemagenin with Pparg, (2A) the 2D interaction of binding mode of pioglitazone with Pparg, (2B) 3D binding mode of pioglitazone with Pparg, and (2C) active site representation of pioglitazone with Pparg.
The compound gymnemagenin scored the lowest BE of −6.1 kcal/mol via forming two hydrogen bond interactions with Asp18 and Ser14 and four non-hydrogen bonds with Phe28 and Lys32 (3). Gymnemagenin was found to bind adjacent to the active site (Figure 9), whereas the standard molecule BMS-309403 scored the lowest BE of −10.1 kcal/mol via forming fifteen non-hydrogen bonds: Ala34, Val26, Arg79, Asp77, Met21, Ala76 (3), Glu73, Ile63, Ile105, Arg107, Cys118, Pro39, and Phe17. Among these interactions, 14 interactions were with active site residues except Arg79.
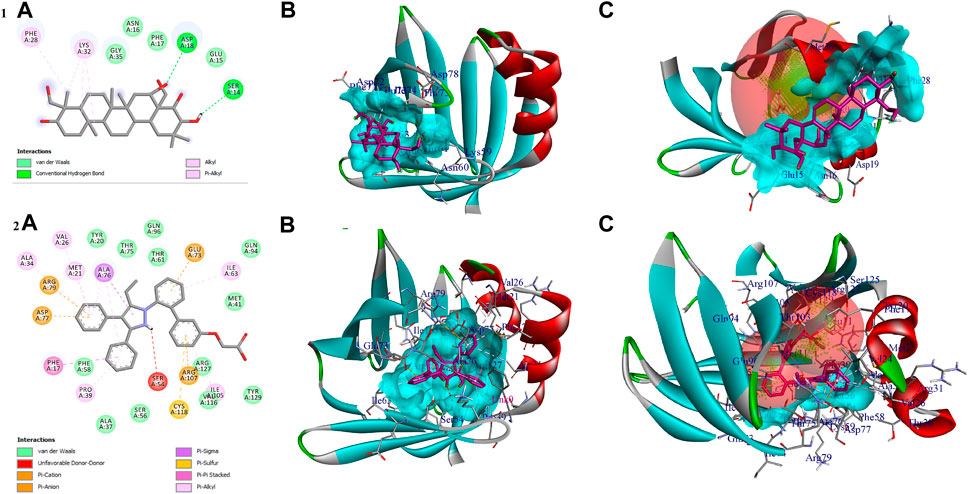
FIGURE 9. Shows (1A) the 2D interaction of the binding mode of gymnemagenin with Fabp4, (1B) 3D binding mode of gymnemagenin with Fabp4, (1C) active site representation of gymnemagenin with Fabp4, (2A) the 2D interaction of binding mode of BMS-309403 with Fabp4, (2B) 3D binding mode of BMS-309403 with Fabp4, and (2C) active site representation of BMS-309403 with Fabp4.
3.6 Molecular dynamics
3.6.1 Stability of gymnemagenin and pioglitazone with pparg
The complex “gymnemagenin-Pparg” and “pioglitazone-Pparg” showed stable dynamics during the 100 ns of simulation after a 20-ns equilibration period (Figure 10). The average backbone RMSDs for gymnemagenin and pioglitazone were 1.86 Å and 1.64 Å, and the complex RMSDs were 2.48 Å and 2.30 Å, respectively. The N- and C-terminal residues showed maximum residual fluctuations (∼5 Å) in the gymnemagenin-Pparg complex compared to pioglitazone-Pparg. However, the residues engaged in the stable and conserved non-bonded interactions (Leu256, Ser317, His351, Ile354, Phe391, Gln314, Glu323, Cys313, Met357, Tyr355, Leu361, Tyr355) showed relatively smaller fluctuations (∼2.5 Å) in both complexes. In the gymnemagenin-Pparg complex, a gradual decrease in the Rg value was observed, and stable complex formation was seen after ∼70 ns. After 70 ns, the gymnemagenin-PPARG and pioglitazone-Pparg complex average Rg values were found to be ∼19.25 Å. In addition, it was observed that the initial and final average surface areas occupied by gymnemagenin and pioglitazone with Pparg were 150.59 and 145.90 nm2 and 143.51 nm2 and 136.88 nm2, respectively. The average surface areas occupied by gymnemagenin and the pioglitazone complex were 148.06 nm2 and 142.49 nm2, respectively, which represents higher flexibility of the binding pocket in the presence of gymnemagenin. Supplementary Movies S1, S2 represent the detailed binding mode and stable dynamics of gymnemagenin and pioglitazone with Pparg. Gymnemagenin formed six stable H-bonds, of which one was consistent throughout the simulations, whereas pioglitazone formed four, of which one was consistent. The estimated relative binding energy of the complex gymnemagenin-Pparg was −177.94 ± 12.82 kJ/mol, and the van der Waal, electrostatic, polar solvation, and SASA energies were −267.87 ± 9.517, −12.35 ± 5.99, 128.34 ± 11.65, and −26.07 ± 0.602 kJ/mol, respectively. Similarly, the estimated relative binding energy of the pioglitazone-PPARG complex was −109 ± 19.17 kJ/mol, and the van der Waal, electrostatic, polar solvation, and SASA energies were −209.099 ± 11.79, −31.97 ± 8.98, 153.63 ± 11.99, and −21.71 ± 0.896 kJ/mol. Furthermore, the contribution of the active residue in complex formation was calculated. The per residue contribution energy of the gymnemagenin-Pparg complex revealed Cys313, Arg316, Ile354, Tyr355, Met357, Leu358, and Leu361 residues from the binding pocket contribute significantly in forming a stable complex via scoring contribution energies of −5.89, −8.94, −6.35, −4.82, −2.70, −8.43, and −3.98 kJ/mol, respectively. Similarly, the per residue contribution energy of the pioglitazone-Pparg complex revealed Cys313, Arg316, Ser317, Glu319, Ala320, Glu323, Ile324, Ile354, Tyr355, Met357, Leu358, Leu361, Val367, and Met392 residues from the binding pocket contribute significantly to forming stable complex via scoring contribution energies of −4.60, −2.19, −1.73, −2.93, −5.59, −3.46, −2.23, −7.81, −3.45, −5.93, −8.44, −4.69, −2.40, and −3.75 kJ/mol, respectively.
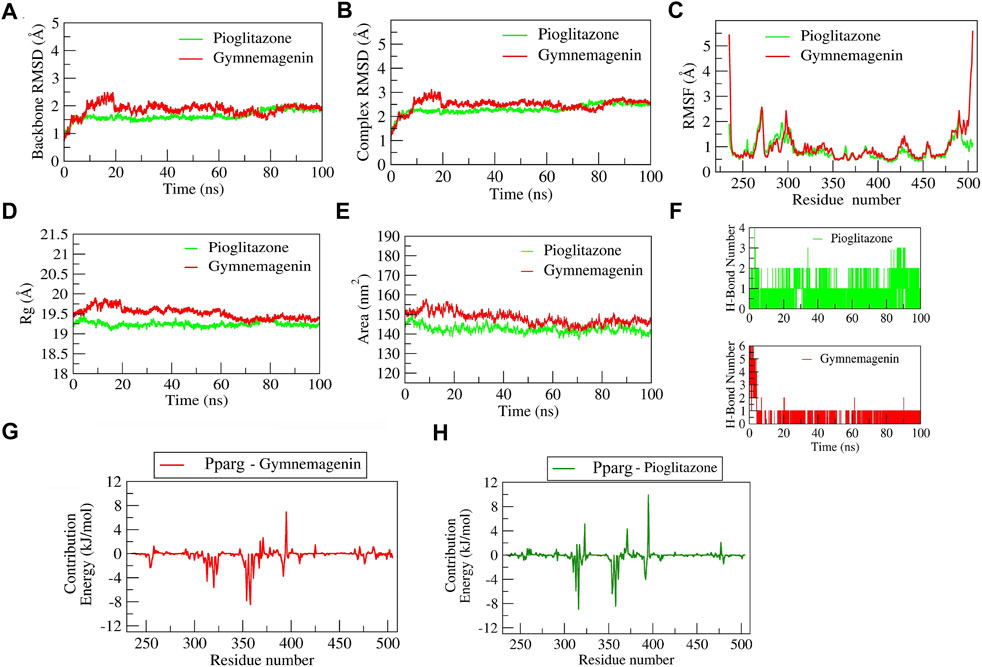
FIGURE 10. Parameters describing gymnemagenin and pioglitazone–Pparg complex structural stabilities. (A) RMSD of backbone, (B) RMSD of complex, (C) RMSF, (D) Rg, (E) SASA, (F) number of H-bond interactions, and (G,H) per-residue contribution energy plot highlighting the importance of the binding pocket residues in stable complex formation.
3.6.2 Stability of gymnemagenin and BMS-309403 with Fabp4
The complex BMS-309403-Fabp4 showed stable dynamics during the 100 ns of simulation after a 30-ns equilibration period compared to the gymnemagenin-Fabp4 complex (Figure 11). The average backbone RMSDs for gymnemagenin and BMS-309403 were 1.67 Å and 1.86 Å, and the complex RMSDs were 9.6 Å and 2.48 Å, respectively. Gymnemagenin was found to be unstable with Fabp4 as it was found to move out of the binding pocket (Supplementary Movie S3). The N-terminal residues showed maximum residual fluctuations (∼5 Å) in both complexes. However, the residues engaged in the stable and conserved non-bonded interactions (Glu73, Arg79, Asp77, Phe17, Arg107, Cys118, Ile105, Ile63, Ala34, Val26, Met21, Ala76, Pro39, Ala76) with BMS-309403 showed relatively smaller fluctuations (∼2.0 Å). In gymnemagenin and the BMS-309403 complex, the protein Rg was found to be stable at ∼14.5 and 14.15 Å, respectively. Similarly, the surface area was also found to be stable for gymnemagenin (∼73 nm2) and BMS-309403 (83 nm2). Supplementary Movies S3, S4 represent the detailed binding mode and stable dynamics of gymnemagenin and BMS-309403 with Fabp4. Gymnemagenin formed six stable H-bonds with zero consistent interaction throughout the simulation. In contrast, BMS-309403 formed two bonds, of which one was consistent. The estimated relative binding energy of the complex gymnemagenin-Fabp4 was −25.406 ± 30.581 kJ/mol, and the van der Waal, electrostatic, polar solvation, and SASA energies were −0.007 ± 0.01, −0.25 ± 0.31, −25.38 ± 30.251, and 0.089 ± 1.137 kJ/mol. Similarly, the estimated relative binding energy of the complex BMS-309403-FABP4 was −21.067 ± 15.68 kJ/mol, and the van der Waal, electrostatic, polar solvation, and SASA energies were −190 ± 13.82, 64.69 ± 24.71, −126.996 ± 28.67, and −22.363 ± 1.412 kJ/mol. Furthermore, the contributions of the active residues in complex formation were calculated. The per residue contribution energy of the gymnemagenin-Fabp4 complex revealed no significant residues from the binding pocket to contribute to forming a stable complex. The contribution energies of the binding pocket residues were less than 0.4 kJ/mol. Similarly, the per-residue contribution energy of BMS-309403-Fabp4 complex revealed Phe17, Met21, Val26, Pro39, Asp72, and Glu73 residues from the binding pocket contributed significantly in forming stable complex via scoring contribution energies of −7.50, −3.45, −3.64, −2.70, −6.52, and −13.05 kJ/mol, respectively.
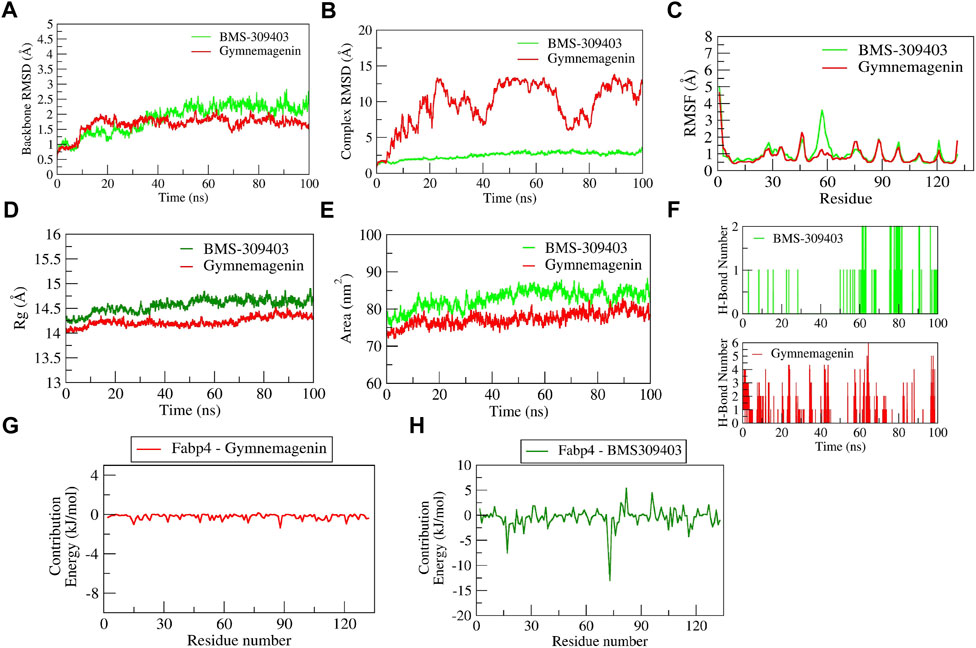
FIGURE 11. Parameters describing gymnemagenin and BMS-309403–Fabp4 complex structural stabilities. (A) RMSD of backbone, (B) RMSD of complex, (C) RMSF, (D) Rg, (E) SASA, (F) number of H-bond interactions, (G,H) per-residue contribution energy plot highlighting the importance of the binding pocket residues in stable complex formation.
3.7 Principal component analysis
We used PCA to investigate the diversity and structural flexibility that result from the stable trajectory generated from 100-ns MD simulations. The first 50 eigenvectors/principal components capture the most collective motion. As a result, we carefully investigated the first two principal components (PCs). The first two eigenvectors’ 2D projection is shown in Figure 12. In the pioglitazone-Pparg complex, it was observed that pioglitazone showed less diversity of conformations during the simulations, whereas gymnemagenin in complex with Pparg showed a similar diversity of conformations with slight flexibility during simulation. However, gymnemagenin showed a larger diversity of conformations of Fabp4 during simulation compared to the standard molecule BMS-309403. This reveals that gymnemagenin forms a stable complex with Pparg but not with Fabp4.
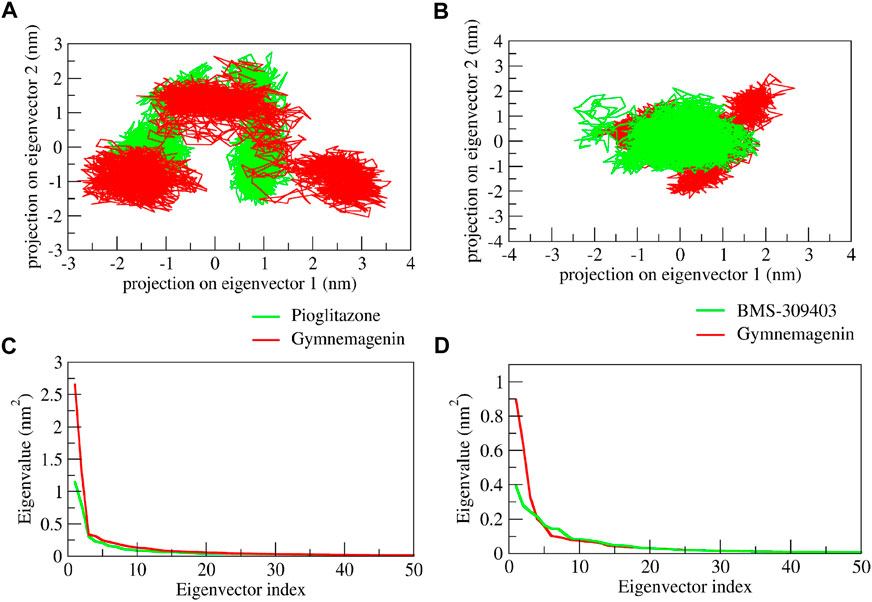
FIGURE 12. Principal component analysis of protein-ligand complexes: the collective motion of gymnemagenin (red) and standard (green) with (A) Pparg and (B) Fabp4 using projections of MD trajectories on two eigenvectors corresponding to the first two principal components. The first 50 eigenvectors were plotted versus the eigenvalue for gymnemagenin (red) and standard (green) with (C) Pparg and (D) Fabp4.
4 Discussion
Obesity is one of the most vital modifiable risk factors for the prevention of T2D. Adipose tissue is an important endocrine organ. Its metabolic abnormalities are associated with obesity and result in dysregulation of multiple metabolic pathways in other tissues. Indeed, the functional and structural balance of white adipose tissue and lipids is essential for the prevention of metabolic diseases and associated complications. Several groups of scientists have worked on the functions of adipose tissue and the genetic understanding of associated lipid metabolism (Berndt et al., 2007; Kandasamy et al., 2012; Albert et al., 2014).
Lipids are stored as triglycerides or triacylglycerols in lipid droplets in skeletal muscles. It is reported that an increased triglyceride level is associated with lipotoxic intermediate metabolites that inhibit insulin signaling and, ultimately, insulin resistance and obesity. Thus, intra-myocellular dynamics of lipid and lipid turnover have a significant impact on obesity and insulin resistance (Kase et al., 2015). The drug therapies for hypertriglyceridemia are still under development. In the present study, we found that gymnemagenin treatment decreased the triglyceride content of 3T3l1 adipocytes. The further examination of the effect of gymnemagenin on the gene expression of three lipases, Fasn, Lipe, and Lpl, responsible for the hydrolysis of triglyceride into fatty acid and glycerol, indicated that gymnemagenin upregulated the expression of Lipe and Lpl genes.
Adipogenesis is the process of differentiation of progenitor cells to mature adipocytes, and this structural change is essential to maintain physiological homeostasis. Dysregulation of adipogenesis leads to ectopic lipid deposition, lipodystrophy, systemic metabolic dysfunction, and an increased risk of developing diabetes and cardiovascular disease (Albert et al., 2014). Pparg is critical for adipogenesis, which controls the formation and size of lipid droplets in several ways, including the transcriptional regulation of Plin2, Cidea, and Scd1-lipid droplet scaffold protein genes. Several investigations have been reported on identifying therapeutic approaches targeting Pparg (Frkic et al., 2021). Phytochemicals have advantages over conventional drugs in that they are cost effective and may have fewer side effects than synthetic drugs. The present study reported that gymnemagenin upregulated the expression of Pparg, Plin2, Cidea and Scd1. The 100-ns molecular docking and dynamics studies identified that gymnemagenin strongly binds to the active site residues of the Pparg compared to its standard molecule, pioglitazone. This study can be further taken up for the identification of potential therapeutic targets and the use of gymnemagenin to treat obesity and T2DM.
Adipokines are the key modulators of lipid storage and distribution, appetite and satiety, and initiators of many immune responses (Kandasamy et al., 2012). In this study, it was found that gymnemagenin induces the upregulation of Adipoq, Lep, and Ccl2, which are very important adipokines in the regulation of lipid metabolism and insulin sensitivity. We also studied the gene expression pattern of Fabp4 and Slc2a4 upon gymnemagenin treatment. However, no significant change in gene expression was observed in either case. Similarly, from the molecular docking and dynamics studies, it is inferred that gymnemagenin has no affinity toward active site residues of Fabp4.
5 Conclusion
Gymnemagenin modulated six molecular pathways: AMPK, PPAR, insulin, Adipocytokine signalling and Fatty acid metabolism are considered to be two pathways, and regulation of lipolysis in adipocytes in Homo sapiens, Mus musculus, and Rattus norvegicus. An in vitro study showed that gymnemagenin escalated triglyceride metabolism by upregulating the expression of lipase genes Lipe and Lpl, responsible for the hydrolysis of triglycerides into fatty acid and glycerol. Gymnemagenin also upregulated the expression of the anti-inflammatory gene Adipoq. In addition, gymnemagenin treatment upregulated the expression of the Pparg gene and downstream target genes Plin2, Cidea and Scd1. Furthermore, this was supported by in silico data where molecular docking of gymnemagenin and standard drug pioglitazone with Pparg revealed that gymnemagenin scored lower binding energy than pioglitazone, and dynamics studies for 100 ns identified that gymnemagenin bound more strongly to the active site residues of the Pparg than its standard molecule pioglitazone. These findings indicated the importance of the therapeutic potency of gymnemagenin against the severe metabolic consequences of impaired structure and function of adipocytes and lipolysis leading to obesity and T2D.
Data availability statement
The datasets presented in this study can be found in online repositories. The names of the repository/repositories and accession number(s) can be found in the article/Supplementary Material.
Author contributions
Study design: AD, VP, DH, and HH; experiments: AD and VP; data analysis: AD and VP; writing and revising: AD and VP; editing: HH, DH, and SR. All authors read and approved the final version of the manuscript.
Funding
The work was supported by the Human Resource Development for Health Research (HRD) scheme of the Department of Health Research (DHR), Ministry of Health & Family Welfare, Government of India (File No. R.12013/32/2020-HR date 09.06.2020), and partially supported by the Indian Council of Medical Research-National Institute of Traditional Medicine (ICMR-NITM), Belagavi, Karnataka, India (Intramural funds).
Acknowledgments
The authors acknowledge the Human Resource Development for Health Research (HRD) scheme of the Department of Health Research (DHR), India, for awarding the Women Scientist Fellowship to ADN (No. R.12013/32/2020-HR date 09.06.2020).
Conflict of interest
The authors declare that the research was conducted in the absence of any commercial or financial relationships that could be construed as a potential conflict of interest.
Publisher’s note
All claims expressed in this article are solely those of the authors and do not necessarily represent those of their affiliated organizations or those of the publisher, the editors and the reviewers. Any product that may be evaluated in this article or claim that may be made by its manufacturer is not guaranteed or endorsed by the publisher.
Supplementary material
The Supplementary Material for this article can be found online at: https://www.frontiersin.org/articles/10.3389/fphar.2022.1074342/full#supplementary-material
References
Al-Harithy, R. N., and Alomari, A. S. (2021). Expression of leptin mRNA as non-invasive biomarker in type 2 diabetes mellitus. Int. J. Clin. Pract. 75 (12), e14844. doi:10.1111/ijcp.14844
Albert, J. S., Yerges-Armstrong, L. M., Horenstein, R. B., Pollin, T. I., Sreenivasan, U. T., Chai, S., et al. (2014). Null mutation in hormone-sensitive lipase gene and risk of type 2 diabetes. N. Engl. J. Med. 370, 2307–2315. doi:10.1056/NEJMoa1315496
Altaf, Q. A., Barnett, A. H., and Tahrani, A. A. (2015). Novel therapeutics for type 2 diabetes: Insulin resistance. Diabetes Obes. Metab. 17 (4), 319–334. doi:10.1111/dom.12400
Amadei, A., Linssen, A. B., De, G. B. L., Van Aalten, D. M., and Berendsen, H. J. (1996). An efficient method for sampling the essential subspace of proteins. J. Biomol. Struct. Dyn. 13 (4), 615–625. doi:10.1080/07391102.1996.10508874
Amadei, A., Linssen, A. B. M., and Berendsen, H. J., (1993). Essential dynamics of proteins. Proteins 17 (4), 412–425. doi:10.1002/prot.340170408
Berndt, J., Kovacs, P., Ruschke, K., Klöting, N., Fasshauer, M., Schön, M. R., et al. (2007). Fatty acid synthase gene expression in human adipose tissue: Association with obesity and type 2 diabetes. Diabetologia 50, 1472–1480. doi:10.1007/s00125-007-0689-x
Bhandare, V. V., Kumbhar, B. V., and Kunwar, A. (2019). Differential binding affinity of tau repeat region R2 with neuronal-specific β-tubulin isotypes. Sci. Rep. 9 (1), 10795. doi:10.1038/s41598-019-47249-7
Bhandare, V. V., and Ramaswamy, A. (2018). The proteinopathy of D169G and K263E mutants at the RNA recognition motif (rrm) domain of tar DNA-binding protein (tdp43) causing neurological disorders: A computational study. J. Biomol. Struct. Dyn. 36 (4), 1075–1093. doi:10.1080/07391102.2017.1310670
Charbonnel, B. (2009). PPAR-α and PPAR-γ agonists for type 2 diabetes. Lancet 374 (9684), 96–98. doi:10.1016/S0140-6736(09)61040-0
Cho, Y. S., Kim, C. H., and Cheon, H. G. (2009). Cell-based assay for screening 11beta-hydroxysteroid dehydrogenase 1 inhibitors. Anal. Biochem. 392, 110–116. doi:10.1016/j.ab.2009.04.038
Cole, J. B., and Florez, J. C. (2020). Genetics of diabetes mellitus and diabetes complications. Nat. Rev. Nephrol. 16 (7), 377–390. doi:10.1038/s41581-020-0278-5
Davoudi, S., and Sobrin, L. (2015). Novel genetic actors of diabetes-associated microvascular complications: Retinopathy, kidney disease, and neuropathy. Rev. Diabet. Stud. 12, 243–259. doi:10.1900/RDS.2015.12.243
Dwivedi, P. S., Patil, V. S., Khanal, P., Bhandare, V. V., Gurav, S., Harish, D. R., et al. (2022). System biology-based investigation of Silymarin to trace hepatoprotective effect. Comput. Biol. Med. 142, 105223. doi:10.1016/j.compbiomed.2022.105223
Frkic, R. L., Richter, K., and Bruning, J. B. (2021). The therapeutic potential of inhibiting PPARγ phosphorylation to treat type 2 diabetes. J. Biol. Chem. 297 (3), 101030. doi:10.1016/j.jbc.2021.101030
Furuhashi, M., Hiramitsu, S., Mita, T., Fuseya, T., Ishimura, S., Omori, A., et al. (2015). Reduction of serum FABP4 level by sitagliptin, a DPP-4 inhibitor, in patients with type 2 diabetes mellitus. J. Lipid Res. 56, 2372–2380. doi:10.1194/jlr.M059469
Greenfield, N. J., and Pietruszko, R. (1977). Two aldehyde dehydrogenases from human liver. Isolation via affinity chromatography and characterization of the isozymes. Biochim. Biophys. Acta 483 (1), 35–45. doi:10.1016/0005-2744(77)90005-5
Hagberg, C. E., Mehlem, A., Falkevall, A., Muhl, L., Fam, B. C., Ortsater, H., et al. (2012). Targeting VEGF-B as a novel treatment for insulin resistance and type 2 diabetes. Nature 490, 426–430. doi:10.1038/nature11464
Jugran, A. K., Rawat, S., Devkota, H. P., Bhatt, I. D., and Rawal, R. S. (2021). Diabetes and plant-derived natural products: From ethnopharmacological approaches to their potential for modern drug discovery and development. Phytother. Res. 35 (1), 223–245. doi:10.1002/ptr.6821
Kandasamy, A. D., Sung, M. M., Boisvenue, J. J., Barr, A. J., and Dyck, J. R. B. (2012). Adiponectin gene therapy ameliorates high-fat, high-sucrose diet-induced metabolic perturbations in mice. Nutr. Diabetes 2, e45. doi:10.1038/nutd.2012.18
Kase, E. T., Feng, Y. Z., Badin, P. M., Bakke, S. S., Laurens, C., Coue, M., et al. (2015). Primary defects in lipolysis and insulin action in skeletal muscle cells from type 2 diabetic individuals. Biochim. Biophys. Acta 1851 (9), 1194–1201. doi:10.1016/j.bbalip.2015.03.005
Khanal, P., Patil, B. M., and Unger, B. (2020). Zebrafish shares common metabolic pathways with mammalian olanzapine-induced obesity. Futur. J. Pharm. Sci. 6, 36. doi:10.1186/s43094-020-00049-7
Khanal, P., Patil, V. S., Bhandare, V. V., Dwivedi, P. S., Shastry, C. S., Patil, B. M., et al. (2022). Computational investigation of benzalacetophenone derivatives against SARS-CoV-2 as potential multi-target bioactive compounds. Comput. Biol. Med. 105668, 105668. doi:10.1016/j.compbiomed.2022.105668
Krivák, R., and Hoksza, D. (2018). P2Rank: Machine learning based tool for rapid and accurate prediction of ligand binding sites from protein structure. J. Cheminform. 10 (1), 39–12. doi:10.1186/s13321-018-0285-8
Kumari, R., and Kumar, R. (2014). g_mmpbsa--a GROMACS tool for high-throughput MM-PBSA calculations. J. Chem. Inf. Model. 54 (7), 1951–1962. doi:10.1021/ci500020m
Lan, H., Cheng, C. C., Kowalski, T. J., Pang, L., Shan, L., Chuang, C. C., et al. (2011). Small-molecule inhibitors of FABP4/5 ameliorate dyslipidemia but not insulin resistance in mice with diet-induced obesity. J. Lipid Res. 52 (4), 646–656. doi:10.1194/jlr.M012757
Michael, L. F., Wu, Z., Cheatham, R. B., Puigserver, P., Adelmant, G., Lehman, J. J., et al. (2001). Restoration of insulin-sensitive glucose transporter (GLUT4) gene expression in muscle cells by the transcriptional coactivator PGC-1. Proc. Natl. Acad. Sci. U. S. A. 98 (7), 3820–3825. doi:10.1073/pnas.061035098
Minnaard, R., Schrauwen, P., Schaart, G., Jorgensen, J. A., Lenaers, E., Mensink, M., et al. (2009). Adipocyte differentiation-related protein and OXPAT in rat and human skeletal muscle: Involvement in lipid accumulation and type 2 diabetes mellitus. J. Clin. Endocrinol. Metab. 94 (10), 4077–4085. doi:10.1210/jc.2009-0352
Ouchi, N., Parker, J. L., Lugus, J. J., and Walsh, K. (2011). Adipokines in inflammation and metabolic disease. Nat. Rev. Immunol. 11, 85–97. doi:10.1038/nri2921
Patil, V. S., Deshpande, S. H., Harish, D. R., Patil, A. S., Virge, R., Nandy, S., et al. (2020). Gene set enrichment analysis, network pharmacology and in silico docking approach to understand the molecular mechanism of traditional medicines for the treatment of diabetes mellitus. J. Proteins Proteom. 11 (4), 297–310. doi:10.1007/s42485-020-00049-4
Rathinasabapathy, T., Jackson, K. M. P., Thor, Y., Buru, A. S., Esposito, D., Li, X., et al. (2017). Thiazolopyridines improve adipocyte function by inhibiting 11 β HSD1 oxoreductase activity. J. Chem. 2017, 1–10. doi:10.1155/2017/3182129
Samdani, A., and Vetrive, l. U. (2018). Poap: A gnu parallel based multithreaded pipeline of open babel and AutoDock suite for boosted high throughput virtual screening. Comput. Biol. Chem. 74, 39–48. doi:10.1016/j.compbiolchem.2018.02.012
Sanjabi, B., Dashty, M., Ozcan, B., Akbarkhanzadeh, V., Rahimi, M., Vinciguerra, M., et al. (2015). Lipid droplets hypertrophy: A crucial determining factor in insulin regulation by adipocytes. Sci. Rep. 5, 8816. doi:10.1038/srep08816
Shannon, P., Markiel, A., Ozier, O., Baliga, N. S., Wang, J. T., Ramage, D., et al. (2003). Cytoscape: A software environment for integrated models of biomolecular interaction networks. Genome Res. 13 (11), 2498–2504. doi:10.1101/gr.1239303
Sheleme, T., Mamo, G., Melaku, T., and Sahilu, T. (2020). Prevalence, patterns and predictors of chronic complications of diabetes mellitus at a large referral hospital in Ethiopia: A prospective observational study. Diabetes Metab. Syndr. Obes. 13, 4909–4918. doi:10.2147/DMSO.S281992
Szklarczyk, D., Morris, J. H., Cook, H., Kuhn, M., Wyder, S., Simonovic, M., et al. (2016). The STRING database in 2017: Quality-controlled protein–protein association networks, made broadly accessible. Nucleic Acids Res. 937, D362. doi:10.1093/nar/gkw937
Tiwari, P., Mishra, B. N., and Sangwan, N. S. (2014). Phytochemical and pharmacological properties of Gymnema sylvestre: An important medicinal plant. Biomed. Res. Int. 1-18, 830285. doi:10.1155/2014/830285
Tran, N., Pham, B., and Le, L. (2020). Bioactive compounds in anti-diabetic plants: From herbal medicine to modern drug discovery. Biology 9 (9), 252. doi:10.3390/biology9090252
Van Aalten, D. M. F., Findlay, J. B. C., Amadei, A., and Berendsen, H. J. C. (1995). Essential dynamics of the cellular retinol-binding protein evidence for ligand-induced conformational changes. Protein Eng. 8 (11), 1129–1135. doi:10.1093/protein/8.11.1129
Van Der Spoel, D., Lindahl, E., Hess, B., Groenhof, G., Mark, A. E., and Berendsen, H. J. (2005). Gromacs: Fast, flexible, and free. J. Comput. Chem. 26 (16), 1701–1718. doi:10.1002/jcc.20291
Keywords: gymnemagenin, lipid metabolism, obesity, in vitro study, in silico pharmacology, type 2 diabetes mellitus
Citation: DasNandy A, Patil VS, Hegde HV, Harish DR and Roy S (2022) Elucidating type 2 diabetes mellitus risk factor by promoting lipid metabolism with gymnemagenin: An in vitro and in silico approach. Front. Pharmacol. 13:1074342. doi: 10.3389/fphar.2022.1074342
Received: 19 October 2022; Accepted: 25 November 2022;
Published: 13 December 2022.
Edited by:
Rupesh Vitthalrao Chikhale, Rashtrasant Tukadoji Maharaj Nagpur University, IndiaReviewed by:
Vishwambhar Bhandare, Shivaji University, IndiaGurunathan Subramanian, Indian Institute of Technology Mandi, India
Bajarang Kumbhar, SVKM’s Narsee Monjee Institute of Management Studies, India
Mukul Tambe, MIT World Peace University, India
Copyright © 2022 DasNandy, Patil, Hegde, Harish and Roy. This is an open-access article distributed under the terms of the Creative Commons Attribution License (CC BY). The use, distribution or reproduction in other forums is permitted, provided the original author(s) and the copyright owner(s) are credited and that the original publication in this journal is cited, in accordance with accepted academic practice. No use, distribution or reproduction is permitted which does not comply with these terms.
*Correspondence: Harsha V. Hegde, ZHJodmhlZ2RlQGdtYWlsLmNvbQ==; Darasaguppe R. Harish, ZHJoYXJpc2g0OUBnbWFpbC5jb20=
†These authors have contributed equally to this work