 Yuchen Zhang
 Xiujuan Lei
 Yi Pan
 Fang-Xiang Wu
- 1School of Computer Science, Shaanxi Normal University, Xi’an, China
- 2Faculty of Computer Science and Control Engineering, Shenzhen Institute of Advanced Technology, Chinese Academy of Sciences, Shenzhen, China
- 3Division of Biomedical Engineering, University of Saskatchewan, Saskatoon, SK, Canada
The understanding of therapeutic properties is important in drug repositioning and drug discovery. However, chemical or clinical trials are expensive and inefficient to characterize the therapeutic properties of drugs. Recently, artificial intelligence (AI)-assisted algorithms have received extensive attention for discovering the potential therapeutic properties of drugs and speeding up drug development. In this study, we propose a new method based on GraphSAGE and clustering constraints (DRGCC) to investigate the potential therapeutic properties of drugs for drug repositioning. First, the drug structure features and disease symptom features are extracted. Second, the drug–drug interaction network and disease similarity network are constructed according to the drug–gene and disease–gene relationships. Matrix factorization is adopted to extract the clustering features of networks. Then, all the features are fed to the GraphSAGE to predict new associations between existing drugs and diseases. Benchmark comparisons on two different datasets show that our method has reliable predictive performance and outperforms other six competing. We have also conducted case studies on existing drugs and diseases and aimed to predict drugs that may be effective for the novel coronavirus disease 2019 (COVID-19). Among the predicted anti-COVID-19 drug candidates, some drugs are being clinically studied by pharmacologists, and their binding sites to COVID-19-related protein receptors have been found via the molecular docking technology.
Introduction
Traditional drug discovery is often based on a specific disease. It generally has a number of stages, including target discovery, target validation, lead compound identification, lead optimization, preclinical drug development, advancing to clinical trials, and clinical trials. Typically, the development of an effective drug takes an average of 15 years and costs 800 million to 1.5 billion US dollars (Dudley et al., 2011) (Yu et al., 2015). However, the success rate is often not high due to the lack of systematic evaluation of other indications that drugs can treat, as well as the impact of our life, disease development, and market factors. These difficulties have caused pharmaceutical companies very worrisome when developing new drugs, and the development speed is slow (Booth and Zemmel, 2004).
From cheminformatics and life sciences (Bader et al., 2008), it is well acknowledged that one drug may work on multiple target proteins, and one target protein is related to multiple diseases, which is the basis of drug repositioning. Actually, drug repositioning brings significant benefits to drug research and related pharmaceutical companies. For example, minoxidil (Varothai and Bergfeld, 2014), a drug originally used to relieve hypertension and excessive tension was later found to effectively treat symptoms such as hair loss. Antifungal and antitumor drug itraconazole (ITZ) can act as a broad-spectrum enterovirus inhibitor (Strating et al., 2015). However, this kind of drug repositioning is mostly based on clinical accidental discoveries and the experience of pharmacists, and it is difficult for large-scale investigation.
With the development of cross-technology, more and more researchers tend to use computational technologies to predict new indications of existing drugs. These methods mainly include network propagation, low-rank matrix approximation, and graph neural network. Based on biological networks, similarity measures and bi-random walk were proposed for drug repositioning (Luo et al., 2016). Yu et al. combined miRNAs and group specificity to predict potential therapeutic drugs for breast cancer (Yu et al., 2018). A genome-wide positioning systems network algorithm was developed for drug repurposing (Cheng et al., 2019). Fiscon et al. presented a new network-based algorithm SAveRUNNER and applied it to COVID-19 (Fiscon et al., 2021). However, due to the complexity and noise of interactions between organisms, the prediction accuracy based on those existing methods cannot meet the requirements. Some methods were developed based on low-rank matrix approximation. Luo et al. proposed a drug repositioning recommendation system (DRRS) to predict novel drug indications based on low-rank matrix approximation and randomized algorithms (Luo et al., 2018). Wang et al. proposed a projection onto convex sets (Wang et al., 2019) to relocate the functions of drugs. Weight graph regularized matrix factorization was also used in drug response prediction (Guan et al., 2019). Wu et al. used meta paths and singular value decomposition to predict drug–disease associations (Wu et al., 2019). Yang et al. used a bounded nuclear norm regularization (BNNR) method to complete the drug–disease matrix (Yang et al., 2019). An improved drug repositioning approach using Bayesian inductive matrix completion also was proposed (Zhang W. et al., 2020). Meng et al. used the similarity-constrained probabilistic matrix factorization for drug repositioning and applied it to COVID-19 (Meng et al., 2021). However, these matrix-based methods did not take the biochemical properties of drugs and diseases into consideration.
With the widespread application of artificial intelligence technology, more and more machine learning and deep learning methods are also applied to drug development and other fields of bioinformatics. Regularized kernel classifier was proposed to predict new drug–disease associations (Lu and Yu, 2018). Madhukar et al. used a Bayesian machine learning approach to identify drug targets with diverse data types (Madhukar et al., 2019). Huang et al. proposed a network embedding-based method CMFMTL for predicting drug–disease associations. CMFMTL handled the problem as multi-task learning where each task is to predict one type of association, and two tasks complement and improve each other by capturing the relatedness between them (Huang et al., 2020). Zhu et al. constructed a drug knowledge graph for drug repurposingand transformed information in the drug knowledge graph into valuable inputs to allow machine learning models to predict drug repurposing candidates (Zhu et al., 2020). Zeng et al. developed a network-based deep learning approach, termed deepDR (Zeng et al., 2019), for in silico drug repurposing. Li et al. used molecular structures and clinical symptoms via a deep convolutional neural network to identify drug–disease associations (Li Z et al., 2019). A network embedding method called NEDD (Zhou et al., 2020) was proposed to predict novel associations between drugs and diseases using meta paths of different lengths.
Graph convolutional network (GCN) methods have also been further used in the field of medicine. A layer attention graph convolutional network (LAGCN) (Yu et al., 2020) was also used by fusing heterogeneous information to the GCN. They introduced a layer attention mechanism to combine embeddings from multiple graph convolution layers for further improving the prediction performance (Cai et al., 2021). Wang et al. also proposed a global graph feature learning method to predict associations (Wang et al., 2022). Meta path-based methods such as metapath2vec and meta-structure have also been developed (Zhang Y. et al., 2020; Lei et al., 2021). Algorithms based on graph neural networks (GNNs) or graph embeddings consider both biochemical characteristics and network interactions, but they often have high time complexity and do not consider the characteristic of drug clusters or combination drugs. At the same time, when extracting features of drug–disease associations, a large number of methods only directly connect drug features and disease features without considering the influence of different features. The feature representation of association needs to be improved.
While existing methods cannot accurately predict the potential drug–disease associations, and the network is often unchangeable after model training, we proposed a drug repositioning method DRGCC based on network clustering constraints and GraphSAGE. First, we extracted the molecular structure features of drugs and the symptom features of diseases as the biological attribute features. After that, we used the associations between drugs and genes, as well as the relationships between diseases and genes, to reconstruct a drug–drug interaction network and establish a disease similarity network. The third step was to use a clustering algorithm to divide the two networks into some clusters. The network clustering features of drugs and diseases were obtained by matrix factorization with the divided cluster set as a condition constraint, respectively. Finally, we built two GraphSAGE models based on drug and disease networks and fed the attributes and clustering features of drugs and diseases to the two models, respectively, to obtain the potential treatment probability of the existing drugs for the diseases. The method was applied to the prediction of anti-COVID-19 drugs, and some case studies were conducted. The framework of the method DRGCC is shown in Figure 1. The main contributions of this work are summarized as the following two points: 1) DRGCC integrates the clustering features of networks, which can effectively improve the prediction accuracy of drug–disease associations. 2) DRGCC can embed new nodes in the existing network and predict their associations. In addition, DRGCC is complementary to existing experimental methods to enable rapid and accurate discovery of drug candidates for anti-COVID-19 and other emerging viral infectious diseases.
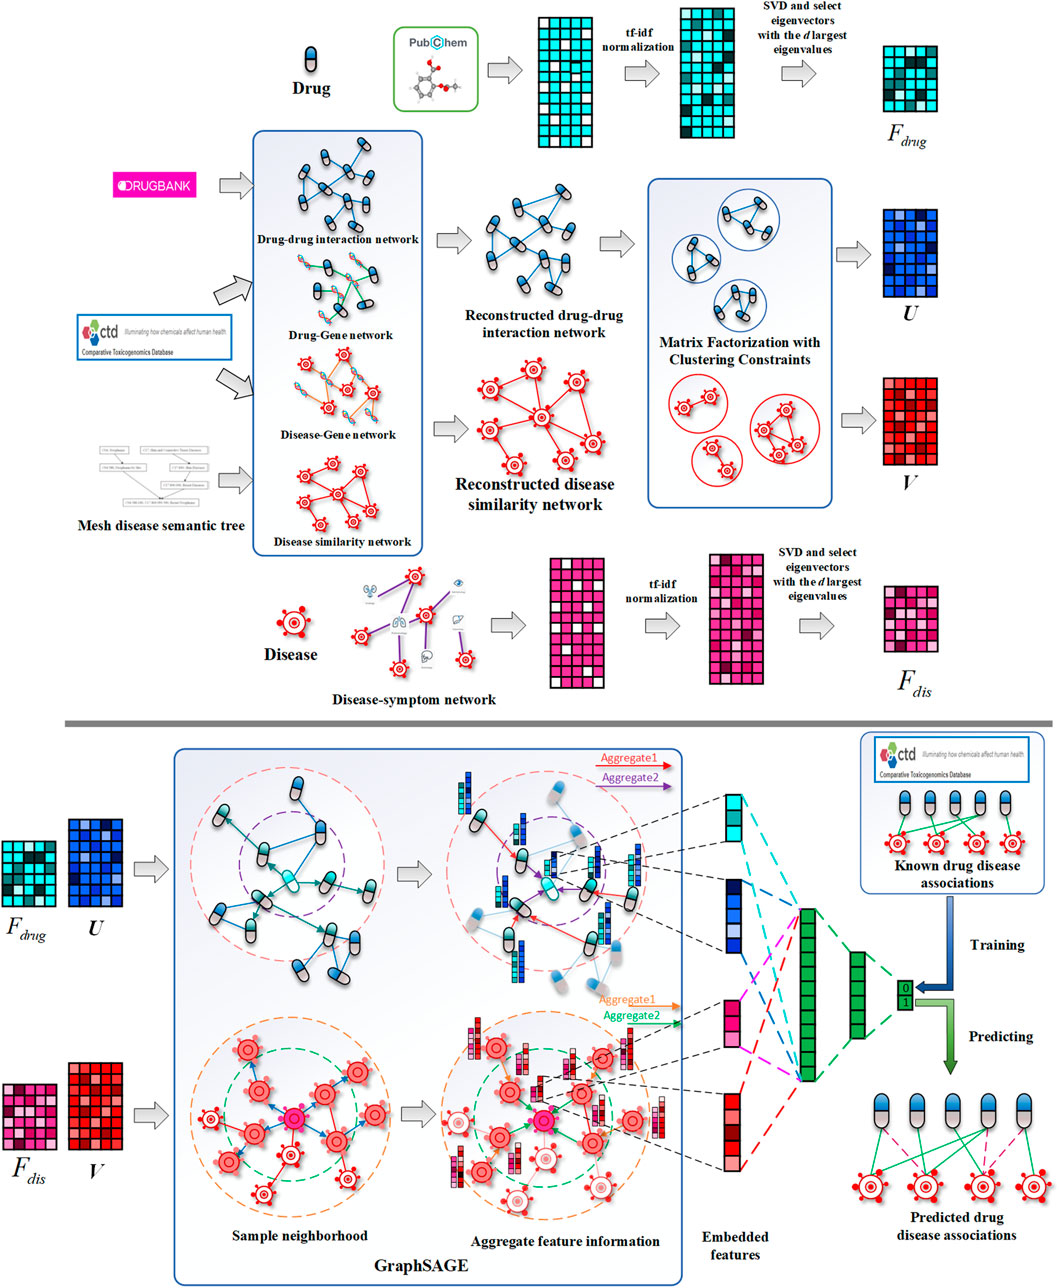
FIGURE 1. Schematic diagrams of data processing and DRGCC model. 1) Reconstruct the drug interaction network and establish the disease similarity network, 2) extract the attributes feature of drugs and diseases, 3) obtain network clustering features of drugs and diseases, and 4) construct the GraphSAGE prediction model to predict potential drug–disease relationships.
Materials and Method
In this section, we introduce the database used in the study and how they were processed. The known associations of drug and disease were obtained. The drug–drug interaction network was reconstructed. The disease similarity network was calculated. Their attribute features and network features were also extracted. The purpose of our study is to predict potential associations from known drug–disease associations, which can be formulated as a classification problem. Therefore, we developed a GNN model based on GraphSAGE, which takes the obtained drug and disease attribute features and clustering features as input, and outputs the possibility of potential relationships between them.
Known Associations of Drugs and Diseases
Known drug and disease relationship data can be obtained from the Comparative Toxicogenomics Database (CTD) (Davis et al., 2021). CTD is a publicly available database that aims to advance understanding of how environmental exposures affect human health. It provides manually curated information about drug compound–gene/protein interactions, drug compound–disease, and gene–disease relationships. We first screened 36,392 drug–disease associations marked with therapeutic relationships in CTD (version 2021.2.26). They corresponded to 6,699 drugs and 2,472 diseases. In order to make it more focused and easier to verify the method later, we extracted drugs with more than 10 disease treatment effects and diseases that are affected by more than 10 drugs. We made the corresponding PubChem Compound ID (CID) and PubChem Substance ID (SID) (Kim et al., 2021) for each drug compound. In the end, we extracted 780 drugs, 717 diseases, and 17,594 therapeutic associations. The known drug–disease association matrix is marked as Y, if drug i has a therapeutic effect on disease j, then
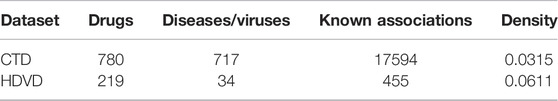
TABLE 1. Statistics of pre-processed CTD and HDVD database.
Reconstruction of Drug–Drug Interaction Network
In daily life, we have known for a long time that there are interactions between drugs and drugs. Some combinations of drugs can promote the cure of diseases. The interactions between drugs can also provide the basis for feature extraction and fusion of drugs. DrugBank (Wishart et al., 2018) provides us with a large number of drug–drug interactions (DDIs). We found 2,669,764 interactions in the database. We denote the drug–drug interaction matrix by
These associated genes often encode target proteins, and thus, we considered the relationship between drugs and target proteins, making the drug interaction network more complete.
Construction of Disease Similarity Network
There are also similarities between diseases, and a large number of calculation methods for disease similarity have been developed in the literature. In studying the relationship between miRNAs and diseases, Cui et al. successively developed two versions of the method (Wang et al., 2010) (Li J. et al., 2019), both of which applied disease semantic similarity. All the denominations of diseases were in accordance with the MeSH (Yu, 2018) database (https://www.nlm.nih.gov/mesh/meshhome.html). Finally, we obtained the semantic similarity matrix
where
Processing of Attribute Features
The attribute features of drugs can be described by their structures. The PubChem system generates a binary substructure fingerprint for chemical structures. These fingerprints are used by PubChem for similarity neighboring and similarity searching (Kim et al., 2021). The structure of a drug can be described by 881 substructures, and a substructure is a fragment of a chemical structure. The fingerprint is an ordered list of binary bits (0/1). A Boolean value for each bit determines or tests the presence of a chemical structure. Binary data are stored in one-byte increments. Therefore, the length of the fingerprint is 111 bytes (888 bits), which include padding 7 bits at the end to complete the last byte. The four-byte prefix including the fingerprint bit length (881 bits) increases the size of the stored PubChem fingerprint to 115 bytes (920 bits). To learn embeddings of drugs, we also used latent semantic analysis (Deerwester et al., 1990). Let
where
idf
Similar to drug attribute feature extraction, disease attribute features are also extracted. Diseases are often accompanied by a large number of symptoms when they occur. Zhou et al. established a disease–symptom network when studying the commonalities between diseases (Zhou et al., 2014). They gave 322 common symptoms for each disease, established a disease–symptom relationship matrix, and also used the term frequency-inverse document frequency method to weight. After that, we also used the SVD method to obtain a disease feature matrix
Extraction of Network Clustering Feature
In the previous section, we have obtained attribute features of drugs and diseases. However, the network features between drugs and diseases were not involved. On the other hand, numerous studies have confirmed the modularity that exists between biomolecules (Ni et al., 2020) (Groza et al., 2021). Matrix factorization, as a commonly used low-rank matrix approximation method, can achieve the goal by adding expectation constraints. Therefore, we aimed to use the matrix factorization method to measure the features of the relationship between drugs and diseases and consider the modularity of drugs and diseases. Two constraints were added to matrix factorization, one is sparsity and the other is clustering constraints. For sparsity, it is desirable to obtain a basis matrix with fewer parameters and be able to restore the original associations. It can be written as follows:
where
where
where
where
Then, we defined matrices
Therefore, the constraint term of clustering can be expressed by formula (12):
As a result, the constraint matrix factorization in formula (6) has been transformed into
The partial derivatives of J(U, V) with respect to U and V are calculated as follows:
After the initial U and V are randomly given, solution is solved as per the following iterative rules until the stopping condition is met. Drug network clustering feature U and disease network clustering feature V are obtained.
Drug Repositioning Using GraphSAGE
GraphSAGE (SAmple and aggreGatE) (Hamilton et al., 2017) is a new graph convolutional neural (GCN) (Defferrard et al., 2016) model proposed, which has two improvements to the original GCN. On the one hand, it used the strategy of sampling neighbors to transform the GCN from a full graph training method to a node-centric small batch training method, which made large-scale data distributed training possible. On the other hand, the algorithm extended the operation of aggregating neighbors. In this study, we used the GraphSAGE model for the drug–drug interaction network and disease similarity network, respectively, to obtain their low dimensional embedding vectors and make predictions through a simple neural network. The feature x of each node v in these networks is marked as
Mean aggregator:
MeanPool aggregator:
MaxPool aggregator:
GCN aggregator:
LSTM aggregator:
where
Algorithm 1. GraphSAGE minibatch forward propagation in drug–drug interaction or disease similarity network.
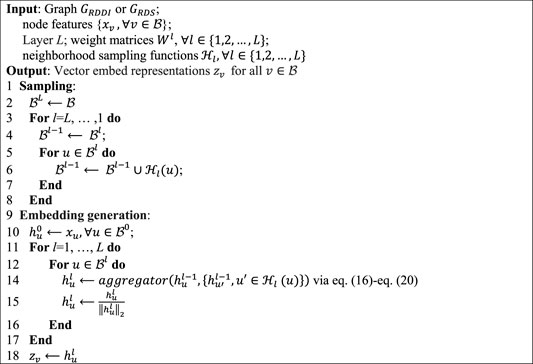
Specifically, we feed the drug attribute feature
Optimization
GraphSAGE can perform unsupervised learning (Xu et al., 2020), but this objective function is completely based on the topological properties of the network, ignoring the original features of the nodes. If it is applied to this research, each training needs to use a different network. Its essence can reflect the relationship of the features between nodes very well, but it cannot predict the relationship very well. Therefore, we still used the cross-entropy function as the objective function. In order to prevent the over-fitting problem, an L2-regularization is also adopted:
where
Experimental Results and Analysis
Based on previous works, we validate our method by answering the following questions:
• Are the features we extracted valid, and can network clustering features improve the performance of the method?
• Can DRGCC predict drug–disease associations with higher accuracy?
• Can we verify that the predicted repositioning drugs are effective, especially for COVID-19?
Experiment Setting
In our study, we used 5-fold cross-validation (5-fold CV) to evaluate the prediction performance of DRGCC and other competing methods. All samples were randomly divided into five equal-sized parts, four parts of them were used as training data, and the remaining one was used as test data. This process was repeated 5 times, with each part of the data tested once, and the average result of these 5 times was taken as the result of this cross-validation. After that, the samples were randomly divided again, cross-validation was also performed 5 times, and the results were averaged. We mainly used seven metrics: area under the receiver operating characteristic curve (AUC), area under the precision and recall curve (PRAUC), F1_SCORE, ACCURACY, SPECIFICITY, PRECISION, and RECALL (Yu et al., 2020), to comprehensively evaluate the performance of the method. We took the prediction threshold that maximizes the F1_SCORE and built two-layer GraphSAGE models for drugs and diseases separately. After further statistical analysis of drug and disease features, we set some default parameters. The attribute feature dimension
Parameter Sensitivity Analysis
In constraint matrix factorization, the regularization of parameters
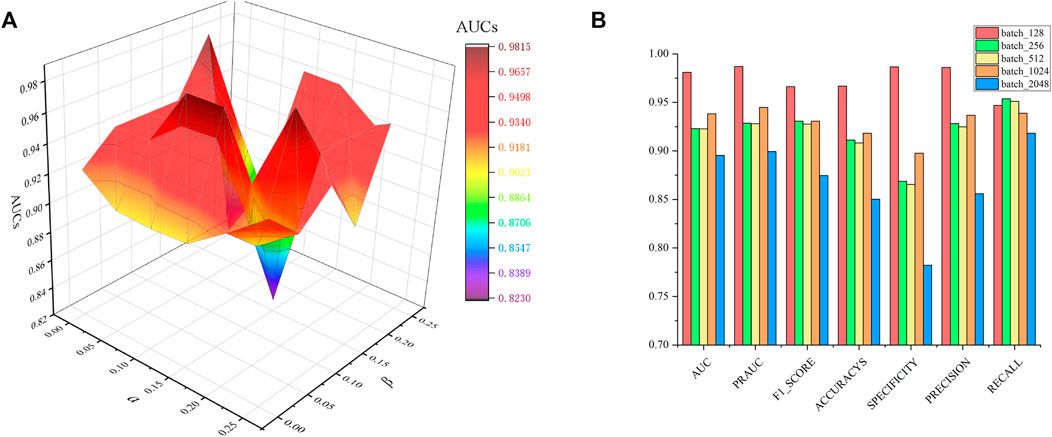
FIGURE 2. Parametric analysis, (A) effects
For the GraphSAGE, there are a total of five different aggregation methods. We performed comparisons on dataset CTD and dataset HDVD, respectively. We can find that the performance of the aggregation methods based on mean, meanPool, and maxPool are similar in Figure 3 and are significantly higher than that of the aggregation based on the LSTM and GCN. This may illustrate that structural features between drugs and symptom features between diseases can be fused using linear methods. Finally, we used the mean method as the aggregation method of the DRGCC.
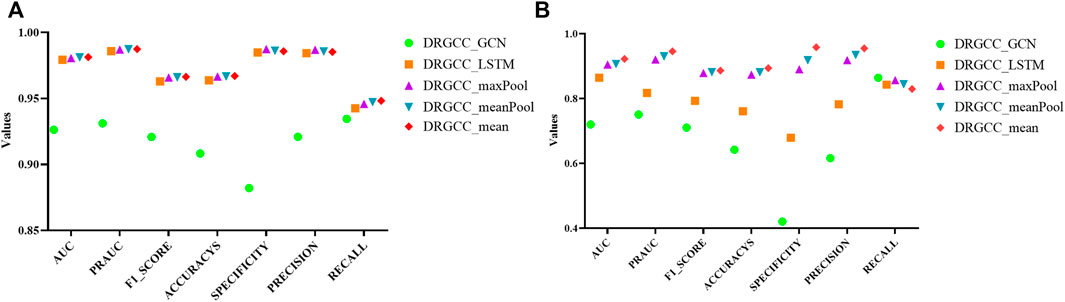
FIGURE 3. Impact of different aggregation methods on performance. (A) Performance of different aggregation methods on the CTD dataset; (B) Performance of different aggregation methods on the HDVD dataset.
We also evaluated the sampling number of network neighbors. Similar to Cui et al. (2021), we tested 4 cases, where
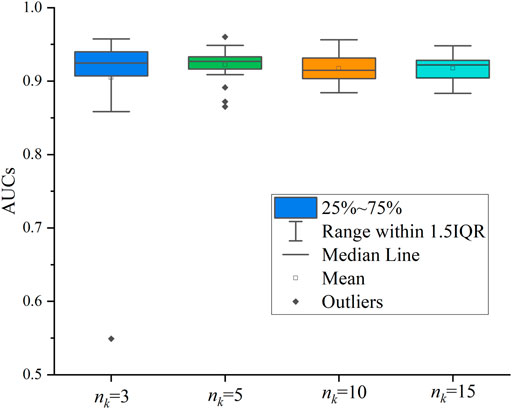
FIGURE 4. Effect of the number
Effectiveness of Network Clustering Features
To answer the first question of the experiment, we conduct ablation experiments using only attribute features DRGCC_Attribute and only network clustering features DRGCC_Cluster for prediction, respectively. Table 2 shows that the model with clustering features is slightly higher than the model with only attribute features, and the fusion of the two features has a prominent effect on the CTD database. In Figure 5, the ROC curve of a 5-fold cross-validation is depicted. The average of 5 times is also calculated. It is clear that the performance of applying two features to DRGCC at the same time is better than using a single one, and the AUC is as high as 0.9809. The network clustering feature has a better effect on improving the performance of the method.
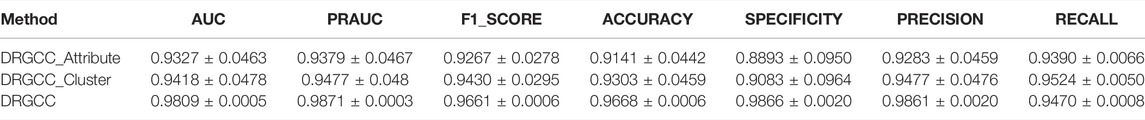
TABLE 2. Comparison of different features on prediction performance.
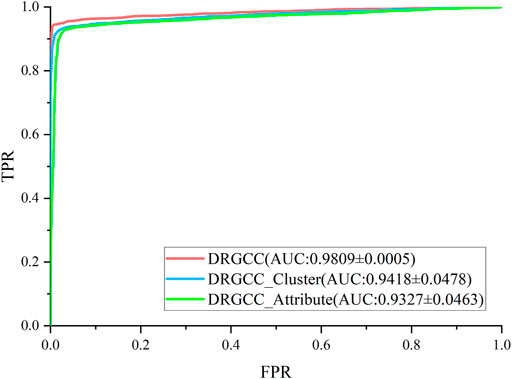
FIGURE 5. ROC and AUC comparison of DRGCC with different features.
Comparative Analysis With Other Methods
To answer the second question of the experiment, we compared DRGCC with six state-of-the-art drug repositioning methods in this section, such as MBiRW (Luo et al., 2016), DRRS (Luo et al., 2018), BNNR (Zhang W. et al., 2020), SCPMFDR (Meng et al., 2021), NIMCGCN (Li et al., 2020), and LAGCN (Yu et al., 2020) on CTD and HDVD datasets. These methods are mainly divided into three categories: methods based on network propagation, methods based on low-rank matrix approximation, and methods based on the GNN.
• MBiRW (Luo et al., 2016) integrates drug or disease feature information with known drug–disease associations, and the comprehensive similarity measures are developed to calculate similarity for drugs and diseases. They are incorporated into a heterogeneous network with known drug–disease interactions. Based on the drug–disease heterogeneous network, the bi-random walk (BiRW) algorithm is used to identify potential novel indications for a given drug.
• DRRS (Luo et al., 2018) is a matrix completion-based recommendation system on a drug–disease heterogeneous network to predict drug–disease associations.
• BNNR (Zhang W. et al., 2020) is a bounded nuclear norm regularization method to complete a drug–disease heterogeneous network.
• SCPMFDR (Meng et al., 2021) is implemented on an adjacency matrix of a heterogeneous drug–virus network, which integrates the known drug–virus interactions, drug chemical structures, and virus genomic sequences. SCPMF projects the drug–virus interactions matrix into two latent feature matrices for the drugs and viruses, which reconstruct the drug–virus interactions matrix when multiplied together, and then introduces similarity constrained probabilistic matrix factorization to predict associations.
• NIMCGCN (Li et al., 2020) use GCNs to learn latent feature representations of miRNA and disease from the similarity networks and then put the learned features into a neural inductive matrix completion model to obtain a reconstructed association matrix. NIMCGCN is a GCN-based method proposed for the miRNA–disease association prediction, and we adopt it as the baseline method for the drug–disease association.
• LAGCN (Yu et al., 2020) integrates the known drug–disease associations, drug–drug similarities, and disease–disease similarities into a heterogeneous network and applies the graph convolution operation to the network to learn the embeddings of drugs and diseases. It combines the embeddings from multiple graph convolution layers using the attention mechanism.
In Table 3, the results show that our method outperforms other methods on all 7 metrics for the CTD database. In large networks, only considering the relationship between nodes in the network and ignoring the biochemical properties of the nodes themselves have poor prediction performance. For the drug–virus prediction, disease similarity networks based on amino acid sequences and structure-based on drug similarity networks have been provided in HDVD. Since there are no features of viruses in the original dataset, we used DRGCC_cluster for the prediction problem. The prediction results are slightly lower than the results on the CTD due to a large number of unknown relationships and the inclusion of the new virus COVID-19, as shown in Table 4. Except for the RECALL, the other evaluation values are the highest. The AUC reaches 0.9222, and the PRAUC reaches 0.9458. It can be seen that DRGCC has excellent performance.
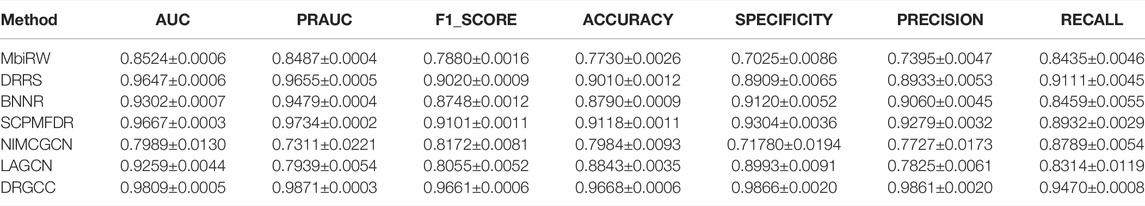
TABLE 3. Performance of comparison methods on CTD dataset.
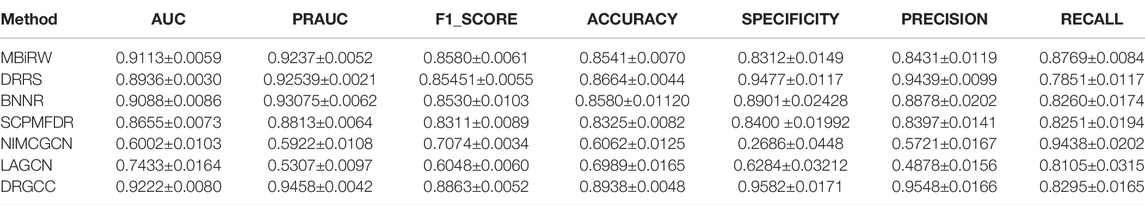
TABLE 4. Performance of comparison methods on HDVD dataset.
Case Studies
To answer the third question of the experiment, we presented an analysis of the predicted repositioned drugs. The top 10 predicted drug–disease relationships were extracted, as shown in Table 5. Among the top 10 prediction results, we can find corroborations or explanations for 6 predictions from other studies. Early evidence in rats suggested that acetazolamide may inhibit sodium and water transport in the ileum in addition to inhibiting bicarbonate secretion (Sladen, 1973). It may have an influence on duodenal ulcer treatment. Rimonabant was shown to be safe and effective in treating the combined cardiovascular risk factors of smoking and obesity (Cleland et al., 2004). Hypoosmolar hyponatremia occurs in conditions of plasma volume depletion such as cirrhosis and heart failure and syndromes of inappropriate antidiuretic hormone secretion. Conventional proposals for euvolemic and hypervolemic hyponatremia consist of lithium carbonate (Gross, 2008). Peyrani et al. believed that therapeutics beyond antibiotics (e.g., heparin or aspirin) may be indicated during and after hospitalization for the patients with community-acquired pneumonia (Peyrani and Ramirez 2013). Newer antiemetic with prokinetic properties (cisapride) have also been introduced in the management of gastrointestinal motility disturbances and inflammatory bowel diseases. Some benzodiazepines have been shown to be effective in treating certain anxiety disorders (Swedish Council on Health Technology Assessment, 2005).
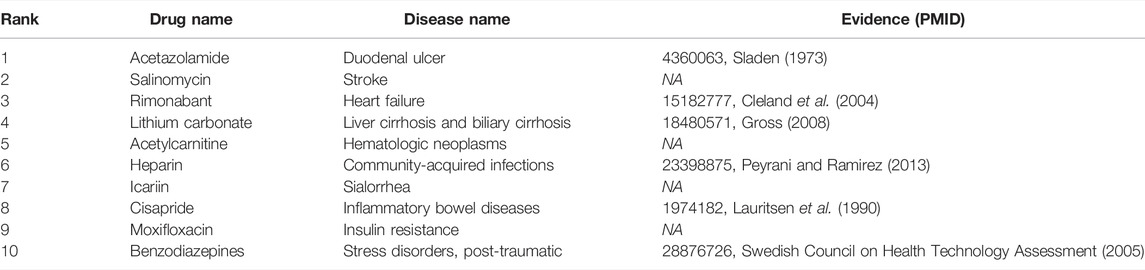
TABLE 5. Top 10 repositioned drugs predicted by the DRGCC.
The novel coronavirus disease 2019 (COVID-19) pandemic has triggered a massive health crisis and upended economies across the globe. However, the research and development of traditional medicines for the new coronavirus is very expensive in terms of time, manpower, and funds. Drug repurposing emerged as a promising therapeutic strategy during the COVID-19 virus crisis. We also predicted the top 10 possible drugs for anti-COVID-19, as shown in Table 6. Excitingly, seven of them have been reported by medical researchers, such as, triazavirin is a guanine nucleotide analog antiviral that has shown efficacy against influenza A and B, including the H5N1 strain. Given the similarities between SARS-CoV-2 and H5N1, health scientists are investigating triazavirin as an option to combat COVID-19 (Shahab and Sheikhi, 2021) (Valiulin et al., 2021). Aspergillus-producing diseases range from allergic syndromes to chronic lung disease and invasive infections and are frequently observed following COVID-19 infection. Posaconazole has better efficacy with less toxicity for extensive infection and severe immunosuppression (Cadena et al., 2021). In the reports on possible drugs for COVID-19, Uddin et al. mentioned that mefloquine may be one of the options (Uddin et al., 2021). In the research of Solanich et al., methylprednisolone and tacrolimus were considered that might be beneficial to treat those COVID-19 patients progressing into severe pulmonary failure and systemic hyperinflammatory syndrome (Solanich et al., 2021). Molnupiravir (EIDD-2801) was originally designed for the treatment of alphavirus infections. Painter et al. described its evolution into a potential drug for the prevention and treatment of COVID-19 (Painter et al., 2021). Umifenovir was deemed one of the most hopeful antiviral agents for improving the health of COVID-19 patients (Trivedi et al., 2020). The studies of Lai et al. showed that the use of mycophenolic acid might be a strategy to reduce viral replication (Lai et al., 2020).
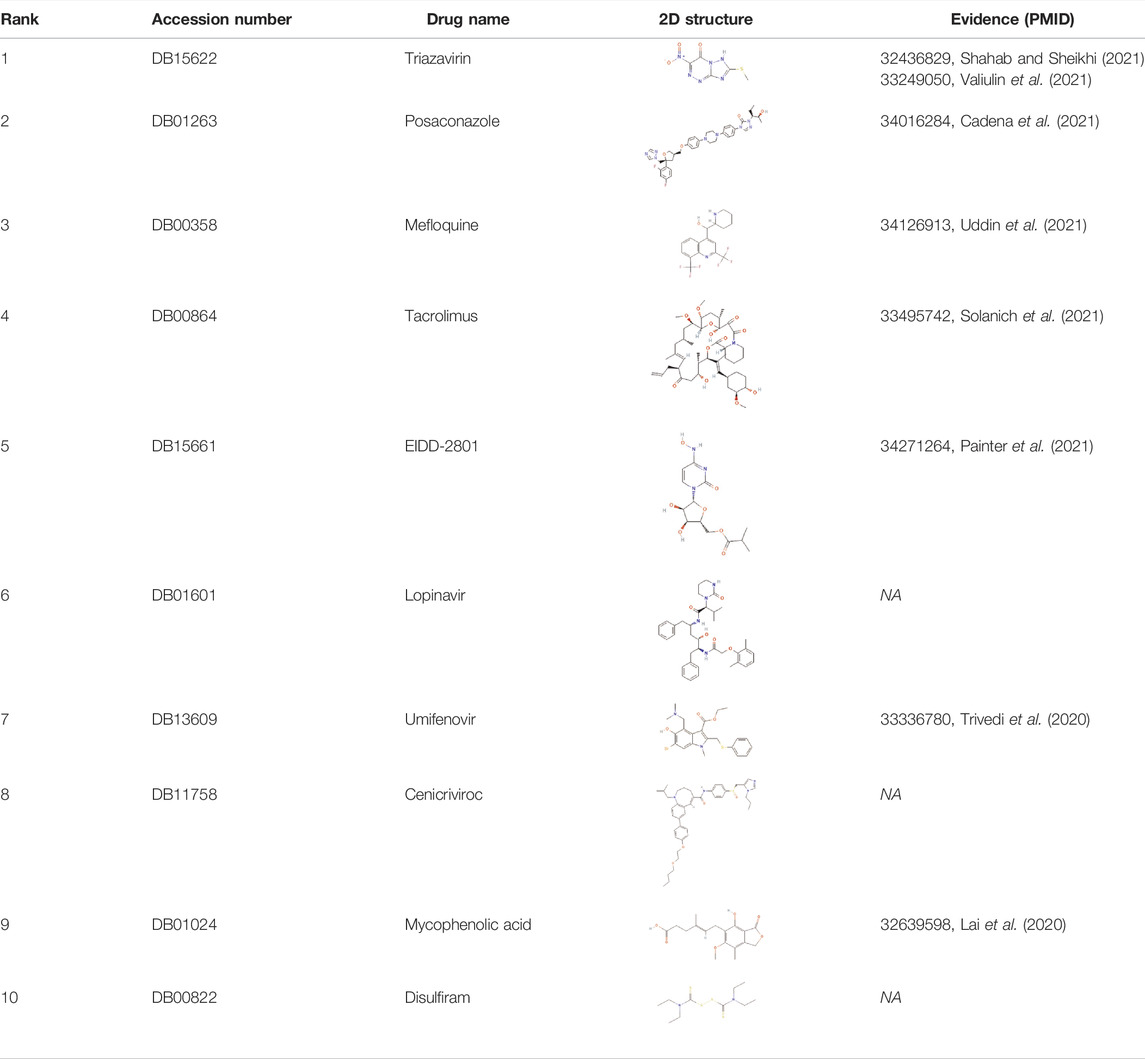
TABLE 6. Top 10 possible anti-COVID-19 drugs predicted by the DRGCC.
In addition, we also analyzed the docking state of unverifiable drugs and receptors. Angiotensin-converting enzyme 2 (ACE2) was considered an important functional receptor for SARS and other coronaviruses (Li et al., 2003). Like SARS-CoV, SARS-CoV-2 infects human respiratory epithelial cells through invasion mediated by human cell surface s-protein and ACE2 protein receptors. Obstructing the combination of ACE2 and the virus has become one of the effective means to prevent the respiratory infection of the crown virus. The molecular docking technology allows us to clearly determine the binding sites and bond strengths between molecules (Meng et al., 2011). We examined the binding of 4 drug compounds triazavirin, posaconazole, lopinavir, and cenicriviroc to the receptor protein ACE2. As shown in Figure 6, triazavirin and ACE2 have 4 hydrogen bonds bound to amino acids ILE and ASP, respectively. Lopinavir has 2 hydrogen bonds bound to amino acid ARG in ACE2. Posaconazole and cenicriviroc also have binding sites to ACE2. It can be seen that only one of the 3 unreported drugs has not been corroborated. It can be seen that these drugs may provide some help in the treatment of COVID-19.
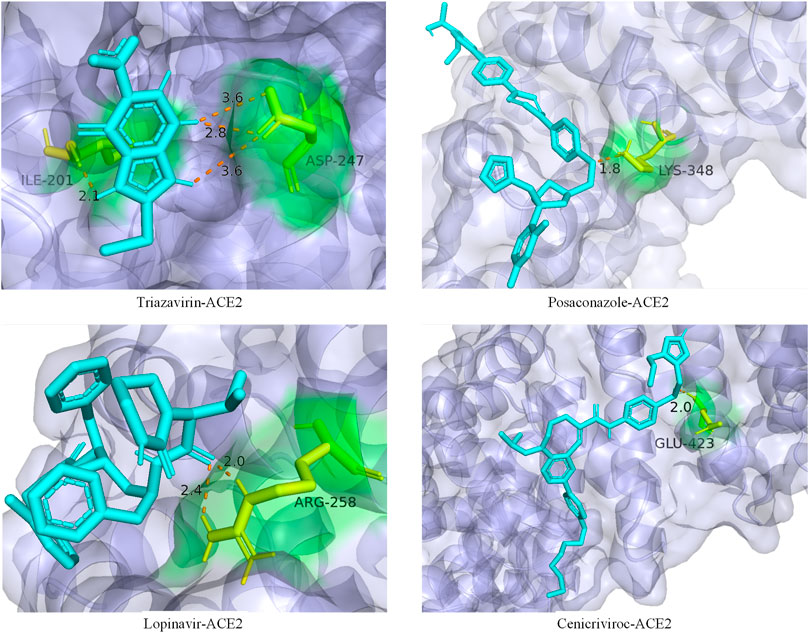
FIGURE 6. Ligand–protein binding mode between the predicted drugs and the protein receptor ACE2. The purple part is the protein ACE2, the blue part is the drug compound, the yellow part is the amino acid residue, and the orange dotted line is the connecting hydrogen bond. The numbers represent atomic distances.
Conclusion
In this article, we have proposed a drug repositioning method DRGCC to predict potential relationships between existing drugs and new diseases. The method first reconstructed the drug–drug interaction network, established the disease semantic similarity network, then extracted the structural features of drugs and disease symptoms as attribute features, and obtained network clustering features through matrix factorization. Finally, all features were fed to the GraphSAGE model to obtain predictions of drug–disease associations. With experiments testing on two datasets, it is found that our method has better performance than other competing methods. Experiments also demonstrated the importance of network clustering features for accurate prediction. At the same time, DRGCC is suitable for training and predicting large-scale samples and can add new nodes to the network after training, such as the SARS-CoV-2 virus. After analyzing the predicted repositioning drugs, we gave several possible drug treatment combinations and recommended several anti-COVID-19 drugs. These predictions have been supported or discussed by other studies. It can be seen that DRGCC has certain reliability in drug repositioning studies.
Data Availability Statement
Publicly available datasets were analyzed in this study. These data can be found here: http://ctdbase.org/; https://github.com/luckymengmeng/HDVD; https://go.drugbank.com/; https://pubchem.ncbi.nlm.nih.gov/.
Author Contributions
YZ and XL proposed the concept and idea; YZ implemented the algorithm and wrote the draft manuscript; F-XW provided the method improvement strategy; XL, F-XW, and YP evaluated the results and revised the manuscript; and YP and F-XW supervised the whole study. All authors read and approved the final manuscript.
Funding
This work was supported by the National Natural Science Foundation of China (61972451, 61902230); the Shenzhen Science and Technology Program (No. KQTD20200820113106007); the Fundamental Research Funds for the Central Universities, Shaanxi Normal University (2018TS079); and the program of China Scholarships Council (No. 202006870037).
Conflict of Interest
The authors declare that the research was conducted in the absence of any commercial or financial relationships that could be construed as a potential conflict of interest.
Publisher’s Note
All claims expressed in this article are solely those of the authors and do not necessarily represent those of their affiliated organizations, or those of the publisher, the editors, and the reviewers. Any product that may be evaluated in this article, or claim that may be made by its manufacturer, is not guaranteed or endorsed by the publisher.
References
Bader, G. D., and Hogue, C. W. (2003). An Automated Method for Finding Molecular Complexes in Large Protein Interaction Networks. BMC Bioinformatics 4, 2. doi:10.1186/1471-2105-4-2
Bader, S., Kühner, S., and Gavin, A. C. (2008). Interaction Networks for Systems Biology. FEBS Lett. 582, 1220–1224. doi:10.1016/j.febslet.2008.02.015
Booth, B., and Zemmel, R. (2004). Prospects for Productivity. Nat. Rev. Drug Discov. 3, 451–456. doi:10.1038/nrd1384
Cadena, J., Thompson, G. R., and Patterson, T. F. (2021). Aspergillosis: Epidemiology, Diagnosis, and Treatment. Infect. Dis. Clin. North. Am. 35, 415–434. doi:10.1016/j.idc.2021.03.008
Cai, L., Lu, C., Xu, J., Meng, Y., Wang, P., Fu, X., et al. (2021). Drug Repositioning Based on the Heterogeneous Information Fusion Graph Convolutional Network. Brief Bioinform 22, bbab319. doi:10.1093/bib/bbab319
Cheng, F., Lu, W., Liu, C., Fang, J., Hou, Y., Handy, D. E., et al. (2019). A Genome-wide Positioning Systems Network Algorithm for In Silico Drug Repurposing. Nat. Commun. 10, 3476. doi:10.1038/s41467-019-10744-6
Cleland, J. G., Ghosh, J., Freemantle, N., Kaye, G. C., Nasir, M., Clark, A. L., et al. (2004). Clinical Trials Update and Cumulative Meta-Analyses from the American College of Cardiology: WATCH, SCD-HeFT, DINAMIT, CASINO, INSPIRE, STRATUS-US, RIO-Lipids and Cardiac Resynchronisation Therapy in Heart Failure. Eur. J. Heart Fail. 6, 501–508. doi:10.1016/j.ejheart.2004.04.014
Cui, C., Ding, X., Wang, D., Chen, L., Xiao, F., Xu, T., et al. (2021). Drug Repurposing against Breast Cancer by Integrating Drug-Exposure Expression Profiles and Drug-Drug Links Based on Graph Neural Network. Bioinformatics 37, 2930–2937. doi:10.1093/bioinformatics/btab191
Davis, A. P., Grondin, C. J., Johnson, R. J., Sciaky, D., Wiegers, J., Wiegers, T. C., et al. (2021). Comparative Toxicogenomics Database (CTD): Update 2021. Nucleic Acids Res. 49, D1138–D1143. doi:10.1093/nar/gkaa891
Deerwester, S., Dumais, S. T., Furnas, G. W., Landauer, T. K., and Harshman, R. (1990). Indexing by Latent Semantic Analysis. J. Am. Soc. Inf. Sci. 41, 391–407. doi:10.1002/(sici)1097-4571(199009)41:6<391::aid-asi1>3.0.co;2-9
Defferrard, M., Bresson, X., and Vandergheynst, P. (2016). “Convolutional Neural Networks on Graphs with Fast Localized Spectral Filtering,” in 30th Conference on Neural Information Processing Systems, Barcelona, Spain. NY, United States: Curran Associates Inc., 3844–3852.
Dudley, J. T., Deshpande, T., and Butte, A. J. (2011). Exploiting Drug-Disease Relationships for Computational Drug Repositioning. Brief Bioinform 12, 303–311. doi:10.1093/bib/bbr013
Fiscon, G., Conte, F., Farina, L., and Paci, P. (2021). SAveRUNNER: A Network-Based Algorithm for Drug Repurposing and its Application to COVID-19. Plos Comput. Biol. 17, e1008686. doi:10.1371/journal.pcbi.1008686
Gross, P. (2008). Treatment of Hyponatremia. Intern. Med. 47, 885–891. doi:10.2169/internalmedicine.47.0918
Groza, V., Udrescu, M., Bozdog, A., and Udrescu, L. (2021). Drug Repurposing Using Modularity Clustering in Drug-Drug Similarity Networks Based on Drug-Gene Interactions. Pharmaceutics 13, 2117. doi:10.3390/pharmaceutics13122117
Guan, N. N., Zhao, Y., Wang, C. C., Li, J. Q., Chen, X., and Piao, X. (2019). Anticancer Drug Response Prediction in Cell Lines Using Weighted Graph Regularized Matrix Factorization. Mol. Ther. Nucleic Acids 17, 164–174. doi:10.1016/j.omtn.2019.05.017
Hahn, M., and Roll, S. C. (2021). The Influence of Pharmacogenetics on the Clinical Relevance of Pharmacokinetic Drug-Drug Interactions: Drug-Gene, Drug-Gene-Gene and Drug-Drug-Gene Interactions. Pharmaceuticals (Basel) 14, 187. doi:10.3390/ph14050487
Hamilton, W. L., Ying, R., and Leskovec, J. (2017). “Inductive Representation Learning on Large Graphs,” in Proceedings of the 31st International Conference on Neural Information Processing Systems (Long Beach, California, USA: Curran Associates Inc.).
Huang, F., Qiu, Y., Li, Q., Liu, S., and Ni, F. (2020). Predicting Drug-Disease Associations via Multi-Task Learning Based on Collective Matrix Factorization. Front. Bioeng. Biotechnol. 8, 218. doi:10.3389/fbioe.2020.00218
Kim, S., Chen, J., Cheng, T., Gindulyte, A., He, J., He, S., et al. (2021). PubChem in 2021: New Data Content and Improved Web Interfaces. Nucleic Acids Res. 49, D1388–D1395. doi:10.1093/nar/gkaa971
Lai, Q., Spoletini, G., Bianco, G., Graceffa, D., Agnes, S., Rossi, M., et al. (2020). SARS-CoV2 and Immunosuppression: A Double-Edged Sword. Transpl. Infect. Dis. 22, e13404. doi:10.1111/tid.13404
Lauritsen, K., Laursen, L. S., and Rask-Madsen, J. (1990). Clinical Pharmacokinetics of Drugs Used in the Treatment of Gastrointestinal Diseases (Part I). Clin. Pharmacokinet. 19, 11–31. doi:10.2165/00003088-199019010-00002
Lei, X.-J., Bian, C., and Pan, Y. (2021). Predicting CircRNA-Disease Associations Based on Improved Weighted Biased Meta-Structure. J. Comput. Sci. Technol. 36, 288–298. doi:10.1007/s11390-021-0798-x
Li, J., Zhang, S., Liu, T., Ning, C., Zhang, Z., and Zhou, W. (2020). Neural Inductive Matrix Completion with Graph Convolutional Networks for miRNA-Disease Association Prediction. Bioinformatics 36, 2538–2546. doi:10.1093/bioinformatics/btz965
Li, J., Zhang, S., Wan, Y., Zhao, Y., Shi, J., Zhou, Y., et al. (2019). MISIM v2.0: a Web Server for Inferring microRNA Functional Similarity Based on microRNA-Disease Associations. Nucleic Acids Res. 47, W536–W541. doi:10.1093/nar/gkz328
Li, W., Moore, M. J., Vasilieva, N., Sui, J., Wong, S. K., Berne, M. A., et al. (2003). Angiotensin-converting Enzyme 2 Is a Functional Receptor for the SARS Coronavirus. Nature 426, 450–454. doi:10.1038/nature02145
Li, Y., Wang, K., and Wang, G. (2021). Evaluating Disease Similarity Based on Gene Network Reconstruction and Representation. Bioinformatics 37, 3579–3587. doi:10.1093/bioinformatics/btab252
Li, Z., Huang, Q., Chen, X., Wang, Y., Li, J., Xie, Y., et al. (2019). Identification of Drug-Disease Associations Using Information of Molecular Structures and Clinical Symptoms via Deep Convolutional Neural Network. Front. Chem. 7, 924. doi:10.3389/fchem.2019.00924
Lu, L., and Yu, H. (2018). DR2DI: a Powerful Computational Tool for Predicting Novel Drug-Disease Associations. J. Comput. Aided Mol. Des. 32, 633–642. doi:10.1007/s10822-018-0117-y
Luo, H., Li, M., Wang, S., Liu, Q., Li, Y., and Wang, J. (2018). Computational Drug Repositioning Using Low-Rank Matrix Approximation and Randomized Algorithms. Bioinformatics 34, 1904–1912. doi:10.1093/bioinformatics/bty013
Luo, H., Wang, J., Li, M., Luo, J., Peng, X., Wu, F. X., et al. (2016). Drug Repositioning Based on Comprehensive Similarity Measures and Bi-random Walk Algorithm. Bioinformatics 32, 2664–2671. doi:10.1093/bioinformatics/btw228
Madhukar, N. S., Khade, P. K., Huang, L., Gayvert, K., Galletti, G., Stogniew, M., et al. (2019). A Bayesian Machine Learning Approach for Drug Target Identification Using Diverse Data Types. Nat. Commun. 10, 5221. doi:10.1038/s41467-019-12928-6
Meng, X. Y., Zhang, H. X., Mezei, M., and Cui, M. (2011). Molecular Docking: a Powerful Approach for Structure-Based Drug Discovery. Curr. Comput. Aided Drug Des. 7, 146–157. doi:10.2174/157340911795677602
Meng, Y., Jin, M., Tang, X., and Xu, J. (2021). Drug Repositioning Based on Similarity Constrained Probabilistic Matrix Factorization: COVID-19 as a Case Study. Appl. Soft Comput. 103, 107135. doi:10.1016/j.asoc.2021.107135
Ni, P., Wang, J., Zhong, P., Li, Y., Wu, F. X., and Pan, Y. (2020). Constructing Disease Similarity Networks Based on Disease Module Theory. Ieee/acm Trans. Comput. Biol. Bioinform 17, 906–915. doi:10.1109/TCBB.2018.2817624
Painter, G. R., Natchus, M. G., Cohen, O., Holman, W., and Painter, W. P. (2021). Developing a Direct Acting, Orally Available Antiviral Agent in a Pandemic: the Evolution of Molnupiravir as a Potential Treatment for COVID-19. Curr. Opin. Virol. 50, 17–22. doi:10.1016/j.coviro.2021.06.003
Peyrani, P., and Ramirez, J. (2013). What Is the Association of Cardiovascular Events with Clinical Failure in Patients with Community-Acquired Pneumonia? Infect. Dis. Clin. North. Am. 27, 205–210. doi:10.1016/j.idc.2012.11.010
Schriml, L. M., Mitraka, E., Munro, J., Tauber, B., Schor, M., Nickle, L., et al. (2019). Human Disease Ontology 2018 Update: Classification, Content and Workflow Expansion. Nucleic Acids Res. 47, D955–D962. doi:10.1093/nar/gky1032
Shahab, S., and Sheikhi, M. (2021). Triazavirin - Potential Inhibitor for 2019-nCoV Coronavirus M Protease: A DFT Study. Curr. Mol. Med. 21, 645–654. doi:10.2174/1566524020666200521075848
Sladen, G. E. (1973). The Pathogenesis of Cholera and Some Wider Implications. Gut 14, 671–680. doi:10.1136/gut.14.8.671
Solanich, X., Antolí, A., Padullés, N., Fanlo-Maresma, M., Iriarte, A., Mitjavila, F., et al. (2021). Pragmatic, Open-Label, single-center, Randomized, Phase II Clinical Trial to Evaluate the Efficacy and Safety of Methylprednisolone Pulses and Tacrolimus in Patients with Severe Pneumonia Secondary to COVID-19: The TACROVID Trial Protocol. Contemp. Clin. Trials Commun. 21, 100716. doi:10.1016/j.conctc.2021.100716
Strating, J. R., Van Der Linden, L., Albulescu, L., Bigay, J., Arita, M., Delang, L., et al. (2015). Itraconazole Inhibits Enterovirus Replication by Targeting the Oxysterol-Binding Protein. Cell Rep 10, 600–615. doi:10.1016/j.celrep.2014.12.054
Swedish Council on Health Technology Assessment (2005). “SBU Systematic Review Summaries,” in Treatment of Anxiety Disorders: A Systematic Review (Stockholm: Swedish Council on Health Technology Assessment (SBU) Copyright).
Trivedi, N., Verma, A., and Kumar, D. (2020). Possible Treatment and Strategies for COVID-19: Review and Assessment. Eur. Rev. Med. Pharmacol. Sci. 24, 12593–12608. doi:10.26355/eurrev_202012_24057
Uddin, E., Islam, R., AshrafuzzamanBitu, N. A., Bitu, N. A., Hossain, M. S., Islam, A. N., et al. (2021). Potential Drugs for the Treatment of COVID-19: Synthesis, Brief History and Application. Curr. Drug Res. Rev. 13, 184–202. doi:10.2174/2589977513666210611155426
Valiulin, S. V., Onischuk, A. A., Dubtsov, S. N., Baklanov, A. M., An'kov, S. V., Plokhotnichenko, M. E., et al. (2021). Aerosol Inhalation Delivery of Triazavirin in Mice: Outlooks for Advanced Therapy against Novel Viral Infections. J. Pharm. Sci. 110, 1316–1322. doi:10.1016/j.xphs.2020.11.016
Varothai, S., and Bergfeld, W. F. (2014). Androgenetic Alopecia: An Evidence-Based Treatment Update. Am. J. Clin. Dermatol. 15, 217–230. doi:10.1007/s40257-014-0077-5
Wang, D., Wang, J., Lu, M., Song, F., and Cui, Q. (2010). Inferring the Human microRNA Functional Similarity and Functional Network Based on microRNA-Associated Diseases. Bioinformatics 26, 1644–1650. doi:10.1093/bioinformatics/btq241
Wang, Y., Lei, X., and Pan, Y. (2022). Predicting Microbe-Disease Association Based on Heterogeneous Network and Global Graph Feature Learning. Chin. J. Electro. 31, 1–9. doi:10.1049/cje.2020.00.212
Wang, Y. Y., Cui, C., Qi, L., Yan, H., and Zhao, X. M. (2019). DrPOCS: Drug Repositioning Based on Projection onto Convex Sets. Ieee/acm Trans. Comput. Biol. Bioinform 16, 154–162. doi:10.1109/TCBB.2018.2830384
Wishart, D. S., Feunang, Y. D., Guo, A. C., Lo, E. J., Marcu, A., Grant, J. R., et al. (2018). DrugBank 5.0: a Major Update to the DrugBank Database for 2018. Nucleic Acids Res. 46, D1074–D1082. doi:10.1093/nar/gkx1037
Wu, G., Liu, J., and Yue, X. (2019). Prediction of Drug-Disease Associations Based on Ensemble Meta Paths and Singular Value Decomposition. BMC Bioinformatics 20, 134. doi:10.1186/s12859-019-2644-5
Xie, M., Hwang, T., and Kuang, R. (2012). “Prioritizing Disease Genes by Bi-random Walk,” in Advances in Knowledge Discovery and Data Mining. Editors P.-N. Tan, S. Chawla, C. K. Ho, and J. Bailey (Kuala Lumpur, Malaysia: Springer Berlin Heidelberg), 292–303. doi:10.1007/978-3-642-30220-6_25
Xu, D., Ruan, C., Korpeoglu, E., Kumar, S., and Achan, K. (2020). “Inductive Representation Learning on Temporal Graphs,” in 2020 International Conference on Learning Representations, Barcelona, Spain. NY, United States: Curran Associates Inc., 1–17.
Yang, M., Luo, H., Li, Y., and Wang, J. (2019). Drug Repositioning Based on Bounded Nuclear Norm Regularization. Bioinformatics 35, i455–i463. doi:10.1093/bioinformatics/btz331
Yu, G. (2018). Using Meshes for MeSH Term Enrichment and Semantic Analyses. Bioinformatics 34, 3766–3767. doi:10.1093/bioinformatics/bty410
Yu, L., Huang, J., Ma, Z., Zhang, J., Zou, Y., and Gao, L. (2015). Inferring Drug-Disease Associations Based on Known Protein Complexes. BMC Med. Genomics 8, S2. doi:10.1186/1755-8794-8-S2-S2
Yu, L., Zhao, J., and Gao, L. (2018). Predicting Potential Drugs for Breast Cancer Based on miRNA and Tissue Specificity. Int. J. Biol. Sci. 14, 971–982. doi:10.7150/ijbs.23350
Yu, Z., Huang, F., Zhao, X., Xiao, W., and Zhang, W. (2020). Predicting Drug-Disease Associations through Layer Attention Graph Convolutional Network. Brief Bioinform 22 (4), bbaa243. doi:10.1093/bib/bbaa243
Zeng, X., Zhu, S., Liu, X., Zhou, Y., Nussinov, R., and Cheng, F. (2019). deepDR: a Network-Based Deep Learning Approach to In Silico Drug Repositioning. Bioinformatics 35, 5191–5198. doi:10.1093/bioinformatics/btz418
Zhang, W., Xu, H., Li, X., Gao, Q., and Wang, L. (2020). DRIMC: an Improved Drug Repositioning Approach Using Bayesian Inductive Matrix Completion. Bioinformatics 36, 2839–2847. doi:10.1093/bioinformatics/btaa062
Zhang, Y., Lei, X., Fang, Z., and Pan, Y. (2020). CircRNA-disease Associations Prediction Based on Metapath2vec++ and Matrix Factorization. Big Data Min. Anal. 3, 280–291. doi:10.26599/bdma.2020.9020025
Zhou, R., Lu, Z., Luo, H., Xiang, J., Zeng, M., and Li, M. (2020). NEDD: a Network Embedding Based Method for Predicting Drug-Disease Associations. BMC Bioinformatics 21, 387. doi:10.1186/s12859-020-03682-4
Zhou, X., Menche, J., Barabási, A. L., and Sharma, A. (2014). Human Symptoms-Disease Network. Nat. Commun. 5, 4212. doi:10.1038/ncomms5212
Keywords: drug reposition, graph neural network, GraphSAGE, matrix factorization, clustering constraint, COVID-19
Citation: Zhang Y, Lei X, Pan Y and Wu F-X (2022) Drug Repositioning with GraphSAGE and Clustering Constraints Based on Drug and Disease Networks. Front. Pharmacol. 13:872785. doi: 10.3389/fphar.2022.872785
Received: 10 February 2022; Accepted: 11 April 2022;
Published: 10 May 2022.
Edited by:
Sajjad Gharaghani, University of Tehran, IranReviewed by:
Marcus Scotti, Federal University of Paraíba, BrazilFatemeh Zare-Mirakabad, Amirkabir University of Technology, Iran
Copyright © 2022 Zhang, Lei, Pan and Wu. This is an open-access article distributed under the terms of the Creative Commons Attribution License (CC BY). The use, distribution or reproduction in other forums is permitted, provided the original author(s) and the copyright owner(s) are credited and that the original publication in this journal is cited, in accordance with accepted academic practice. No use, distribution or reproduction is permitted which does not comply with these terms.
*Correspondence: Xiujuan Lei, eGpsZWlAc25udS5lZHUuY24=