 Qing Song1,2,3
 Aiyuan Zhou4
 Ling Lin1,2,3
 Xueshan Li1,2,3
 Wei Cheng1,2,3Cong Liu1,2,3
 Yating Peng1,2,3Yuqin Zeng1,2,3Rong Yi5Yi Liu5Xin Li6
 Yan Chen1,2,3Shan Cai1,2,3
 Ping Chen1,2,3*
- 1Department of Respiratory and Critical Care Medicine, The Second Xiangya Hospital, Central South University, Changsha, Hunan, China
- 2Research Unit of Respiratory Disease, Central South University, Changsha, Hunan, China
- 3Diagnosis and Treatment Center of Respiratory Disease, Central South University, Changsha, Hunan, China
- 4Center of Respiratory Medicine, Xiangya Hospital, Central South University, Changsha, Hunan, China
- 5Department of Pulmonary and Critical Care Medicine, Zhuzhou Central Hospital, Zhuzhou, Hunan, China
- 6Division 4 of Occupational Diseases, Hunan Prevention and Treatment Institute for Occupational Diseases, Changsha, Hunan, China
Background: This study aimed to analyze the clinical characteristics and treatment response of patients with chronic obstructive pulmonary disease (COPD) with low body mass index (BMI).
Methods: In this cross-sectional study, we enrolled patients with stable COPD from the database setup by the Second Xiangya Hospital of Central South University. We classified the patients into three groups based on BMI: low-BMI (<18.5 kg/m2), normal-BMI (≥18.5 and <24.0 kg/m2), and high-BMI (≥24 kg/m2) groups. We defined clinically important deterioration (CID) as a COPD Assessment Test (CAT) score increase of ≥2 and minimum clinically important difference (MCID) as a CAT score decrease of ≥2 during 6 months of follow-up. We recorded the number of exacerbations and mortality during 1 year of follow-up.
Results: A total of 910 COPD patients were included with 144 (15.8%) patients in low-BMI, 475 (52.2%) in normal-BMI, and 291 (32.0%) in high-BMI groups. Patients with low BMI had worse pulmonary function, higher symptom scores, and exacerbations in the past year compared with normal- and high-BMI groups (p < 0.05). Logistic regression analysis revealed that age, Global Initiative for Chronic Obstructive Lung Disease grades 3 and 4, and hospitalizations in the past year were independent risk factors for patients with low BMI (p < 0.05). After 1 year of follow-up, patients with low BMI had higher mortality and number of hospitalizations. Patients with low BMI were more likely to attain CID and less likely to attain MCID compared with patients with high BMI (p < 0.05). In addition, patients with low BMI treated with long-acting β2-agonist (LABA)+long-acting muscarinic antagonist (LAMA) and LABA+LAMA+inhaled corticosteroid (ICS) were more likely to attain MCID than those treated with LABA+ICS and LAMA (p < 0.05).
Conclusion: COPD patients with low BMI had worse pulmonary function, higher symptom scores, and higher risk of future hospitalizations and mortality and were less likely to attain MCID and more likely to attain CID. It is worth noting that patients with low BMI treated with LABA+LAMA and LABA+LAMA+ICS were more likely to attain MCID than those treated with LABA+ICS and LAMA.
Introduction
Chronic obstructive pulmonary disease (COPD) is the most common chronic respiratory disease. It has high morbidity and mortality and exerts huge burden on societies. COPD has become the third leading cause of death (GBD Chronic Respiratory Disease Collaborators, 2020). Thus, treatment and prevention are urgent.
Body mass index (BMI), calculated as the weight in kilograms divided by the square of the height in meters (kg/m2), is an important indicator to evaluate nutritional status. In fact, BMI plays an important role in the pathophysiology of COPD and is an independent prognostic factor for mortality and severity of COPD (Yang et al., 2010). Putcha et al. (2022) showed that COPD patients with low BMI (<20 kg/m2) had worse pulmonary function and higher risk of future severe exacerbation and mortality. In addition, low BMI (<20 kg/m2) is associated with higher risk of first acute COPD admission (Hunter et al., 2016). In fact, the BMI classification standard established by the World Health Organization is not completely suitable for the Chinese population. In China, BMI <18.5 kg/m2 is defined as underweight (Ran et al., 2007). A study from Taiwan demonstrated that overweight patients had a lower frequency of exacerbation in the past year compared with patients with normal BMI (18.5–23.9 kg/m2). However, patients with low BMI (<18.5 kg/m2) did not show a higher frequency of exacerbation compared with patients with normal BMI (Wei et al., 2017). Currently, the clinical characteristics and treatment response of COPD patients with low BMI have not been completely described in the Chinese population.
The Global Initiative for Chronic Obstructive Lung Disease (GOLD) documents recommend that the aim of COPD management is to reduce the symptoms and future risk of exacerbation and mortality. Currently, long-term medications including long-acting muscarinic antagonist (LAMA), long-acting β2-agonist (LABA)+inhaled corticosteroid (ICS), LABA+LAMA, and LABA+LAMA+ICS are the first choice for the treatment of patients with COPD (GOLD Executive Committee, 2023). However, it is unclear whether the treatment response differs among different inhalation therapies including LAMA, LABA+ICS, LABA+LAMA, and LABA+LAMA+ICS in COPD patients with low BMI.
Therefore, the purpose of this study was to analyze the clinical characteristics and treatment response of COPD patients with low BMI in the Chinese population and to explore the relationship between treatment response and different inhalation therapies in patients with low BMI.
Patients and methods
Study participants
This was a multicentric and cross-sectional study. All subjects were from the outpatient COPD database (Register number ChiCTR-POC-17010431) that includes the Second Xiangya Hospital of Central South University, Zhuzhou Central Hospital, the Hunan Prevention and Treatment Institute for Occupational Diseases, the First Attached Hospital of Shaoyang University, the Eighth Hospital in Changsha, and Longshan Hospital of Traditional Chinese Medicine (Hunan, China). The patients had been diagnosed with COPD between December 2016 and November 2021 according to the GOLD 2017 documents: the ratio of the forced expiratory volume in one second to forced vital capacity (FEV1/FVC) was <0.70 after inhaling a bronchodilator (Vogelmeier et al., 2017). Patients with asthma, lung cancer, pneumonia, bronchiectasis, tuberculosis, obstructive sleep apnea, diabetes, hormonal disorder, hypertension, and severe heart, liver, or kidney disease were excluded from this study.
This study was conducted in accordance with the Declaration of Helsinki and approved by the Ethics Committee of the Second Xiangya Hospital of Central South University (Hunan, China). All patients provided written informed consent.
Data collection
Data including age, sex, education level, BMI, smoke history, FEV1 %pred, FEV1/FVC, GOLD grades, GOLD groups, COPD Assessment Test (CAT) scores, modified Medical Research Council (mMRC) scores, exacerbations and hospitalizations in the past year, and inhalation therapy regimens were collected at the patients’ first visit. At 6 months of follow-up, the CAT scores were recorded. The number of exacerbations, hospitalizations, and deaths was recorded during 1 year of follow-up.
Study procedures
According to the BMI (weight in kilograms divided by the square of the height in meters) at their first visit, the patients were classified into three groups (Ran et al., 2007), namely, low-BMI (<18.5 kg/m2), normal-BMI (18.5–23.9 kg/m2), and high-BMI (≥24 kg/m2) groups. Then, the patients with low BMI were classified into the LAMA, LABA+ICS, LABA+LAMA, and LABA+LAMA+ICS subgroups based on the inhalation therapy they received at their first hospital visit.
Treatment assessment
The minimum clinically important difference (MCID) and clinically important deterioration (CID) response rates, future exacerbation, and mortality were used to evaluate the effectiveness of the therapy. CID was defined as a CAT score increase of ≥2, while MCID was defined as a CAT score decrease of ≥2 during 6 months of follow-up (Kon et al., 2014).
Variable definition
An exacerbation is COPD progression that requires antibiotics, oral corticosteroid, or hospitalization (Vogelmeier et al., 2017). According to the GOLD 2017 documents, patients with COPD assigned to group A show 0 to 1 exacerbation per year, no hospitalization, a CAT score of <10, and/or an mMRC score of 0–1. Group B shows 0–1 exacerbation per year, no hospitalization, a CAT score of ≥10, and/or an mMRC score of ≥2. Group C shows ≥2 exacerbations or ≥1 hospitalization per year, a CAT score of <10, and/or an mMRC score of 0–1. Group D shows ≥2 exacerbations or ≥1 hospitalization per year, a CAT score of ≥10, and/or an mMRC score of ≥2 (Vogelmeier et al., 2017). A current smoker has had a smoking exposure of ≥10 pack-years, while an ex-smoker has had an exposure of ≥10 pack-years but had not smoked for more than 6 months (Song et al., 2021).
Statistical analysis
SPSS Statistics Version 26.0 (IBM, Armonk, NY, USA) and Free Statistics software version 1.7.1 (Beijing, China) were used for statistical analysis of the data. Continuous variables are expressed as the mean ± standard deviation or median and interquartile range (IQR). Continuous variables with a normal distribution and homogeneity of variance were analyzed with the analysis of variance; otherwise, non-parametric tests were used. The chi-squared test or Fisher’s exact test was used to analyze categorical variables. Propensity score matching (PSM) was conducted by using package R 2.15.3 (http://www.R-project.org). Adjusted odds ratio (aOR) and adjusted 95% confidence interval (a95% CI) were calculated by using logistic regression. A value of p < 0.05 was considered to be statistically significant.
Results
Clinical characteristics of the patients
A total of 910 patients with COPD were enrolled in this study (Figure 1). The mean age was 64.7 ± 8.3 years, and the majority were male (86.8%). The patients were assigned to low-BMI (15.8%), normal-BMI (52.2%), and high-BMI (32.0%) groups (Table 1).

FIGURE 1. Flow chart. BMI, body mass index; COPD, chronic obstructive pulmonary disease; ICS, inhaled corticosteroid; LAMA, long-acting muscarinic antagonist; and LABA, long-acting β2-agonist.
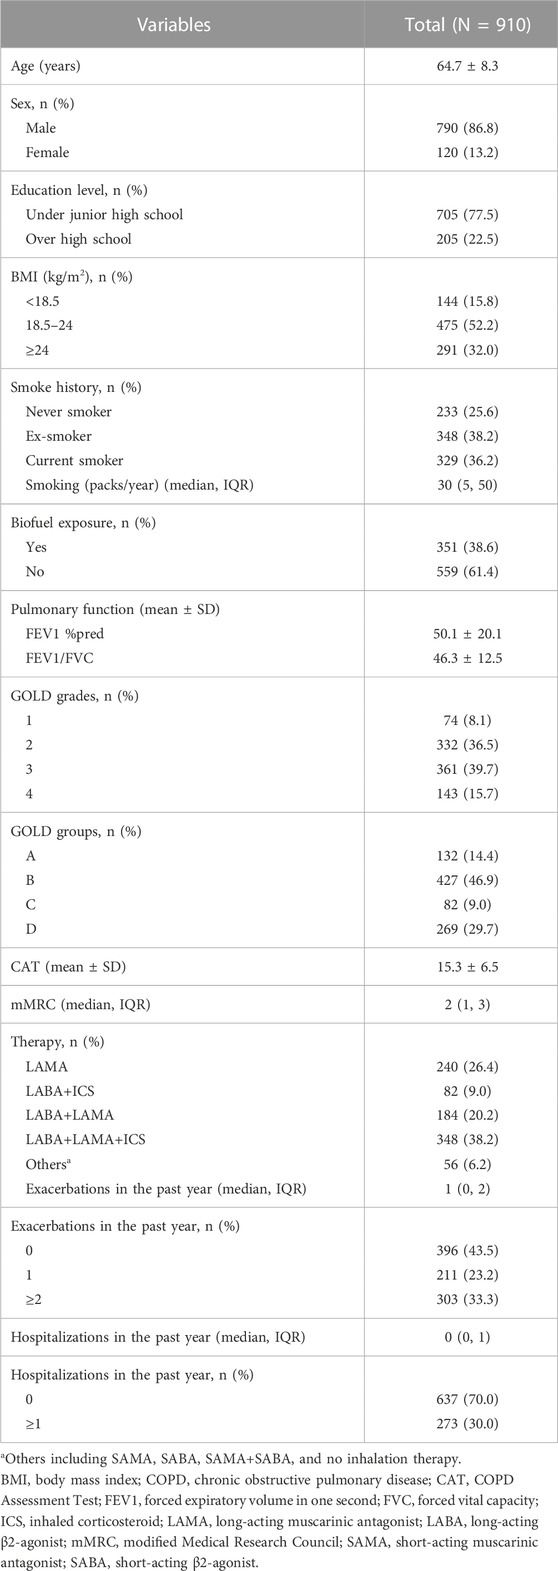
TABLE 1. Clinical characteristics of the COPD patients.
As shown in Table 2, the COPD patients with low BMI had lower FEV1 %pred and FEV1/FVC and higher CAT scores, mMRC scores, number of exacerbations and hospitalizations in the past year compared with patients with normal BMI and high BMI (p < 0.05). In addition, the low-BMI group had a higher proportion of patients in GOLD grade 4, group D, exacerbations in the past year (≥2 times per year), and hospitalizations in the past year (≥1 time per year) and a lower proportion of GOLD grades 1–2 (p < 0.05).
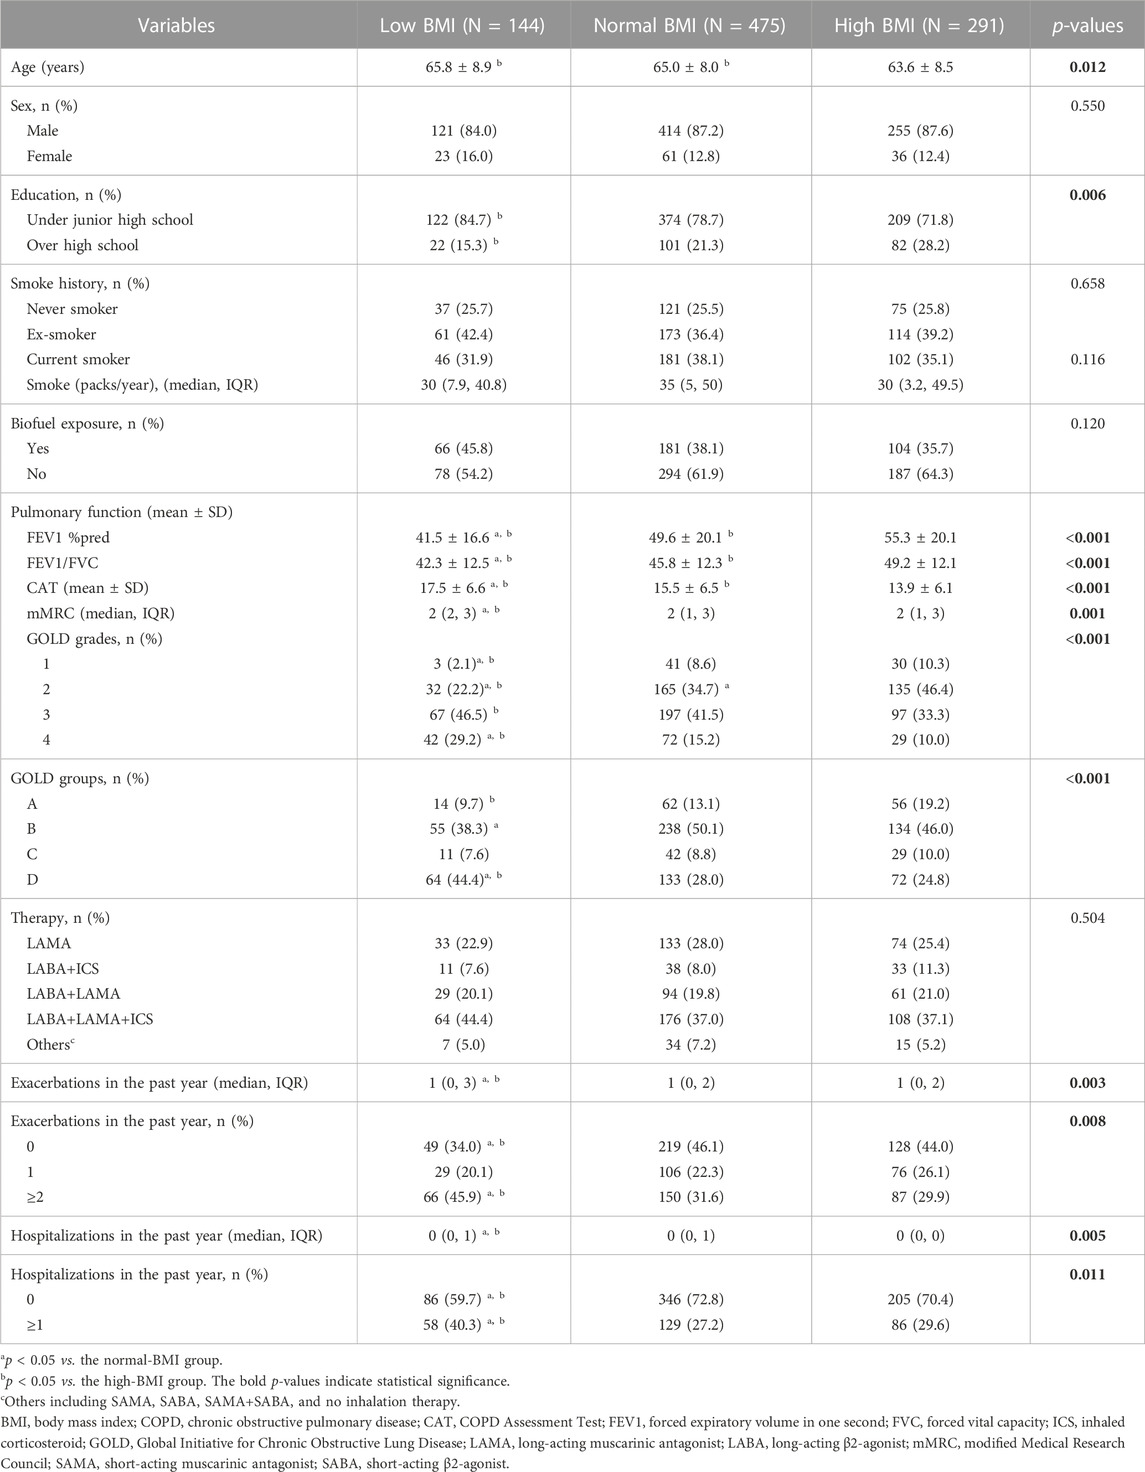
TABLE 2. Clinical characteristics in different BMI groups of COPD patients.
Factors correlated with low BMI in patients with COPD
The univariate analysis showed several relative factors for COPD patients with low BMI, including FEV1/FVC, CAT scores, mMRC scores, education level, GOLD grades, and exacerbations and hospitalizations in the past year.
After adjusting for FEV1/FVC, CAT scores, mMRC scores, and exacerbations in the past year, logistic regression revealed that age (aOR = 1.025, a95% CI = 1.000–1.050, and p = 0.046), hospitalizations in the past year (aOR = 1.117, a95% CI = 1.006–1.360, and p = 0.041), GOLD grades 3 (aOR = 7.006, a95% CI = 1.861–26.378, and p = 0.004), and GOLD grades 4 (aOR = 15.296, a95% CI = 3.496–66.933, and p < 0.001) were independent risk factors for COPD patients with low BMI (Table 3).
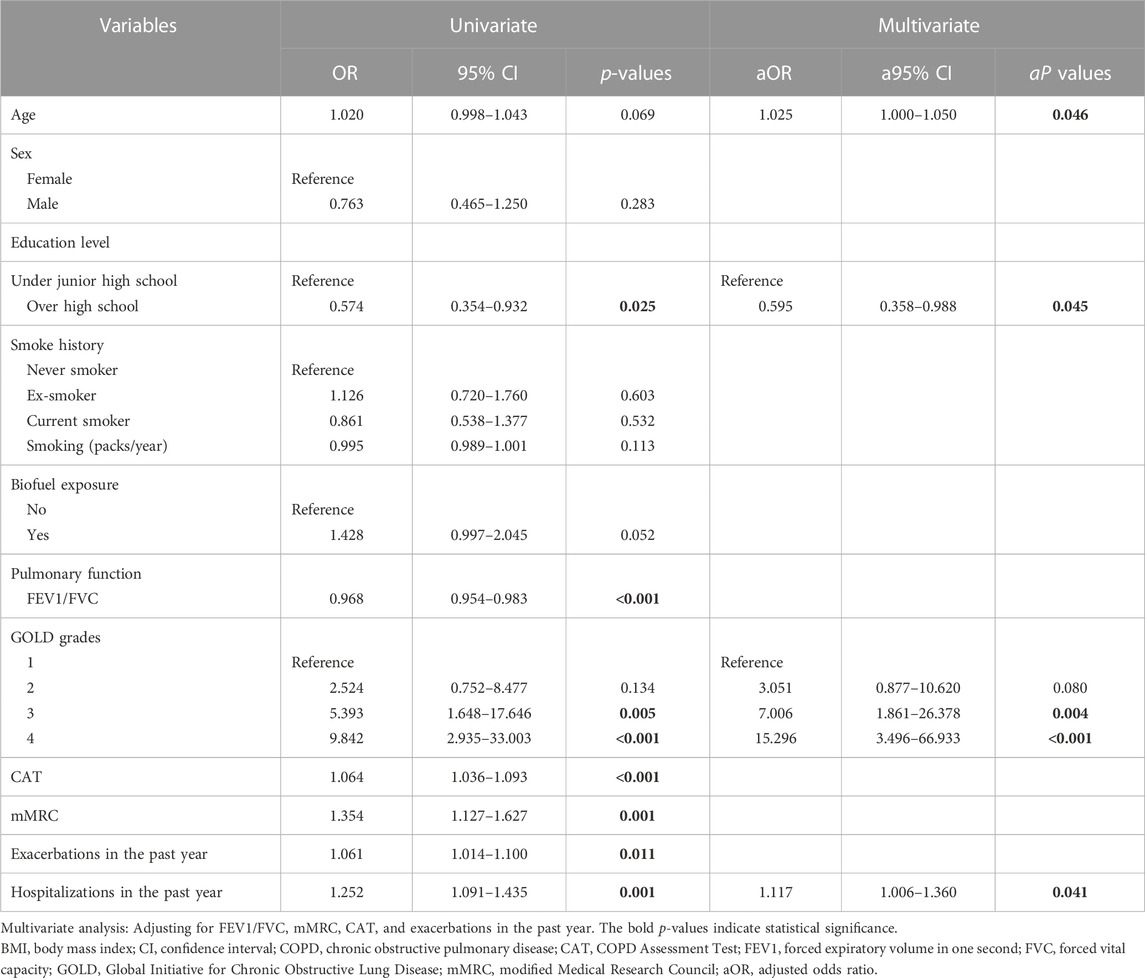
TABLE 3. Multivariate analysis of relative factors for low BMI in COPD patients.
Treatment response in different BMI groups after propensity score matching
After PSM, there were 96 (25.8%) patients in the low-BMI group, 183 (49.2%) patients in the normal-BMI group, and 93 (25.0%) patients in the high-BMI group. The baseline clinical characteristics showed no significant differences (Table 4).
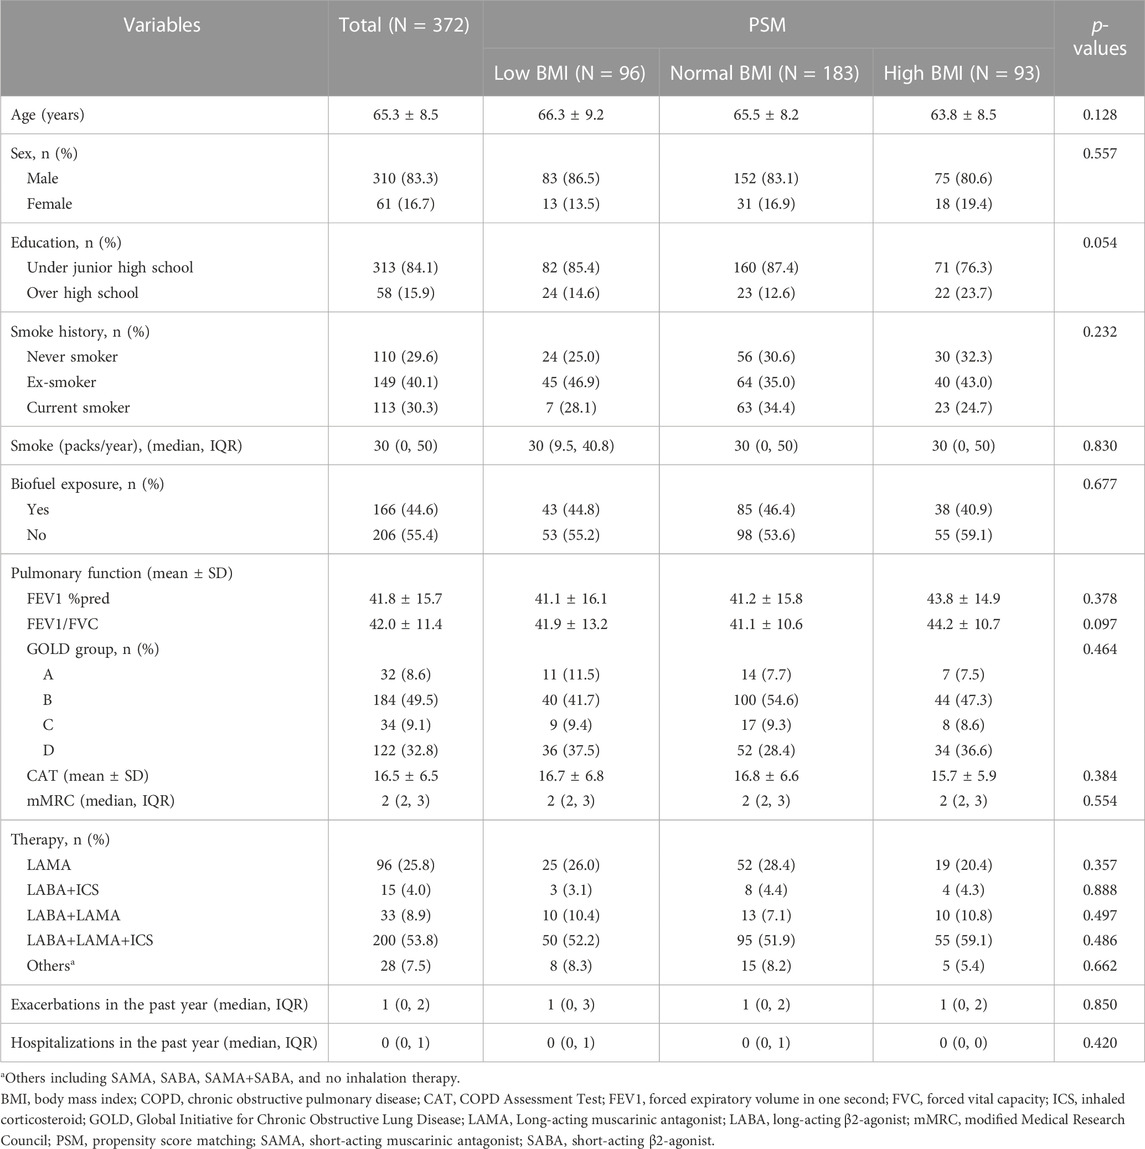
TABLE 4. Clinical characteristics in different BMI groups of COPD patients after propensity score matching (PSM).
As shown in Table 5, patients in the low-BMI group were less likely to attain MCID (53.9% vs. 69.6% and p < 0.05) and more likely to attain CID (27.0% vs. 12.0% and p < 0.05) compared with the high-BMI group. In addition, the future risk of hospitalizations and mortality in the low-BMI group was higher than in the normal- and high-BMI groups (p < 0.05).
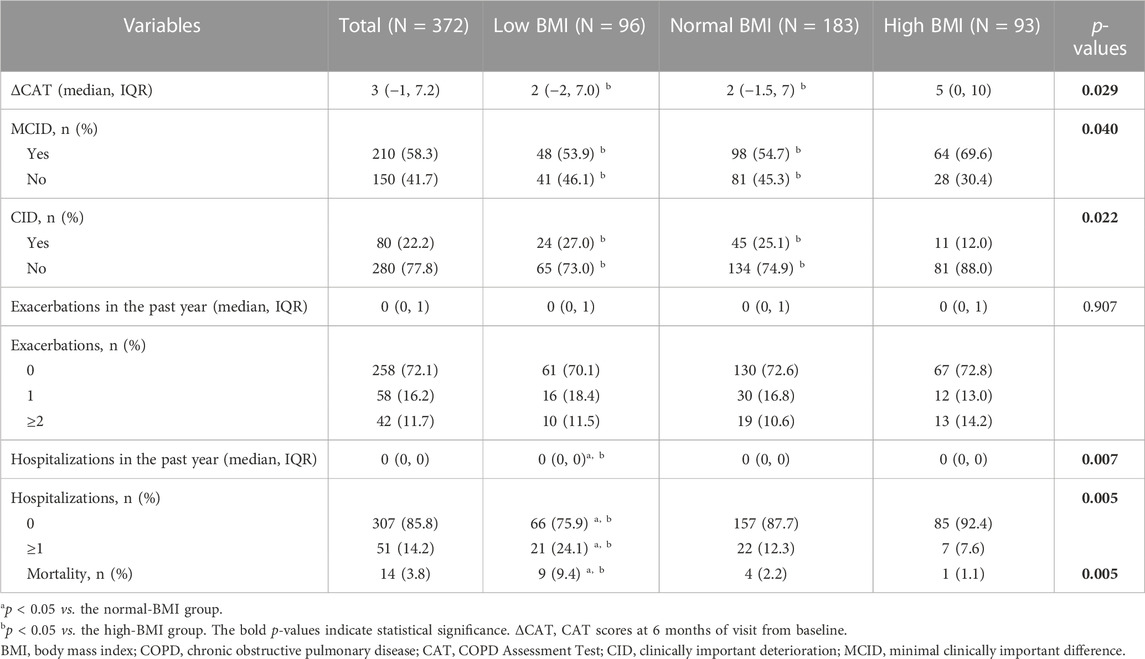
TABLE 5. Treatment response in different BMI groups of COPD patients after propensity score matching.
Treatment response among different inhalation therapies in patients with low BMI
Considering the poor treatment response of patients with low BMI, we further explored which inhalation drug would be better for patients with low BMI. A total of 137 patients with low BMI were classified into the LAMA (n = 33, 24.1%), LABA+ICS (n = 11, 8.0%), LABA+LAMA (n = 29, 21.2%), and LABA+LAMA+ICS (n = 64, 46.7%) subgroups after adjusting for sex, age, education level, smoke history, FEV1 %pred, CAT and mMRC scores, and exacerbations in the past year. Patients with low BMI treated with LABA+LAMA and LABA+LAMA+ICS were more likely to attain MCID than those treated with LAMA and LABA+ICS (p < 0.05). However, there were no significant differences in CID, future exacerbations, and mortality among the different inhalation therapies (Table 6; Table 7; Table 8).
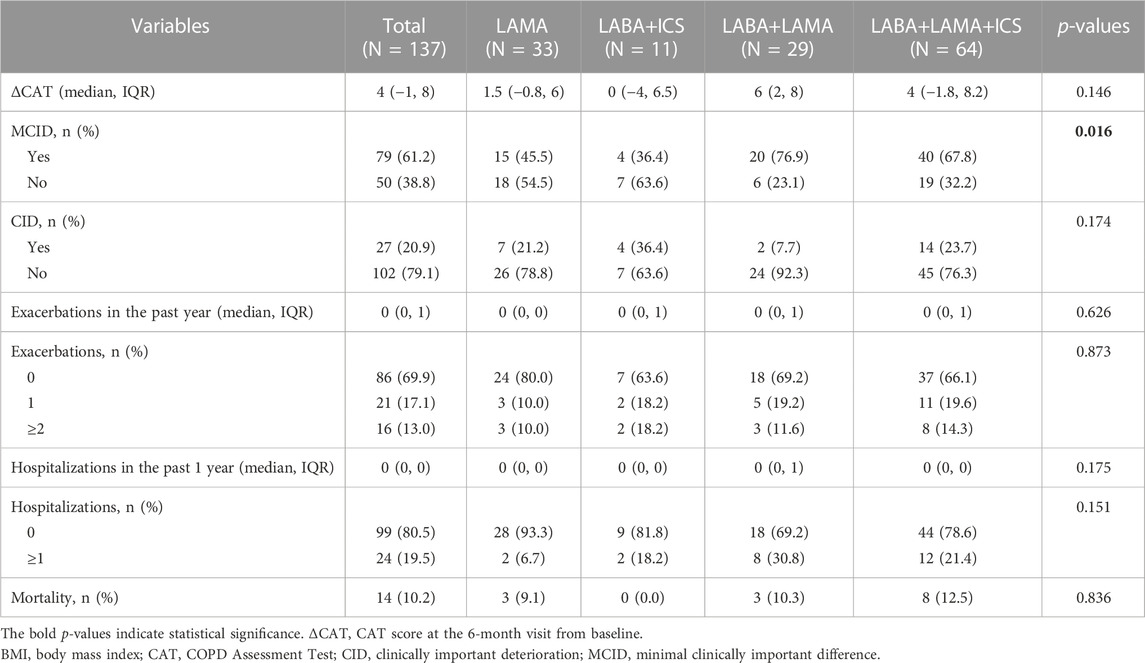
TABLE 6. Treatment response among different inhalation therapies in patients with low BMI.
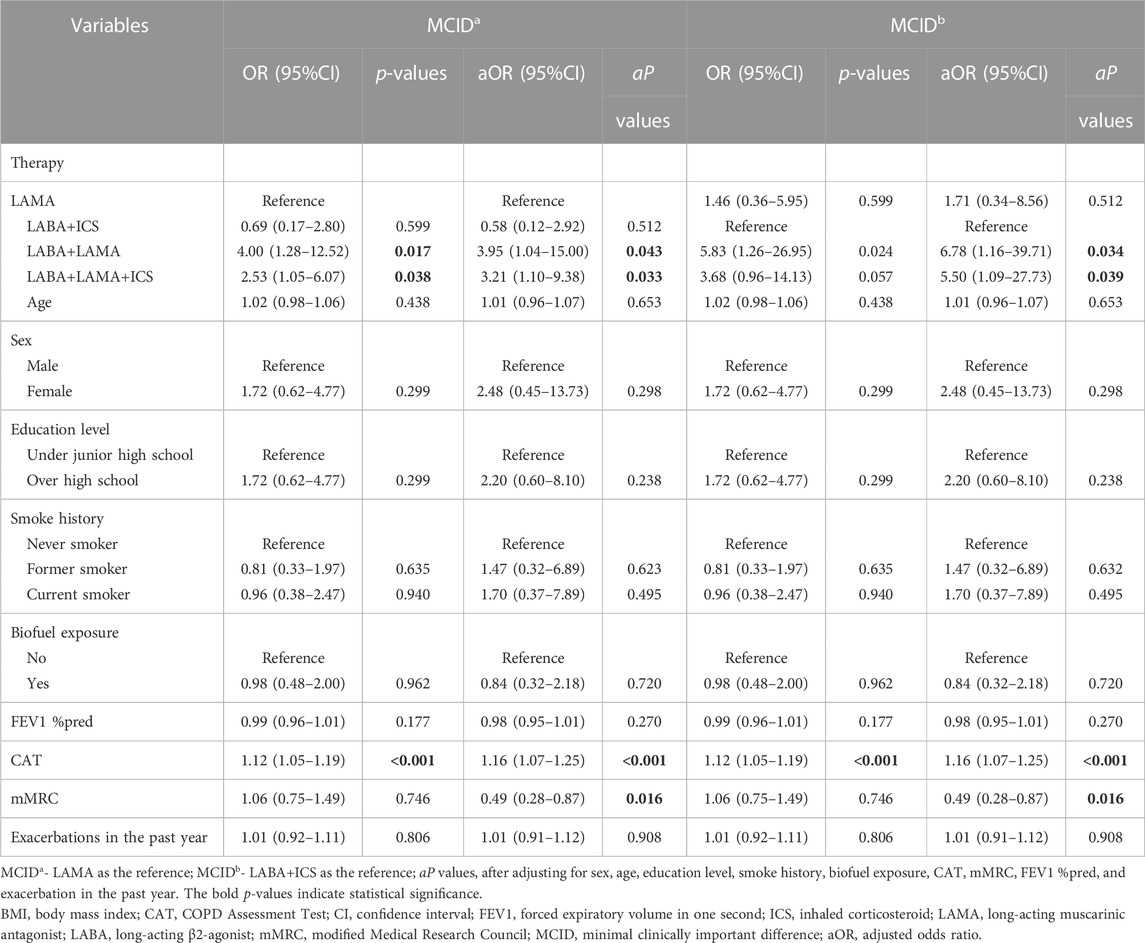
TABLE 7. Multivariate analysis for MCID in patients with low BMI.
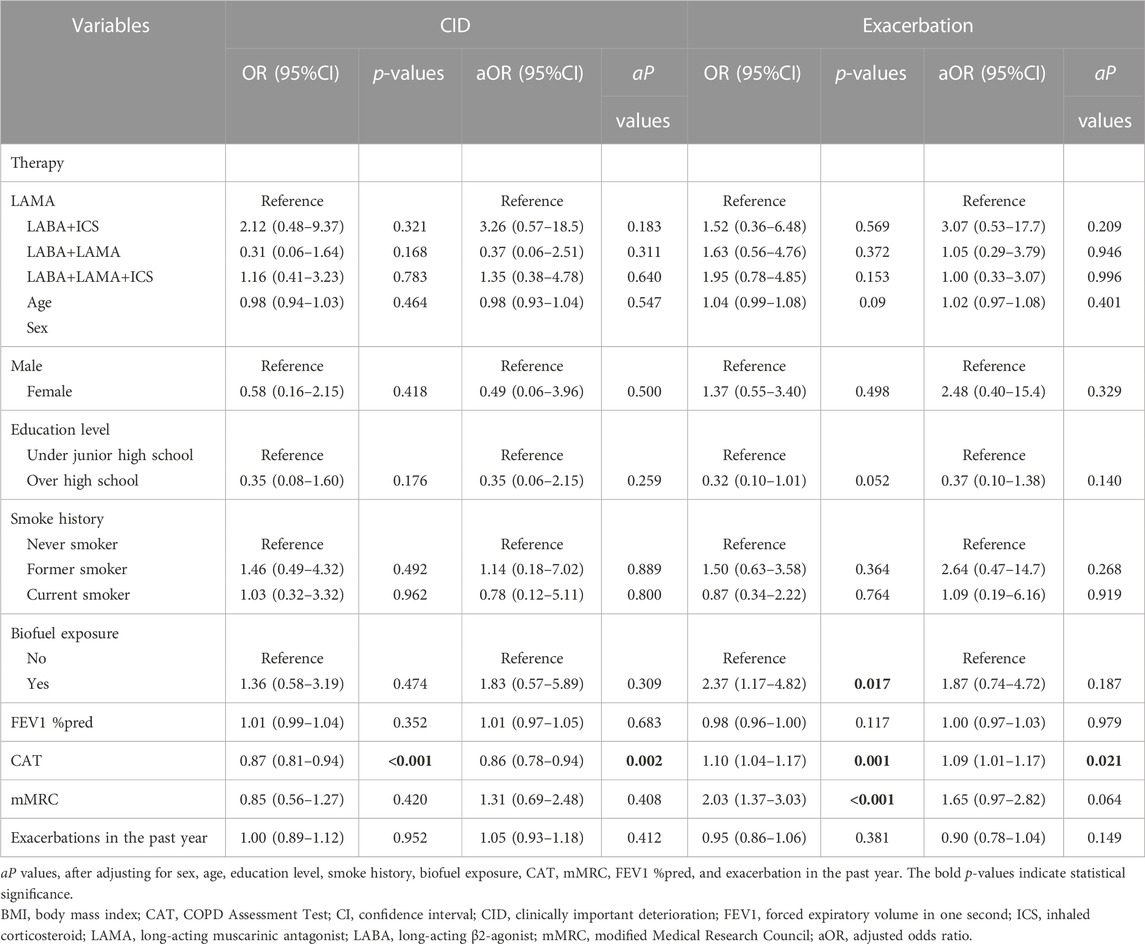
TABLE 8. Multivariate analysis for CID and future exacerbation in patients with low BMI.
Discussion
BMI is used as an indicator to assess the nutritional status of patients and is related to the prognosis of the diseases including COPD (Girón et al., 2009; Lainscak et al., 2011; Chen et al., 2018). Therefore, to prevent and treat COPD patients more effectively, it is necessary to explore the relationship between BMI and COPD. We found that the proportion of low-BMI patients accounted for 15.8%, which was higher than that in previous studies. This might be associated with the socioeconomic conditions in the previous year in China. In addition, Putcha et al. (2022) found that baseline FEV1 %pred and FEV1/FVC were lower in patients with low BMI. In the present study, we also found that patients with low BMI had worse pulmonary function. Unlike the study of Wei et al. (2017), in our study, patients with low BMI had higher number of exacerbations and hospitalizations in the past year. This difference might be because we excluded comorbidities including cardiovascular disease, hypertension, diabetes, and dyslipidemia from this study. Indeed, overweight has been linked to a better prognosis in patients with various chronic diseases, especially cardiovascular diseases, a phenomenon that has been termed the obesity paradox (Lavie et al., 2009). Furthermore, several independent risk factors for COPD patients with low BMI were identified including age, GOPD grades, and the number of hospitalizations in the past year.
Symptoms including cough, phlegm, chest tightness, dyspnea, and sleep impairment confer huge burdens to patients (Miravitlles and Ribera, 2017). In this study, CAT scores served as an indicator to assess whether the symptoms improved or deteriorated during the 6 months of follow-up. In fact, previous systematic reviews have confirmed the reliability and validity of CAT scores and have concluded that the tool is responsive to interventions. Furthermore, the correlation between CAT and St George’s Respiratory Questionnaire (SGRQ) scores is typically quite high, which has also been demonstrated (Gupta et al., 2014). Two or more patient-reported outcome measures such as CAT, SGRQ, and Evaluating Respiratory Symptoms are more suitable for randomized controlled trials. A single CAT score for assessing symptoms is more operable in real-world clinical practice and has been used in previous studies (Buhl et al., 2018; Cheng et al., 2021; Lin et al., 2023).
In addition, exacerbation and mortality are important events of deterioration in patients with COPD (Flattet et al., 2017; Dong et al., 2020). Reducing the symptoms and risk of exacerbation and mortality are the main goals in the treatment of COPD patients. In the present study, patients with low BMI had a higher future risk of hospitalizations and mortality during 1 year of follow-up. The CAT score is responsive to short-term changes in patients with COPD, including MCID and CID, indicating whether the symptoms have improved and deteriorated (Kon et al., 2014). Our study is the first to demonstrate that COPD patients with low BMI had a lower MCID response rate and a higher CID response rate compared with high-BMI patients. Overall, the patients with low BMI had worse treatment response.
Inhalation drugs are the main treatment used to reduce symptoms and risk of exacerbation and mortality and to improve the health status of patients with COPD. Currently, LAMA, LABA+LAMA, LABA+ICS, and LABA+LAMA+ICS are the most used treatment regimens (Nici et al., 2020; Song et al., 2021). We have previously found that patient with low BMI had a poor treatment response, but which inhalation drug would be better for low-BMI patients was uncertain. Our study is the first to show that patients with low BMI treated with LABA+LAMA and LABA+LAMA+ICS are more likely to attain MCID than those treated with LABA+ICS and LAMA. However, there were no significant differences in future exacerbations and mortality among different inhalation therapies in patients with low BMI. This finding is different from the ETHOS/KRONOS study (Ferguson et al., 2018; Singh et al., 2022), perhaps because our core focus was COPD patients with low BMI patients. Taken together, our findings indicate that it might be more appropriate to provide LABA+LAMA or LABA+LAMA+ICS as the initial inhalation therapy for COPD patients with low BMI.
This study has limitations. As recommended by the GOLD documents, non-pharmacological treatment including pulmonary rehabilitation, vaccination, and oxygen therapy is another method to reduce the symptoms and future risk of exacerbations for stable COPD patients and was not accounted for in this study. In fact, we have previously found that relatively few patients with COPD were receiving non-pharmacological treatment (Zeng et al., 2020). So, we do not believe that non-pharmacological treatment would have had a significant impact on the results of this study. In addition, this was a real-world and cross-sectional study. We included as many patients as possible who had completed the 1-year follow-up to obtain the data on exacerbation, mortality, and CAT scores. Therefore, we did not use power analysis to determine the sample size.
Conclusion
COPD patients with low BMI had worse pulmonary function and higher symptom scores and number of exacerbations in the past year. Several independent risk factors for patients with low BMI were identified including age, GOLD grades, and hospitalizations in the past year. In addition, patients with low BMI had a higher risk of future hospitalizations and mortality and were less likely to attain MCID and more likely to attain CID. It was worth noting that patients with low BMI treated with LABA+LAMA and LABA+LAMA+ICS were more likely to attain MCID than those treated with LABA+ICS and LAMA.
Data availability statement
The raw data supporting the conclusion of this article will be made available by the authors, without undue reservation.
Ethics statement
The studies involving human participants were reviewed and approved by the Second Xiangya Hospital of Central South University. The patients/participants provided their written informed consent to participate in this study.
Author contributions
All authors listed have made a substantial, direct, and intellectual contribution to the work and approved it for publication.
Funding
This work was supported by the National Natural Science Foundation of China (NSFC, Grants 81970044 and 82270045) and Xiangya Mingyi grant (2013).
Acknowledgments
The authors would like to thank the staff of the hospitals for their cooperation in collecting the study data.
Conflict of interest
The authors declare that the research was conducted in the absence of any commercial or financial relationships that could be construed as a potential conflict of interest.
Publisher’s note
All claims expressed in this article are solely those of the authors and do not necessarily represent those of their affiliated organizations, or those of the publisher, the editors, and the reviewers. Any product that may be evaluated in this article, or claim that may be made by its manufacturer, is not guaranteed or endorsed by the publisher.
Abbreviations
aOR, adjusted odds ratio; BMI, body mass index; COPD, chronic obstructive pulmonary disease; CAT, COPD Assessment Test; CID, clinically important deterioration; CI, confidence interval; FEV1, forced expiratory volume in one second; FVC, forced vital capacity; GOLD, Global Initiative for Chronic Obstructive Lung Disease; ICS, inhaled corticosteroid; IQR, interquartile range; LAMA, long-acting muscarinic antagonist; LABA, long-acting β2-agonist; mMRC, modified Medical Research Council; MCID, minimum clinically important difference; PSM, propensity score matching; and SGRQ, St George’s Respiratory Questionnaire.
References
Buhl, R., Criée, C. P., Kardos, P., Vogelmeier, C. F., Kostikas, K., Lossi, N. S., et al. (2018). Dual bronchodilation vs triple therapy in the "real-life" COPD DACCORD study. Int. J. Chron. Obstruct Pulmon Dis. 13, 2557–2568. doi:10.2147/COPD.S169958
Chen, R., Xing, L., You, C., and Ou, X. (2018). Prediction of prognosis in chronic obstructive pulmonary disease patients with respiratory failure: A comparison of three nutritional assessment methods. Eur. J. Intern Med. 57, 70–75. doi:10.1016/j.ejim.2018.06.006
Cheng, W., Duan, J., Zhou, A., Zhao, Y., Yi, R., Liu, Y., et al. (2021). Real-world effectiveness of inhalation therapy among patients with symptomatic COPD in China: A multicenter prospective study. Front. Pharmacol. 12, 53653. doi:10.3389/fphar.2021.753653
Dong, H., Hao, Y., Li, D., Su, Z., Li, W., Shi, B., et al. (2020). Risk factors for acute exacerbation of chronic obstructive pulmonary disease in industrial regions of China: A multicenter cross-sectional study. Int. J. Chron. Obstruct Pulmon Dis. 15, 2249–2256. doi:10.2147/COPD.S270729
Ferguson, G. T., Rabe, K. F., Martinez, F. J., Fabbri, L. M., Wang, C., Ichinose, M., et al. (2018). Triple therapy with budesonide/glycopyrrolate/formoterol fumarate with co-suspension delivery technology versus dual therapies in chronic obstructive pulmonary disease (KRONOS): A double-blind, parallel-group, multicentre, phase 3 randomised controlled trial. Lancet Respir. Med. 6 (10), 747–758. doi:10.1016/S2213-2600(18)30327-8
Flattet, Y., Garin, N., Serratrice, J., Perrier, A., Stirnemann, J., and Carballo, S. (2017). Determining prognosis in acute exacerbation of COPD. Int. J. Chron. Obstruct Pulmon Dis. 12, 467–475. doi:10.2147/COPD.S122382
GBD Chronic Respiratory Disease Collaborators (2020). Prevalence and attributable health burden of chronic respiratory diseases, 1990-2017: A systematic analysis for the global burden of disease study 2017. Lancet Respir. Med. 8 (6), 585–596. doi:10.1016/S2213-2600(20)30105-3
Girón, R., Matesanz, C., García-Río, F., de Santiago, E., Mancha, A., Rodríguez-Salvanés, F., et al. (2009). Nutritional state during COPD exacerbation: Clinical and prognostic implications. Ann. Nutr. Metab. 54 (1), 52–58. doi:10.1159/000205960
GOLD Executive Committee (2023). Global strategy for the diagnosis, management and prevention of chronic obstructive pulmonary disease (2023 REPORT). Available at: https://goldcopd.org/ (Accessed November 16, 2023).
Gupta, N., Pinto, L. M., Morogan, A., and Bourbeau, J. (2014). The COPD assessment test: A systematic review. Eur. Respir. J. 44 (4), 873–884. doi:10.1183/09031936.00025214
Hunter, L. C., Lee, R. J., Butcher, I., Weir, C. J., Fischbacher, C. M., McAllister, D., et al. (2016). Patient characteristics associated with risk of first hospital admission and readmission for acute exacerbation of chronic obstructive pulmonary disease (COPD) following primary care COPD diagnosis: A cohort study using linked electronic patient records. BMJ Open 6 (1), e009121. doi:10.1136/bmjopen-2015-009121
Kon, S. S., Canavan, J. L., Jones, S. E., Nolan, C. M., Clark, A. L., Dickson, M. J., et al. (2014). Minimum clinically important difference for the COPD assessment test: A prospective analysis. Lancet Respir. Med. 2 (3), 195–203. doi:10.1016/S2213-2600(14)70001-3
Lainscak, M., von Haehling, S., Doehner, W., Sarc, I., Jeric, T., Ziherl, K., et al. (2011). Body mass index and prognosis in patients hospitalized with acute exacerbation of chronic obstructive pulmonary disease. J. Cachexia Sarcopenia Muscle 2 (2), 81–86. doi:10.1007/s13539-011-0023-9
Lavie, C. J., Milani, R. V., and Ventura, H. O. (2009). Obesity and cardiovascular disease: Risk factor, paradox, and impact of weight loss. J. Am. Coll. Cardiol. 53 (21), 1925–1932. doi:10.1016/j.jacc.2008.12.068
Lin, L., Song, Q., Duan, J., Liu, C., Cheng, W., Zhou, A., et al. (2023). The impact of impaired sleep quality on symptom change and future exacerbation of chronic obstructive pulmonary disease. Respir. Res. 24 (1), 98. doi:10.1186/s12931-023-02405-6
Miravitlles, M., and Ribera, A. (2017). Understanding the impact of symptoms on the burden of COPD. Respir. Res. 18 (1), 67. doi:10.1186/s12931-017-0548-3
Nici, L., Mammen, M. J., Charbek, E., Alexander, P. E., Au, D. H., Boyd, C. M., et al. (2020). Pharmacologic management of chronic obstructive pulmonary disease. An official American thoracic society clinical practice guideline. Am. J. Respir. Crit. Care Med. 201 (9), e56–e69. doi:10.1164/rccm.202003-0625ST
Putcha, N., Anzueto, A. R., Calverley, P. M. A., Celli, B. R., Tashkin, D. P., Metzdorf, N., et al. (2022). Mortality and exacerbation risk by body mass index in patients with COPD in TIOSPIR and UPLIFT. Ann. Am. Thorac. Soc. 19 (2), 204–213. doi:10.1513/AnnalsATS.202006-722OC
Ran, P. X., Wang, C., Yao, W. Z., Chen, P., Kang, J., Huang, S. G., et al. (2007). A study on the correlation of body mass index with chronic obstructive pulmonary disease and quality of life. Zhonghua Jie He He Hu Xi Za Zhi 30 (1), 18–22. Chinese.
Singh, D., Rabe, K. F., Martinez, F. J., Krüll, M., Jenkins, M., Patel, M., et al. (2022). Relationship between prior inhaled corticosteroid use and benefits ofbudesonide/glycopyrronium/formoterol fumarate dihydrate on exacerbations, symptoms, health-related quality of life, and lung function in patients with chronic obstructive pulmonary disease: Analyses from the ETHOS study. Respir. Med. 197, 106857. doi:10.1016/j.rmed.2022.106857
Song, Q., Zhao, Y. Y., Zeng, Y. Q., Liu, C., Cheng, W., Deng, M. H., et al. (2021). The characteristics of airflow limitation and future exacerbations in different GOLD groups of COPD patients. Int. J. Chron. Obstruct Pulmon Dis. 16, 1401–1412. doi:10.2147/COPD.S309267
Vogelmeier, C. F., Criner, G. J., Martinez, F. J., Anzueto, A., Barnes, P. J., Bourbeau, J., et al. (2017). Global strategy for the diagnosis, management, and prevention of chronic obstructive lung disease 2017 report. GOLD executive summary. Am. J. Respir. Crit. Care Med. 195 (5), 557–582. doi:10.1164/rccm.201701-0218PP
Wei, Y. F., Tsai, Y. H., Wang, C. C., and Kuo, P. H. (2017). Impact of overweight and obesity on acute exacerbations of COPD - subgroup analysis of the Taiwan Obstructive Lung Disease cohort. Int. J. Chron. Obstruct Pulmon Dis. 12, 2723–2729. doi:10.2147/COPD.S138571
Yang, L., Zhou, M., Smith, M., Yang, G., Peto, R., Wang, J., et al. (2010). Body mass index and chronic obstructive pulmonary disease-related mortality: A nationally representative prospective study of 220,000 men in China. Int. J. Epidemiol. 39 (4), 1027–1036. doi:10.1093/ije/dyq051
Keywords: chronic obstructive pulmonary disease, body mass index, minimum clinically important difference, clinically important deterioration, exacerbation, mortality
Citation: Song Q, Zhou A, Lin L, Li X, Cheng W, Liu C, Peng Y, Zeng Y, Yi R, Liu Y, Li X, Chen Y, Cai S and Chen P (2023) The clinical characteristics and treatment response of patients with chronic obstructive pulmonary disease with low body mass index. Front. Pharmacol. 14:1131614. doi: 10.3389/fphar.2023.1131614
Received: 25 December 2022; Accepted: 03 July 2023;
Published: 13 July 2023.
Edited by:
Leonello Fuso, Catholic University of the Sacred Heart, ItalyReviewed by:
Giulia Scioscia, University of Foggia, ItalyRicha Singhal, University of Louisville, United States
Copyright © 2023 Song, Zhou, Lin, Li, Cheng, Liu, Peng, Zeng, Yi, Liu, Li, Chen, Cai and Chen. This is an open-access article distributed under the terms of the Creative Commons Attribution License (CC BY). The use, distribution or reproduction in other forums is permitted, provided the original author(s) and the copyright owner(s) are credited and that the original publication in this journal is cited, in accordance with accepted academic practice. No use, distribution or reproduction is permitted which does not comply with these terms.
*Correspondence: Ping Chen, cGluZ2NoZW4wNzMxQGNzdS5lZHUuY24=