 Longjie Xia
 Jiamin Lu
 Yixuan Qin1†
- 1Department of Cosmetology and Plastic Surgery Center, The People’s Hospital of Guangxi Zhuang Autonomous Region, Guangxi Academy of Medical Sciences, Nanning, China
- 2Department of General Surgery, Guangzhou First People’s Hospital, Guangzhou, China
- 3Department of Plastic Surgery, The First Affiliated Hospital of Sun Yat-Sen University, Guangzhou, China
- 4Department of Colorectal and Anal Surgery, The People’s Hospital of Guangxi Zhuang Autonomous Region, Guangxi Academy of Medical Sciences, Nanning, China
Objective: This study was aimed at exploring a specific open region of chromatin in the peripheral blood mononuclear cells (PBMCs) of patients with breast cancer and evaluating its feasibility as a biomarker for diagnosing and predicting breast cancer prognosis.
Methods: We obtained PBMCs from breast cancer patients and healthy people for the assay for transposase-accessible chromatin (ATAC) sequencing (n = 3) and obtained the GSE27562 chip sequencing data for secondary analyses. Through bioinformatics analysis, we mined the pattern changes for chromatin accessibility in the PBMCs of breast cancer patients.
Results: A total of 1,906 differentially accessible regions (DARs) and 1,632 differentially expressed genes (DEGs) were identified via ATAC sequencing. The upregulated DEGs in the disease group were mainly distributed in the cells, organelles, and cell-intima-related structures and were mainly responsible for biological functions such as cell nitrogen complex metabolism, macromolecular metabolism, and cell communication, in addition to functions such as nucleic acid binding, enzyme binding, hydrolase reaction, and transferase activity. Combined with microarray data analysis, the following set of nine DEGs showed intersection between the ATAC and microarray data: JUN, MSL2, CDC42, TRIB1, SERTAD3, RAB14, RHOB, RAB40B, and PRKDC. HOMER predicted and identified five transcription factors that could potentially bind to these peak sites, namely NFY, Sp 2, GFY, NRF, and ELK 1.
Conclusion: Chromatin accessibility analysis of the PBMCs from patients with early-stage breast cancer underscores its potential as a significant avenue for biomarker discovery in breast cancer diagnostics and treatment. By screening the transcription factors and DEGs related to breast cancer, this study provides a comprehensive theoretical foundation that is expected to guide future clinical applications and therapeutic developments.
1 Introduction
Breast cancer is the first among the major malignancies that threaten the lives of female patients. Early diagnosis and treatment are key to improving the prognosis of breast cancer, so an increasing number of tumor predictive markers are being widely studied and applied in clinical practice.
The detection of peripheral blood mononuclear cells (PBMCs) and chromatin transposase sequencing such as the high-throughput assay for transposase-accessible chromatin sequencing (ATAC-seq) can provide more sensitive and specific guidance in the diagnosis and treatment of cancer patients (Ding et al., 2020). PBMC testing can be used to detect and analyze circulating tumor cells (CTCs), which are highly relevant to breast-cancer-metastasis-related studies. CTCs are the means by which tumor cells spread to other parts of the body through the blood or lymphatic fluid and constitute one of the important links in breast cancer metastasis. CTC testing can help physicians and researchers detect metastasis risks early, thereby guiding individualized treatment; it can also be used to explore the heterogeneity of gene expressions between individual tumor cells, providing insights into the molecular mechanisms of tumor development (Ding et al., 2020). ATAC-seq technology can be combined with other methods, such as RNA chip data and ChIP-seq, to further explore the mechanisms of initiation and development of breast cancer (Wang et al., 2021).
In recent years, given the rapid development of multiple omics, researchers have attempted to understand the mechanisms of various organisms. Therefore, we also adopted the multi-omics method combined with ATAC-seq and RNA chip data to explore the gene expressions of PBMCs; we also investigated the relationships between chromatin accessibility from the level of transcriptomics and epigenetic omics to explore the molecular mechanism and genetic bases of early-stage breast cancer to enable prediction of the potential therapeutic targets of breast cancer.
2 Materials and methods
2.1 Acquisition of the specimens
The blood samples required for the study were obtained through the Breast Surgery Department of Guangzhou First People’s Hospital from three early-stage breast cancer patients and three healthy adult volunteers. This study was approved by the Ethics Committee of Guangzhou First People’s Hospital (approval no. K-2023-019-01). All clinical studies were conducted in accordance with the principles of the Declaration of Helsinki.
2.2 Acquisition, processing, and purification of PBMC specimens
Three women with early-stage breast cancer were selected as the experimental group, while three women without breast diseases were chosen as the control group. Blood samples were extracted from these subjects from the forearm; we obtained 5 mL of whole blood from each subject, which was placed in appropriate tubes (BD Vacutainer™) containing ethylenediamine tetraacetic acid, mixed for 8–10 times, and marked with the patient name and outpatient/hospital number before being stored at 4°C and transported to the laboratory for cell treatment within 2 h. During processing the tubes were centrifuged for 30 min at 2,500 rpm using a centrifuge with a swing bucket rotor. The plasma layer was removed, and the remaining sample was poured into a 15-mL conical tube. Next, 5 mL of frozen phosphate-buffered saline (PBS) containing 2% fetal calf serum (FBS) was added to a separate tube, capped, and mixed in an inverted position. The contents were then poured into the 15-mL conical tube and centrifuged at 1,200 rpm for 10 min at room temperature; the supernatant was then discarded for ATAC detection.
2.3 ATAC sequencing
The sample used for sequencing contained approximately 5
The raw data were obtained in the fastq format using fastp software (https://github.com/OpenGene/fastp); this procedure controls the raw data, including IP samples and input samples, and performs adaptor removal, repetitive sequence, and low quality sequences to yield clean data in the fastq format. Then, FastQC (https://github.com/s-andrews/FastQC) was applied to this clean data for quality control analysis. The clean reads data were then aligned with the reference genome using BWA software (version 0.7.17-r1188).
The data were further processed after comparing the bam files. The mitochondrial genome and duplicates were removed, where the duplicate refers to the sequence of reads to the genome at exactly the base and alignment with the reference genome. To avoid the impacts of these replications on subsequent analyses, we used Picard to remove the duplicates. Next, we used bedtools to remove the blacklist region. For reads on the positive strand, the starting position of alignment was +4, and for reads on the negative strand that are 5 bp to the left, the starting position of the alignment was -5 bp. We used the deeptools-alignmentSieve software (version: 3.5.1) to remove the offset reads, and HOMER was used to predict the motif sequences in the possible peak binding data.
2.4 GSE27562 chip data download and standardization
We downloaded the GSE27562 dataset from the NCBI gene expression omnibus (GEO) database (http://www.ncbi.nlm.nih.gov/geo) to obtain the chip data. This dataset mainly includes information from female patients diagnosed with breast cancer, patients with benign breast masses, patients with negative molybdenum targets, and patients after breast cancer surgery. We extracted the data of 57 female patients diagnosed with breast cancer and 31 patients without abnormalities as the control groups, including their Affymetrix cel and probe annotation files for the subsequent analyses. The platform used for the chip data is the GPL570 [HG-U133_Plus_2] Affymetrix Human Genome U133 Plus 2.0 Array (Affymetrix Company, United States).
After successfully downloading the data from BRAINARRAY and the GeneChip custom chip description file (CDF) from GENCODE, the data were background corrected and normalized using Affymetrix power tools software. Then, the gene-level probe set was mapped to the human GENCODE annotation (version 28) using a custom perl script. Only the RNA in the GENCODE database with probe-set annotation was retained as “PROTEIN-CODING,” while the other genes were filtered out. The rationality of line data normalization in the boxplot was assessed with log2PM. The differentially expressed genes (DEGs) were defined as genes with |log2FC| > 0.5 and adjusted p < 0.05. DEGs from the breast cancer and normal populations from the ATAC-seq and microarray reanalysis were retrieved for intersection analysis using the Venn diagram.
2.5 Data normalization and batch effect correction
To ensure comparability and reliability of our data analyses, we implemented robust normalization and batch effect correction. For the ATAC-seq data, we used the fragments per kilobase of transcripts per million mapped reads (FPKM) method to normalize the sequencing depth across samples, which mitigated the impacts of varying sequencing depths. The GSE27562 microarray data were processed for background correction, normalization, and probe-level signal summarization using the robust multiarray average (RMA) method. To address potential batch effects, we applied the “ComBat” method to the ATAC-seq data and used the “sva” R package for the GSE27562 data. These procedures effectively reduced the technical variability and enhanced the consistency and accuracy of the downstream analyses.
3 Results
3.1 Baseline and ATAC data quality inspections
We selected three women with early-stage breast cancer as the experimental group and three healthy adult women as the control group. The experimental group did not receive any treatment for early breast cancer, while the women in the control group had no breast masses until presentation (Table 1).
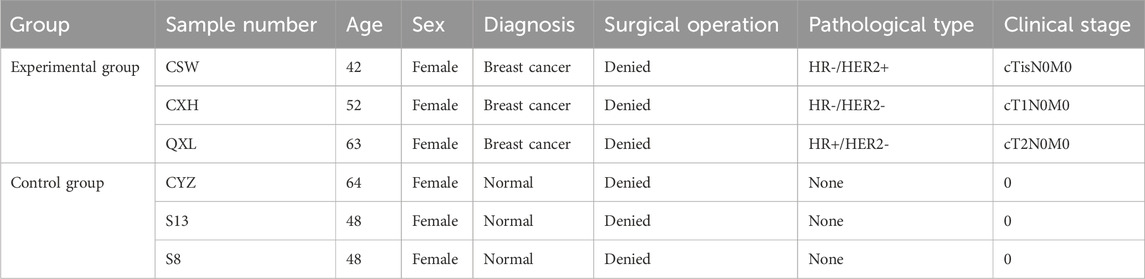
Table 1. Clinical patient information.
The ATAC-seq quality control results are presented in Table 2, for which we observed the accessible regions and found that all specimens had 99% match with the genome (Table 3).
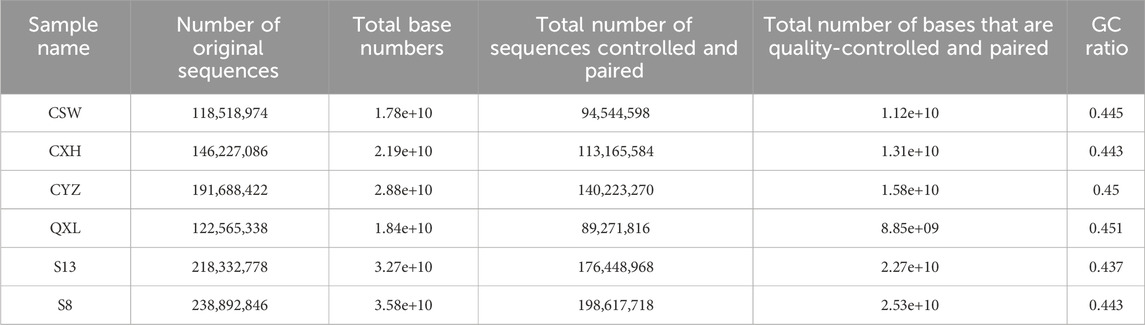
Table 2. ATAC quality controlled results.
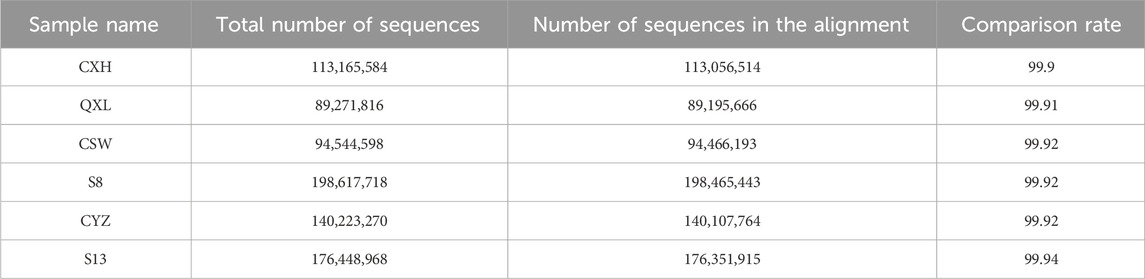
Table 3. Analysis of the sequence alignment results.
3.2 Analyses of association degree and accessible region data for breast cancer PBMC ATAC-seq samples
The correlations among the samples are shown in Figure 1A, and a total of 1,906 differentially accessible regions (DARs) and 1,632 DEGs were identified by ATAC-seq. From Figure 1B, it is seen that the DARs are mainly distributed in the promoter regions of the DEGs, followed by distal intergenic as well as other intronic regions. The ATAC-seq signals were enriched in the open chromatin regions and were positively correlated with the gene transcription activities. Heatmap analysis shows the enrichment distribution of the base sequence between the start positions (TSS) of the transcription factors (TFs) and the 3 kb upstream as well as downstream region of all genes: the signals of the two groups of cells are mostly located within ±3 kb. The overall trend of the control group is slightly higher than that of the experimental group. These results suggest intergroup differences, and the heatmaps of the distances between the DARs and transcription initiation regions of the samples are shown in Figure 1C.
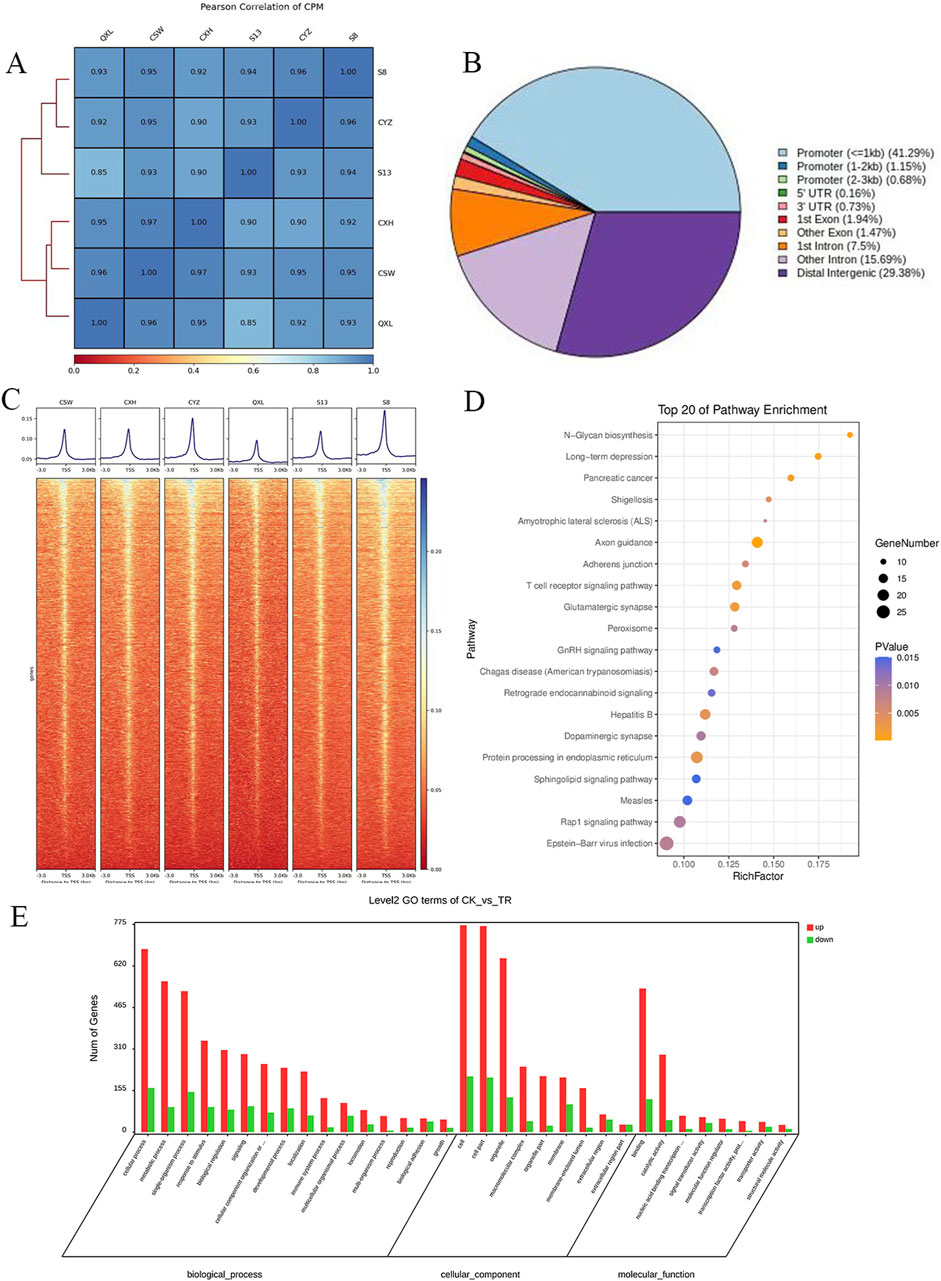
Figure 1. Analysis of the degree of correlation and accessible region data from ATAC-seq samples: (A) Pearson association analysis between the samples; (B) distribution of the accessible regions of the differential genes; (C) heatmap of the distance of the differentially accessible region (DAR) from the transcription start region (TSS) for each sample. (D) KEGG enrichment analysis of the top 20 pathways enriched by the differentially expressed genes (DEGs), where the dot sizes indicate the numbers of differential genes in each of the channels; the larger the dot size, the more are the number of genes. The colors indicate the p-values, where blue indicates p > 0.01, purple indicates p > 0.005 and p < 0.01, and yellow indicates p < 0.005. (E) Bar graph of the GO enrichment analysis of the DEGs, where red indicates that the DEG enriched subterms are upregulated in the disease group and green indicates the subterms that downregulate DEG enrichment in the disease group.
Based on the Kyoto encyclopedia of genes and genomes (KEGG) and gene ontology (GO) enrichment analyses of the DEGs corresponding to the DARs, the differential genes were found to be enriched for N-glycan biosynthesis, T receptor signaling, peroxisome, GnRH signaling pathway, protein processing in the endoplasmic reticulum, and other pathways (Figure 1D). In the GO enrichment analysis, the DEGs of the experimental group were mainly distributed in the cells, organelles, and cell-membrane-related structures and were mainly responsible for biological functions like cell nitrogen complex metabolism, macromolecular metabolism, and cell communication, in addition to other functions like nucleic acid binding, enzyme binding, hydrolase enzyme reaction, and transferase activity (Figure 1E).
3.3 GEO online database for breast cancer PBMC microarray analysis
We searched the GEO database for chip data related to the PBMCs of breast cancer and finally selected the GSE27562 dataset, which mainly includes information from female patients diagnosed with breast cancer, patients with benign breast masses, patients with negative molybdenum targets, and patients after breast cancer surgery. We extracted the population data for 57 female patients with breast cancers and 31 mammography cases for secondary analyses (Figure 2A). By setting |Log2FC| > 0.5 and p < 0.05 in these data, we found that 86 genes were upregulated and 55 genes were downregulated in the PBMCs of the experimental group. The GO and KEGG enrichment analyses of the DEGs revealed that the upregulated genes were primarily clustered in the GO hematopoiesis as well as hemoglobin-related subterms. The KEGG analysis showed that the upregulated genes were mainly enriched for MAPK signaling, TNF signaling, IL-17 post-absorption, GnRH signaling, and NOD-like receptor signaling (Figure 2E; Table 4), while the downregulated genes were mainly enriched for hematopoietic cell lines, cytokine receptors and their interactions with cellular proteins, sulfur metabolism, nitrogen metabolism, and protein outputs (Table 5).
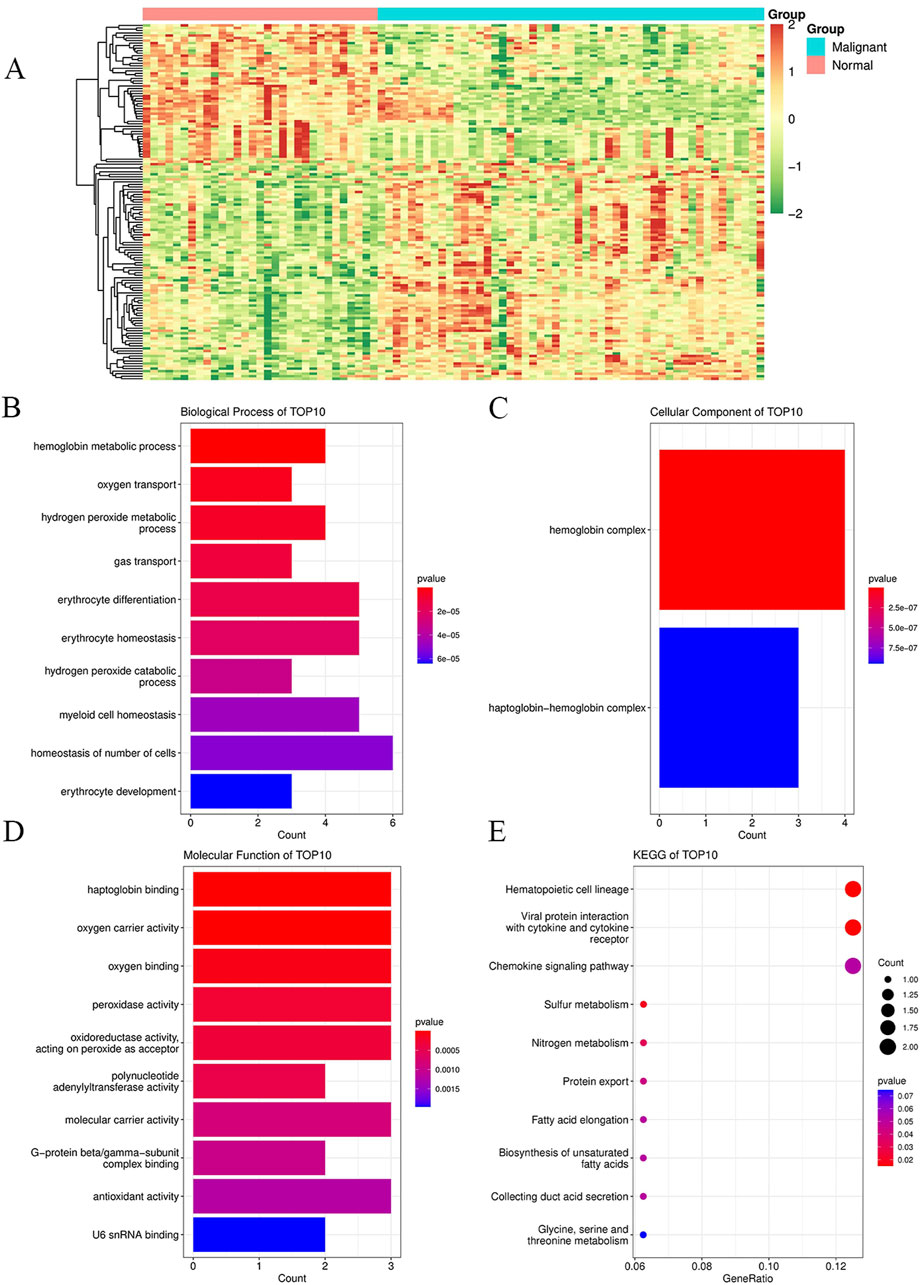
Figure 2. Enrichment analyses of DEGs and their functions in peripheral blood mononuclear cells between breast cancer patients and healthy controls for the GSE27562 dataset from the GEO database. (A) Heatmaps of all the genes in the GSE27562 dataset, where blue represents the tumor group and orange represents the normal group; the red data indicate increased expressions, green data indicate decreased expressions, and darker colors indicate higher gene expression value changes from the two extremes. (B) GO enrichment analysis of the DEGs for biological processes. (C) GO enrichment analysis of the DEGs for cellular components. (D) GO enrichment analysis of the DEGs for molecular functions. (E) KEGG enrichment analysis of the DEGs. In (B–E), the dot sizes indicate the numbers of differential genes in each channel, with larger sizes implying more numbers and colors indicating the p-values.
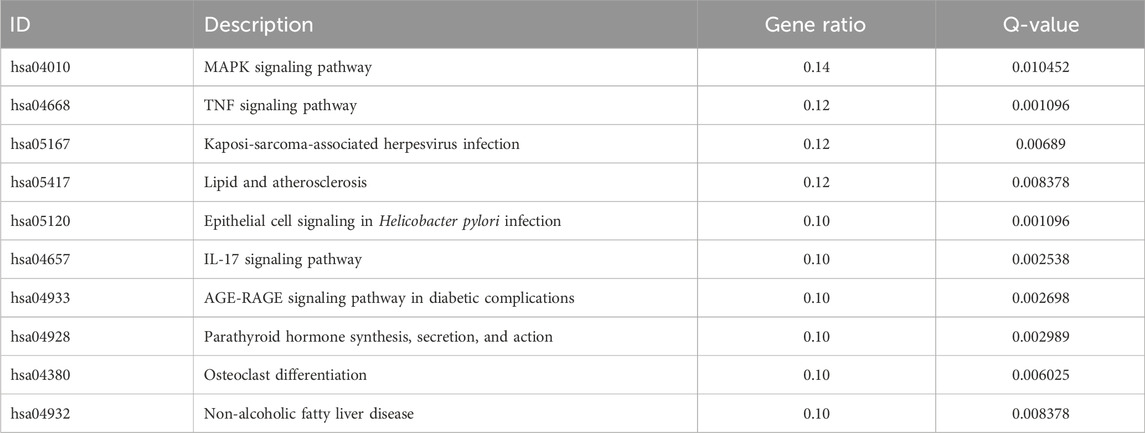
Table 4. KEGG enrichment analysis of the top 10 upregulated differentially expressed genes in breast cancer patients and normal population.
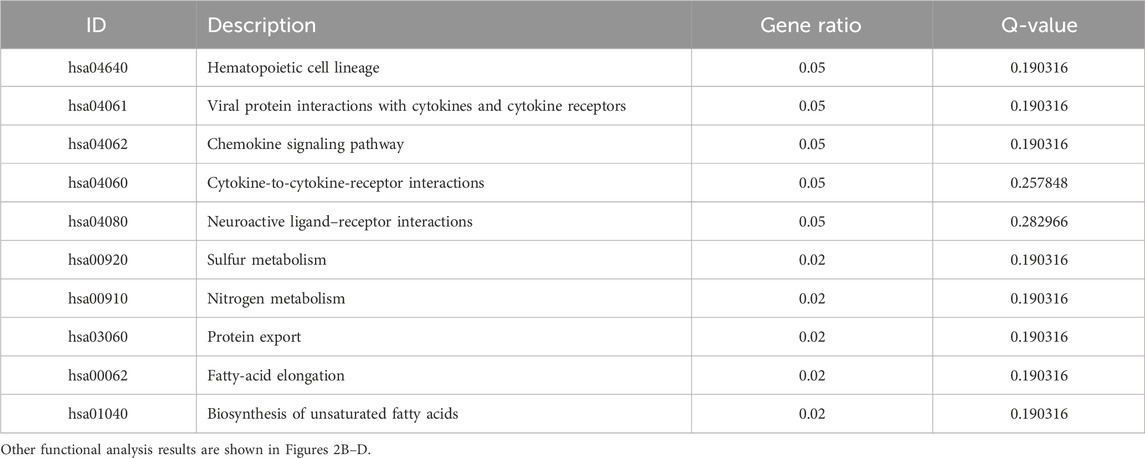
Table 5. KEGG enrichment analysis of the top 10 downregulated differentially expressed genes in breast cancer patients and normal population.
3.4 Association analysis between ATAC-seq and gene microarray data
Intersection analysis of the peripheral blood ATAC sequencing and mRNA chip data from public databases revealed nine differentially expressed genes, namely JUN, MSL2, CDC42, TRIB1, SERTAD3, RAB14, RHOB, RAB40B, and PRKDC. Among these, seven DEGs were noted to be regulated by both mRNA data and ATAC sequencing, namely JUN, MSL2, CDC42, TRIB1, SERTAD3, RAB14, and RHOB (Figure 3A). The RAB40B gene showed ATAC upregulation and mRNA downregulation (Figure 3B), while the PRKDC gene showed ATAC downregulation and mRNA upregulation (Figure 3C); there were no intersecting genes between both downregulations (Figure 3D).
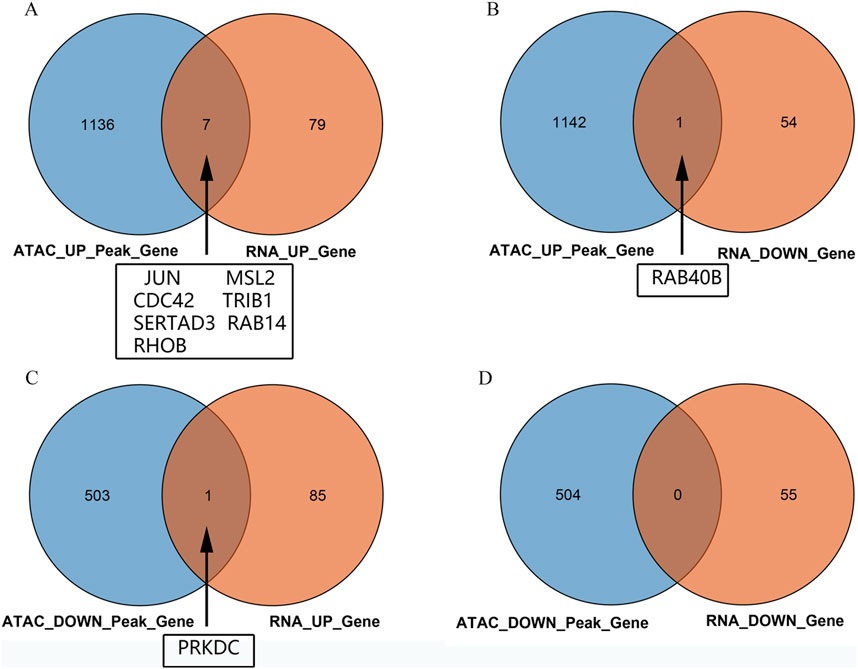
Figure 3. Venn diagrams of the intersections between the ATAC peaks of the peripheral blood mononuclear cells and chip data: (A) intersection of upregulated genes between ATAC and mRNA; (B) intersection of genes between upregulated ATAC and downregulated mRNA; (C) intersection of genes between downregulated ATAC and upregulated mRNA; (D) intersection of downregulated genes between ATAC and mRNA.
3.5 Motif predictions
The open regions of the chromatin may be bound by TFs to regulate gene expressions, and specific base sequences with high affinities to certain TFs are called as motifs. In the motif analysis, five specific TFs were identified: NFY, Sp 2, GFY, NRF, and ELK 1 (Table 6).
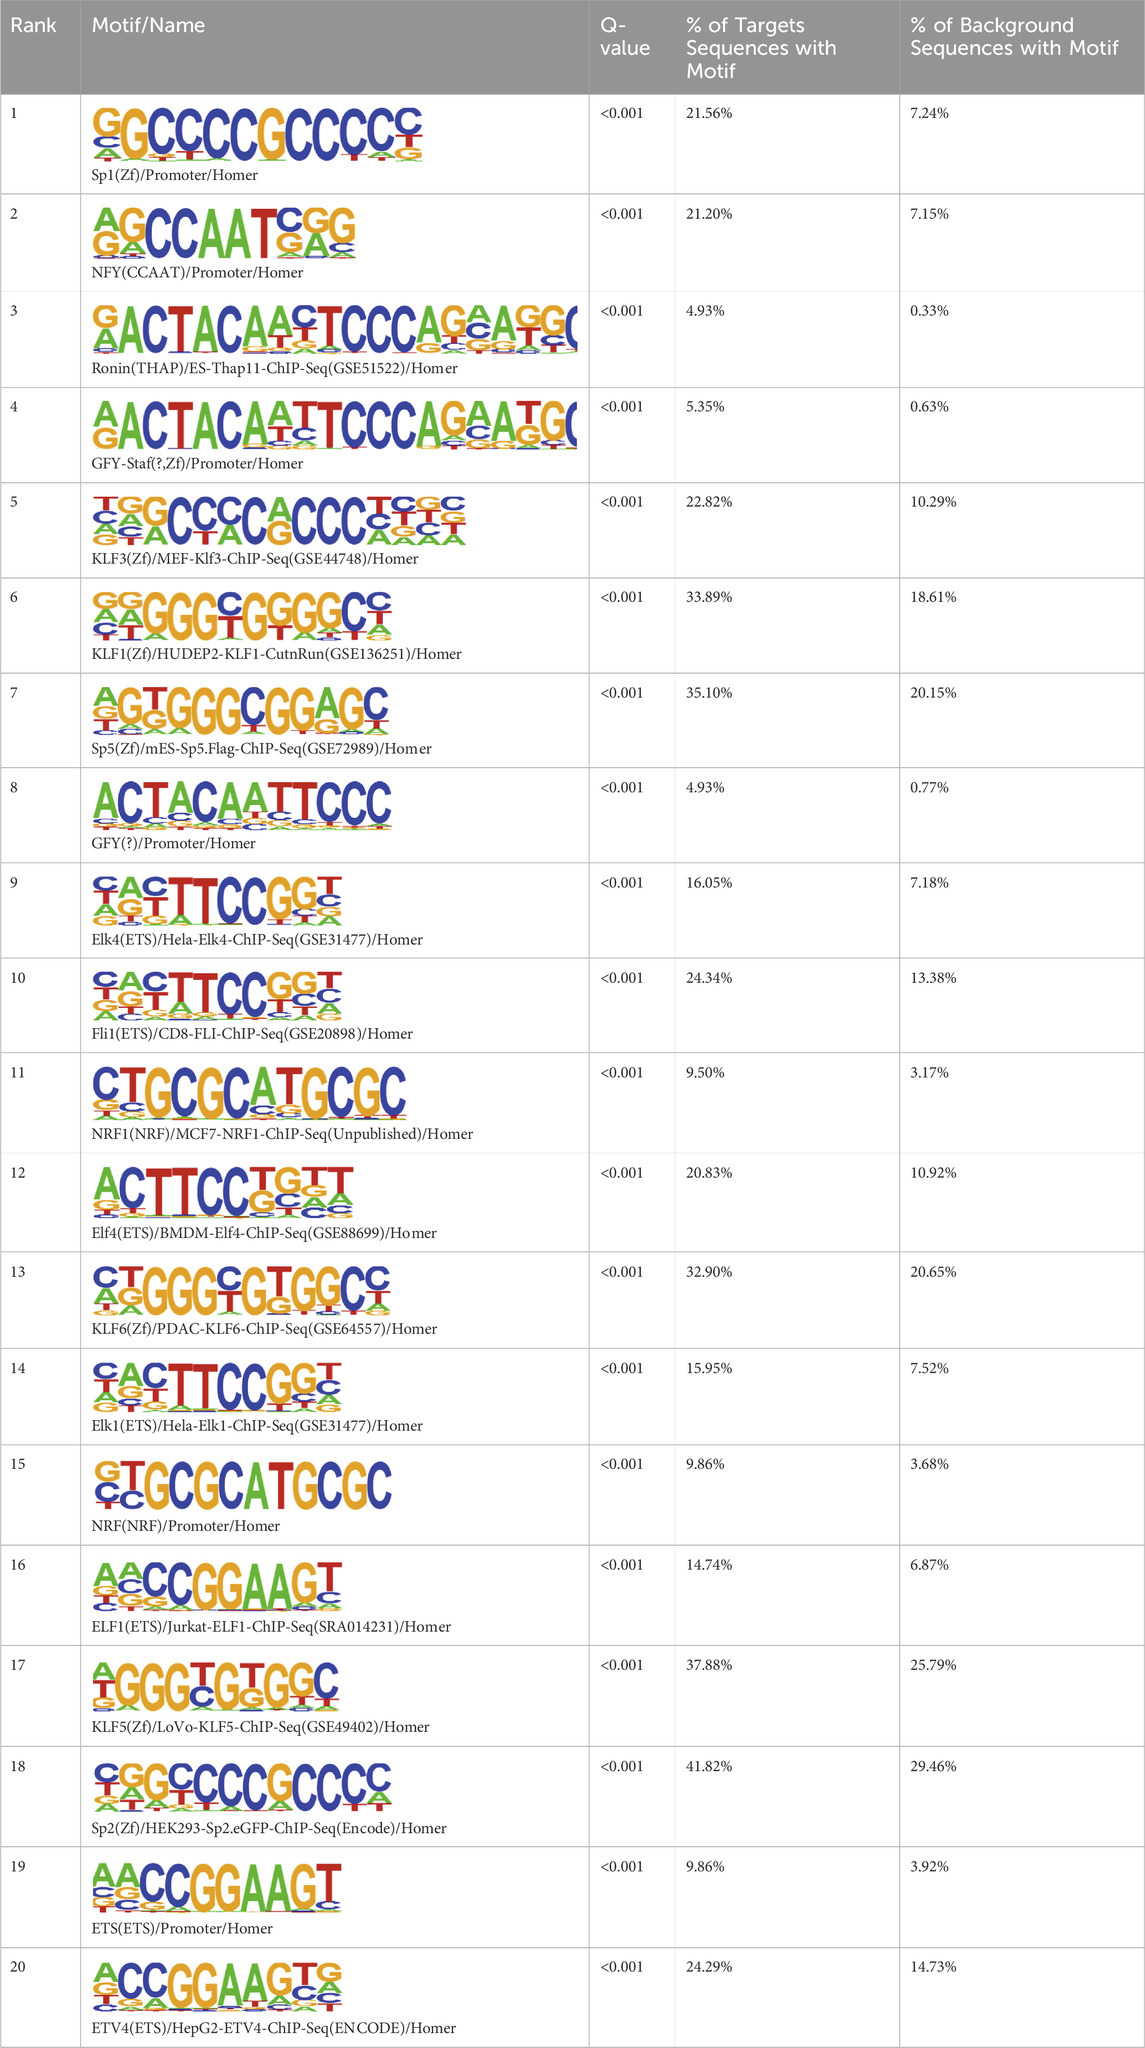
Table 6. HOMER predicts the top 20 transcription factors motifs with high binding probabilities in ATAC sequencing.
4 Discussion
The determination of transposase-accessible chromatin involves the use of the hyperactive Tn5 transposase to cut the accessible genomic DNA and attach sequencing adaptor primers to the DNA ends to measure the openness of certain DNA regions as well as obtain important information about the open chromatin state of the entire genome of a certain cell type (Buenrostro et al., 2013; Gross and Garrard, 1988; Adey et al., 2010). This transposase preferentially inserts sequencing junctions at the unprotected regions of the DNA, thus serving as a probe to measure the genome-wide accessibility of the chromatin (Buenrostro et al., 2015). ATAC-seq technology explores how the open regions in the genome may be gene regulatory elements, such as enhancers, promoters, and TF-binding regions often enriched for TF-specific binding sites, which share similar DNA sequence patterns (motifs).
By collecting PBMC suspensions from breast cancer patients and normal controls, we identified five TFs that were highly expressed in breast cancer patients: NFY, Sp 2, GFY, NRF, and ELK 1. Four of these TFs have already been reported in breast cancer. The nuclear transcription factor Y (NFY) is a cancer-promoting gene that enhances the value-added invasion and metastasis of breast cancer by promoting the expression of proline-rich 11 (PRR 11) (Wang et al., 2019). The Sp 2 TF regulates the biological functions in breast cancer by modulating the mitochondrially related differentially expressed genes (mrDEGs) (Yan et al., 2021). Inhibition of the NFKB (NRF) TF along with non-coding the RNA TROJAN has been shown to abolish CDK2 activity and reverse the resistances of breast cancer cells to CDK4/6 inhibitors (Jin et al., 2020). The ELK 1 TF inhibits cell proliferation in breast cancer along with the tumor suppressor small non-coding RNA 135a (miR-135a) (Ahmad et al., 2018). As a new discovery in this work, the olfactory signaling factor (GFY regulator) has not been evaluated for its role in breast cancer and may therefore be used as a prediction target for the diagnosis, treatment, or prognosis of breast cancer in the future.
The combined use of ATAC-seq and RNA microarray data reveal differences in the gene expressions and regulations between tumor and normal cells. In our experiments, we used the ATAC-seq data of human peripheral blood samples from a public database RNA chip and found nine DEGs, namely JUN, MSL2, CDC42, TRIB1, SERTAD3, RAB14, RHOB, RAB40B, and PRKDC. Eight of these genes have already been reported in breast cancer. JUN can be divided into cellular JUN (c-JUN) and viral JUN (v-JUN). c-JUN is a member of the activated protein-1 (AP-1) TF family that is stimulated by upstream signals and can be transmitted by the JUN N-terminal kinase (JNK) to regulate gene expressions at the transcriptional level, thereby inducing cancer (Vogt, 2001). c-JUN is a potential regulator that stimulates the transformation of breast cells into HR+/HER2-type breast cancers (Zhu et al., 2022). The cell division control protein 42 homolog (CDC42) is frequently upregulated by several cell surface receptors and breast cancer oncogenes, as noted by Cruz-Collazo et al. (2021); the CDC42 inhibitor inhibits infiltration and metastasis of triple-negative breast cancer cells while also inducing cell cycle arrest and apoptosis of HER2-overexpression-type breast cancer cells. It reduces tumor growth and metastasis while inhibiting the migration and invasion of HR+/HER2-type breast cancer cells (Khan et al., 2020). SERTAD3 is a pro-cancer gene located within the 19q13 amplicon that has been shown to inhibit the growth of breast cancer cells and enhance tumor sensitivity to treatment with the drug tamoxifen (Li et al., 2021a). The RAS homolog family member B (RHOB) gene acts as a tumor suppressor and is the guanosine triphosphate enzyme of the RHO family; some researchers have found that RHOB plays an important role in inhibiting breast cancer invasion and metastasis (Wieland et al., 2021), and reducing RHOB expression can increase the migration and invasion capacities of triple-negative breast cancer cell lines. Restoration of the breast cancer 1 (BRCA 1) gene expressions in BRCA1-mutant triple-negative breast cancer cell lines can increase the expression of RHOB, resulting in reduced migration capacity. These results suggest that RHOB protein and BRCA1 mutations are potential therapeutic targets for breast cancer (Privat et al., 2020). RHOB alters the hormonal responses of breast cancer cells by affecting the expressions of the estrogen receptors (ERs) and progesterone receptors (PRs). We have shown that RHOB regulates the expressions of ERs and controls their protein and mRNA levels; furthermore, RHOB regulates the expressions of PRs by enhancing the recruitment of ERs and other major coregulatory factors to PR gene promoters. A major consequence of RHOB regulation is that it differentially affects the proliferation of breast cancer cell lines. It was earlier demonstrated that RHOB promotes the expressions of ERs and PRs in a manner related to cell proliferation in human breast cancer (Médale-Giamarchi et al., 2013). Some investigators found that RHOB expression was upregulated after treatment with atorvastatin, implying the potential application of RHOB as a target for tumor suppressor gene therapy in breast cancer (Ma et al., 2019). The recombination process of cellular programs in malignant cells is a stage where the tumor is very vulnerable. The male-specific lethal 2 homolog (MSL 2) gene suppresses tumor proliferation through disruption-induced excessive chromosomal instability (CIN) (Valsecchi et al., 2021). Hence, targeting MSL may be a valuable approach to treating tumors by increasing the CINs beyond the levels tolerated by cancer cells without inducing serious side effects (Monserrat et al., 2021) in normal tissues. For example, in hepatocellular carcinoma (HCC), MSL 2 overexpression has been found to partially block the inhibitory effects of the miRNA-296-3p tumor suppressor gene mode for proliferation and migration of the HCC cells, which could be used as a target for HCC therapy (Li et al., 2021b). It was also shown that MSL 2 plays a role in maintaining a normal histone modification profile that contributes to the repair of DNA damage (Lai et al., 2013). However, the role of MSL 2 in breast cancer has not been reported in other studies; hence, it may be used as a future therapeutic target in breast cancer. Tribbles pseudokinase 1 (TRIB1) is a pro-cancer gene involved in cancer initiation and progression, which could be used as a biomarker for the diagnosis and prognosis of diseases. Studies have shown that both overexpression and knockdown of TRIB1 in myeloid cells promote the growth of breast tumors in mice; myeloid TRIB1 is a negative regulator of the antitumor cytokine IL-15. Increased expression of myeloid TRIB2 reduces IL-15 levels in breast tumors, resulting in reduced numbers of T cells that are key to the antitumor immune responses. Thus, the roles of TRIB1 in chemotherapeutic responses in human breast cancer are critical and provide mechanistic insights into the importance of controlling myeloid TRIB 1 expression in breast cancer development (Kim et al., 2022). TRIB1 can also be developed as a biomarker for direct targeted therapy and predicting treatment responses (McMillan et al., 2021). RAB14 inhibition mediated by miR-320a suppresses cell proliferation, migration, and invasion in breast cancers. It has also been shown that RAB14 is a miR-320a target in breast cancer; thus, silencing RAB14 inhibits proliferation, migration, and invasion of breast cancer cell lines (Yu et al., 2016). However, RAB14 actively interacts with Nischarin by regulating the production of exosomes in breast cancer cells, subsequently affecting tumor cell adhesion, cell migration, tumor growth, and metastasis (Maziveyi et al., 2019). RAB40B is also a member of the RAS family of oncogenes and plays an important role in breast cancer cell formation, invasion, and metastasis (Jacob et al., 2013). DNA-dependent protein kinase (PRKDC) has been shown to modulate tumor sensitivity to chemotherapy and is a potential prognostic and predictive indicator of the efficacy of adjuvant chemotherapy in cancer patients. Some studies have shown that PRKDC expression is significantly higher in breast cancer tissue samples; high expression of PRKDC is also associated with a higher tumor grade, positive lymph node metastasis, and chemoresistance. Furthermore, PRKDC downregulates the sensitivity of the HR+/HER2-type breast cancer cells (MCF-7 line) to chemotherapeutic agents in vitro and in xenograft mouse models, indicating that PRKDC is a prognostic biomarker of chemoresistance in breast cancer patients (Sun et al., 2017). High expression of PRKDC is also a prognostic marker of poor survival in breast cancer patients (Zhang et al., 2019).
5 Conclusion
The use of ATAC-seq technology to identify motifs has important roles in gene regulation and disease; it provides an important basis for greater understanding of the mechanisms of TF-specific binding sites as well as new ideas for the study of TFs, enhancers, and promoters and development of new drugs. The present study identifies several key genes and TFs associated with breast cancer, providing a macroscopic theoretical basis for further research in this area. Future studies should focus on the functional validation of these identified genes and their interactions with the TFs to enhance our mechanistic understanding of their roles in breast cancer progression. Such validation could offer critical insights into their potential as therapeutic targets and contribute to the development of more effective treatment strategies. The combined application of ATAC-seq and RNA-seq can provide complementary results in tumor genomics research, help researchers better understand the regulatory mechanisms and expression profile changes during the occurrence and development of tumors, and improve the understanding and treatability of tumors. However, the present study is limited by its relatively small sample size. To strengthen the clinical relevance and utility of the identified biomarkers, future studies should focus on validating these biomarkers in larger cohorts. This would not only confirm their potential as diagnostic and prognostic tools but also enhance their applicability in personalized medicine for breast cancer treatment.
The TFs and differential genes identified and discovered in this study provide a macroscopic theoretical basis for breast cancer research and can be potential targets for future breast cancer treatments.
Data availability statement
The original contributions presented in the study are included in the article/supplementary material; further inquiries can be directed to the corresponding authors.
Ethics statement
The studies involving humans were approved by the Ethics and Human Subject Committee of Guangzhou First People’s Hospital. The studies were conducted in accordance with the local legislations and institutional requirements. All participants provided written informed consent to participate in this study.
Author contributions
LX: conceptualization, methodology, project administration, resources, writing–original draft, and writing–review and editing. JL: software, supervision, and writing–original draft. YQ: data curation, formal analysis, and writing–original draft. RH: data curation, visualization, and writing–original draft. FK: funding acquisition, formal analysis, investigation, and writing–original draft. YD: resources, and writing–review and editing.
Funding
The authors declare that financial support was received for the research, authorship, and/or publication of this article. This work was supported by the Scientific Research Project of Guangxi Health Commission (no. z20180739), Youth Foundation of People’s Hospital of Guangxi Zhuang Autonomous Region (no. QN2018-22), and the Natural Science Foundation of Guangxi (no. 2022JJA141179).
Conflict of interest
The authors declare that the research was conducted in the absence of any commercial or financial relationships that could be construed as a potential conflict of interest.
Publisher’s note
All claims expressed in this article are solely those of the authors and do not necessarily represent those of their affiliated organizations, or those of the publisher, the editors, and the reviewers. Any product that may be evaluated in this article, or claim that may be made by its manufacturer, is not guaranteed or endorsed by the publisher.
References
Adey, A., Morrison, Asan, H. G., Xun, X., Kitzman, J. O., Turner, E. H., Stackhouse, B., et al. (2010). Rapid, low-input, low-bias construction of shotgun fragment libraries by high-density in vitro transposition. Genome Biol. 11, R119. doi:10.1186/gb-2010-11-12-r119
Ahmad, A., Zhang, W., Wu, M., Tan, S., and Zhu, T. (2018). Tumor-suppressive miRNA-135a inhibits breast cancer cell proliferation by targeting ELK1 and ELK3 oncogenes. Genes and genomics 40, 243–251. doi:10.1007/s13258-017-0624-6
Buenrostro, J. D., Giresi, P. G., Zaba, L. C., Chang, H. Y., and Greenleaf, W. J. (2013). Transposition of native chromatin for fast and sensitive epigenomic profiling of open chromatin, DNA-binding proteins and nucleosome position. Nat. methods 10, 1213–1218. doi:10.1038/nmeth.2688
Buenrostro, J. D., Wu, B., Chang, H. Y., and Greenleaf, W. J. (2015). ATAC-seq: a method for Assaying chromatin accessibility genome-wide. Curr. Protoc. Mol. Biol. 109, 21.29.21–21. doi:10.1002/0471142727.mb2129s109
Cruz-Collazo, A., Ruiz-Calderon, J. F., Picon, H., Borrero-Garcia, L. D., Lopez, I., Castillo-Pichardo, L., et al. (2021). Efficacy of rac and Cdc42 inhibitor MBQ-167 in triple-negative breast cancer. Mol. cancer Ther. 20, 2420–2432. doi:10.1158/1535-7163.MCT-21-0348
Ding, S., Chen, X., and Shen, K. (2020). Single-cell RNA sequencing in breast cancer: understanding tumor heterogeneity and paving roads to individualized therapy. Cancer Commun. lond. Engl. 40, 329–344. doi:10.1002/cac2.12078
Gross, D. S., and Garrard, W. T. (1988). Nuclease hypersensitive sites in chromatin. Annu. Rev. Biochem. 57, 159–197. doi:10.1146/annurev.bi.57.070188.001111
Jacob, A., Jing, J., Lee, J., Schedin, P., Gilbert, S. M., Peden, A. A., et al. (2013). Rab40b regulates trafficking of MMP2 and MMP9 during invadopodia formation and invasion of breast cancer cells. J. cell Sci. 126, 4647–4658. doi:10.1242/jcs.126573
Jin, X., Ge, L. P., Li, D. Q., Shao, Z. M., Di, G. H., Xu, X. E., et al. (2020). LncRNA TROJAN promotes proliferation and resistance to CDK4/6 inhibitor via CDK2 transcriptional activation in ER+ breast cancer. Mol. cancer 19, 87. doi:10.1186/s12943-020-01210-9
Khan, S., Shukla, S., Farhan, M., Sinha, S., Lakra, A. D., Penta, D., et al. (2020). Centchroman prevents metastatic colonization of breast cancer cells and disrupts angiogenesis via inhibition of RAC1/PAK1/β-catenin signaling axis. Life Sci. 256, 117976. doi:10.1016/j.lfs.2020.117976
Kim, T., Johnston, J., Castillo-Lluva, S., Cimas, F. J., Hamby, S., Gonzalez-Moreno, S., et al. (2022). TRIB1 regulates tumor growth via controlling tumor-associated macrophage phenotypes and is associated with breast cancer survival and treatment response. Theranostics 12, 3584–3600. doi:10.7150/thno.72192
Lai, Z., Moravcová, S., Canitrot, Y., Andrzejewski, L. P., Walshe, D. M., and Rea, S. (2013). Msl2 is a novel component of the vertebrate DNA damage response. PloS one 8, e68549. doi:10.1371/journal.pone.0068549
Li, X., An, M., and Gao, Z. (2021b). In hepatocellular carcinoma, miRNA-296-3p targets MSL2 and suppresses cell proliferation and invasion. J. Oncol. 2021, 7430468. doi:10.1155/2021/7430468
Li, Y., Liu, L., Lv, Y., Zhang, Y., Zhang, L., Yu, H., et al. (2021a). Silencing long non-coding RNA HNF1A-AS1 inhibits growth and resistance to TAM of breast cancer cells via the microRNA-363/SERTAD3 axis. J. drug Target. 29, 742–753. doi:10.1080/1061186x.2021.1878362
Ma, Q., Gao, Y., Xu, P., Li, K., Xu, X., Gao, J., et al. (2019). Atorvastatin inhibits breast cancer cells by downregulating PTEN/AKT pathway via promoting Ras homolog family member B (RhoB). Biomed. Res. Int. 2019, 3235021. doi:10.1155/2019/3235021
Maziveyi, M., Dong, S., Baranwal, S., Mehrnezhad, A., Rathinam, R., Huckaba, T. M., et al. (2019). Exosomes from Nischarin-Expressing cells reduce breast cancer cell Motility and tumor growth. Cancer Res. 79, 2152–2166. doi:10.1158/0008-5472.CAN-18-0842
McMillan, H. D., Keeshan, K., Dunbier, A. K., and Mace, P. D. (2021). Structure vs. Function of TRIB1-myeloid neoplasms and beyond. Cancers 13, 3060. doi:10.3390/cancers13123060
Médale-Giamarchi, C., Lajoie-Mazenc, I., Malissein, E., Meunier, E., Couderc, B., Bergé, Y., et al. (2013). RhoB modifies estrogen responses in breast cancer cells by influencing expression of the estrogen receptor. Breast cancer Res. BCR 15, R6. doi:10.1186/bcr3377
Monserrat, J., Morales Torres, C., Richardson, L., Wilson, T. S., Patel, H., Domart, M. C., et al. (2021). Disruption of the MSL complex inhibits tumour maintenance by exacerbating chromosomal instability. Nat. cell Biol. 23, 401–412. doi:10.1038/s41556-021-00657-2
Privat, M., Cavard, A., Zekri, Y., Ponelle-Chachuat, F., Molnar, I., Sonnier, N., et al. (2020). A high expression ratio of RhoA/RhoB is associated with the migratory and invasive properties of basal-like Breast Tumors. Int. J. Med. Sci. 17, 2799–2808. doi:10.7150/ijms.43101
Sun, G., Yang, L., Dong, C., Ma, B., Shan, M., and Ma, B. (2017). PRKDC regulates chemosensitivity and is a potential prognostic and predictive marker of response to adjuvant chemotherapy in breast cancer patients. Oncol. Rep. 37, 3536–3542. doi:10.3892/or.2017.5634
Valsecchi, C. I. K., Basilicata, M. F., Georgiev, P., Gaub, A., Seyfferth, J., Kulkarni, T., et al. (2021). RNA nucleation by MSL2 induces selective X chromosome compartmentalization. Nature 589, 137–142. doi:10.1038/s41586-020-2935-z
Wang, X., Yan, J., Shen, B., and Wei, G. (2021). Integrated chromatin accessibility and transcriptome landscapes of doxorubicin-resistant breast cancer cells. Front. cell Dev. Biol. 9, 708066. doi:10.3389/fcell.2021.708066
Wang, Y., Zhang, C., Mai, L., Niu, Y., Wang, Y., and Bu, Y. (2019). PRR11 and SKA2 gene pair is overexpressed and regulated by p53 in breast cancer. BMB Rep. 52, 157–162. doi:10.5483/bmbrep.2019.52.2.207
Wieland, A., Strissel, P. L., Schorle, H., Bakirci, E., Janzen, D., Beckmann, M. W., et al. (2021). Brain and breast cancer cells with PTEN loss of function reveal enhanced durotaxis and RHOB dependent amoeboid migration utilizing 3D scaffolds and aligned microfiber tracts. Cancers 13, 5144. doi:10.3390/cancers13205144
Yan, L. R., Wang, A., Lv, Z., Yuan, Y., and Xu, Q. (2021). Mitochondria-related core genes and TF-miRNA-hub mrDEGs network in breast cancer. Biosci. Rep. 41. doi:10.1042/BSR20203481
Yu, J., Wang, L., Yang, H., Ding, D., Zhang, L., Wang, J., et al. (2016). Rab14 suppression mediated by MiR-320a inhibits cell proliferation, migration and invasion in breast cancer. J. Cancer 7, 2317–2326. doi:10.7150/jca.15737
Zhang, Y., Yang, W. K., Wen, G. M., Tang, H., Wu, C. A., Wu, Y. X., et al. (2019). High expression of PRKDC promotes breast cancer cell growth via p38 MAPK signaling and is associated with poor survival. Mol. Genet. Genomic Med. 7, e908. doi:10.1002/mgg3.908
Keywords: breast cancer, peripheral blood mononuclear cells, chromatin transposase sequencing, transcription factor, ATAC-seq
Citation: Xia L, Lu J, Qin Y, Huang R, Kong F and Deng Y (2024) Analysis of chromatin accessibility in peripheral blood mononuclear cells from patients with early-stage breast cancer. Front. Pharmacol. 15:1465586. doi: 10.3389/fphar.2024.1465586
Received: 16 July 2024; Accepted: 27 August 2024;
Published: 23 September 2024.
Edited by:
Jianbin Bi, The First Hospital of China Medical University, ChinaReviewed by:
Dong Wei, Hebei General Hospital, ChinaHaijun Peng, Hebei Chest Hospital, China
Adil Maqbool, Health and Disease Research Center for Rural Peoples, Dhaka, Bangladesh
Copyright © 2024 Xia, Lu, Qin, Huang, Kong and Deng. This is an open-access article distributed under the terms of the Creative Commons Attribution License (CC BY). The use, distribution or reproduction in other forums is permitted, provided the original author(s) and the copyright owner(s) are credited and that the original publication in this journal is cited, in accordance with accepted academic practice. No use, distribution or reproduction is permitted which does not comply with these terms.
*Correspondence: Longjie Xia, bG9uZ2ppZXhpYTE5ODhAMTI2LmNvbQ==; Fanbiao Kong, c3VyZ2VvbmtvbmcyMDIwQHN0dS5qbnUuZWR1LmNu; Yu Deng, ZGVuZ3l1NjhAc3lzdS5lZHUuY24=
†These authors have contributed equally to this work