Abstract
Objective:
To estimate the economic impact of individualized dose optimization guided by antimicrobial therapeutic drug monitoring (TDM) in Spain, compared to no monitoring.
Methods:
A cost analysis of antibiotic treatment of critically ill patients, with and without TDM, was performed using a probabilistic Markov model (with second-order Monte Carlo simulations). Three scenarios were analyzed based on three published meta-analyses (Analysis 1: Pai Mangalore, 2022; Analysis 2: Sanz-Codina, 2023; Analysis 3: Takahashi, 2023).
Results:
TDM, compared to the no-TDM option, generated according to the meta-analysis, a per patient expenditure of €195 (95%CI €194; €197) in analysis 1 or savings of -€301 (95%CI -€300; -€304) and -€685 (95%CI -€685; -€684) in analyses 2 and 3. The probability of TDM (vs. no-TDM) generating savings would be 39.4%, 63.5% and 79.7% in analyses 1, 2 and 3, respectively. This discrepancy in the results is due to methodological differences, in particular in the cure rate with TDM (vs. no-TDM) obtained in the meta-analyses: 12.2%, 16.6% and 16.0% more in analyses 1, 2 and 3, respectively.
Conclusion:
In critically ill patients undergoing antimicrobial therapy TDM, there is an increased likelihood of cure. However, the currently available data are not conclusive on the economic impact of such a therapeutic effect.
Highlights
• TDM, compared to the no-TDM option, generated according to the meta-analysis, a per patient expenditure of €195 (95%CI €194; €197) in analysis 1 or savings of -€301 (95%CI -€300; -€304) and -€685 (95%CI -€685; -€684) in analyses 2 and 3.
• The probability of TDM (vs. no-TDM) generating savings would be 39.4%, 63.5% and 79.7% in analyses 1, 2 and 3, respectively.
• This discrepancy in the results is due to methodological differences, in particular in the cure rate with TDM (vs. no-TDM) obtained in the meta-analyses: 12.2%, 16.6% and 16.0% more in analyses 1, 2 and 3, respectively.
1 Introduction
Antimicrobial therapeutic drug monitoring (TDM) consists of the determination of their plasma levels, followed by dose adjustment according to the results obtained (Impact on the clinical outcomes and cost-effectiveness of the antimicrobial therapeutic monitoring program in critical patients, 2025). The aim is to achieve therapeutic plasma concentrations that allow an optimal pharmacokinetic/pharmacodynamic (PK/PD) ratio to be achieved and to avoid both sub-therapeutic concentrations that could compromise therapeutic success and supra-therapeutic concentrations that could lead to toxicity (Impact on the clinical outcomes and cost-effectiveness of the antimicrobial therapeutic monitoring program in critical patients, 2025; Nielsen et al., 2011). The ultimate goal is to select the most appropriate dosing regimen for each patient for a given drug according to the pathophysiological conditions of the patient, the type of infection, and the causative agent (Impact on the clinical outcomes and cost-effectiveness of the antimicrobial therapeutic monitoring program in critical patients, 2025) However, the therapeutic benefits of antimicrobial dose optimization based on TDM are unclear, which is why three recent meta-analyses have been published (Pai Mangalore et al., 2022; Sanz-Codina et al., 2023; Takahashi et al., 2023). According to the meta-analysis by Pai Mangalore et al. (2022), which included 11 studies (both observational and randomized clinical trials (RCTs), TDM-guided antibiotic dosing would be associated with a statistically significant increase in clinical cure (relative risk, RR = 1.17, 95%CI 1.04-1.31). Still, no reduction in mortality or length of hospital stay would be observed. According to the meta-analysis by Sanz-Codina et al. (2023), which included 10 RCTs, TDM is associated with a reduction in treatment failure (RR = 0.70, 95%CI 0.54-0.92) but not in mortality (RR = 0.86, 95%CI 0.71-1.05). Finally, according to the meta-analysis by Takahashi et al. (2023), which included 5 RCTs, no statistically significant differences were found in clinical cure rate (RR = 1.23; 95%CI 0.91-1.67) and day 28 mortality (RR = 0.94; 95%CI 0.77-1.14), nor in length of intensive care unit (ICU) stay (mean difference in days = 0; 95%CI -2.18, 2.19). Due to these doubts about the clinical benefits associated with TDM, a cost-minimization analysis was chosen, as the trend of the estimated differences, although not statistically significant, could have an economic impact through possible savings from reduced length of stay in the ICU and costs associated with treatment failures, with the consequent prolongation of hospital stay and need for second-line antibiotic treatment. Consequently, the present study aimed to estimate the economic impact of individualized antimicrobial dose optimization guided by TDM in Spain compared to the lack of monitoring.
2 Methods
2.1 Economic model
A cost analysis was performed to evaluate antibiotic treatment of critically ill patients, with and without TDM, using a Markov model. Five health states were considered: first-line treatment (1L) (the state in which the entire patient cohort starts the simulation), cure, second-line treatment-failure (2L), hospital discharge and death (Figure 1). The evolution of patients with and without TDM to the progression states of cure, failure, survival and death was modelled. A static Markov model with a single transition was performed, assuming a median length of hospital stay of 9–14 days in the case of cure and 18–30 days if first-line antibiotic treatment fails, according to the meta-analysis of Pai Mangalore et al. (2022).
FIGURE 1
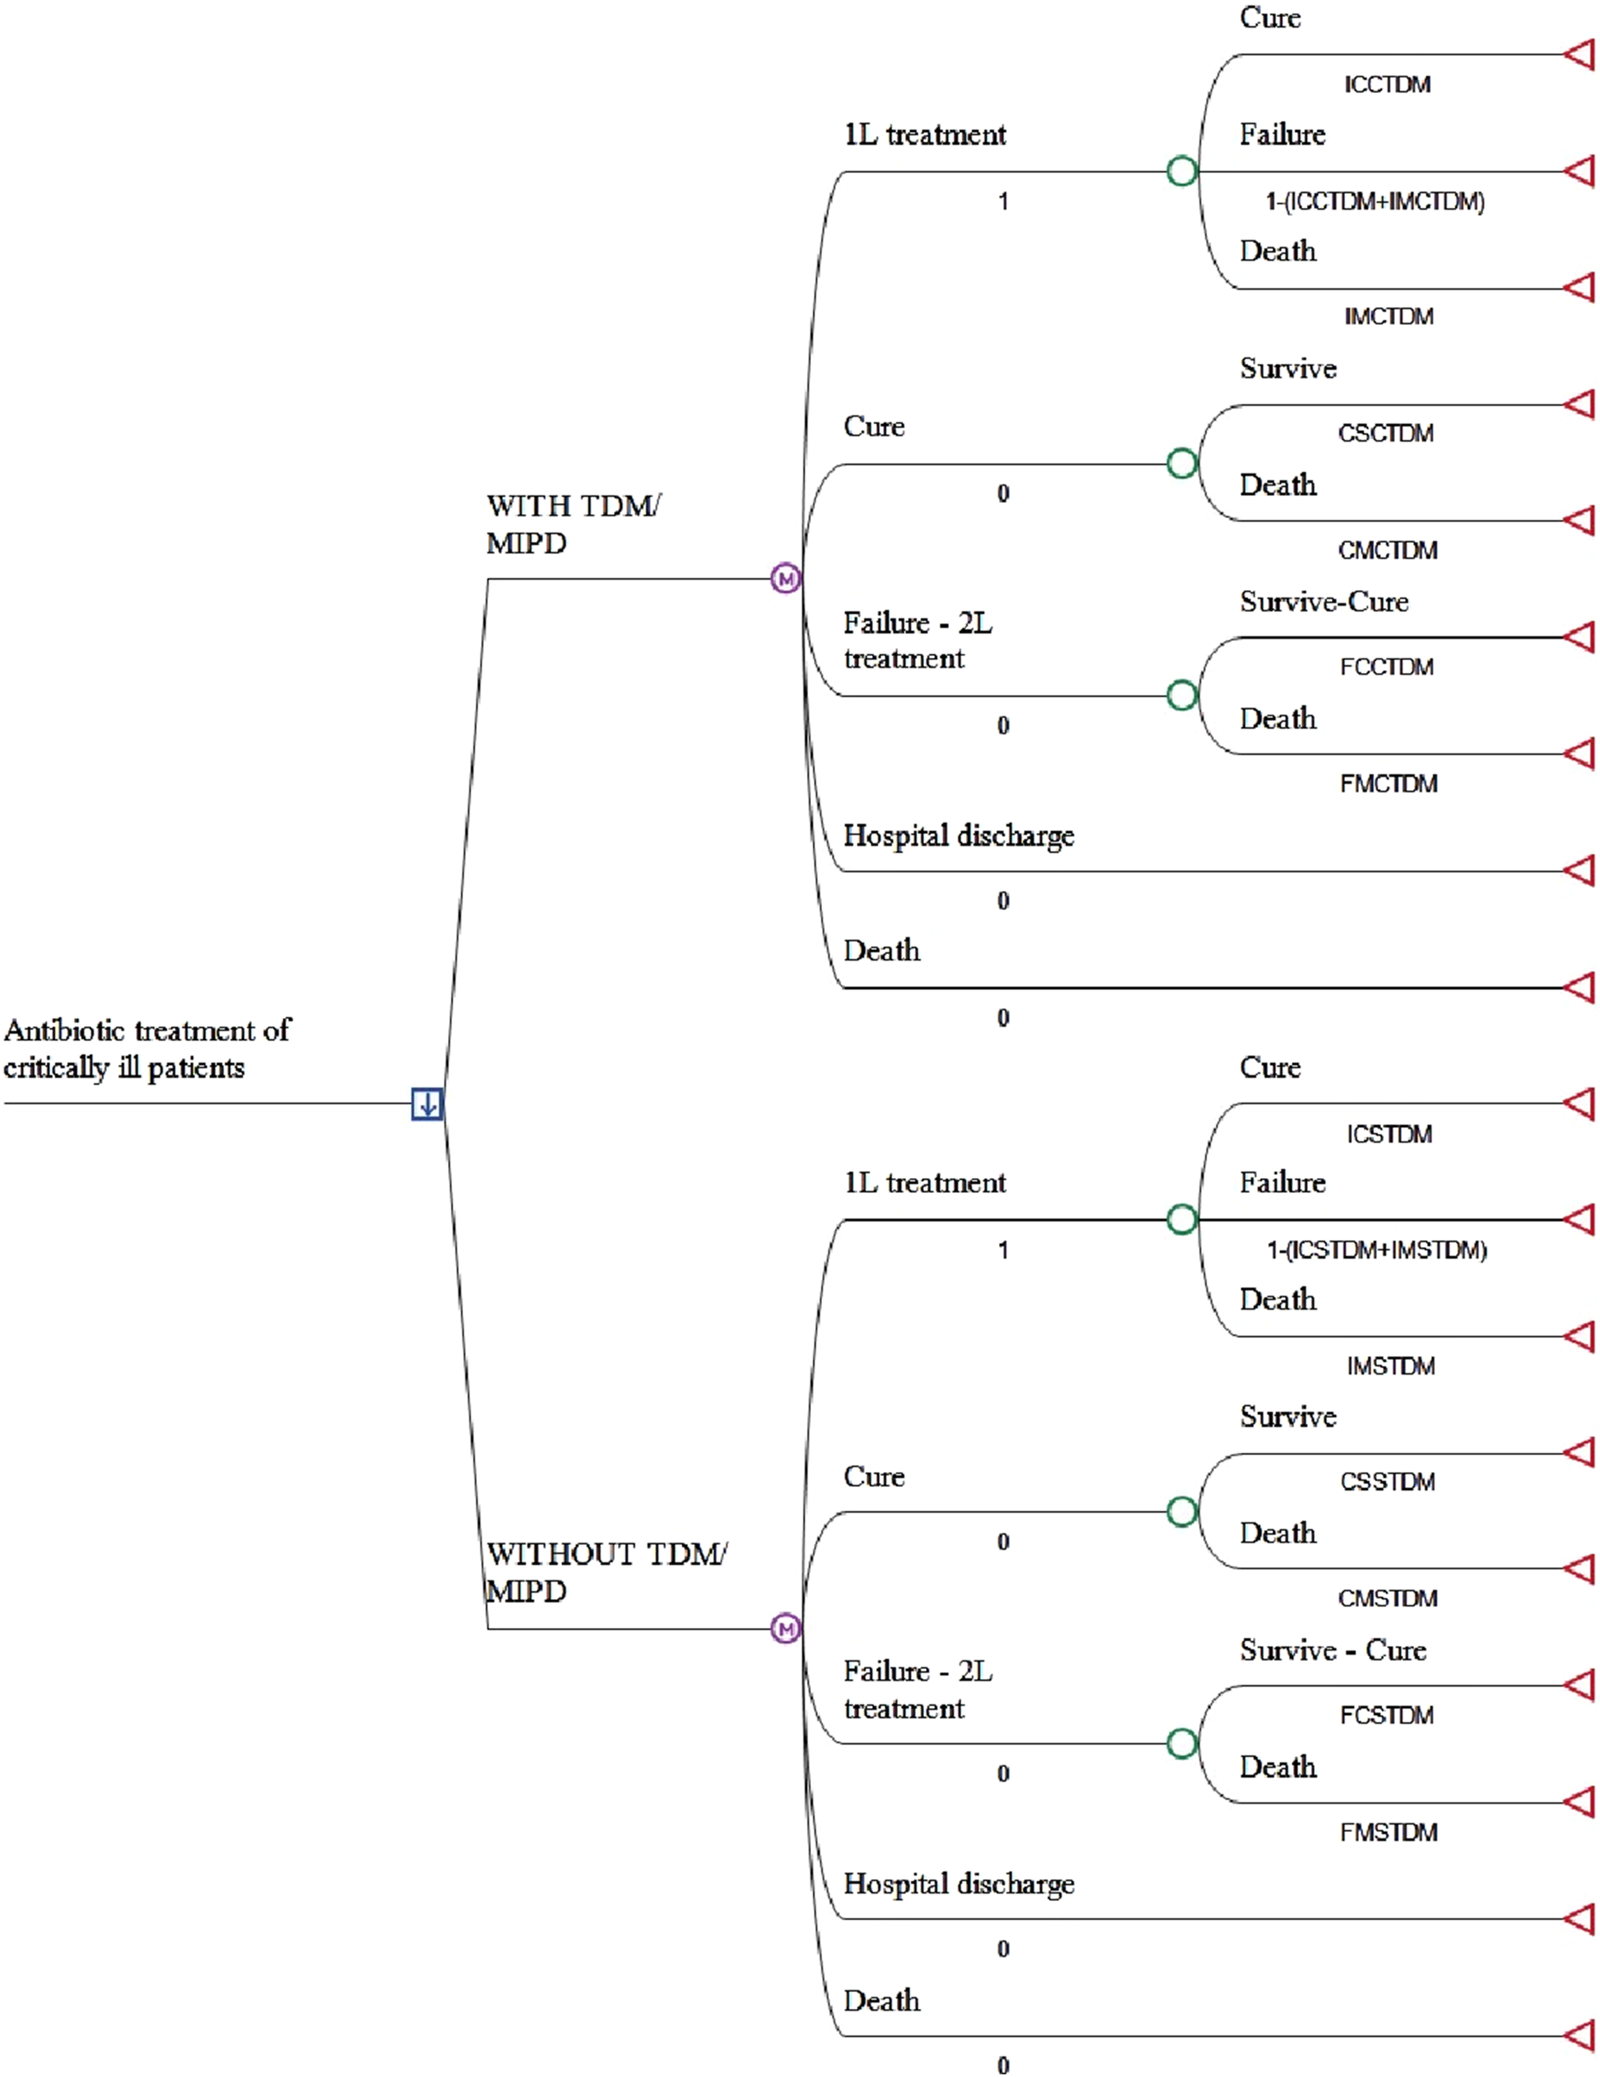
Markov model structure. 1L: firts line of antibiotic treatment; 2L: second line of antibiotic treatment; TDM/MIPD: antimicrobial therapeutic drug monitoring. See the abbreviated meaning of the variables in Table 1.
A hypothetical cohort of patients admitted to the ICU with suspected or confirmed bacterial infection of respiratory, urological or abdominal focus (critical patients) was modelled, with critical patients understood as those in a clinical situation in which one or more vital functions/systems are altered, thus placing them in potential or actual life-threatening situations (Kayambankadzanja et al., 2022). Deterministic and probabilistic analyses were performed (the latter using second-order Monte Carlo simulations with 1,000 iterations) (Eckhardt et al., 1987). The costs were adjusted to gamma distributions and probabilities to beta distributions. Parameters α and λ of the gamma distributions and α and β of the beta distributions were obtained from the means and standard deviations of each variable using the method of moments (Peral et al., 2020).
Three scenarios were analyzed based on the three published meta-analyses: Analysis 1 (Pai Mangalore et al., 2022); Analysis 2 (Sanz-Codina et al., 2023); Analysis 3. (Takahashi et al., 2023). It is important to highlight that the meta-analysis by Pai Mangalore et al. (analysis 1) only included patients treated with beta-lactam antibiotics, that the meta-analysis by Sanz-Codina et al. (analysis 2) included both beta-lactams and vancomycin and that, finally, the meta-analysis by Takahashi et al. (analysis 3) included aminoglycoside antibiotics in addition to beta-lactams and vancomycin.
For greater clarity on how the economic model works, please see the more detailed (step-by-step) explanation in Supplementary Material S1.
2.2 Transition probabilities
Transition probabilities between health states with and without TDM were obtained from the meta-analysis for each analysis (Table 1) (Pai Mangalore et al., 2022; Sanz-Codina et al., 2023; Takahashi et al., 2023). The mortality rate in the general population was obtained from the National Institute of Statistics (www.ine.es).
TABLE 1
| Item | Variable name | Variable description | Average probability | MIN | MAX | SD |
|---|---|---|---|---|---|---|
| Analysis 1 Pai Mangalore et al. (2022) | ||||||
| WITH TDM | ICCTDM | Critical infection/Cure with TDM | 0.6897 | 0.6207 | 0.7587 | 0.0352 |
| IMCTDM | Critical infection/Death with TDM | 0.1778 | 0.1600 | 0.1956 | 0.0091 | |
| IFCTDM | Critical infection/Failure with TDM | 0.1325 | 0.2193 | 0.0458 | 0.0443 | |
| CMCTDM | Cure/Death with TDM | 0.0035 | 0.0032 | 0.0039 | 0.0002 | |
| CSCTDM | Cure/Survive with TDM | 0.9965 | 0.9969 | 0.9962 | 0.0002 | |
| FCCTDM | Failure/Cure with TDM | 0.7859 | 0.7073 | 0.8645 | 0.0401 | |
| FMCTDM | Failure/Death with TDM | 0.2141 | 0.2927 | 0.1355 | 0.0401 | |
| WITHOUT TDM | ICSTDM | Critical infection/Cure without TDM | 0.5673 | 0.5106 | 0.6240 | 0.0289 |
| IMSTDM | Critical infection/Death without TDM | 0.2141 | 0.1927 | 0.2355 | 0.0109 | |
| IFSTDM | Critical infection/Failure without TDM | 0.2186 | 0.2967 | 0.1405 | 0.0399 | |
| CMSTDM | Cure/Death without TDM | 0.0035 | 0.0032 | 0.0039 | 0.0002 | |
| CSSTDM | Cure/Survive without TDM | 0.9965 | 0.9969 | 0.9962 | 0.0002 | |
| FCSTDM | Failure/Cure without TDM | 0.7859 | 0.7073 | 0.8645 | 0.0401 | |
| FMSTDM | Failure/Death without TDM | 0.2141 | 0.2927 | 0.1355 | 0.0401 | |
| Analysis 2 Sanz-Codina et al. (2023) | ||||||
| WITH TDM | ICCTDM | Critical infection/Cure with TDM | 0.6370 | 0.5733 | 0.7007 | 0.0325 |
| IMCTDM | Critical infection/Death with TDM | 0.2360 | 0.2124 | 0.2596 | 0.0120 | |
| IFCTDM | Critical infection/Failure with TDM | 0.1270 | 0.2143 | 0.0397 | 0.0445 | |
| CMCTDM | Cure/Death with TDM | 0.0035 | 0.0032 | 0.0039 | 0.0002 | |
| CSCTDM | Cure/Survive with TDM | 0.9965 | 0.9969 | 0.9962 | 0.0002 | |
| FCCTDM | Failure/Cure with TDM | 0.7859 | 0.7073 | 0.8645 | 0.0401 | |
| FMCTDM | Failure/Death with TDM | 0.2141 | 0.2927 | 0.1355 | 0.0401 | |
| WITHOUT TDM | ICSTDM | Critical infection/Cure without TDM | 0.4710 | 0.4239 | 0.5181 | 0.0240 |
| IMSTDM | Critical infection/Death without TDM | 0.2760 | 0.2484 | 0.3036 | 0.0141 | |
| IFSTDM | Critical infection/Failure without TDM | 0.2530 | 0.3277 | 0.1783 | 0.0381 | |
| CMSTDM | Cure/Death without TDM | 0.0035 | 0.0032 | 0.0039 | 0.0002 | |
| CSSTDM | Cure/Survive without TDM | 0.9965 | 0.9969 | 0.9962 | 0.0002 | |
| FCSTDM | Failure/Cure without TDM | 0.7859 | 0.7073 | 0.8645 | 0.0401 | |
| FMSTDM | Failure/Death without TDM | 0.2141 | 0.2927 | 0.1355 | 0.0401 | |
| Analysis 3 Takahashi et al. (2023) | ||||||
| WITH TDM | ICCTDM | Critical infection/Cure with TDM | 0.5854 | 0.5268 | 0.6439 | 0.0299 |
| IMCTDM | Critical infection/Death with TDM | 0.2686 | 0.2418 | 0.2955 | 0.0137 | |
| IFCTDM | Critical infection/Failure with TDM | 0.1460 | 0.2314 | 0.0606 | 0.0436 | |
| CMCTDM | Cure/Death with TDM | 0.0035 | 0.0032 | 0.0039 | 0.0002 | |
| CSCTDM | Cure/Survive with TDM | 0.9965 | 0.9969 | 0.9962 | 0.0002 | |
| FCCTDM | Failure/Cure with TDM | 0.7859 | 0.7073 | 0.8645 | 0.0401 | |
| FMCTDM | Failure/Death with TDM | 0.2141 | 0.2927 | 0.1355 | 0.0401 | |
| WITHOUT TDM | ICSTDM | Critical infection/Cure without TDM | 0.4252 | 0.3827 | 0.4677 | 0.0217 |
| IMSTDM | Critical infection/Death without TDM | 0.2834 | 0.2551 | 0.3118 | 0.0145 | |
| IFSTDM | Critical infection/Failure without TDM | 0.2530 | 0.3622 | 0.2205 | 0.0362 | |
| CMSTDM | Cure/Death without TDM | 0.0035 | 0.0032 | 0.0039 | 0.0002 | |
| CSSTDM | Cure/Survive without TDM | 0.9965 | 0.9969 | 0.9962 | 0.0002 | |
| FCSTDM | Failure/Cure without TDM | 0.7859 | 0.7073 | 0.8645 | 0.0401 | |
| FMSTDM | Failure/Death without TDM | 0.2141 | 0.2927 | 0.1355 | 0.0401 | |
Transition probabilities of the economic model.
SD, standard deviation; MAX, maximum value; MIN, minimum value; TDM, therapeutic drug monitoring.
2.3 Model costs
The study was conducted from the perspective of the National Health System (NHS), thus including only direct healthcare costs. The costs considered in the Markov model were as follows: (i) cost of antibiotic treatment (in 1L and 2L); (ii) cost of hospitalization (ICU stay); (iii) cost of monitoring plasma antimicrobial levels (TDM).
The use of the antibiotics meropenem plus linezolid for 1L treatment and ceftazidime-avibactam plus linezolid or ceftolozane-avibactam plus linezolid for 2L treatment of critical patient infection was considered in the base case analysis, according to an expert panel (Table 2). An average duration of 9–12 days was estimated for 1L treatment and 9.5–12 days for 2L, as recommended in the antibiotic data sheets. The mean values of the stay were calculated from the medians using the formula proposed by Hozo et al. (2005). Antibiotic prices (Ex-factory prices) and dosing regimens were obtained from BotPlus web (BotPlus web) and their summaries of product characteristics, respectively. The total cost of antibiotic treatment in 1L and 2L is shown in Table 2.
TABLE 2
| 1. Base case: antibiotic treatment cost (BotPlus web) | |||||
|---|---|---|---|---|---|
| Item | Antibiotics | Dose and regimen* | Duration* | EFP 1 vial** | Treatment cost |
| Treatment 1L | Meropenem | 1,000 mg/8 h | 9 days | € 117.86 | € 3,182.22 |
| Linezolid | 600 mg/12 h | 12 days | € 35.77 | € 858.48 | |
| Total | € 4,040.70 | ||||
| Treatment 2L | Ceftazidime-avibactam | 2,000 mg/8 h | 9.5 days | € 115.00 | € 3,277.50 |
| Linezolid | 600 mg/12 h | 12 days | € 35.77 | € 858.48 | |
| Total | € 4,135.98 | ||||
| Ceftolozane-avibactam | 1,000 mg/8 h | 9 days | € 91.67 | € 2,475.09 | |
| Linezolid | 600 mg/12 h | 12 days | € 35.77 | € 858.48 | |
| Total | € 3,333.57 | ||||
| 2. Sensitivity analysis: antibiotic treatment cost (BotPlus web) | |||||
|---|---|---|---|---|---|
| Treatment 1L | Meropenem | 1,000 mg/8 h | 9 days | € 117.86 | € 3,182.22 |
| Vancomycin | 1,000 mg/8 h | 9 days | € 6.90 | € 186.30 | |
| Total | € 3,368.52 | ||||
| Treatment 2L | Ceftazidime-avibactam | 2,000 mg/8 h | 9.5 days | € 115.00 | € 3,277.50 |
| Vancomycin | 1,000 mg/8 h | 9 days | € 6.90 | € 186.30 | |
| Total | € 3,463.80 | ||||
| Ceftolozane-avibactam | 1,000 mg/8 h | 9 days | € 91.67 | € 2,475.09 | |
| Vancomycin | 1,000 mg/8 h | 9 days | € 6.90 | € 186.30 | |
| Total | € 2,661.39 | ||||
| Treatment 2L | Cefiderocol | 2,000 mg/8 h | 10 days | € 138.75 | € 8,325.00 |
| Total | € 8,325.00 | ||||
| 3. TDM cost (Novy et al., 2023; Universidad de Navarra, 2019) | |||||
|---|---|---|---|---|---|
| Average value | MIN | MAX | SD | ||
| € 170.66 | € 87.84 | € 204.79 | € 114.62 | ||
Cost and duration of antibiotic treatment and unit cost of TDM.
*In accordance with what is recommended in the medication technical sheets (Hozo et al., 2005; BotPlus web, 2024).
1L: first-line antibiotic treatment; 2L: second-line antibiotic treatment; EFP: ex-factory price; MAX: maximum value; MIN: minimum value; SD: standard deviation; TDM: therapeutic drug monitoring.
The unit cost per day of stay in the ICU (€1,404.76 ± €47.22 ([€925.49-€1,110.58]) was obtained as an average of the public health prices of the Spanish regions (Table 3). The length of hospital stay in the ICU was obtained from the meta-analysis of Pai Mangalore et al. (2022) (Table 3).
TABLE 3
| 1. Base case | |||||||
|---|---|---|---|---|---|---|---|
| Markov states | ICU days* | Total cost** | |||||
| Average | MIN | MAX | Average | MIN | MAX | SD | |
| Treatment in 1L | 9 | 7 | 14 | € 12,642.80 | € 9,833.29 | € 19,666.57 | € 2,508.49 |
| Cure (with TDM) | 11.3 | 9 | 13.5 | € 15,803.49 | € 12,642.80 | € 18,964.19 | € 1,612.60 |
| Cure (without TDM) | 9.5 | 7.6 | 11.4 | € 13,345.17 | € 10,676.14 | € 16,014.21 | € 1,361.75 |
| Treatment in 2L (failure, with TDM) | 22.5 | 18 | 27 | € 31,606.99 | € 25,285.59 | € 37,928.39 | € 3,225.20 |
| Treatment in 2L (failure, without TDM) | 22.6 | 18.1 | 27.1 | € 31,694.78 | € 25,355.83 | € 38,033.74 | € 3,234.16 |
| 2. Sensitivity analysis: considering only beta-lactam antibiotic treatment | |||||||
|---|---|---|---|---|---|---|---|
| Markov state | ICU days* | Total cost** | |||||
| Average | MIN | MAX | Average | MIN | MAX | SD | |
| Treatment in 1L | 9 | 7 | 14 | € 12,642.80 | € 9,833.29 | € 19,666.57 | € 2,508.49 |
| Cure (with TDM) | 11.5 | 9.2 | 13.8 | € 16,154.68 | € 12,923.75 | € 19,385.62 | € 1,648.44 |
| Cure (without TDM) | 9.3 | 7.4 | 11.2 | € 13,064.22 | € 10,451.38 | € 15,677.07 | € 1,333.08 |
| Treatment in 2L (failure, with TDM) | 25.3 | 20.2 | 30.4 | € 35,540.30 | € 28,432.24 | € 42,648.36 | € 3,626.56 |
| Treatment in 2L (failure, without TDM) | 23.8 | 19.0 | 28.6 | € 33,444.41 | € 26,755.53 | € 40,133.29 | € 3,412.69 |
Costs of the ICU stay.
**Calculated from the average cost of the day of ICU, stay, obtained from the public health prices of the Spanish regions: € 1,404.76 ± € 47.22 (€ 925.49-1,110.58). Euros of 2024.
1L: first-line antibiotic treatment; 2L: second-line antibiotic treatment; ICU: intensive care unit; MAX: maximum value; MIN: minimum value; SD: standard deviation; TDM: therapeutic drug monitoring.
The average cost of TDM (€170.66) was obtained from the work of Novy et al. (2023), considering that 61% of patients would have a second TDM sample. The minimum cost of TDM (€87.84) was obtained from a thesis from the University of Navarra (Universidad de Navarra, 2019). An increase of 20% was considered for the maximum value of the TDM (€204.79) (Table 2). All costs were updated with the CPI for 2024.
2.4 Sensitivity analysis
A univariate sensitivity analysis was performed for all variables in the model. Three additional sensitivity analyses were also carried out: (i) treatment with vancomycin instead of linezolid in 1L and 2L; (ii) cefiderocol in 2L (Table 2); and (iii) considering the length of stay observed with beta-lactam antibiotics, according to the meta-analysis by Pai Mangalore et al. (2022) (Table 3).
3 Results
3.1 Analysis 1 (based on Pai Mangalore)
For each patient undergoing TDM, an additional expenditure of €224 in the deterministic analysis and €195 ± €20 in the probabilistic analysis would be obtained compared to the no-TDM option, with a probability of being the optimal option (probability of generating savings) of 39.4% (Table 4) (Pai Mangalore et al., 2022).
TABLE 4
| Deterministic | Probabilistic | ||
|---|---|---|---|
| Option | Average cost per patient | Mean cost per patient ± SD (95%CI) | Optimal option (generates savings) |
| Analysis 1 Pai Mangalore et al. (2022) | |||
| With TDM | € 16,224 | € 16,120 ± € 1,405 (€ 16,033; 16,207) | 39.4% |
| Without TDM | € 16,000 | € 15,925 ± € 1,385 (€ 15,839; 16,010) | 60.6% |
| With TDM – Without TDM | € 224 | € 195 ± € 20 | - |
| Analysis 2 Sanz-Codina et al. (2023) | |||
| With TDM | € 15,710 | € 15,687 ± € 1,444 (€ 15,597; 15,776) | 63.5% |
| Without TDM | € 15,966 | € 15,988 ± € 1,411 (€ 15,901; 16,076) | 36.5% |
| With TDM – Without TDM | € −256 | € −301 ± € 33 | - |
| Analysis 3 Takahashi et al. (2023) | |||
| With TDM | € 15,639 | € 15,623 ± € 1,407 (€ 15,536; 15,710) | 79.7% |
| Without TDM | € 16,341 | € 16,308 ± € 1,393 (€ 16,221; 16,394) | 20.3% |
| With TDM – Without TDM | € −702 | € −685 ± € 14 | - |
Cost analysis results.
SD: standard deviation; 95%CI: 95% confidence interval; TDM: therapeutic drug monitoring.
3.2 Analysis 2 (based on Sanz-Codina)
For each patient undergoing TDM, a saving of €256 in the deterministic analysis and €301 ± €33 in the probabilistic analysis would be obtained compared to the no-TDM option, with a probability of being the optimal option (probability of generating savings) of 63.5% (Table 4) (Sanz-Codina et al., 2023). According to the meta-analysis by Sanz-Codina et al. (2023), TDM of vancomycin did not improve mortality (RR = 0.30; 95% CI 0.06-1.37). Vancomycin TDM was also not associated with greater clinical cure (RR = 1.13; 95% CI 0.77-1.64) (Sanz-Codina et al., 2023).
3.3 Analysis 3 (based on Takahashi)
A saving of €702 would be obtained, compared to the no-TDM option, in the deterministic analysis, and €685 ± 14 in the probabilistic analysis, with a probability of being the optimal option (probability of generating savings) of 79.7% (Table 4) (Takahashi et al., 2023). According to the meta-analysis by Takahashi et al. (2023), TDM of aminoglycoside did not improve mortality (RR = 1.33; 95% CI 0.61-2.89). Aminoglycoside TDM was also not associated with greater clinical cure (RR = 1.09; 95% CI 0.82-1.44) (Takahashi et al., 2023).
3.4 Univariate deterministic sensitivity analysis
The variables that determined the greatest variability of outcome (cost or savings of TDM) in analyses 1 and 2 were the cost of stay in case of cure with or without TDM, the probability of cure with or without TDM, and the probability of death with or without TDM. In analysis 3, savings were found in all analyses performed (Table 5).
TABLE 5
| Variable Name | Variable Description | Variable Low | Variable Base | Variable High | Low | High |
|---|---|---|---|---|---|---|
| Analysis 1 Pai Mangalore et al. (2022) | ||||||
| CECT | Stay cost if cured with TDM | € 12,643 | € 15,803 | € 18,964 | € −865 | € 1,315 |
| CECST | Stay cost if cured without TDM | € 10,676 | € 13,345 | € 16,014 | € −533 | € 982 |
| ICCTDM | Critical infection/Cure with TDM | 0.6207 | 0.6897 | 0.7587 | € −453 | € 902 |
| ICSTDM | Critical infection/Cure without TDM | 0.5106 | 0.5673 | 0.624 | € −402 | € 851 |
| IMSTDM | Critical infection/Death without TDM | 0.1927 | 0.2141 | 0.2355 | € −155 | € 604 |
| IMCTDM | Critical infection/Death with TDM | 0.16 | 0.1778 | 0.1956 | € −91 | € 540 |
| CEFST | Stay cost if failure without TDM | € 25,356 | € 31,695 | € 38,034 | € −48 | € 497 |
| CTDM | Plasma Levels Cost (TDM) | € 88 | € 171 | € 205 | € 183 | € 242 |
| CE1L | Stay cost 1L | € 9,833 | € 12,643 | € 19,667 | € 225 | € 225 |
| CMCTDM | Cure/Death with TDM | 0.0032 | 0.0035 | 0.0039 | € 225 | € 225 |
| CSCTDM | Cure/Survive with TDM | 0.9958 | 0.9965 | 0.9972 | € 225 | € 225 |
| FCCTDM | Failure/Cure with TDM | 0.7073 | 0.7859 | 0.8645 | € 225 | € 225 |
| FMCTDM | Failure/Death with TDM | 0.0569 | 0.2141 | 0.3713 | € 225 | € 225 |
| CMSTDM | Cure/Death without TDM | 0.0032 | 0.0035 | 0.0039 | € 225 | € 225 |
| CSSTDM | Cure/Survive without TDM | 0.9958 | 0.9965 | 0.9972 | € 225 | € 225 |
| FCSTDM | Failure/Cure without TDM | 0.7073 | 0.7859 | 0.8645 | € 225 | € 225 |
| FMSTDM | Failure/Death without TDM | 0.0569 | 0.2141 | 0.3713 | € 225 | € 225 |
| CDHOSP | Average daily cost of hospitalization | € 471 | € 589 | € 565 | € 225 | € 225 |
| CDUCI | Average daily cost in ICU | € 925 | € 1,405 | € 1,111 | € 225 | € 225 |
| CEFT | Stay cost if failure with TDM | € 25,286 | € 31,607 | € 37,928 | € 225 | € 225 |
| Analysis 2 Sanz-Codina et al. (2023) | ||||||
| CECT | Stay cost if cured with TDM | € 12,643 | € 15,803 | € 18,964 | € −1,263 | € 751 |
| CECST | Stay cost if cured without TDM | € 10,676 | € 13,345 | € 16,014 | € −885 | € 372 |
| ICCTDM | Critical infection/Cure with TDM | 0.5733 | 0.637 | 0.7007 | € −881 | € 369 |
| ICSTDM | Critical infection/Cure without TDM | 0.4239 | 0.471 | 0.5181 | € −776 | € 264 |
| IMSTDM | Critical infection/Death without TDM | 0.2484 | 0.276 | 0.3036 | € −745 | € 233 |
| IMCTDM | Critical infection/Death with TDM | 0.2124 | 0.236 | 0.2596 | € −674 | € 162 |
| CEFST | Stay cost if failure without TDM | 25.356 € | 31.695 € | 38.034 € | € −655 | € 143 |
| CTDM | Plasma Levels Cost (TDM) | € 88 | € 171 | € 205 | € −298 | € −239 |
| CE1L | Stay cost 1L | € 9,833 | € 12,643 | € 19,667 | € −256 | € −256 |
| CMCTDM | Cure/Death with TDM | 0.0032 | 0.0035 | 0.0039 | € −256 | € −256 |
| CSCTDM | Cure/Survive with TDM | 0.9958 | 0.9965 | 0.9972 | € −256 | € −256 |
| FCCTDM | Failure/Cure with TDM | 0.7073 | 0.7859 | 0.8645 | € −256 | € −256 |
| FMCTDM | Failure/Death with TDM | 0.0569 | 0.2141 | 0.3713 | € −256 | € −256 |
| CMSTDM | Cure/Death without TDM | 0.0032 | 0.0035 | 0.0039 | € −256 | € −256 |
| CSSTDM | Cure/Survive without TDM | 0.9958 | 0.9965 | 0.9972 | € −256 | € −256 |
| FCSTDM | Failure/Cure without TDM | 0.7073 | 0.7859 | 0.8645 | € −256 | € −256 |
| FMSTDM | Failure/Death without TDM | 0.0569 | 0.2141 | 0.3713 | € −256 | € −256 |
| CDHOSP | Average daily cost of hospitalization | € 471 | € 589 | € 565 | € −256 | € −256 |
| CDUCI | Average daily cost in ICU | € 925 | € 1,405 | € 1,111 | € −256 | € −256 |
| CEFT | Stay cost if failure with TDM | € 25,286 | € 31,607 | € 37,928 | € −256 | € −256 |
| Analysis 3 Takahashi et al. (2023) | ||||||
| CECT | Stay cost if cured with TDM | € 12,643 | € 15,803 | € 18,964 | € −1,627 | € 223 |
| CECST | Stay cost if cured without TDM | € 10,676 | € 13,345 | € 16,014 | € −1,269 | € −134 |
| ICCTDM | Critical infection/Cure with TDM | 0.5268 | 0.5854 | 0.6439 | € −1,276 | € −127 |
| ICSTDM | Critical infection/Cure without TDM | 0.2551 | 0.2834 | 0.3118 | € −1,203 | € −199 |
| IMSTDM | Critical infection/Death without TDM | 0.2418 | 0.2686 | 0.2955 | € −1,178 | € −227 |
| IMCTDM | Critical infection/Death with TDM | 0.3827 | 0.4252 | 0.4677 | € −1,171 | € −233 |
| CEFST | Stay cost if failure without TDM | 25.356 € | 31.695 € | 38.034 € | € −1,163 | € −241 |
| CTDM | Plasma Levels Cost (TDM) | € 88 | € 171 | € 205 | € −743 | € −685 |
| CE1L | Stay cost 1L | € 9,833 | € 12,643 | € 19,667 | € −702 | € −702 |
| CMCTDM | Cure/Death with TDM | 0.0032 | 0.0035 | 0.0039 | € −702 | € −702 |
| CSCTDM | Cure/Survive with TDM | 0.9958 | 0.9965 | 0.9972 | € −702 | € −702 |
| FCCTDM | Failure/Cure with TDM | 0.7073 | 0.7859 | 0.8645 | € −702 | € −702 |
| FMCTDM | Failure/Death with TDM | 0.0569 | 0.2141 | 0.3713 | € −702 | € −702 |
| CMSTDM | Cure/Death without TDM | 0.0032 | 0.0035 | 0.0039 | € −702 | € −702 |
| CSSTDM | Cure/Survive without TDM | 0.9958 | 0.9965 | 0.9972 | € −702 | € −702 |
| FCSTDM | Failure/Cure without TDM | 0.7073 | 0.7859 | 0.8645 | € −702 | € −702 |
| FMSTDM | Failure/Death without TDM | 0.0569 | 0.2141 | 0,3713 | € −702 | € −702 |
| CDHOSP | Average daily cost of hospitalization | € 471 | € 589 | € 565 | € −702 | € −702 |
| CDUCI | Average daily cost in ICU | € 925 | € 1,405 | € 1,111 | € −702 | € −702 |
| CEFT | Stay cost if failure with TDM | € 25,286 | € 31,607 | € 37,928 | € −702 | € −702 |
Univariate deterministic sensitivity analysis.
ICU: intensive care unit; TDM: therapeutic drug monitoring.
3.5 Additional deterministic sensitivity analyses
Additional analyses (vancomycin instead of linezolid in 1L and 2L, cefiderocol in 2L, and length of hospital stay with beta-lactams) did not change the direction of the results: additional expenditure in analysis 1, savings in analysis 2 and 3 (Table 6).
TABLE 6
| Sensitivity analysis | Strategies | Cost | Incremental cost (With TDM – Without TDM) |
|---|---|---|---|
| Analysis 1 Pai Mangalore et al. (2022) | |||
| Vancomycin instead of linezolid in 1L | With TDM | € 15,843 | € 253 |
| Without TDM | € 15,590 | ||
| Cefiderocol in 2L | With TDM | € 18,670 | € 27 |
| Without TDM | € 18,643 | ||
| Length of stay with beta-lactams | With TDM | € 16,461 | € 350 |
| Without TDM | € 16,111 | ||
| Analysis 2 Sanz-Codina et al. (2023) | |||
| Vancomycin instead of linezolid in 1L | With TDM | € 15,331 | € −214 |
| Without TDM | € 15,545 | ||
| Cefiderocol in 2L | With TDM | € 18,144 | € −545 |
| Without TDM | € 18,689 | ||
| Length of stay with beta-lactams | With TDM | € 15,933 | € −189 |
| Without TDM | € 16,122 | ||
| Analysis 3 Takahashi et al. (2023) | |||
| Vancomycin instead of linezolid in 1L | With TDM | € 15,303 | € −702 |
| Without TDM | € 16,005 | ||
| Cefiderocol in 2L | With TDM | € 15,974 | € −1,036 |
| Without TDM | € 17,010 | ||
| Length of stay with beta-lactams | With TDM | € 15,870 | € −666 |
| Without TDM | € 16,536 | ||
Additional univariate deterministic sensitivity analysis.
1L: first-line antibiotic treatment; 2L: second-line antibiotic treatment; TDM: therapeutic drug monitoring.
4 Discussion
An analysis of the economic impact of antimicrobial TDM in Spain, compared to no monitoring, was performed considering three scenarios based on three published meta-analyses. According to the meta-analysis considered, TDM would result in an additional expenditure of €195 or a saving of €685 (low costs, below the daily cost of ICU admission), (Dooley et al., 2021), with a saving probability of only 39.4% or 79.7%, respectively. This uncertainty is due to the fact that the three available meta-analyses obtained highly variable results regarding cure rates or ICU stay length. Therefore, it is necessary to analyze the reasons for these discrepancies by comparing the methods and results of these meta-analyses. The cure rate with or without TDM (Table 1) is the variable with the greatest impact on outcome (Table 5). In this respect, the difference between TDM and non-TDM was 12.2% in the meta-analysis by Pai Mangalore et al. (2022), 16.6% in Sanz-Codina et al. (2023), and 16.0% in Takahashi et al. (2023) On the other hand, with TDM, there was a reduction in treatment failure of 8.6%, 12.6% and 14.5%, respectively. The average cost of 1L treatment failure is estimated to be more than €30,000 per patient (Table 3), which would explain the additional expenditure in test 1 and the savings in tests 2 and 3 (Pai Mangalore et al., 2022; Sanz-Codina et al., 2023; Takahashi et al., 2023).
To understand the different results of the meta-analyses, it is necessary to consider the methodological differences between them. There were differences in the type of studies included (RCTs and observational studies in Pai Mangalore, only RCTs in Sanz-Codina and Takahashi), in their number (11, 10 and 5 studies, respectively), in the number of patients with TDM (765, 624 and 510, respectively) (Pai Mangalore et al., 2022; Sanz-Codina et al., 2023; Takahashi et al., 2023). There were also differences in the typology of patients in eligible studies (all adults): critically ill patients with confirmed or suspected sepsis (Pai Mangalore), with infection treated with antibiotics or antifungals in controlled studies of TDM (Sanz-Codina) and critically ill patients with sepsis, admitted to ICU with mechanical ventilation (Takahashi). Meta-analysis heterogeneity (I2) was low for the cure rate in Pai Mangalore and high in Sanz-Codina and Takahashi. The risk of bias was high in 3 of the 4 RCTs included in the Pai Mangalore meta-analysis, 6 of 10 RCTs included in Sanz-Codina and 1 of 5 RCTs in Takahashi (Pai Mangalore et al., 2022; Sanz-Codina et al., 2023; Takahashi et al., 2023). Another important difference to highlight is that the meta-analysis by Pai Mangalore included only beta-lactam antibiotics, while the one by Sanz-Codina included vancomycin as well, and the one by Takahashi included vancomycin and aminoglycosides as well. In this regard, it is interesting to note that the meta-analyses that included vancomycin and aminoglycosides obtained better costs results than the meta-analysis that only included beta-lactams.
In conclusion, the differences in the results of the meta-analyses could be explained by their considerable methodological differences and the different studies and antimicrobials included in the meta-analyses. To resolve this uncertainty about the effectiveness of antimicrobial TDM, it would be desirable if a future multicenter, randomized, controlled clinical mega-trial could be conducted in a well-defined patient population. In addition to the uncertainty derived from meta-analyses, this model has the inherent limitations of a theoretical model, which is nevertheless a useful simulation of clinical reality (Rubio-Terrés et al., 2004). Finally, it may also be considered a limitation that part of the length of ICU stays considered in the model may not be attributable to infection but to other concomitant diseases.
A few studies have been published exploring the economic impact of antimicrobial TDM, but not in critical patients. According to a retrospective study published by Pea et al. (2016), clinical pharmacological advice based on TDM results could lead to reductions in the dose of linezolid, achieving considerable savings. Regarding the TDM of aminoglycosides, as established in the study by Slaughter and Cappelletty (1998), monitoring of aminoglycosides would be economically justified in patients with high rates of nephrotoxicity.
Data from a study of critically ill patients showed an increase in costs related to the management of critically ill patients who underwent therapeutic drug monitoring of beta-lactams (Edwolt et al., 2021). Based on the available evidence, it appears that TDM of beta-lactams is associated with higher costs without these costs being translated into an impact on the mortality of critically ill patients.
5 Conclusions
In critically ill patients undergoing TDM of antimicrobial therapy, there is an increased likelihood of cure. However, currently available data are not conclusive on the economic impact of such a therapeutic effect. More reliable clinical data on the effectiveness of TDM are needed, along with economic studies to help determine its efficiency in clinical practice (Pai Mangalore et al., 2023). In the current health situation, with the aim of defining the type of antibiotic and critical patient that could benefit from this strategy, it seems that TDM should be conceptualized in the research area rather than being introduced into routine clinical practice, with the exception of aminoglycoside antibiotics and vancomycin, in which case TDM is fully justified by their narrow therapeutic index, and nephrotoxicity (Rybak et al., 2020; Roberts et al., 2012).
Statements
Data availability statement
The raw data supporting the conclusions of this article will be made available by the authors, without undue reservation.
Author contributions
SG: Conceptualization, Investigation, Methodology, Supervision, Validation, Writing–review and editing. SL: Methodology, Validation, Writing–review and editing. OF: Methodology, Validation, Writing–review and editing. AB: Methodology, Validation, Writing–review and editing. DR-R: Conceptualization, Formal Analysis, Investigation, Methodology, Software, Validation, Writing–original draft, Writing–review and editing. CR-T: Conceptualization, Formal Analysis, Investigation, Methodology, Software, Validation, Writing–original draft, Writing–review and editing.
Funding
The author(s) declare that financial support was received for the research, authorship, and/or publication of this article. Project PI19/00018, funded by Instituto de Salud Carlos III (ISCIII) and co-funded by the European Union.D. Rubio-Rodríguez is a senior consultant of Health Value SL, a company that has received fees in relation to the present study. C. Rubio-Terrés is director of Health Value SL, a company that has received fees in relation to the present study.
Conflict of interest
Authors DR-R and CR-T were employed by company Health Value.
The remaining authors declare that the research was conducted in the absence of any commercial or financial relationships that could be construed as a potential conflict of interest.
Generative AI statement
The author(s) declare that no Generative AI was used in the creation of this manuscript.
Publisher’s note
All claims expressed in this article are solely those of the authors and do not necessarily represent those of their affiliated organizations, or those of the publisher, the editors and the reviewers. Any product that may be evaluated in this article, or claim that may be made by its manufacturer, is not guaranteed or endorsed by the publisher.
Supplementary material
The Supplementary Material for this article can be found online at: https://www.frontiersin.org/articles/10.3389/fphar.2025.1506109/full#supplementary-material
References
1
BotPlus web (2024). Available at: https://botplusweb.farmaceuticos.com/ (Accessed April 30, 2024).
2
Dooley M. Simpson A. N. Nietert P. J. Williams D. Jr Simpson K. N. (2021). Minimally important difference in cost savings: is it possible to identify an MID for cost savings?Health Serv. Outcomes Res. Methodol.21, 131–144. 10.1007/s10742-020-00233-5
3
Eckhardt R. Ulam S. von Neumann J. (1987). The Monte Carlo method. Los Alamos Sci.15, 131–146.
4
Edwolt T. M. J. Abdulla A. Hunfeld N. G. Muller A. E. Gommers D. Polinder S. et al (2021). Health care costs of target attainment for beta-lactam antibiotics in critically ill patients: a retrospective analysis of the expat study. Ther. Drug Monit.44, 224–229. 10.1097/FTD.0000000000000891
5
Hozo S. P. Djulbegovic B. Hozo I. (2005). Estimating the mean and variance from the median, range, and the size of a sample. BMC Med. Res. Methodol.5, 13. 10.1186/1471-2288-5-13
6
Impact on the clinical outcomes and cost-effectiveness of the antimicrobial therapeutic monitoring program in critical patients. (2025). Protoc. code IMPACT-TDM. EudraCT 2019-004947-65. Available at: https://www.clinicaltrialsregister.eu/ctr-search/trial/2019-004947-65/ES (Accessed June 10, 2024).
7
Kayambankadzanja R. K. Schell C. O. Gerdin Wärnberg M. Tamras T. Mollazadegan H. Holmberg M. et al (2022). Towards definitions of critical illness and critical care using concept analysis. BMJ Open12, e060972. 10.1136/bmjopen-2022-060972
8
Nielsen E. I. Cars O. Friberg L. E. (2011). Pharmacokinetic/pharmacodynamic (PK/PD) indices of antibiotics predicted by a semimechanistic PKPD model: a step toward model-based dose optimization. Antimicrob. Agents Chemother.55, 4619–4630. 10.1128/AAC.00182-11
9
Novy E. Martinière H. Roger C. (2023). The current status and future perspectives of beta-lactam therapeutic drug monitoring in critically ill patients. Antibiotics12, 681. 10.3390/antibiotics12040681
10
Pai Mangalore R. Ashok A. Lee S. J. Romero L. Peel T. N. Udy A. A. et al (2022). Beta-lactam antibiotic therapeutic drug monitoring in critically ill patients: a systematic review and meta-analysis. Clin. Infect. Dis.75, 1848–1860. 10.1093/cid/ciac506
11
Pai Mangalore R. Peel T. N. Udy A. A. Peleg A. Y. (2023). The clinical application of beta-lactam antibiotic therapeutic drug monitoring in the critical care setting. J. Antimicrob. Chemother.78, 2395–2405. 10.1093/jac/dkad223
12
Pea F. Cojutti P. Dose L. Baraldo M. (2016). A 1 year retrospective audit of quality indicators of clinical pharmacological advice for personalized linezolid dosing: one stone for two birds?Br. J. Clin. Pharmacol.81, 341–348. 10.1111/bcp.12806
13
Peral C. Cordido F. Gimeno-Ballester V. Mir N. Sánchez-Cenizo L. Rubio-Rodríguez D. et al (2020). Cost-effectiveness analysis of second-line pharmacological treatment of acromegaly in Spain. Expert Rev. Pharmacoecon Outcomes Res.20, 105–114. 10.1080/14737167.2019.1610396
14
Roberts J. A. Norris R. Paterson D. L. Martin J. H. (2012). Therapeutic drug monitoring of antimicrobials. Br. J. Clin. Pharmacol.73, 27–36. 10.1111/j.1365-2125.2011.04080.x
15
Rubio-Terrés C. Sacristán J. A. Badía X. Cobo E. Alonso F. G. Grupo ECOMED (2004). por el Grupo ECOMED. Métodos utilizados para realizar evaluaciones económicas de intervenciones sanitarias. Med. Clín Barc.122, 578–583. 10.1016/s0025-7753(04)74314-6
16
Rybak M. J. Le J. Lodise T. P. Levine D. P. Bradley J. S. Liu C. et al (2020). Therapeutic monitoring of vancomycin for serious methicillin-resistant Staphylococcus aureus infections: a revised consensus guideline and review by the American society of health-system pharmacists, the infectious diseases society of America, the pediatric infectious diseases society, and the society of infectious diseases pharmacists. Am. J. Health Syst. Pharm.77, 835–864. 10.1093/ajhp/zxaa036
17
Sanz-Codina M. Bozkir H. Ö. Jorda A. Zeitlinger M. (2023). Individualized antimicrobial dose optimization: a systematic review and meta-analysis of randomized controlled trials. Clin. Microbiol. Infect.29, 845–857. 10.1016/j.cmi.2023.03.018
18
Slaughter R. L. Cappelletty D. M. (1998). Economic impact of aminoglycoside toxicity and its prevention through therapeutic drug monitoring. Pharmacoeconomics14, 385–394. 10.2165/00019053-199814040-00005
19
Takahashi N. Kondo Y. Kubo K. Egi M. Kano K. I. Ohshima Y. et al (2023). Efficacy of therapeutic drug monitoring-based antibiotic regimen in critically ill patients: a systematic review and meta-analysis of randomized controlled trials. J. Intensive Care11, 48. 10.1186/s40560-023-00699-8
20
Universidad de Navarra (2019). Tesis doctoral. Optimización con criterios PK/PD de la terapia con meropenem en el paciente crítico. Análisis farmacoeconómico de los resultados. AI Idoate Grijalba. Pamplona. Available at: https://dadun.unav.edu/bitstream/10171/58883/1/Tesis_IdoateGrijalba19.pdf (Accessed April 04, 2024).
Summary
Keywords
therapeutic drug monitoring, dose optimization, antimicrobials, critical ill patient, economic impact
Citation
Grau S, Luque S, Ferrandez O, Benitez Cano A, Rubio-Rodríguez D and Rubio-Terrés C (2025) Economic impact of individualized antimicrobial dose optimization in the critically ill patient in Spain. Front. Pharmacol. 16:1506109. doi: 10.3389/fphar.2025.1506109
Received
04 October 2024
Accepted
28 January 2025
Published
26 February 2025
Volume
16 - 2025
Edited by
Manuel Rodriguez-Iglesias, University of Cádiz, Spain
Reviewed by
Pier Giorgio Cojutti, Sant’Orsola-Malpighi Polyclinic, Italy
Enrique Enric, Catalan Institute of Oncology, Spain
Updates
Copyright
© 2025 Grau, Luque, Ferrandez, Benitez Cano, Rubio-Rodríguez and Rubio-Terrés.
This is an open-access article distributed under the terms of the Creative Commons Attribution License (CC BY). The use, distribution or reproduction in other forums is permitted, provided the original author(s) and the copyright owner(s) are credited and that the original publication in this journal is cited, in accordance with accepted academic practice. No use, distribution or reproduction is permitted which does not comply with these terms.
*Correspondence: Darío Rubio-Rodríguez, drubiorodriguez@healthvalue.org
Disclaimer
All claims expressed in this article are solely those of the authors and do not necessarily represent those of their affiliated organizations, or those of the publisher, the editors and the reviewers. Any product that may be evaluated in this article or claim that may be made by its manufacturer is not guaranteed or endorsed by the publisher.