 Yoshihiro Noguchi
 Tomoya Tachi
 Tomoaki Yoshimura1†
- 1Laboratory of Clinical Pharmacy, Gifu Pharmaceutical University, Gifu, Japan
- 2Department of Clinical Pharmacy, Graduate School of Pharmaceutical Sciences, Nagoya City University, Nagoya, Aichi, Japan
1 Introduction
The inherent limitations of key clinical studies on which marketing authorization is based leave uncertainty regarding rare or delayed adverse drug reactions (ADRs). To address these uncertainties, drug safety surveillance activities are undertaken to characterize the safety profile of drugs in real-world situations. One of the information sources underlying post-marketing drug safety surveillance is the spontaneous report database, in which ADRs suspected by healthcare professionals and patients are collected primarily through spontaneous reporting. The results of the spontaneous report database analysis are used as the basis for various regulatory responses that can lead to the withdrawal or discontinuation of a drug from the market, issuance of urgent safety information, and revision of the package insert (Noguchi et al., 2021a; Noguchi and Yoshimura, 2024).
Major spontaneous reporting databases include VigiBase by the World Health Organization-Uppsala Monitoring Centre (WHO-UMC, 2025), Food and Drug Administration (FDA) Adverse Event Reporting System (FAERS) by the United States (US Food and Drug Administration, 2025), EudraVigilance by the European Medicines Agency (EMA) (European Medicines Agency, 2025), and Japanese Adverse Drug Event Report database (JADER) by the Pharmaceuticals and Medical Devices Agency (PMDA) in Japan (Pharmaceuticals and Medical Devices Agency, 2021). These databases only register cases in which ADRs have developed and do not include cases in which no ADRs occurred. Therefore, the incidence of ADRs cannot be calculated, and the search for ADRs generally uses Signals of Disproportionate Reporting (SDR) by disproportionality analysis (Figure 1). The well-known indicators include the Reporting Odds Ratio (ROR) (Rothman et al., 2004) and the Proportional Reporting Ratio (PRR) (Rothman et al., 2004; Evans et al., 2001), which are frequentist statistical methods, and the Bayesian Confidence Propagation Neural Network (BCPNN) (Bate et al., 1998) and Empirical Bayesian Geometric Mean (EBGM) (DuMouchel, 1999), which are Bayesian statistical methods.
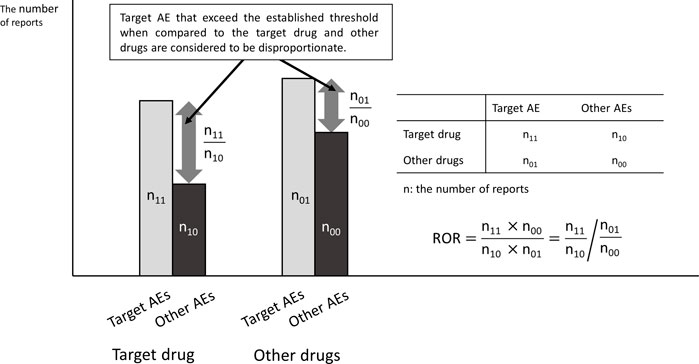
Figure 1. Principles of disproportionate measures (ROR, reporting odds ratio).
In recent years, improvements in computer processing power have made it easier for laboratories to handle large data sets, making it possible for those not affiliated with regulatory agencies or pharmaceutical companies to conduct analyses of spontaneous reporting databases (Urushihara, 2019). A search of PubMed for articles on disproportionality analysis reported an increase from 40 in 2017 to 180 in 2021 (Khouri et al., 2021a). However, researchers often forget that the results of disproportionality analysis are merely clinical hypotheses. Over 2/3 of the authors reported overestimating or misinterpreting the findings (Mouffak et al., 2021). The increase in the number of these inappropriately reported papers has become a social problem, and reporting guidelines for disproportionality analysis (Reporting of A Disproportionality analysis for drUg Safety signal detection using spontaneously reported adverse events in PharmacoVigilance; READUS-PV) have been published (Fusaroli et al., 2024). On the other hand, few studies summarize important points to note regarding methodology.
ADRs can be dose-dependent or mechanism-of-action-based. Therefore, ADR searches using spontaneous report databases (Alexandre et al., 2024; Hatano et al., 2023; Gu and Samarneh, 2025) have also produced an increasing number of reports on drug dose dependence. Although these studies have the potential to provide significant clinical findings, there are cases where analyses have been conducted beyond the research limitations of the spontaneous report databases.
This paper highlights five key points for evaluating dose dependence using spontaneous report databases.
2 Five key points to understand
First, because spontaneous reporting databases are susceptible to various reporting biases, there is no guarantee that the reported cases adequately represent all patients treated with the drug. When investigating the association between ADR and dose-dependence, many researchers focus on the number of reports each dose group. If the number of ADR reports increases with increasing dose, an association between ADR and dose dependence may be established. However, the number of reports in the spontaneous reporting database does not necessarily reflect the incidence rates of ADRs. The spontaneous reporting database does not contain data that would allow us to determine the total number of patients using the drug. In other words, if the total number of patients using the drug in the low-dose group is small, the number of reported registered cases will naturally be small, even though the actual incidence rate is not different from that in the high-dose patient group.
Second, the SDR score is not necessarily related to the magnitude of the risk of developing ADRs. The control group in the disproportionality analysis using the spontaneous reporting database is not the group that did not develop ADRs, but the group that developed ADRs other than the target ADRs. As shown in Figure 2, when ADRs other than the target ADR are inversely correlated with dose, the results may be as if the SDR score of the target ADR is dose-dependent, even though the incidence of the target ADR is the same. For example, when infections are reported as ADR of antibiotics, many of them are due to insufficient antibiotic doses. Therefore, even if there is a dose-dependence in disproportionality, it is unclear whether there is a dose-dependence in the risk of developing ADR.
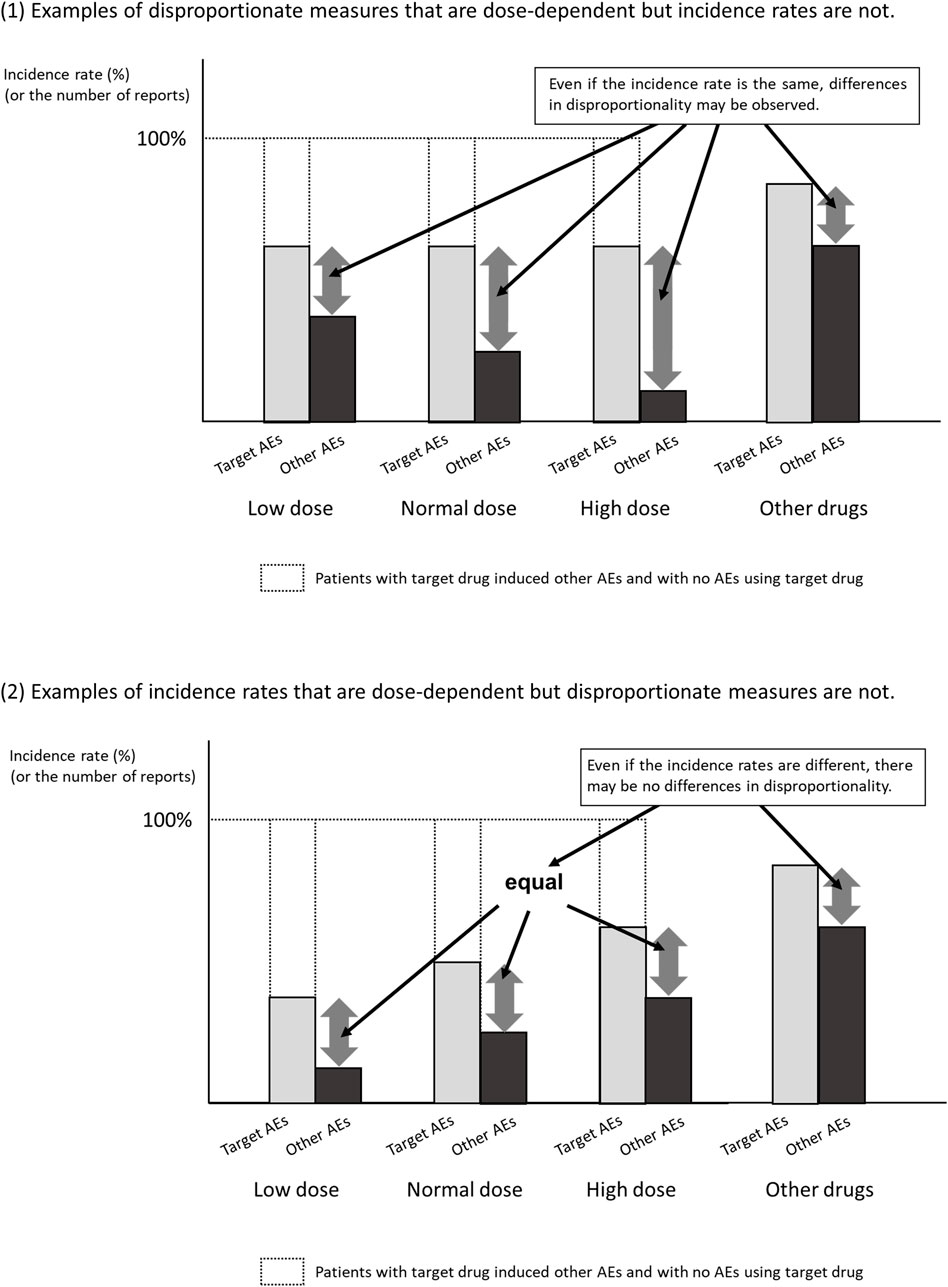
Figure 2. Examples of association between disproportionality and dose-specific incidence rates.
It is true that there are long-standing reports of similarity between SDR scores and the results of randomized trials (Beau-Lejdstrom et al., 2019) and meta-analyses (Khouri et al., 2021b), but there are too few examples to make a positive observation. Recent studies have reported that the ROR score tends to be inflated out of the SDR score when the number of reports is small (Fusaroli et al., 2024; Noguchi et al., 2021b). In addition, as shown in Figure 2, even if the number of reports shows dose-dependent, it is entirely possible that the disproportionate measures don’t demonstrate dose-dependence. That is, we should probably follow the current recommendation that disproportionate measures not be used as valid substitutes for risk estimates. Therefore, even if there is some association between SDR score and drug dose, one should be cautious in making the clinical hypothesis that the risk of developing ADRs is dose-dependent.
Third, it is known that there is a lot of missing data in spontaneous reporting databases. For example, Alexandre et al. used the VigiBase to examine the association between ibrutinib dosing regimens and reports of ibrutinib-related atrial fibrillation (IRAF) in patients with chronic B-cell malignancies to determine whether IRAF is dose-dependent (Alexandre et al., 2024). The VigiBase covers more than 35 million reports worldwide and includes management details, patient demographics, ADR occurrence data, appropriate drug information, and dosing frequency. According to their findings, the VigiBase had 33,623 ibrutinib-related reports in adults. Unfortunately, almost half lacked information on daily dosing, leaving only 18,498 reports available for analysis (Alexandre et al., 2024). Some researchers believe that excluding cases where doses were not recorded will still provide unbiased estimates; however, this is a major misconception. One should not assume that the patient population used in the analysis adequately reflects the population distribution of ADR incidence. Spontaneous reporting databases are subject to various reporting biases; therefore, the dose distribution of cases where doses were recorded does not necessarily match that of cases where doses were not recorded.
Fourth, it is important to consider the background behind the existence of different dosing data. For example, (Alexandre et al., 2024), ibrutinib is administered orally once daily at either 420 mg or 560 mg, depending on the indication. Dose reductions are determined based on the frequency of Grade 3 adverse events, with more frequent events requiring dose reduction upon reinitiation. Some patients who experience Grade 3 adverse events may not resume ibrutinib treatment at all. As a result, the higher reporting rate of serious adverse events in the high-dose (standard-dose) group may largely reflect cautious prescribing practices in clinical settings. Patients at high risk of recurrent serious adverse events are less likely to restart the drug, which may lead to a lower proportion of serious adverse event reports in the reduced-dose group. In cases where the dose is gradually reduced from the standard level, it becomes difficult to accurately assess dose dependence from a pharmacological perspective.
Lastly, it is necessary to consider adjusting for differences in height, weight, and metabolic function that may affect the drug dose. There are also examples where SDR scores are calculated by adjusting each factor as a covariate (Hatano et al., 2023; Gu and Samarneh, 2025). In general cohort studies, covariate adjustment is a powerful tool for getting closer to the truth. However, spontaneous report databases have many points to note when adjusting for covariates (Noguchi et al., 2025). In this paper, we will omit statistical explanations (please refer to Ref. 21 for statistical details), but as mentioned above, spontaneous report databases are affected by reporting bias and have a lot of missing data. This is not limited to dosage. For example, in FAERS, gender is missing in approximately 13% of reports (Noguchi et al., 2021a). Due to the nature of spontaneous reporting, missing data is unlikely to be evenly distributed between genders. A similar problem may exist for age data. In FAERS, the annual proportion of missing age data increased from 21.9% in 2002 to 43.8% in 2018 (Pham et al., 2021). With these considerations, the validity of covariate adjustment may be compromised depending on the circumstances of missing data necessary for the analysis (e.g., height, weight, and presence of renal or hepatic dysfunction).
3 Alternative approaches and practical guidance for evaluating dose-dependence
To address this issue, alternative approaches should be considered. Integrating spontaneous reporting data with external sources such as prescription or dispensing databases can offer valuable context regarding background dose exposure patterns. For example, Mokbel et al. demonstrated that combining pharmacovigilance data with prescribing information enhances the interpretability of safety signals, even when individual-level dose information is lacking (Mokbel et al., 2022).
Moreover, more rigorous analytical methods—such as stratified analyses within observational cohorts or the use of marginal structural models—can help control for confounding and support stronger causal inference. The use of electronic health records (EHRs) or insurance claims databases has also been recommended for evaluating dose–response relationships (Gagne et al., 2012).
In summary, disproportionality analysis alone is insufficient for a reliable assessment of dose–response relationships. The integration of complementary data sources and robust methodologies is essential to draw valid and clinically meaningful conclusions.
4 Conclusion
In recent years, the ease of access to spontaneous reporting databases and calculating disproportionality scores have led to an increasing number of studies attempting to evaluate dose-dependence using disproportionality analysis. However, this trend is concerning, as the careless or overconfident use of disproportionality analysis for assessing dose-dependence—without a thorough understanding of its limitations—can lead to misleading conclusions. Even if the results appear to support previous findings, they are unlikely to be accepted unless the analysis is conducted with proper awareness of the limitations inherent in spontaneous reporting data. The five key points presented in this paper must be understood and properly analyzed.
Author contributions
YN: Conceptualization, Funding acquisition, Writing – original draft, Writing – review and editing. TT: Writing – review and editing. TY: Writing – review and editing.
Funding
The author(s) declare that financial support was received for the research and/or publication of this article. This paper was supported by JSPS KAKENHI Grant Number 22K12890.
Conflict of interest
The authors declare that the research was conducted in the absence of any commercial or financial relationships that could be construed as a potential conflict of interest.
Generative AI statement
The author(s) declare that no Generative AI was used in the creation of this manuscript.
Any alternative text (alt text) provided alongside figures in this article has been generated by Frontiers with the support of artificial intelligence and reasonable efforts have been made to ensure accuracy, including review by the authors wherever possible. If you identify any issues, please contact us.
Publisher’s note
All claims expressed in this article are solely those of the authors and do not necessarily represent those of their affiliated organizations, or those of the publisher, the editors and the reviewers. Any product that may be evaluated in this article, or claim that may be made by its manufacturer, is not guaranteed or endorsed by the publisher.
Abbreviations
ADR, adverse drug reaction; AF, atrial fibrillation; BCPNN, Bayesian Confidence Propagation Neural Network; EBGM, Empirical Bayesian Geometric Mean; EMA, European Medicines Agency; FAERS, FDA Adverse Event Reporting System; FDA, Food and Drug Administration; IRAF, ibrutinib-related atrial fibrillation, JADER; Japanese Adverse Drug Event Report database, PMDA; Pharmaceuticals and Medical Devices Agency, PRR; Proportional Reporting Ratio, READUS-PV; REporting of A Disproportionality analysis for drUg Safety signal detection using spontaneously reported adverse events in PharmacoVigilance, ROR; Reporting Odds Ratio, SDR; Signals of Disproportionate Reporting.
References
Alexandre, J., Font, J., Angélique, D. S., Delapierre, B., Damaj, G., Plane, A. F., et al. (2024). Is ibrutinib-related atrial fibrillation dose dependent? Insights from an individual case level analysis of the World Health Organization pharmacovigilance database. Leukemia 38, 2628–2635. doi:10.1038/s41375-024-02413-5
Bate, A., Lindquist, M., Edwards, I. R., Olsson, S., Orre, R., Lansner, A., et al. (1998). A Bayesian neural network method for adverse drug reaction signal generation. Eur. J. Clin. Pharmacol. 54, 315–321. doi:10.1007/s002280050466
Beau-Lejdstrom, R., Crook, S., Spanu, A., Yu, T., and Puhan, M. A. (2019). Adverse drug reaction risk measures: a comparison of estimates from drug surveillance and randomised trials. Pharm. Med. 33, 331–339. doi:10.1007/s40290-019-00287-y
DuMouchel, W. (1999). Bayesian data mining in large frequency tables, with an application to the FDA spontaneous reporting system. Am. Stat. 53, 177–190. doi:10.1080/00031305.1999.10474456
European Medicines Agency (2025). EudraVigilance: European database of suspected adverse drug reaction reports. Available online at: http://www.adrreports.eu/en/search_subst.html# (Accessed on January 07, 2025).
Evans, S. J., Waller, P. C., and Davis, S. (2001). Use of proportional reporting ratios (PRRs) for signal generation from spontaneous adverse drug reaction reports. Pharmacoepidemiol Drug Saf. 10, 483–486. doi:10.1002/pds.677
Fusaroli, M., Salvo, F., Begaud, B., AlShammari, T. M., Bate, A., Battini, V., et al. (2024). The reporting of a disproportionality analysis for drug safety signal detection using individual case safety reports in PharmacoVigilance (READUS-PV): Development and Statement. Drug Saf. 47, 575–584. doi:10.1007/s40264-024-01421-9
Gagne, J. J., Rassen, J. A., Walker, A. M., Glynn, R. J., and Schneeweiss, S. (2012). Active safety monitoring of new medical products using electronic healthcare data: selecting alerting rules. Epidemiology 23 (2), 238–246. doi:10.1097/EDE.0b013e3182459d7d
Gu, J. H., and Samarneh, M. (2025). Dose-dependent pancreatitis risk associated with GLP-1 agonists. J. Diabetes Metab. Disord. 24, 33. doi:10.1007/s40200-024-01552-x
Hatano, M., Yamada, K., Matsuzaki, H., Yokoi, R., Saito, T., and Yamada, S. (2023). Analysis of clozapine-induced seizures using the Japanese adverse drug event report database. PLoS One 18, e0287122. doi:10.1371/journal.pone.0287122
Khouri, C., Revol, B., Lepelley, M., Mouffak, A., Bernardeau, C., Salvo, F., et al. (2021a). A meta-epidemiological study found lack of transparency and poor reporting of disproportionality analyses for signal detection in pharmacovigilance databases. J. Clin. Epidemiol. 139, 191–198. doi:10.1016/j.jclinepi.2021.07.014
Khouri, C., Petit, C., Tod, M., Lepelley, M., Revol, B., Roustit, M., et al. (2021b). Adverse drug reaction risks obtained from meta-analyses and pharmacovigilance disproportionality analyses are correlated in most cases. J. Clin. Epidemiol. 134, 14–21. doi:10.1016/j.jclinepi.2021.01.015
Mokbel, K., Daniels, R., Weedon, M. N., and Jackson, L. (2022). A Comparative safety analysis of Medicines based on the UK pharmacovigilance and general practice prescribing data in England. Vivo 36, 780–800. doi:10.21873/invivo.12765
Mouffak, A., Lepelley, M., Revol, B., Bernardeau, C., Salvo, F., Pariente, A., et al. (2021). High prevalence of spin was found in pharmacovigilance studies using disproportionality analyses to detect safety signals: a meta-epidemiological study. J. Clin. Epidemiol. 138, 73–79. doi:10.1016/j.jclinepi.2021.06.022
Noguchi, Y., and Yoshimura, T. (2024). Detection algorithms for Simple Two-group Comparisons using spontaneous reporting systems. Drug Saf. 47, 535–543. doi:10.1007/s40264-024-01404-w
Noguchi, Y., Tachi, T., and Teramachi, H. (2021a). Detection algorithms and attentive points of safety signal using spontaneous reporting systems as a clinical data source. Brief. Bioinform 22, bbab347. doi:10.1093/bib/bbab347
Noguchi, Y., Yoshizawa, S., Aoyama, K., Kubo, S., Tachi, T., and Teramachi, H. (2021b). Verification of the “Upward Variation in the reporting odds ratio scores” to detect the signals of drug-drug Interactions. Pharmaceutics 13, 1531. doi:10.3390/pharmaceutics13101531
Noguchi, Y., Tachi, T., and Yoshimura, T. (2025). Caveats of covariate adjustment in disproportionality analysis for best practices. Drug Saf. 48, 1–5. doi:10.1007/s40264-024-01473-x
Pham, P., Cheng, C., Wu, E., Kim, I., Zhang, R., Ma, Y., et al. (2021). Leveraging case Narratives to enhance patient age Ascertainment from adverse event reports. Pharm. Med. 35, 307–316. doi:10.1007/s40290-021-00398-5
Pharmaceuticals and Medical Devices Agency (2021). Pharmaceuticals and medical Devices agency, Japanese adverse drug event report database. Available online at: https://www.info.pmda.go.jp/fukusayoudb/CsvDownload.jsp (Accessed on 07 January 2025).
Rothman, K. J., Lanes, S., and Sacks, S. T. (2004). The reporting odds ratio and its advantages over the proportional reporting ratio. Pharmacoepidemiol Drug Saf. 13, 519–523. doi:10.1002/pds.1001
Urushihara, H. (2019). Basic dos and don’ts in Applying signal detection methods to spontaneous reporting systems databases. Jpn. J. Drug Inf. 21, 135–141. doi:10.11256/jjdi.21.135
US Food and Drug Administration (2025). The FAERS public dashboard and its value to the pharmaceutical industry. Available online at: https://www.fda.gov/drugs/questions-and-answers-fdas-adverse-event-reporting-system-faers/fda-adverse-event-reporting-system-faers-public-dashboard (Accessed on January 07, 2025).
WHO-UMC (2025). VigiBase, WHO-UMC. Available online at: https://who-umc.org/vigibase/(Accessed on 07 January 2025).
Keywords: disproportionality analysis, spontaneous reporting database, drug-related adverse events, dose-dependent, signals of disproportionate reporting (SDR)
Citation: Noguchi Y, Tachi T and Yoshimura T (2025) Is it appropriate to conduct a disproportionality analysis using a spontaneous reporting database to investigate whether drug-related adverse events are dose-dependent?. Front. Pharmacol. 16:1563524. doi: 10.3389/fphar.2025.1563524
Received: 20 January 2025; Accepted: 19 August 2025;
Published: 29 August 2025.
Edited by:
Wei Wei, Zhongjiang People’s Hospital, ChinaReviewed by:
Kinan Mokbel, University of Exeter, United KingdomCopyright © 2025 Noguchi, Tachi and Yoshimura. This is an open-access article distributed under the terms of the Creative Commons Attribution License (CC BY). The use, distribution or reproduction in other forums is permitted, provided the original author(s) and the copyright owner(s) are credited and that the original publication in this journal is cited, in accordance with accepted academic practice. No use, distribution or reproduction is permitted which does not comply with these terms.
*Correspondence: Yoshihiro Noguchi, bm9ndWNoaXlAZ2lmdS1wdS5hYy5qcA==
†ORCID: Yoshihiro Noguchi, orcid.org/0000-0002-9110-9604; Tomoya Tachi, orcid.org/0000-0002-5380-0218; Tomoaki Yoshimura, orcid.org/0009-0008-2486-8169