Abstract
Introduction:
Protein–protein interactions (PPIs) are critical for understanding the molecular mechanisms underlying various biological processes, particularly in microbes associated with cardiovascular disease. Traditional experimental methods for detecting PPIs are often time-consuming and costly, leading to an urgent need for reliable computational approaches.
Methods:
In this study, we present a novel model, the deep denoising autoencoder for protein–protein interaction (DAEPPI), which leverages the denoising autoencoder and the CatBoost algorithm to predict PPIs from the evolutionary information of protein sequences.
Results:
Our extensive experiments demonstrate the effectiveness of the DAEPPI model, achieving average prediction accuracies of 97.85% and 98.49% on yeast and human datasets, respectively. Comparative analyses with existing effective methods further validate the robustness and reliability of our model in predicting PPIs.
Discussion:
Additionally, we explore the application of DAEPPI in the context of cardiovascular disease, showcasing its potential to uncover significant interactions that could contribute to the understanding of disease mechanisms. Our findings indicate that DAEPPI is a powerful tool for advancing research in proteomics and could play a pivotal role in the identification of novel therapeutic targets in cardiovascular disease.
1 Introduction
Cardiovascular diseases (CVDs) are a major global health challenge, accounting for a significant proportion of morbidity and mortality. These diseases encompass a range of conditions affecting the heart and blood vessels, including coronary artery disease, heart failure, and stroke (Tada et al., 2022; Gaidai et al., 2023). The multifactorial nature of CVDs is influenced by various elements, such as genetic predispositions, lifestyle factors, and environmental exposures (Dale et al., 2023; Ojeda-Granados et al., 2024). At the molecular level, proteins play a pivotal role in the pathophysiology of CVDs as they are integral to processes such as inflammation, lipid metabolism, and vascular function (Frąk et al., 2022). Understanding the intricate relationships between these proteins and their interactions is crucial for unraveling the mechanisms underlying cardiovascular pathologies. Thus, the study of protein–protein interactions (PPIs) holds significant promise for advancing our knowledge of CVDs and identifying potential therapeutic targets (Greenblatt et al., 2024).
The importance of PPIs has garnered increasing attention within the scientific community, positioning them as a focal point in biological research. Experimental methods for large-scale PPI identification, such as yeast two-hybrid screening (Wong et al., 2017) and affinity purification coupled with mass spectrometry (Zhong et al., 2023), have been developed to explore these interactions. However, these biological techniques often suffer from limitations, including high costs, time demands, and the potential for false-positive or false-negative results. Consequently, there has been a growing need for effective computational methods to predict PPIs, offering a complementary approach that can enhance the accuracy and efficiency of PPI identification (Xian and Wang, 2024).
Numerous computational strategies have emerged (Guo et al., 2024; Wei et al., 2024), leveraging a wide variety of data types to predict PPIs. For example, You et al. (2013) proposed a PCA-EELM model, which extracts features from protein sequences by autocovariance scores, conjoint triad scores, local descriptor scores, and autocorrelation scores and then combines PCA and ensemble ELM to predict PPIs. Li et al. (2020) adopted a weighted ELM integrated with a scale-invariant feature transform algorithm for accurate prediction. Zhang et al. (2019) implemented an ensemble deep neural network model that leveraged three representative protein feature extraction descriptors combined with a separate deep neural network, achieving high accuracy in predicting PPIs. Hashemifar et al. (2018) presented a sequence-based deep learning framework, DPPI, which combines convolutional and random projection modules in order to enhance the prediction accuracy. Halder et al. (2020) developed a new method called JUPPI, which takes the sequence, GO, and structural domain information of proteins as input features; constructs a high-quality negative PPI dataset by the proposed three-stage filtering strategy; and combines it with a random forest classifier to achieve remarkable results in detecting PPIs of the human proteome. Ma et al. (2024) employed CollaPPI, a collaborative learning framework with information sharing, to predict PPIs, which showed the cross-domain knowledge complementarity of collaborative learning methods in this task. Despite the significant advancements in these computational methods, challenges remain in improving the efficiency and accuracy of PPI predictions. As the volume of protein sequence data continues to increase exponentially, there is an increasing need for effective models that can operate solely on sequence information. This emphasizes the importance of ongoing research to refine and develop innovative computational techniques for PPI prediction, ensuring they can meet the demands of the scientific community.
In this study, we introduce a novel computational model, the deep denoising autoencoder for protein–protein interaction (DAEPPI), which is designed to predict PPIs by utilizing evolutionary information extracted from amino acid sequences. We provide a detailed breakdown of the model architecture and its components, highlighting how each aspect contributes to its predictive capability. Our extensive experimental validation showcases the model’s effectiveness in predicting PPIs, with impressive performance results on both yeast and human datasets. Furthermore, we present comparative experiments that underscore the reliability of the DAEPPI model. Notably, we explore its application in the context of cardiovascular diseases, demonstrating its potential implications for understanding protein interactions that contribute to these conditions. In conclusion, through this research, we aim to further elucidate the role of PPIs in cardiovascular disease mechanisms and their significance for future therapeutic strategies.
2 Materials and methods
2.1 Data sources
In this study, we constructed two comprehensive PPI datasets from distinct organisms: Saccharomyces cerevisiae (yeast) and Homo sapiens (human). The yeast dataset was sourced from the Database of Interacting Proteins (DIP) (Salwinski et al., 2004), where we carefully filtered out protein pairs containing fewer than 50 residues or exhibiting over 40% sequence identity. This rigorous selection process resulted in a positive dataset comprising 5,594 interacting protein pairs, complemented by an equal number of non-interacting pairs derived from proteins with differing subcellular localizations, culminating in a total of 11,188 protein pairs.
For the human dataset, we utilized the Human Protein Reference Database (HPRD). After excluding pairs with more than 25% sequence identity, we identified 3,899 verified interacting pairs among 2,502 unique human proteins. Additionally, we created a negative dataset consisting of 4,262 pairs from 661 distinct proteins, ensuring that these non-interacting proteins were sourced from various subcellular compartments (You et al., 2014). Ultimately, the human dataset comprised a total of 8,161 protein pairs. Together, these datasets provide a robust foundation for evaluating our DAEPPI method in predicting protein interactions across different biological contexts.
2.2 Position-specific scoring matrix
The position-specific scoring matrix (PSSM) (Liu and Steinegger, 2023) is a powerful tool widely used for identifying distantly homologous proteins, as well as for sequence-level studies such as sequence alignment and conservation analysis. In our research, we employed PSSM to enhance the prediction of PPIs. Each protein sequence was converted into a PSSM using the position-specific iterated basic local alignment search tool (PSI-BLAST) (Altschul et al., 1997; Jin et al., 2021). The PSSM is structured as an matrix, where L represents the length of the protein sequence, and the 20 columns correspond to the standard amino acids. The PSSM of a protein sequence is defined as follows:where each element in the matrix provides a score for the j-th amino acid at the i-th position, which is calculated based on the frequency of amino acids at that position and their evolutionary substitutions. To construct this matrix effectively, we configured PSI-BLAST with an e-value threshold of 0.001 and conducted three iterations to ensure a comprehensive collection of homologous sequences. By utilizing PSSM, we can not only capture the conserved patterns within protein sequences but also utilize the evolutionary information encoded within protein sequences to improve the accuracy of the PPI prediction task.
2.3 Deep denoising autoencoder
After obtaining the PSSM of a protein sequence, we need to perform feature extraction on it to represent each protein effectively. However, since the length of protein sequences is not fixed, the size of the constructed PSSM matrices will be different, which makes it impossible to directly input them into the deep learning model. To solve this problem, we adopt a uniform-sized PSSM matrix , i.e., by introducing transposed PSSMs and thus transforming each PSSM into a matrix of fixed size. This process can be formulated as follows:
Next, in this study, we employed the denoising autoencoder (DAE) algorithm (Vincent et al., 2008; Peng et al., 2023) to extract deeper feature representations of protein sequences from the generated matrix.
From a mathematical point of view, the process of encoding can be defined as follows:Here, denotes the non-linear activation function, denotes the original input, denotes the weight of the encoder, and denotes the bias of the encoder. Similarly, the output of the decoder can be defined as follows:where the encoder compresses the input into a potential space corresponding to the feature we want to learn, and then the latent structure is reinstated in the decoded output via the decoder. Here, denotes the bias of the decoder, and denotes the weight of the decoder. For an original training dataset , the entire training phase of the encoder–decoder framework can be described as follows:
The DAE model is particularly effective for this purpose as it enhances the robustness of the feature representation by reconstructing inputs that have been intentionally corrupted with noise. This process also involves two primary phases: encoding and decoding. Formally, the DAE first adds noise to the original data to form the corrupted input . This process can be realized using a stochastic mapping , which can be expressed as follows:
Then, as in the case of the autoencoder, the corrupted input is mapped to the hidden representation through the encoder , which is denoted as follows:
Consequently, we use the decoder in the decoding process to reconstruct the uncorrupted by mapping to the learned , which is denoted as follows:where is the sigmoid nonlinear activation function of the decoder, denoted as follows:
After obtaining the uncorrupted input , the DAE determines the reconstruction data loss and continuously optimizes the model parameters by calculating the minimized squared error between the original input and , as follows:
Ultimately, by taking the PSSM of protein sequences as input and then performing encoding–decoding operations, DAE ensures that the learned features are not only lower-dimensional but also more representative of the underlying biological information. Thus, we can enhance our DAEPPI computational model to fully utilize the evolutionary insights embedded within the PSSM.
2.4 Categorical boosting (CatBoost)
In our classification task for predicting protein interactions, we used the CatBoost algorithm, a powerful gradient-boosting framework that excels in handling categorical features. CatBoost builds on the traditional gradient boosting decision tree (GBDT) method, employing oblivious trees as base learners to enhance the accuracy and generalization while effectively addressing issues such as gradient bias and prediction shift (Dorogush et al., 2018; Zhang et al., 2023). CatBoost handles categorical features well and allows training on the entire original dataset. The CatBoost algorithm computes the categorical features by first randomly permuting the given raw data into and then substituting it with the following numerical features:where denotes the a priori value, denotes the weight of the a priori value, represents the category features, and represents the label of the corresponding feature.
To classify the features extracted from the DAE, we first prepared our dataset by combining the DAE-derived feature representations with the corresponding labels. These features, which capture the essential characteristics of the proteins, were then input into the CatBoost classifier. The model was trained several times to learn the relationship between features and their labels to further optimize the hyperparameters of the task. One of the significant advantages of CatBoost is its ability to process categorical variables directly during the training phase, which eliminates the need for extensive preprocessing. By employing target statistics and ordered boosting, CatBoost minimizes information loss, while enriching the feature space, allowing for a more nuanced understanding of the data. This robust classification strategy enabled us to accurately predict protein interactions based on the rich feature representations learned from the DAE, ultimately improving the reliability of our PPI predictions.
2.5 Evaluation measures
To verify the validity of the constructed DAEPPI model, we used four classical evaluation criteria for measurement (Liang et al., 2025). They are accuracy (ACC), precision (PE), sensitivity (SN), and Matthews correlation coefficient (MCC), which are defined as follows:Here, (true positive) refers to true interacting pairs that are predicted to interact by the DAEPPI model, (true negative) refers to true non-interacting pairs that are predicted to have no interaction by the DAEPPI model, (false positive) refers to pairs that are predicted to interact by the DAEPPI model but do not actually have an interaction, and (false negative) refers to pairs that are predicted to be non-interacting by the DAEPPI model but are actually interacting pairs. Furthermore, we calculated the receiver operating characteristic (ROC) curve and the area under the ROC curve (AUC) (Li et al., 2022a) of DAEPPI on two benchmark PPI datasets to further evaluate the stability of DAEPPI. The flowchart of the DAEPPI model is shown in Figure 1.
FIGURE 1
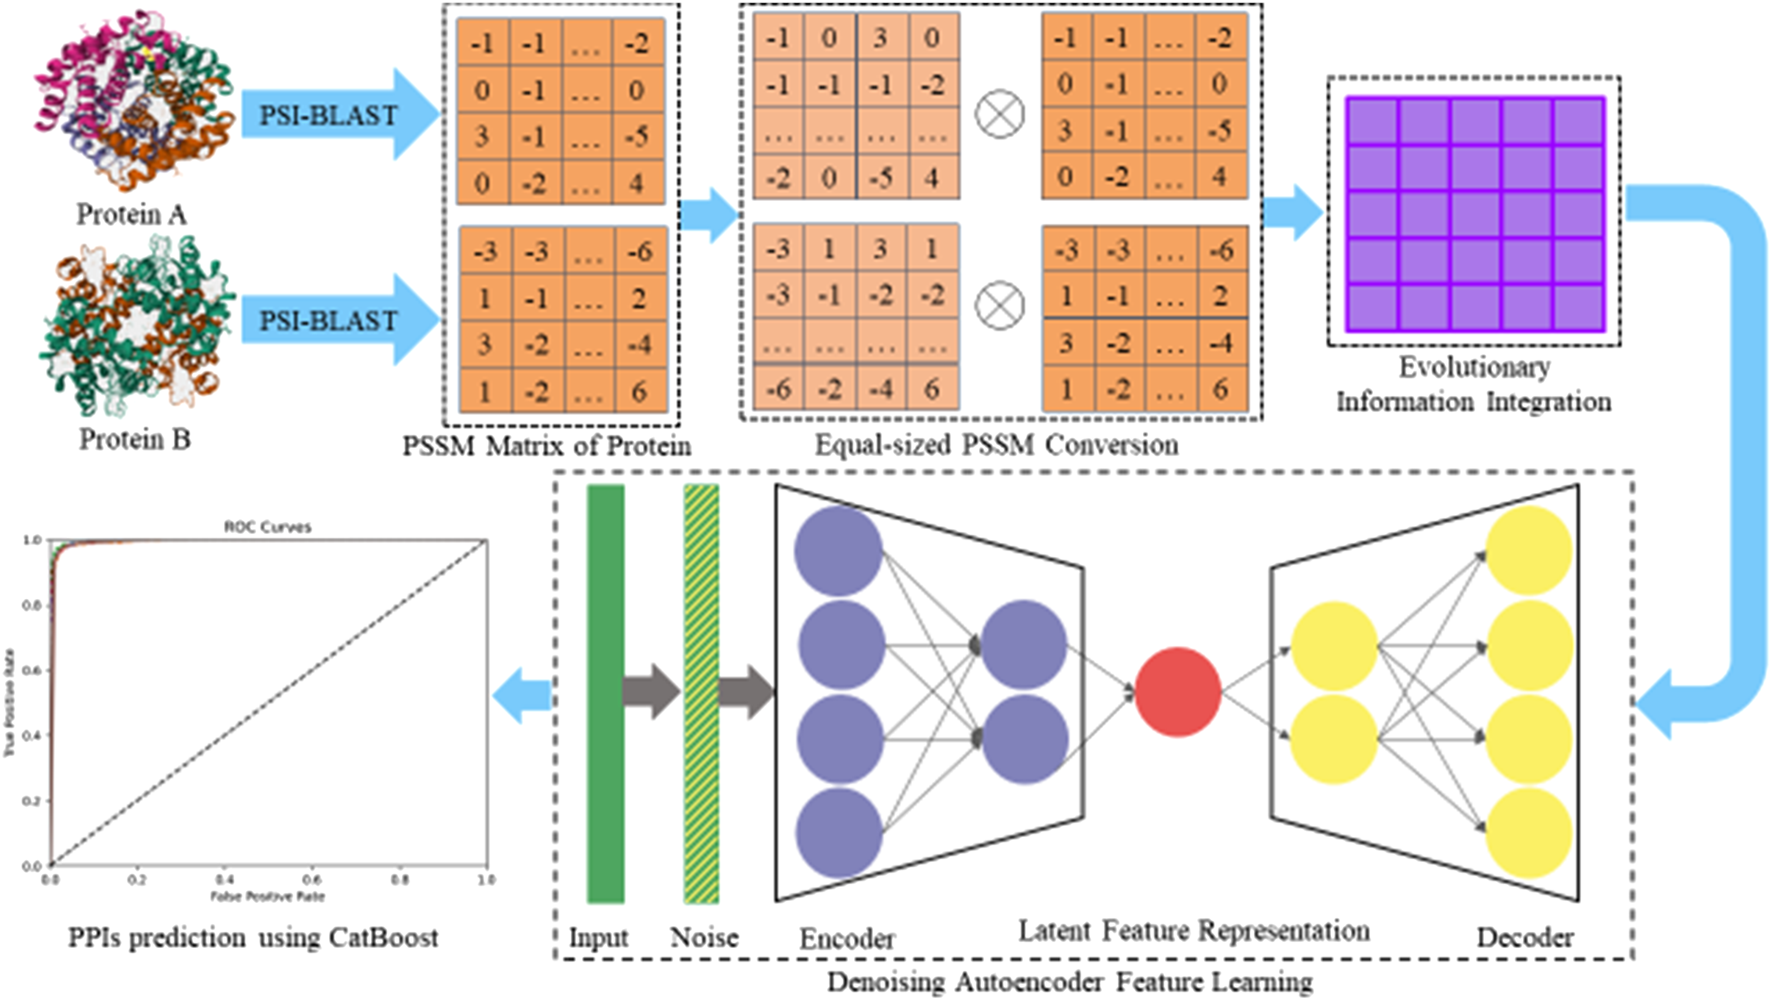
Flowchart of the DAEPPI algorithm.
3 Results and discussion
3.1 Assessment of prediction
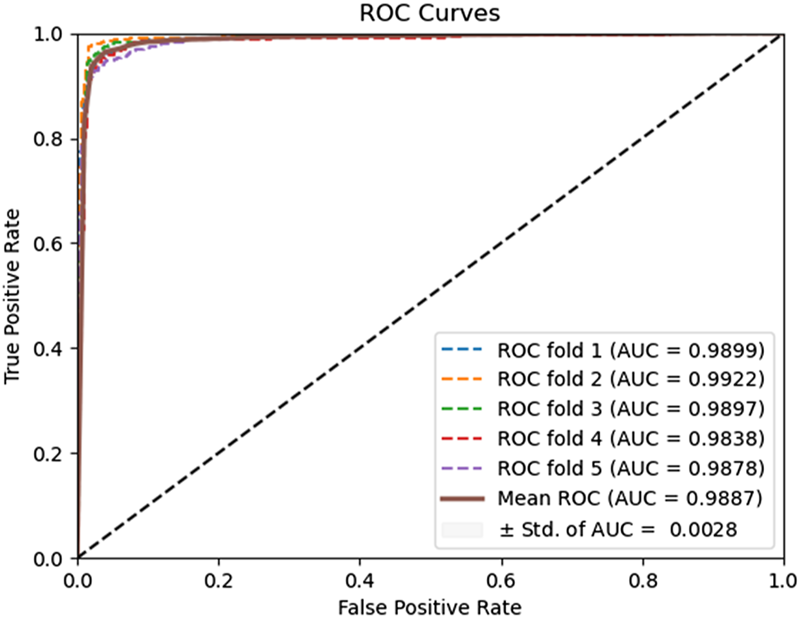
To evaluate the predictive performance of our proposed DAEPPI model, which integrates PSSM, DAE, and CatBoost, we conducted extensive assessments on the Yeast and Human datasets using five-fold cross-validation. This method allowed us to partition each dataset into five distinct subsets, ensuring that our model was tested across multiple scenarios for robustness. The results demonstrated that the DAEPPI model achieved impressive performance metrics, as shown in Tables 1–3. For the yeast dataset, we recorded an average ACC of 0.9785, along with PE and SN values of 0.9707 and 0.9870, respectively. The AUC reached 0.9985, indicating a strong predictive capability. Similarly, on the Human dataset, the model maintained high performance, achieving an average ACC of 0.9849, a PE of 0.9929, and an AUC of 0.9989. The standard deviations for these metrics were notably low, reflecting the stability and reliability of our model across different training and testing folds, which further confirms the model’s effectiveness in distinguishing between positive and negative PPIs. The ROC curves of the DAEPPI model on the Yeast and Human datasets are shown in Figures 2, 3. Overall, these results underscore the robustness and accuracy of the DAEPPI model, attributing its success to the effective feature extraction capabilities of the DAE and the powerful classification strength of CatBoost. The integration of evolutionary information through PSSM, combined with advanced machine learning techniques, positions our model as a valuable tool for predicting protein interactions.
TABLE 1
| Testing set | ACC | PE | SN | MCC | AUC |
|---|---|---|---|---|---|
| 1 | 0.9759 | 0.9708 | 0.9812 | 0.9518 | 0.9982 |
| 2 | 0.9777 | 0.9668 | 0.9893 | 0.9556 | 0.9982 |
| 3 | 0.9794 | 0.9669 | 0.9929 | 0.9592 | 0.9988 |
| 4 | 0.9759 | 0.9692 | 0.9830 | 0.9518 | 0.9984 |
| 5 | 0.9839 | 0.9796 | 0.9884 | 0.9679 | 0.9989 |
| Average | 0.9785 ± 0.0030 | 0.9707 ± 0.0047 | 0.9870 ± 0.0043 | 0.9573 ± 0.0060 | 0.9985 ± 0.0003 |
Performance of DAEPPI on the Yeast dataset.
TABLE 2
| Testing set | ACC | PE | SN | MCC | AUC |
|---|---|---|---|---|---|
| 1 | 0.9859 | 0.9922 | 0.9782 | 0.9718 | 0.9993 |
| 2 | 0.9816 | 0.9921 | 0.9692 | 0.9634 | 0.9988 |
| 3 | 0.9859 | 0.9935 | 0.9769 | 0.9719 | 0.9987 |
| 4 | 0.9871 | 0.9948 | 0.9782 | 0.9743 | 0.9988 |
| 5 | 0.9841 | 0.9922 | 0.9743 | 0.9682 | 0.9987 |
| Average | 0.9849 ± 0.0019 | 0.9929 ± 0.0011 | 0.9754 ± 0.0034 | 0.9699 ± 0.0038 | 0.9989 ± 0.0002 |
Performance of DAEPPI on the Human dataset.
TABLE 3
| Datasets | Method | ACC (%) | PE (%) | SN (%) | MCC (%) | AUC (%) |
|---|---|---|---|---|---|---|
| Yeast | Zero padding | 78.16 ± 0.38 | 78.06 ± 0.41 | 78.35 ± 1.07 | 56.34 ± 0.77 | 86.36 ± 0.39 |
| DAEPPI | 97.85 ± 0.30 | 97.07 ± 0.47 | 98.70 ± 0.43 | 95.73 ± 0.60 | 99.85 ± 0.03 | |
| Human | Zero padding | 79.99 ± 0.90 | 80.74 ± 0.92 | 76.33 ± 1.53 | 59.90 ± 1.80 | 88.65 ± 1.02 |
| DAEPPI | 98.49 ± 0.19 | 99.29 ± 0.11 | 97.54 ± 0.34 | 96.99 ± 0.38 | 99.89 ± 0.02 |
Performance comparison of DAEPPI with different PSSM conversion methods.
FIGURE 2
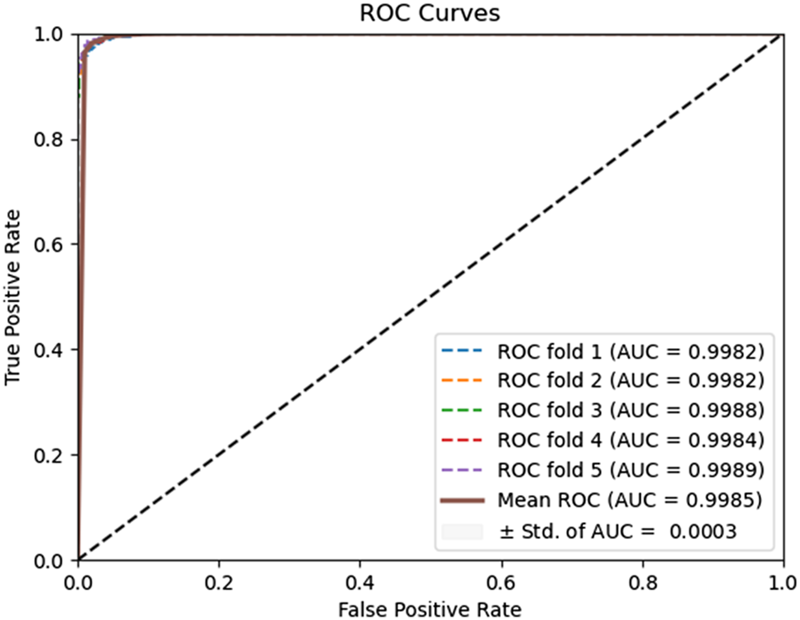
ROC curves of DAEPPI performed on the Yeast dataset.
FIGURE 3
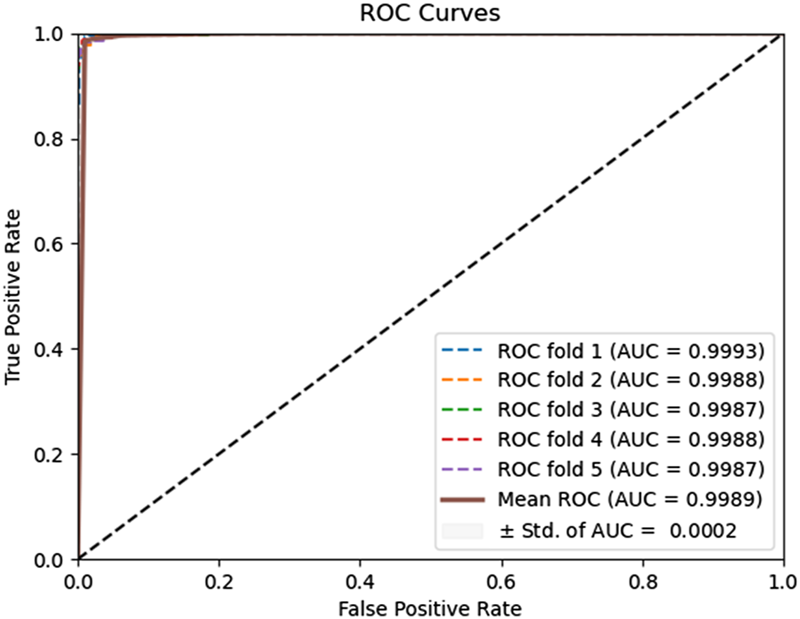
ROC curves of DAEPPI performed on the Human dataset.
3.2 Comparison with different PSSM transformations
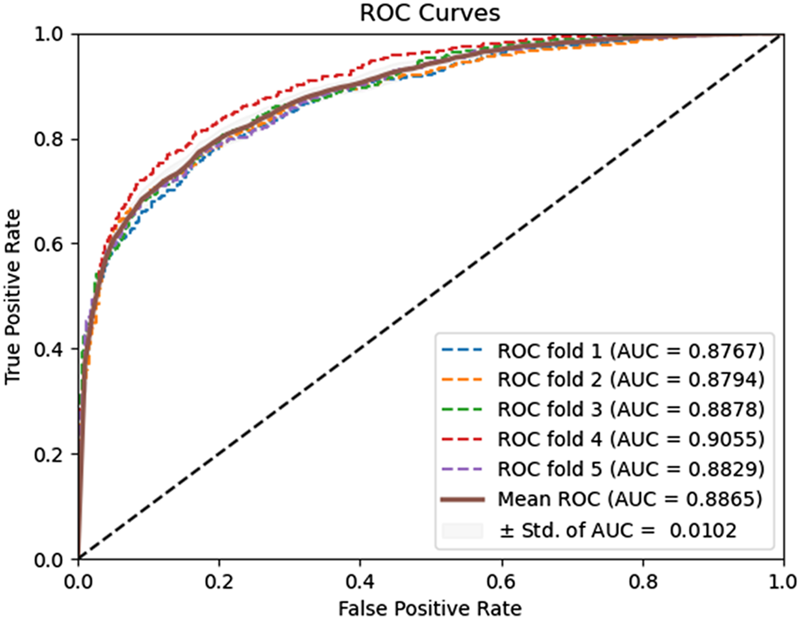
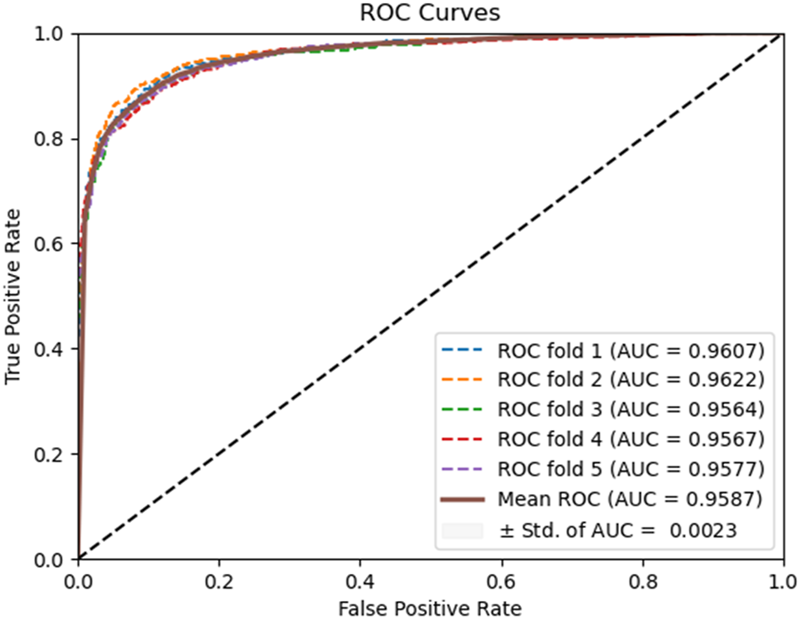
In our study, the DAEPPI model employs an equal-sized PSSM transformation, specifically the transposition of PSSM against itself. This approach has demonstrated robust predictive performance on both the yeast and human datasets. To further validate the effectiveness of this equal-sized PSSM transformation, we conducted a comparative analysis with a padded PSSM transformation method. Specifically, we adopt the zero padding method (He and Wang, 2022) to transform the PSSM, i.e., when the length of the protein sequence exceeds the number of amino acids, i.e., 20, we truncate the PSSM to construct a PSSM matrix; otherwise, when the length of the protein sequence is lower than the number of amino acids 20, i.e., we need to fill it with zeros. The comparison results are presented in Table 3. The ROC curves of the zero padding method adopted by the model on the Yeast and Human datasets are shown in Figures 4, 5. The experimental results revealed that the equal-size PSSM transformation strategy employed in our model consistently outperforms the zero-padding PSSM transformation method on the two benchmark datasets. Thus, this equal-size transformation enhances the model’s ability to capture the essential features of the protein sequence, leading to improved accuracy and reliability.
FIGURE 4
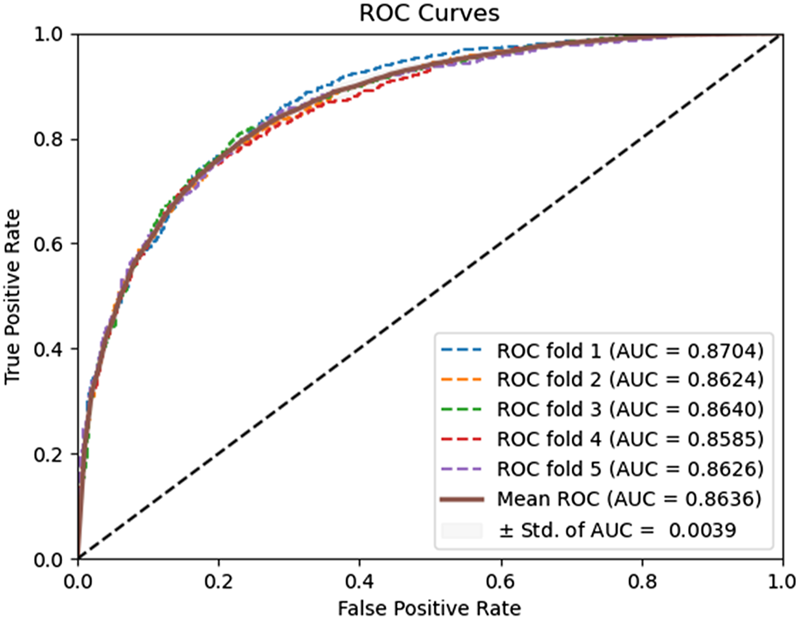
ROC curves performed using the zero padding method on the Yeast dataset.
FIGURE 5
ROC curves performed using the zero padding method on the Human dataset.
3.3 Comparison with different feature extraction
In this experiment, the DAEPPI model utilizes a DAE for in-depth feature extraction from equal-sized PSSM transforms. This approach has shown impressive predictive performance on both yeast and human datasets. To assess the effectiveness of DAE in feature extraction, we compared our model with different feature extraction methods on the same datasets. Specifically, we employed histogram of oriented gradient (HOG) (Admass et al., 2024) for feature extraction from the equal-sized PSSM, while still utilizing CatBoost for predicting PPIs. HOG is a feature descriptor that captures the distribution of gradients in localized portions of an image, making it effective for edge detection and object recognition. The prediction performance of the HOG-based feature extraction model on the benchmark dataset is shown in Table 4. It achieves an average ACC and AUC of 89.22% and 95.87%, respectively, on the Yeast dataset, while attaining 95.31% and 98.87% on the Human dataset, respectively. The ROC curves of the HOG-based feature extraction method on the Yeast and Human datasets are shown in Figures 6, 7. These comparisons suggest that the HOG-based feature extraction model’s performance in capturing intricate evolutionary information in biological data is notably inferior to that of the DAE approach employed in the model. In conclusion, the comparative analysis highlights the superior effectiveness of the DAE-based feature extraction approach in our DAEPPI model. This reinforces the importance of selecting appropriate feature extraction techniques in enhancing the model performance for predicting protein interactions.
TABLE 4
| Datasets | Method | ACC (%) | PE (%) | SN (%) | MCC (%) | AUC (%) |
|---|---|---|---|---|---|---|
| Yeast | HOG feature | 89.22 ± 0.68 | 90.68 ± 0.82 | 87.43 ± 1.02 | 78.50 ± 1.36 | 95.87 ± 0.23 |
| DAEPPI | 97.85 ± 0.30 | 97.07 ± 0.47 | 98.70 ± 0.43 | 95.73 ± 0.60 | 99.85 ± 0.03 | |
| Human | HOG feature | 95.31 ± 0.56 | 97.95 ± 0.44 | 92.10 ± 0.85 | 90.72 ± 1.12 | 98.87 ± 0.28 |
| DAEPPI | 98.49 ± 0.19 | 99.29 ± 0.11 | 97.54 ± 0.34 | 96.99 ± 0.38 | 99.89 ± 0.02 |
Performance comparison of DAEPPI with different feature extraction methods.
FIGURE 6
ROC curves performed using the HOG feature extraction method on the Yeast dataset.
FIGURE 7
ROC curves performed using the HOG feature extraction method on the Human dataset.
3.4 Comparison with different classifiers
In our DAEPPI model, we have leveraged CatBoost to predict the intricate features extracted by the DAE, resulting in enhanced performance in predicting PPIs on two benchmark datasets. To validate the effectiveness of CatBoost as our chosen classifier, we conducted comparative experiments on the Yeast dataset, substituting CatBoost with several other classification algorithms. Specifically, we replaced CatBoost with naive Bayes (NB), linear discriminant analysis (LDA), support vector machine (SVM), decision tree (DT), and k-nearest neighbors (KNN), while maintaining all other parameters constant. Our comparison results are shown in Table 5. As can be seen, the DAEPPI model with CatBoost outperformed all other classifiers on the Yeast dataset, demonstrating superior predictive accuracy and reliability for PPIs. This highlights the significant advantage of using CatBoost within our framework, reinforcing its effectiveness over traditional classifiers such as NB, LDA, SVM, DT, and KNN in the context of PPI prediction. In summary, the findings from this analysis validate the choice of CatBoost as a classifier in the DAEPPI model, showcasing its capability to yield better performance in predicting protein interactions compared to other established algorithms.
TABLE 5
| Models | ACC | PE | SN | MCC | AUC |
|---|---|---|---|---|---|
| NB | 0.8737 ± 0.0011 | 0.9913 ± 0.0195 | 0.7566 ± 0.1368 | 0.7754 ± 0.1013 | 0.9946 ± 0.0011 |
| LDA | 0.7641 ± 0.0042 | 0.7256 ± 0.0042 | 0.8495 ± 0.0066 | 0.5361 ± 0.0085 | 0.8309 ± 0.0055 |
| SVM | 0.9573 ± 0.0064 | 0.9385 ± 0.0319 | 0.9807 ± 0.0372 | 0.9174 ± 0.0119 | 0.9984 ± 0.0003 |
| DT | 0.9649 ± 0.0039 | 0.9583 ± 0.0056 | 0.9721 ± 0.0083 | 0.9299 ± 0.0078 | 0.9875 ± 0.0046 |
| KNN | 0.9663 ± 0.0038 | 0.9708 ± 0.0069 | 0.9616 ± 0.0038 | 0.9327 ± 0.0076 | 0.9970 ± 0.0004 |
| CatBoost | 0.9785 ± 0.0030 | 0.9707 ± 0.0047 | 0.9870 ± 0.0043 | 0.9573 ± 0.0060 | 0.9985 ± 0.0003 |
Performance comparison of DAEPPI with different classifiers on the Yeast dataset.
3.5 Comparison with other methods
The DAEPPI model leverages a DAE to extract evolutionary features from the PSSM of protein sequences, combined with CatBoost to enhance the prediction of PPIs. To validate the effectiveness of our model, we conducted a comparative analysis with existing methods on both the Yeast and Human datasets, employing five-fold cross-validation for consistency. Numerous computational methods have been developed for PPI detection, particularly utilizing machine learning algorithms that have garnered significant attention. In this section, we present a comparison between our proposed method and several established models to assess their predictive capabilities. Tables 6, 7 summarize the results obtained from different methods on the Yeast and Human datasets, respectively. From Table 6, it is evident that the accuracy of the existing methods ranges from 90.07% to 96.03%, with sensitivity values between 88.82% and 93.51%, and MCC spanning from 82.10% to 91.83%. In contrast, our DAEPPI model achieved impressive metrics, with an average accuracy of 97.85%, an average sensitivity of 98.70%, and an average MCC of 95.73% on the Yeast dataset. Similarly, the results on the Human dataset, detailed in Table 7, reflect the superiority of our method. The DAEPPI model attained an average accuracy of 98.49%, a precision of 99.29%, and an MCC of 96.99%. This indicates a significant improvement over the existing models. In conclusion, the comparative analysis demonstrates that the DAEPPI model is a robust and reliable approach for predicting PPIs. Its ability to effectively capture evolutionary features through DAE and utilize CatBoost for prediction contributes to its outstanding performance on both datasets, establishing it as a leading method in the field of PPI detection.
TABLE 6
| Models | ACC | PE | SN | MCC |
|---|---|---|---|---|
| OLPP-RoF (Li et al., 2021b) | 0.9007 ± 0.0060 | 0.9024 ± 0.0056 | 0.8983 ± 0.0141 | 0.8210 ± 0.0097 |
| DeepFE-PPI (Yao et al., 2019) | 0.9478 ± 0.0061 | 0.9645 ± 0.0087 | 0.9299 ± 0.0066 | 0.8962 ± 0.0123 |
| WSRC (Huang et al., 2016) | 0.9250 ± 0.0059 | 0.9587 ± 0.0089 | 0.8882 ± 0.0098 | 0.8609 ± 0.0102 |
| DeepPPI (Du et al., 2017) | 0.9443 ± 0.0030 | 0.9665 ± 0.0059 | 0.9206 ± 0.0036 | 0.8897 ± 0.0062 |
| MatFLDA_RFs (Li et al., 2022b) | 0.9503 ± 0.0025 | 0.9914 ± 0.0026 | 0.9084 ± 0.0047 | 0.9052 ± 0.0045 |
| MARPPI (Li et al., 2023) | 0.9603 ± 0.0076 | 0.9812 ± 0.0098 | 0.9351 ± 0.0122 | 0.9183 ± 0.0132 |
| DAEPPI | 0.9785 ± 0.0030 | 0.9707 ± 0.0047 | 0.9870 ± 0.0043 | 0.9573 ± 0.0060 |
Comparative results of other methods on the Yeast dataset.
TABLE 7
| Models | ACC | PE | SN | MCC |
|---|---|---|---|---|
| OLPP-RoF (Li et al., 2021b) | 0.9609 ± 0.0024 | 0.9656 ± 0.0036 | 0.9520 ± 0.0034 | 0.9247 ± 0.0046 |
| WSRC (Huang et al., 2016) | 0.9554 ± 0.0032 | 0.9895 ± 0.0025 | 0.9165 ± 0.0074 | 0.9141 ± 0.0058 |
| RPEC (Song et al., 2018) | 0.9659 ± 0.0124 | 0.9618 ± 0.0117 | 0.9672 ± 0.0141 | 0.9318 ± 0.0249 |
| LPQ-RoF (Wong et al., 2015) | 0.9796 ± 0.0022 | 0.9835 ± 0.0061 | 0.9732 ± 0.0073 | 0.9600 ± 0.0040 |
| GWORVM (An et al., 2019) | 0.9456 ± 0.0052 | 0.9308 ± 0.0109 | 0.9555 ± 0.0091 | 0.8951 ± 0.0114 |
| GSRVM (An et al., 2019) | 0.9215 ± 0.0120 | 0.9108 ± 0.0079 | 0.9178 ± 0.0152 | 0.8545 ± 0.0235 |
| GARVM (An et al., 2019) | 0.9303 ± 0.0088 | 0.9473 ± 0.0213 | 0.9059 ± 0.0120 | 0.8612 ± 0.0145 |
| PSORVM (An et al., 2019) | 0.9350 ± 0.0090 | 0.9640 ± 0.0138 | 0.9191 ± 0.0112 | 0.8802 ± 0.0103 |
| SIFT-WELM (Li et al., 2020) | 0.9760 ± 0.0057 | 0.9622 ± 0.0106 | 0.9894 ± 0.0029 | 0.9523 ± 0.0112 |
| DAEPPI | 0.9849 ± 0.0019 | 0.9929 ± 0.0011 | 0.9754 ± 0.0034 | 0.9699 ± 0.0038 |
Comparative results of other methods on the Human dataset.
3.6 Case studies
CVDs are a leading cause of morbidity and mortality worldwide, characterized by a range of disorders affecting the heart and blood vessels. The complexity of these diseases necessitates a deeper understanding of the molecular interactions that underpin their development and progression (Nasirian and Menichetti, 2023). Previous studies have increasingly highlighted the critical role of PPIs in cardiovascular health, showcasing how alterations in these interactions can contribute to various cardiovascular conditions (Singh et al., 2019). Numerous studies have identified various molecules associated with diseases, including non-coding RNAs (Wang et al., 2023) and protein molecules. In particular, these studies have revealed a strong connection between specific PPIs and cardiovascular disease. For example, interactions involving proteins such as VEGF and its receptors have been implicated in angiogenesis (Li Q. et al., 2021), while proteins involved in lipid metabolism, such as apolipoproteins, are crucial for maintaining vascular health (Mehta and Shapiro, 2022). These insights underscore the importance of exploring the intricate network of PPIs to identify potential biomarkers and therapeutic targets for CVDs.
To further investigate the relevance of the DAEPPI model’s predictions in the context of CVDs, we conducted case study experiments in this section. Our approach involved training the DAEPPI model on the Yeast dataset and subsequently utilizing it to predict PPIs within the Human dataset. The results of the case studies are shown in Table 8, where it can be observed that 11 of the top 15 PPIs predicted by DAEPPI to be associated with CVD have been confirmed by biological experiments. The results revealed several significant PPIs that are closely associated with CVDs, indicating a promising avenue for further research. Through this case study, we aim to demonstrate not only the predictive power of the DAEPPI model but also its potential utility in uncovering critical biological insights that may lead to advancements in CVD prevention and treatment.
TABLE 8
| Rank | Protein a | Protein B | Related cardiovascular disease | Evidence |
|---|---|---|---|---|
| 1 | NP_612384.1 | NP_055105.2 | Cardiac hypertrophy | 28,746,924 |
| 2 | NP_002855.1 | AAA50404.1 | Cardiovascular risk | 37,762,835 |
| 3 | NP_004636.1 | NP_004851.1 | Cardiac arrhythmogenesis | 29,101,288 |
| 4 | NP_478126.1 | NP_002784.1 | Cardiovascular disease | 28,245,982 |
| 5 | NP_066921.2 | NP_001014797.1 | Coronary arterial smooth muscle cells | 32,147,517 |
| 6 | NP_001886.1 | NP_932070.1 | Cardiac hypertrophy | 34,211,403 |
| 7 | NP_892117.1 | NP_006618.1 | Chronic vascular inflammation | 33,178,683 |
| 8 | NP_006752.1 | NP_068660.1 | Cardiovascular disease | Unconfirmed |
| 9 | NP_005569.1 | NP_542159.2 | Heart disease | 23,650,592 |
| 10 | NP_001005.1 | NP_008998.1 | Cardiovascular disease | Unconfirmed |
| 11 | AAH32474.1 | NP_055109.1 | Cardiovascular disease | Unconfirmed |
| 12 | NP_003173.1 | NP_060541.3 | Plasma levels | 10.22391/fppc.779,394 |
| 13 | NP_006592.3 | NP_001017963.1 | Cardiovascular disease | Unconfirmed |
| 14 | NP_000466.2 | NP_004227.1 | Cardiovascular disease | 31,195,722 |
| 15 | NP_060848.2 | NP_733779.1 | Post-myocardial infarction cardiac fibrosis | 38,615,011 |
Top 15 PPIs predicted by DAEPPI to be related to cardiovascular diseases.
4 Conclusion
Machine learning algorithms have become indispensable in the field of proteomics, particularly for predicting PPIs. These computational methods not only enhance accuracy but also streamline the analysis process, saving both time and resources. In this study, we have introduced the DAEPPI model, which leverages a DAE to learn deep evolutionary features from protein sequences represented in PSSM. By integrating these features with the CatBoost algorithm, our model significantly improves the prediction of PPIs. Our extensive experiments demonstrated the effectiveness of the DAEPPI model, showing robust predictive performance on both Yeast and Human datasets. The results indicate that our method consistently outperforms existing techniques, confirming its reliability and accuracy in PPI prediction. Additionally, we conducted comparative experiments and case studies that further validated the DAEPPI model’s effectiveness. Notably, our analysis identified several human PPIs that are closely associated with CVDs, suggesting that the DAEPPI model can not only predict interactions but also uncover potential links to significant health conditions. In conclusion, the DAEPPI model combines deep learning with effective classification techniques to achieve reliable results. We believe that this model will serve as a valuable tool for researchers aiming to explore the intricate networks of protein interactions and their implications in various biological processes.
Statements
Data availability statement
The datasets can be obtained from the corresponding author upon reasonable request.
Author contributions
SZ: writing–original draft. JL: data curation and writing–original draft. MT: methodology and writing–original draft. CL: validation and writing–original draft. YL: formal analysis and writing–review and editing. WH: visualization and writing–review and editing.
Funding
The author(s) declare that financial support was received for the research, authorship, and/or publication of this article. This work was supported in part by the National Science Foundation of China under Grant 62273284.
Acknowledgments
The authors would like to thank all the editors and reviewers for their constructive advices.
Conflict of interest
The authors declare that the research was conducted in the absence of any commercial or financial relationships that could be construed as a potential conflict of interest.
Generative AI statement
The author(s) declare that no generative AI was used in the creation of this manuscript.
Publisher’s note
All claims expressed in this article are solely those of the authors and do not necessarily represent those of their affiliated organizations, or those of the publisher, the editors and the reviewers. Any product that may be evaluated in this article, or claim that may be made by its manufacturer, is not guaranteed or endorsed by the publisher.
References
1
Admass W. S. Munaye Y. Y. Bogale G. A. (2024). Convolutional neural networks and histogram-oriented gradients: a hybrid approach for automatic mango disease detection and classification. Int. J. Inf. Technol.16 (2), 817–829. 10.1007/s41870-023-01605-z
2
Altschul S. F. Madden T. L. Schäffer A. A. Zhang J. Zhang Z. Miller W. et al (1997). Gapped BLAST and PSI-BLAST: a new generation of protein database search programs. Nucleic acids Res.25 (17), 3389–3402. 10.1093/nar/25.17.3389
3
An J.-Y. You Z.-H. Zhou Y. Wang D.-F. (2019). Sequence-based prediction of protein-protein interactions using gray wolf optimizer–based relevance vector machine. Evol. Bioinforma.15, 1176934319844522. 10.1177/1176934319844522
4
Dale C. E. Takhar R. Carragher R. Katsoulis M. Torabi F. Duffield S. et al (2023). The impact of the COVID-19 pandemic on cardiovascular disease prevention and management. Nat. Med.29 (1), 219–225. 10.1038/s41591-022-02158-7
5
Dorogush A. V. Ershov V. Gulin A. (2018). CatBoost: gradient boosting with categorical features support. arXiv, 11363.
6
Du X. Sun S. Hu C. Yao Y. Yan Y. Zhang Y. (2017). DeepPPI: boosting prediction of protein–protein interactions with deep neural networks. J. Chem. Inf. Model.57 (6), 1499–1510. 10.1021/acs.jcim.7b00028
7
Frąk W. Wojtasińska A. Lisińska W. Młynarska E. Franczyk B. Rysz J. (2022). Pathophysiology of cardiovascular diseases: new insights into molecular mechanisms of atherosclerosis, arterial hypertension, and coronary artery disease. Biomedicines10 (8), 1938. 10.3390/biomedicines10081938
8
Gaidai O. Cao Y. Loginov S. (2023). Global cardiovascular diseases death rate prediction. Curr. problems Cardiol.48 (5), 101622. 10.1016/j.cpcardiol.2023.101622
9
Greenblatt J. F. Alberts B. M. Krogan N. J. (2024). Discovery and significance of protein-protein interactions in health and disease. Cell187 (23), 6501–6517. 10.1016/j.cell.2024.10.038
10
Guo L.-X. Wang L. You Z.-H. Yu C.-Q. Hu M.-L. Zhao B.-W. et al (2024). Likelihood-based feature representation learning combined with neighborhood information for predicting circRNA–miRNA associations. Briefings Bioinforma.25 (2), bbae020. 10.1093/bib/bbae020
11
Halder A. K. Bandyopadhyay S. S. Chatterjee P. Nasipuri M. Plewczynski D. Basu S. (2020). JUPPI: a multi-level feature based method for PPI prediction and a refined strategy for performance assessment. IEEE/ACM Trans. Comput. Biol. Bioinforma.19 (1), 531–542. 10.1109/TCBB.2020.3004970
12
Hashemifar S. Neyshabur B. Khan A. A. Xu J. (2018). Predicting protein–protein interactions through sequence-based deep learning. Bioinformatics34 (17), i802–i810. 10.1093/bioinformatics/bty573
13
He Y. Wang S. (2022). SE-BLTCNN: a channel attention adapted deep learning model based on PSSM for membrane protein classification. Comput. Biol. Chem.98, 107680. 10.1016/j.compbiolchem.2022.107680
14
Huang Y.-A. You Z.-H. Chen X. Yan G.-Y. (2016). Improved protein-protein interactions prediction via weighted sparse representation model combining continuous wavelet descriptor and PseAA composition. BMC Syst. Biol.10, 120–494. 10.1186/s12918-016-0360-6
15
Jin X. Liao Q. Wei H. Zhang J. Liu B. (2021). SMI-BLAST: a novel supervised search framework based on PSI-BLAST for protein remote homology detection. Bioinformatics37 (7), 913–920. 10.1093/bioinformatics/btaa772
16
Li J. Shi X. You Z.-H. Yi H.-C. Chen Z. Lin Q. et al (2020). Using weighted extreme learning machine combined with scale-invariant feature transform to predict protein-protein interactions from protein evolutionary information. IEEE/ACM Trans. Comput. Biol. Bioinforma.17 (5), 1546–1554. 10.1109/TCBB.2020.2965919
17
Li Q. Zeng C. Liu H. Yung K. W. Y. Chen C. Xie Q. et al (2021a). Protein-protein interaction inhibitor of SRPKs alters the splicing isoforms of VEGF and inhibits angiogenesis. Iscience24 (5), 102423. 10.1016/j.isci.2021.102423
18
Li X. Han P. Chen W. Gao C. Wang S. Song T. et al (2023). MARPPI: boosting prediction of protein–protein interactions with multi-scale architecture residual network. Briefings Bioinforma.24 (1), bbac524. 10.1093/bib/bbac524
19
Li Y. Hu X.-G. Li P.-P. Wang L. You Z.-H. (2022a). “Predicting circRNA-disease associations using similarity assessing graph convolution from multi-source information networks,” in 2022 IEEE International Conference on Bioinformatics and Biomedicine (BIBM), Las Vegas, NV, USA, 06–08 December, 2022 (IEEE), 94–101.
20
Li Y. Wang Z. Li L.-P. You Z.-H. Huang W.-Z. Zhan X.-K. et al (2021b). Robust and accurate prediction of protein–protein interactions by exploiting evolutionary information. Sci. Rep.11 (1), 16910. 10.1038/s41598-021-96265-z
21
Li Y. Wang Z. You Z.-H. Li L.-P. Hu X. (2022b). Predicting protein-protein interactions via random ferns with evolutionary matrix representation. Comput. Math. Methods Med.2022 (1), 7191684. 10.1155/2022/7191684
22
Liang S.-Z. Wang L. You Z.-H. Yu C.-Q. Wei M.-M. Wei Y. et al (2025). Predicting circRNA–disease associations through multisource domain-aware embeddings and feature projection networks. J. Chem. Inf. Model.65, 1666–1676. 10.1021/acs.jcim.4c02250
23
Liu D. Steinegger M. (2023). Block Aligner: an adaptive SIMD-accelerated aligner for sequences and position-specific scoring matrices. Bioinformatics39 (8), btad487. 10.1093/bioinformatics/btad487
24
Ma W. Bi X. Jiang H. Zhang S. Wei Z. (2024). CollaPPI: a collaborative learning framework for predicting protein-protein interactions. IEEE J. Biomed. Health Inf.28, 3167–3177. 10.1109/JBHI.2024.3375621
25
Mehta A. Shapiro M. D. (2022). Apolipoproteins in vascular biology and atherosclerotic disease. Nat. Rev. Cardiol.19 (3), 168–179. 10.1038/s41569-021-00613-5
26
Nasirian F. Menichetti G. (2023). Molecular interaction networks and cardiovascular disease risk: the role of food bioactive small molecules. Arteriosclerosis, thrombosis, Vasc. Biol.43 (6), 813–823. 10.1161/ATVBAHA.122.318332
27
Ojeda-Granados C. Campisi E. Barchitta M. Agodi A. (2024). Genetic, lifestyle and metabolic factors contributing to cardiovascular disease in the Italian population: a literature review. Front. Nutr.11, 1379785. 10.3389/fnut.2024.1379785
28
Peng L. He X. Peng X. Li Z. Zhang L. (2023). Stgnnks: identifying cell types in spatial transcriptomics data based on graph neural network, denoising auto-encoder, and k-sums clustering. Comput. Biol. Med.166, 107440. 10.1016/j.compbiomed.2023.107440
29
Salwinski L. Miller C. S. Smith A. J. Pettit F. K. Bowie J. U. Eisenberg D. (2004). The database of interacting proteins: 2004 update. Nucleic acids Res.32 (Suppl. l_1), D449–D451. 10.1093/nar/gkh086
30
Singh N. Bhatia V. Singh S. Bhatnagar S. (2019). MorCVD: a unified database for host-pathogen protein-protein interactions of cardiovascular diseases related to microbes. Sci. Rep.9 (1), 4039. 10.1038/s41598-019-40704-5
31
Song X.-Y. Chen Z.-H. Sun X.-Y. You Z.-H. Li L.-P. Zhao Y. (2018). An ensemble classifier with random projection for predicting protein–protein interactions using sequence and evolutionary information. Appl. Sci.8 (1), 89. 10.3390/app8010089
32
Tada H. Takamura M. Kawashiri M.-a. (2022). The effect of diet on cardiovascular disease, heart disease, and blood vessels. Nutrients. 14 (2), 246. 10.3390/nu14020246
33
Vincent P. Larochelle H. Bengio Y. Manzagol P.-A. (2008). “Extracting and composing robust features with denoising autoencoders,” in Proceedings of the 25th international conference on Machine learning, 1096–1103.
34
Wang L. Wong L. You Z.-H. Huang D.-S. (2023). AMDECDA: attention mechanism combined with data ensemble strategy for predicting CircRNA-disease association. IEEE Trans. Big Data10, 320–329. 10.1109/tbdata.2023.3334673
35
Wei M. Wang L. Li Y. Li Z. Zhao B. Su X. et al (2024). BioKG-CMI: a multi-source feature fusion model based on biological knowledge graph for predicting circRNA-miRNA interactions. Sci. China Inf. Sci.67 (8), 189104. 10.1007/s11432-024-4098-3
36
Wong J. H. Alfatah M. Sin M. F. Sim H. M. Verma C. S. Lane D. P. et al (2017). A yeast two-hybrid system for the screening and characterization of small-molecule inhibitors of protein–protein interactions identifies a novel putative Mdm2-binding site in p53. BMC Biol.15, 108–117. 10.1186/s12915-017-0446-7
37
Wong L. You Z.-H. Ming Z. Li J. Chen X. Huang Y.-A. (2015). Detection of interactions between proteins through rotation forest and local phase quantization descriptors. Int. J. Mol. Sci.17 (1), 21. 10.3390/ijms17010021
38
Xian L. Wang Y. (2024). Advances in computational methods for protein–protein interaction prediction. Electronics13 (6), 1059. 10.3390/electronics13061059
39
Yao Y. Du X. Diao Y. Zhu H. (2019). An integration of deep learning with feature embedding for protein–protein interaction prediction. PeerJ7, e7126. 10.7717/peerj.7126
40
You Z.-H. Lei Y.-K. Zhu L. Xia J. Wang B. (2013). “Prediction of protein-protein interactions from amino acid sequences with ensemble extreme learning machines and principal component analysis,” in BMC bioinformatics (Springer), 1–11.
41
You Z.-H. Yu J.-Z. Zhu L. Li S. Wen Z.-K. (2014). A MapReduce based parallel SVM for large-scale predicting protein–protein interactions. Neurocomputing145, 37–43. 10.1016/j.neucom.2014.05.072
42
Zhang L. Yu G. Xia D. Wang J. (2019). Protein–protein interactions prediction based on ensemble deep neural networks. Neurocomputing324, 10–19. 10.1016/j.neucom.2018.02.097
43
Zhang S. Lu X. Lu Z. (2023). Improved CNN-based CatBoost model for license plate remote sensing image classification. Signal Process.213, 109196. 10.1016/j.sigpro.2023.109196
44
Zhong B. An Y. Gao H. Zhao L. Li X. Liang Z. et al (2023). In vivo cross-linking-based affinity purification and mass spectrometry for targeting intracellular protein-protein interactions. Anal. Chim. Acta1265, 341273. 10.1016/j.aca.2023.341273
Summary
Keywords
protein–protein interactions, cardiovascular disease, deep denoising autoencoder, CatBoost, evolutionary information
Citation
Zhou S, Luo J, Tang M, Li C, Li Y and He W (2025) Predicting protein–protein interactions in microbes associated with cardiovascular diseases using deep denoising autoencoders and evolutionary information. Front. Pharmacol. 16:1565860. doi: 10.3389/fphar.2025.1565860
Received
23 January 2025
Accepted
17 February 2025
Published
11 March 2025
Volume
16 - 2025
Edited by
Lei Wang, Chinese Academy of Sciences (CAS), China
Reviewed by
Bo-Ya Ji, Hunan University, China
Leon Wong, Shenzhen Technology University, China
Updates
Copyright
© 2025 Zhou, Luo, Tang, Li, Li and He.
This is an open-access article distributed under the terms of the Creative Commons Attribution License (CC BY). The use, distribution or reproduction in other forums is permitted, provided the original author(s) and the copyright owner(s) are credited and that the original publication in this journal is cited, in accordance with accepted academic practice. No use, distribution or reproduction is permitted which does not comply with these terms.
*Correspondence: Wenhua He, wenhuahe@foxmail.com; Yang Li, 2021010123@mail.hfut.edu.cn
Disclaimer
All claims expressed in this article are solely those of the authors and do not necessarily represent those of their affiliated organizations, or those of the publisher, the editors and the reviewers. Any product that may be evaluated in this article or claim that may be made by its manufacturer is not guaranteed or endorsed by the publisher.