 Mi Zhang1,2†
 Weigang Yuan3†Chun Li4†Chanyuan Chen1Xiang Liu5Zhilu Ma1Yifei Xiang1Guisha Chen1,2Chunxu Wang6Lei Li1
 Lingli Wang5*
 Zhong Xu7,8*Chuanrui Xu1,9*
- 1School of Pharmacy, Tongji Medical College, Huazhong University of Science and Technology, Wuhan, China
- 2School of Pharmacy, Lanzhou University, Lanzhou, China
- 3Department of Clinical Laboratory, Xianning Central Hospital, The First Affiliated Hospital of Hubei University of Science and Technology, Xianning, China
- 4Department of Pharmacy, Union Hospital, Tongji Medical College, Huazhong University of Science and Technology, Wuhan, China
- 5School of Pharmaceutical Sciences, Guangzhou University of Chinese Medicine, Guangzhou, China
- 6School of Basic Medicine, Tongji Medical College, Huazhong University of Science and Technology, Wuhan, China
- 7Department of Gastroenterology and Hubei Clinical Center and Key Lab of Intestinal and Colorectal Diseases, Zhongnan Hospital of Wuhan University, Wuhan, China
- 8Health Management Center, Zhongnan Hospital of Wuhan University, Wuhan, China
- 9Department of Pharmacy, Tongren Polytechnic College, Tongren, China
Introduction: Accumulating evidence indicates that antioxidants promote tumor growth and metastasis after tumor onset in several cancer types. However, whether antioxidants prevent or accelerate hepatic tumorigenesis during steatosis remains unknown. Therefore, we investigated the effects of resveratrol (RES) and N-acetylcysteine (NAC) on hepatocellular carcinoma (HCC) development using two fatty liver mouse models.
Methods: High-fat diet (HFD) plus diethylnitrosamine (DEN)- and AKT/Ras-induced primary HCC mouse models were used. The weight, liver weight ratio and the number of HCC tumors were calculated and histological features of mouse HCC tissues were analyzed using immumohistochemical staining such as hematoxylin and eosin staining. Proteomic analysis was used to screen for differences in liver cancer progression between antioxidant-treated HCC and models. Protein inhibitor recovery experiments in mice and in vitro cells validate the targets screened by proteomic analysis. The expression of GST-pi, p-JNK and p-p38 signaling molecules in HCC were investigated using Western blotting.
Results: RES and NAC enhance HCC formation in both DEN/HFD and AKT/Ras mice. RES and NAC alleviate hepatosteatosis, and reduce ROS and DNA damage in mice. Proteomic analysis and protein inhibitor recovery assay demonstrated that GST-pi is a therapeutic target for antioxidant-induced hepatocellular carcinoma growth. Mechanistically, RES and NAC decreased p-JNK and p-p38, the two major mitogen-activated protein kinases, in HCC cells. Blockade of GST-pi abrogated the reduction in p-JNK and p-p38 levels and increased apoptosis of HCC cells.
Conclusion: Antioxidants may increase the incidence of HCC in a population with fatty liver, despite reduction in ROS production, by inhibiting GST-pi-MAPK axis.
1 Introduction
Hepatocellular carcinoma (HCC) accounts for 75%–85% of primary liver cancers and is the third leading cause of cancer-related mortality worldwide (Sung et al., 2021). The primary risk factors associated with HCC are chronic hepatitis B/C virus (HBV/HCV) infection and non-alcoholic fatty liver disease (NAFLD) (Calle and Kaaks, 2004; Taubes, 2012). In recent years, NAFLD has become the most important pathogenic factor of HCC owing to increasing incidence of NAFLD and decreasing incidence of new HBV/HCV infections (Vernon et al., 2011; Huang et al., 2021). The cellular and molecular mechanisms underlying NAFLD-induced HCC are complex and include inflammation, immune response, DNA damage, and oxidative stress (Anstee et al., 2019). NAFLD-related steatosis produces a large number of reactive oxygen species (ROS) that cause hepatocyte damage, liver tissue inflammation, and occurrence of apoptosis and liver regeneration, thus contributing to HCC development (Kawada and Otogawa, 2007; Cohen et al., 2011; Podrini et al., 2013).
Antioxidants have long been used as natural dietary agents to prevent aging and cancer because of their ability to eliminate ROS or other free radicals that cause DNA damage (Morselli et al., 2010; Chandrashekara and Shakarad, 2011; Liu et al., 2018; Russo et al., 2017; Willcox et al., 2004). In the late 1980s to mid-1990s, several studies suggested that consuming a diet rich in vitamin E, vitamin C, or β-carotene could lead to increased plasma concentrations of these vitamins and prevent cancers (Eichholzer et al., 1992; Zhang et al., 1999; Tamimi et al., 2005; Sablina et al., 2005; Godic et al., 2014; Westerlund et al., 2011). Despite the initial indications of potential benefits, large-scale randomized clinical trials have yielded unexpected negative outcomes, and some studies have even suggested that antioxidants could increase the risk of cancer development (Alpha-Tocopherol Beta Carotene Cancer Prevention Study Group, 1994; van Zandwijk et al., 2000; Klein et al., 2011). Studies conducted in mice have indicated that vitamin E and N-acetylcysteine (NAC) accelerate human lung cancer cell growth by reducing ROS, DNA damage, and p53 (Sayin et al., 2014). In mice, the vitamin E analog Trolox and NAC enhanced the invasion and migration of human melanoma cells (Le Gal et al., 2015). These studies indicate that tumor cells may benefit from low ROS levels induced by dietary antioxidants.
Wang et al. found that non-mitochondria-targeting antioxidants, such as NAC and Trolox, prevented hepatic tumorigenesis, whereas mitochondria-targeting antioxidants, such as SS-31 and Mito-Q, accelerated HCC (Wang B. B. et al., 2018). However, they examined the effects of these antioxidants in chemical carcinogen-induced HCC mouse models without steatosis. Whether the preventive use of antioxidants would accelerate or delay HCC formation in a fatty liver context is still unknown. Hepatic steatosis is a known risk factor for HCC, and some antioxidants have been reported to inhibit lipid accumulation in the liver. Therefore, we investigated whether these antioxidants prevented or delayed HCC formation by reducing lipid accumulation in the liver. Antioxidants, including NAC and resveratrol (RES), reduce lipid accumulation and peroxidation in the liver (Ma et al., 2016; Llovet et al., 2015). Given that fatty liver is associated with the development of HCC, we speculate whether antioxidants would prevent the development of NAFLD-related HCC. Therefore, this study aimed to investigate the effects of NAC and RES on HCC initiation and progression in an obesity-related setting.
2 Materials and methods
2.1 Materials
NAC (purity ≥99%, CAS No. 616-91-1) was obtained from Sigma-Aldrich (St. Louis, MO, United States), and RES (purity ≥99%, CAS No. 501-36-0) was obtained from Zhejiang Great Forest Biomedical Ltd. (Hangzhou, Zhejiang, China). High-fat diet (HFD) chow (CAS No. H10060), normal chow (CAS No. H10010), and RES mixed with normal chow and HFD chow were procured from Beijing Huafukang Bioscience Technology (Beijing, China). The feed formulas used in the experiments are listed in Supplementary Table S1. The glutathione-S-transferase-pi (GST-pi) inhibitor ethacrynic acid (EA) was purchased from BioVision (Milpitas, CA, United States). Sodium carboxymethylcellulose (CMC-Na) was obtained from Sinopharm (Shanghai, China). Unless otherwise specified, all other reagents were purchased from Sigma-Aldrich.
2.2 Mice
The Hubei Provincial Center for Disease Control and Prevention provided C57BL/6J mice, and the Beijing Huafukang Bioscience Technology supplied the FVB mice (age: 6-week, weight: 16 g). The protocols for the maintenance, feeding, and handling of all mice were approved by the Animal Experiments Ethical Committee of Huazhong University of Science and Technology. Mice were sacrificed using CO2 asphyxiation and subsequent cervical dislocation to reduce animal suffering according to ethical guidelines approved by the Animal Experiments Ethical Committee of Huazhong University of Science and Technology.
2.3 DEN/HFD-induced HCC model and treatment
To establish a diethylnitrosamine (DEN)/HFD-induced HCC model, male C57BL/6J mice aged 18 days were first administered DEN (25 mg/kg) via i.p. injection and then repeatedly injected with a second dose of DEN 1 week later (25 mg/kg) (Park et al., 2010). The mice were switched to HFD 3 weeks after the injection and randomized into four groups with 11 mice in each group: normal, DEN/HFD + vehicle, DEN/HFD + RES, and DEN/HFD + NAC. Vehicle-treated HCC model mice were fed HFD chow and drinking water. The DEN/HFD + RES group received RES mixed with HFD chow at 0.4% w/w (Soyoung et al., 2011). The DEN/HFD + NAC group received NAC dissolved in drinking water at 1 g/L (Sayin et al., 2014). The mice were fed HFD chow for 24 weeks and weighed every 2 weeks. Finally, the mice were euthanized, and their livers were weighed, photographed, and collected for subsequent analysis. The number and size of tumor nodules were determined; tumor volume was calculated using the following formula:
2.4 AKT/Ras-induced HCC mouse model and treatment
AKT/Ras mouse model was established through tail vein hydrodynamic injection as previously described (Lee et al., 2008; Ho et al., 2012; Chen and Calvisi, 2014). One week after plasmid (pT3-EF1α-myr-AKT: pCaggs-NRasV12: pCMV-SB = 5:5:1 μg per mouse) injection, the mice were fed normal chow and randomized into four groups with four mice in each group: normal, AKT/Ras + vehicle, AKT/Ras + RES, and AKT/Ras + NAC. Vehicle-treated mice were fed normal chow and drinking water. In another AKT/Ras induced HCC mouse model experiment, the AKT/Ras mice were fed normal chow and randomized into five groups with seven mice in each group: AKT/Ras + vehicle, AKT/Ras + RES, AKT/Ras + RES + EA, AKT/Ras + NAC and AKT/Ras + NAC + EA. The AKT/Ras + RES group received RES mixed with normal chow at 0.4% w/w, and the AKT/Ras + NAC group received NAC dissolved in drinking water at 1 g/L. The mice were treated with the GST-pi inhibitor EA (25 mg/kg/day) (Zhang et al., 2021; Madala et al., 2017) in 0.5% CMC-Na by gavage daily until the end of the study. The mice were weighed every 4 days and sacrificed 5 weeks after plasmid injection.
2.5 Histological and immunohistochemical analyses
The experimental mice were euthanized in a humane manner, and their livers were dissected and extracted. The livers were washed twice with phosphate-buffered saline by immersion. Liver samples were preserved for protein extraction by snap-freezing on dry ice. The samples were fixed overnight in 4% paraformaldehyde or Tissue-Tek OCT compound (Sakura Finetek, Tokyo, Japan) to prepare paraffin or frozen blocks, respectively. The paraffin-embedded tissues were cut into 5-μm sections for hematoxylin and eosin (H&E), Ki67 (1:100; Cell Signaling, Danvers, MA, United States), and γH2AX (1:800; Abcam, Cambridge, United Kingdom) staining, following previously described methods (Sjogren et al., 2007). Frozen tissue sections were stained with Oil Red O (ORO; Biosharp, Hefei, Anhui, China) for lipid detection and dihydroethidine (DHE; Sigma-Aldrich) for ROS detection, following the manufacturer’s instructions, and the images were captured and analyzed using inverted microscopy (CKX53; Olympus, Shinjuku-ku, Tokyo, Japan).
2.6 Serum biochemical and lipid peroxidation assays
The blood samples were collected from the heart and kept at 4°C for 2 h. Next, the blood was centrifuged at 3,000 revolutions per minute (rpm) for 10 min and stored at −80°C. The concentrations of serum triglyceride (TG), total cholesterol (TC), alanine aminotransferase (ALT), and aspartate aminotransferase (AST) were assessed using an automatic biochemical analyzer (Cobas-8,000; Roche, Basel, Switzerland). The lipid peroxidation indexes of malondialdehyde (MDA, A003-4), ROS (E004), lipid peroxidation (LPO, A106-1), total antioxidant capacity (T-AOC, A015-1), and GSH/GSSG (A016-1) were assayed using the respective kits (Nanjing Jiancheng Bioengineering Institute, Nanjing, Jiangsu, China) in accordance with the manufacturer’s instructions.
2.7 Cell culture, cell viability, EdU assay and TUNEL assay
The human HCC cell line HepG2 was purchased from the China Center for Type Culture Collection (Shanghai, China). The HepG2 cell line was authenticated by single-tandem repeat profiling and tested for mycoplasma contamination. The cells were cultured in Dulbecco’s modified Eagle medium supplemented with 10% fetal bovine serum (Gibco), 100 μg/mL streptomycin, and 100 U/mL penicillin in a humidified incubator at 37°C in the presence of 5% CO2. For cell viability analysis, a total of 5,000 cells were seeded into 96-well plates in quadruplicate and cultured for 24 h. Then, the cells were treated with oleic acid (OA; 0.8 mM) for 24 h with or without 25 μM RES (Park et al., 2012; Zhang et al., 2015) or 250 μM NAC (Sayin et al., 2014) and/or GST-pi inhibitor 20 μM EA. After the treatment, cell viability was determined using cell counting kit-8 (CCK-8; Dojindo, Kumamoto Prefecture, Japan). 5-ethynyl-2′-deoxyuridine (EdU) assay was performed using BeyoClick™ EdU cell proliferation kits with Alexa Fluor 488 labeling (Beyotime, Shanghai, China). Terminal deoxynucleotidyl transferase dUTP nick end labeling (TUNEL) was performed using Click-iT™ TUNEL colorimetric detection kit (Thermo Fisher Scientific, Waltham, MA, United States). All experiments were repeated three times.
2.8 Western blot analysis
HCC tissue nuclear protein extraction was performed using a nuclear protein extraction kit (Beyotime). RIPA buffer (R0278; Sigma-Aldrich) was used to extract proteins from the liver or HCC tissue via whole cell lysis. The resulting lysates were centrifuged at 12,000 rpm for 10 min, and the supernatants were collected quantitatively. BCA protein assay kit (Beyotime) was used to measure the protein concentration in the lysates. Subsequently, proteins of different molecular sizes were separated on a 10% polyacrylamide gel and electrotransferred onto a polyvinylidene difluoride (PVDF) membrane. After blocking for 1.5 h using 5% skim milk or TBST (TBS with 0.1% Tween-20) containing 5% bovine serum albumin, the membrane was incubated with monoclonal antibodies, washed thrice with TBST, and incubated with the secondary antibodies for 1 h at room temperature. Finally, the membrane was rinsed and developed using an enhanced chemiluminescence system following the manufacturer’s instructions (Perkin Elmer, Waltham, MA, United States). The antibodies used in the experiment are listed in Supplementary Table S2.
2.9 Proteomic analysis
Liver or tumor tissues were mixed with SDT buffer containing 100 Mm Tris (hydroxymethyl)aminomethane hydrochloride (Tris-HCl), 4% Sodium dodecyl sulfate (SDS), and 1 mM dithiothreitol (DTT) at pH 7.6. The mixture was then transferred to 2-mL tubes with quartz sand and homogenized twice using an MP homogenizer for 60 s at a speed of 6.0 m/s. After homogenization, the mixture was sonicated and boiled at 100°C for 15 min. The resulting mixture was then centrifuged at 14,000 × g for 40 min, and the supernatant was removed and filtered through a 0.22-µm filter. After filtration, the protein content in the supernatant was quantified using BCA protein assay kit, and the samples were stored at −80°C until further use. For additional analysis, 20 µg of protein was mixed with loading buffer and heated at 95°C in a water bath for 5 min. To separate the proteins, 12.5% sodium dodecyl sulfate-polyacrylamide gel electrophoresis was performed at a constant current of 14 mA for 90 min. Protein bands were visualized by staining with Coomassie Blue R-250. Finally, all samples were subjected to filter aided sample preparation process following an established protocol (Wisniewski et al., 2009), and the resulting peptides were collected as filtrates. Subsequently, the peptide mixture from each sample (100 μg) was labeled with tandem mass tag (TMT) reagent according to the instructions provided by the manufacturer (Thermo Fisher Scientific). The digested samples labeled with TMT were fractionated into 10 parts using the Pierce High pH Reversed-Phase Fractionation Kit (Thermo Fisher Scientific), using a method that involves increasing acetonitrile step-gradient elution. The obtained peptides were introduced into a trap column of reverse-phase chromatography (Thermo Scientific Acclaim PepMap100, 100 μm × 2 cm, nanoViper C18) that was linked to the analytical column of C18-reversed phase chromatography (Thermo Scientific Easy Column, 10 cm in length, 3 μm resin) using buffer A consisting of 0.1% formic acid. The peptides were subjected to gradient elution with buffer B consisting of 84% acetonitrile and 0.1% formic acid. Gradient elution was performed in three steps: 0%–55% over 80 min, 55%–100% over 5 min, and 100% for 5 min. Using Easy-nLC system (Thermo Fisher Scientific), eluted peptides were introduced into Q Exactive mass spectrometer (Thermo Fisher Scientific) for 90 min. The mass spectrometer was operated in data-dependent mode, with one MS scan followed by 20 MS/MS scans per cycle. Peptides were searched using the MASCOT engine (version 2.2) integrated into Proteome Discoverer (version 1.4; Thermo Fisher Scientific) to query the database. For bioinformatics analysis, gene ontology (GO) annotation, Kyoto Encyclopedia of Genes and Genomes (KEGG) pathway annotation, functional enrichment analysis, and hierarchical clustering were performed.
2.10 Statistical analysis
All statistical analyses were performed using GraphPad Prism 7.0. Data were expressed as the mean ± SD, and the groups were compared for significant differences using ANOVA followed by Dunnett’s t-test. P < 0.01 and P < 0.05 were considered very significant and significant, respectively.
3 Results
3.1 RES and NAC accelerate HCC initiation and development in both DEN/HFD and AKT/Ras mice
To evaluate the effects of antioxidants on HCC formation during steatosis, we administered RES and NAC to DEN/HFD and AKT/Ras mice, respectively. DEN/HFD mice serve as a steatosis- and carcinogen-induced HCC model, and AKT/Ras mice represent a steatosis- and oncogene-induced HCC model because AKT drives lipogenesis in the mouse liver. RES and NAC were chosen for two reasons. First, these two antioxidants have been reported to alleviate mouse hepatosteatosis (Ma et al., 2016; Jeon et al., 2012). Second, RES and NAC are different types of antioxidants. RES is fat-soluble, functions as a superoxide and metal-induced radical scavenger (Neves et al., 2012; Leonard et al., 2003) and exerts caloric restriction effect (Tennen et al., 2012). NAC is water-soluble and participates in GSH metabolism (Sadowska, 2012; Samuni et al., 2013). DEN/HFD mice were fed vehicle, 0.4% w/w RES, or 1 g/L NAC diet for 24 weeks after DEN injection (Figure 1A). RES was mixed with HFD chow at 0.4% w/w. NAC was administered to mice in drinking water at a concentration of 1 g/L. At the end of the experiment, vehicle-treated mice had an average of four nodules on the liver surface (Figures 1B,C). In contrast, RES- and NAC-treated mice had an average of six and seven nodules, respectively. The average maximal tumor volume in vehicle-treated mice was 1 mm3, whereas that in RES- and NAC-treated mice were 2 and 3 mm3, respectively (Figure 1D). RES and NAC led to 2.1- and 1.7-fold increased tumor burden compared with the vehicle group, respectively. Interestingly, both RES and NAC reduced the body and liver weights of mice fed HFD since the fourth week (Figures 1E,F). Ki67 staining showed that RES and NAC increased proliferation in the liver of treated mice (Figure 1G). AKT/Ras mice were fed vehicle, 0.4% w/w RES, or 1 g/L NAC diet for 5 weeks after AKT/Ras plasmid injection (Figure 2A). RES was mixed with HFD chow at 0.4% w/w. NAC was administered to the mice in drinking water at a concentration of 1 g/L. Mouse liver was found covered with tumor nodules at the fifth week after plasmid injection (Figure 2B). RES or NAC administration significantly increased the body weight and liver/body weight ratio of mice, indicating that both agents increased HCC formation in AKT/Ras mice (Figures 2C,D). Similar to that in DEN/HFD mice, RES or NAC treatment increased the proliferation of HCC cells in AKT/Ras mice (Figure 2E). These results indicated that both RES and NAC enhanced HCC initiation in mice with steatosis.
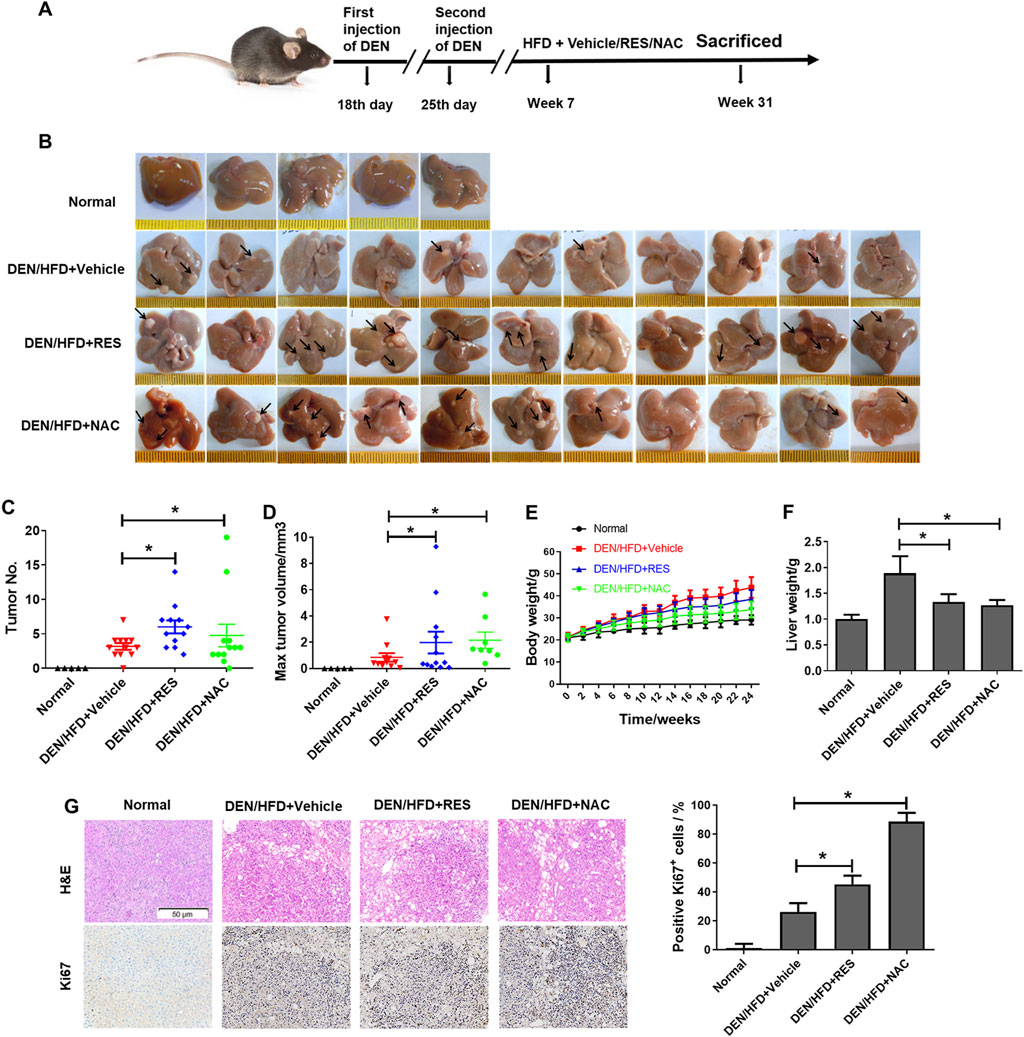
Figure 1. RES and NAC enhance HCC formation in DEN/HFD mice. (A) DEN/HFD-induced HCC development in mice and the experimental design. (B) Representative images of the liver of mice treated with vehicle, 0.4% w/w RES, or 1 g/L NAC. Black arrows indicate HCC nodules. (C–F) Tumor number (C), maximum tumor volume (D), body weight (E), and liver weight (F) of each group. (G) H&E and IHC staining of mouse HCC tissues, and the percentages of Ki67-positive cells. Scale bar = 50 μm. Data are presented as mean ± SD (n = 11), with statistical significance denoted as *P < 0.05.
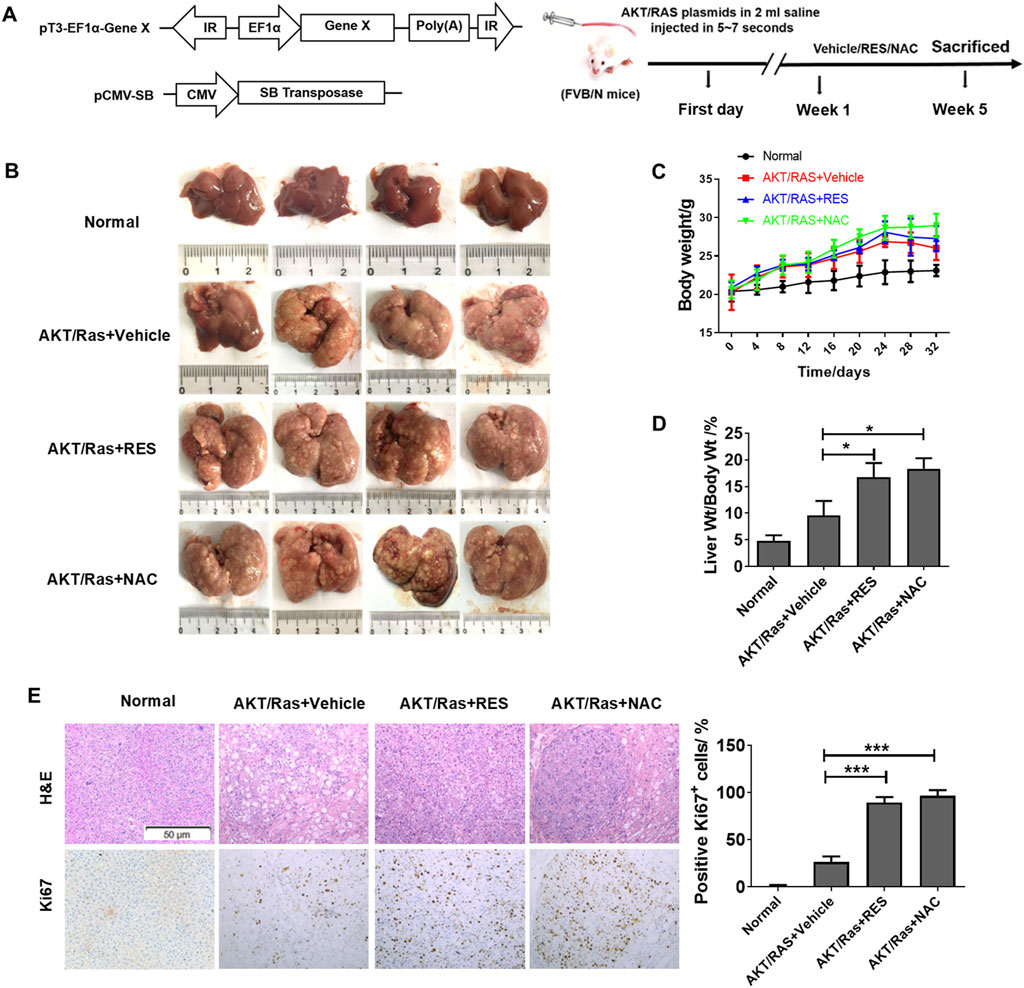
Figure 2. RES and NAC enhance HCC in AKT/Ras mice. (A) AKT/Ras-induced HCC development and the experimental design. (B) Representative images of the liver of AKT/Ras mice treated with vehicle, 0.4% RES, or 1 g/L NAC. (C) Body weight gain during tumor development. (D) Liver-to-body weight ratio. (E) H&E and IHC staining of mouse HCC tissues, and the percentages of Ki67-positive cells. Scale bar = 50 μm. Data are presented as mean ± SD (n = 4), with statistical significance denoted as *P < 0.05, **P < 0.01, ***P < 0.001.
3.2 RES and NAC alleviate hepatosteatosis in mice
In both DEN/HFD and AKT/Ras mice, HCC is partially attributed to lipogenesis or lipid accumulation causing liver damage (Ho et al., 2012; Park et al., 2010). In addition, we observed that fatty liver or lipoma formed earlier than HCC in the DEN/HFD and AKT/Ras mouse HCC models (Supplementary Figure S1). To examine whether RES and NAC accelerate HCC by regulating lipid metabolism, we performed ORO staining and transmission electron microscopy (TEM). The result showed that both RES and NAC treatment led to smaller cytoplasmic lipid droplets in mouse hepatocytes than those in the vehicle group (Figures 3A,B). Consistent with the reduced ORO staining, RES and NAC treatment reduced the serum levels of TG and TC (Figure 3C). Furthermore, serum ALT and AST levels decreased after RES or NAC treatment (Figure 3D). This implied that RES and NAC mitigated lipid accumulation in mice with HCC induced by both DEN/HFD and AKT/Ras, although they accelerated HCC development.
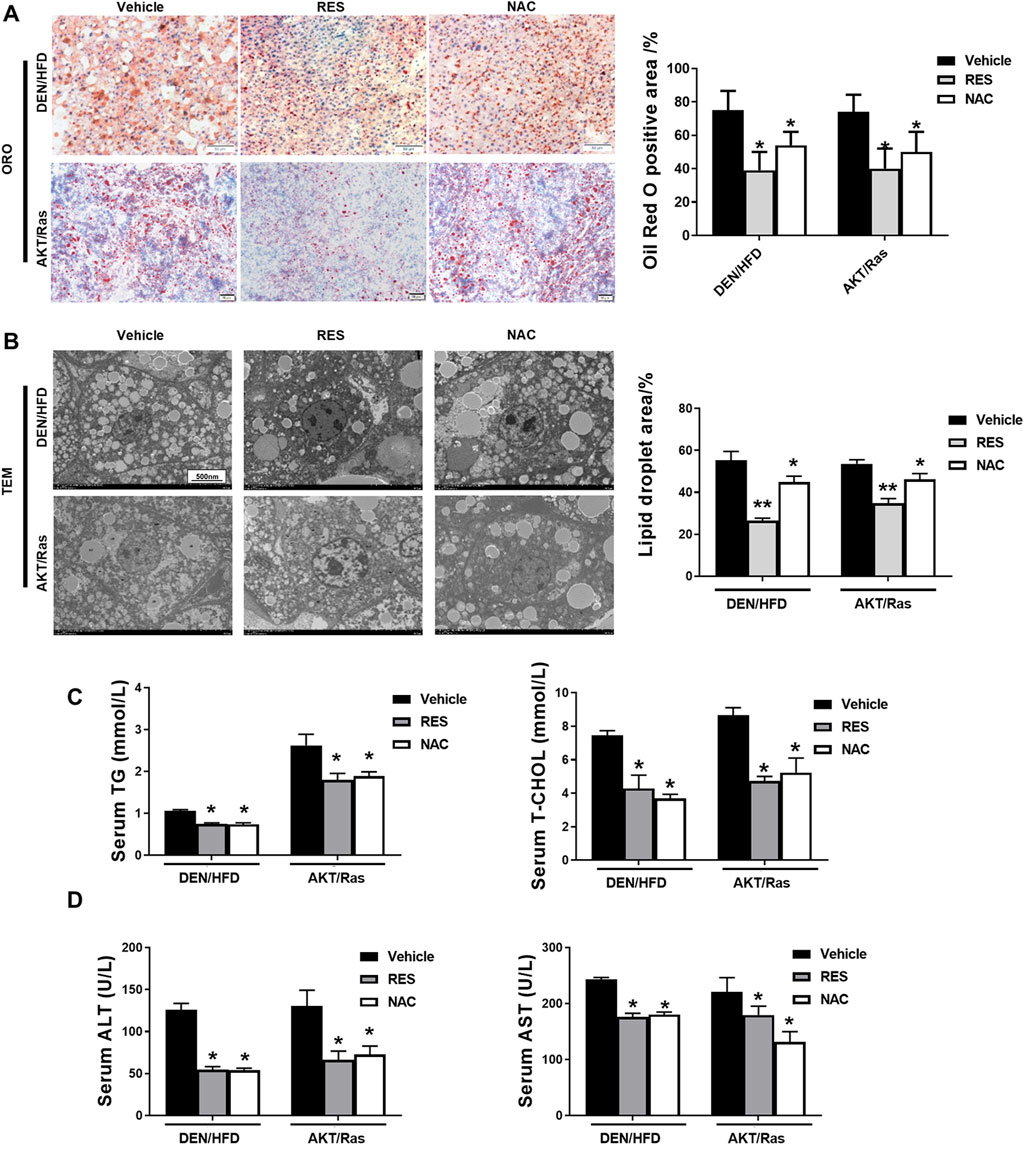
Figure 3. RES and NAC reduce lipid accumulation in DEN/HFD- and AKT/Ras-induced HCC mice. (A) Representative ORO staining of mouse liver sections, and the percentage of ORO-positive area. Scale bar = 50 μm. (B) TEM images of lipid droplets in mouse liver slices, and the percentage of lipid droplet area. Scale bar = 500 nm. (C) Serum levels of TG and TC in HCC mice. (D) Serum levels of ALT and AST in HCC mice. The data are presented as mean ± SD (n = 4). Statistical significance is denoted as *P < 0.05, **P < 0.01.
3.3 Antioxidants reduce ROS and DNA damage and increase tumor cell proliferation in vivo
Studies have shown that NAC and vitamin E reduce ROS and DNA damage in lung tumor cells, thereby facilitating the proliferation of tumor cells (Sayin et al., 2014). NAC and Trolox alleviated DNA damage in DEN-treated primary hepatocytes (Wang B. B. et al., 2018). Thus, we examined ROS levels and DNA damage responses in the liver tissues of RES- and NAC-treated mice. Staining with the redox-sensitive probe DHE showed that ROS levels in HCC mouse tissues were reduced by RES and NAC (Figure 4A). Immunohistochemistry (IHC) analyses of γH2AX indicated that RES and NAC alleviated ROS-induced DNA damage as well (Figure 4B). We subsequently investigated the effect of antioxidants on lipid peroxidation activity and found that antioxidant treatment significantly reduced MDA and LPO activities in the serum of mice compared to those in untreated model group mice (Figure 4C). In contrast, antioxidant treatment increased the levels of T-AOC and GSH/GSSG in the serum of mice compared to those in untreated HCC mice (Figure 4D). Taken together, these data indicate that antioxidants reduce ROS and DNA damage, although they accelerate tumor formation or growth in vivo.
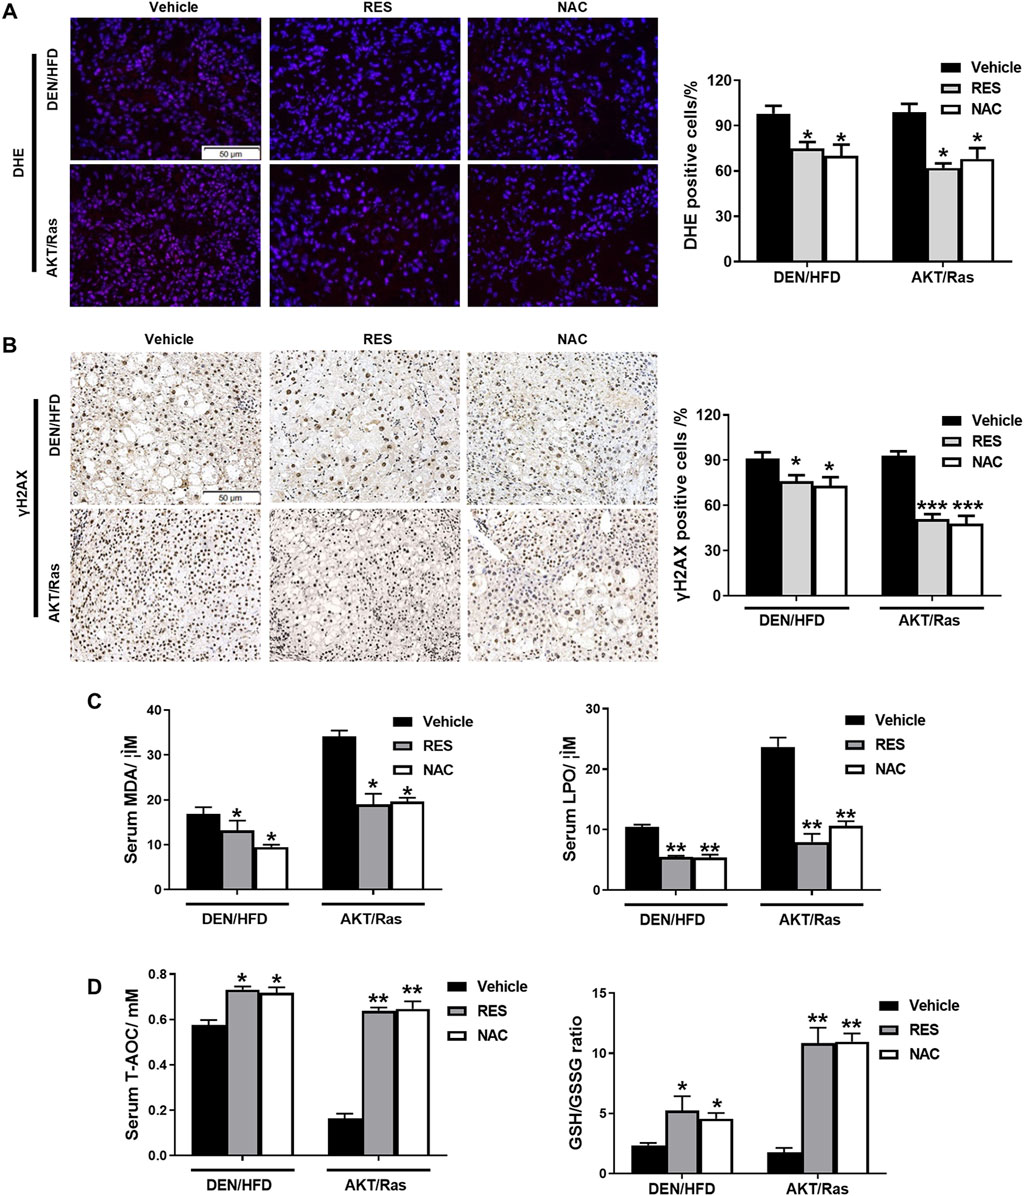
Figure 4. RES and NAC reduce ROS accumulation, DNA damage, and lipid peroxidation in DEN/HFD- and AKT/Ras-induced HCC mice. (A) ROS detection using DHE staining in HCC mouse liver sections and the percentage of DHE-positive cells. Scale bar = 50 μm. (B) γH2AX staining of HCC mouse liver sections, and the percentages of γH2AX-positive cells. Scale bar = 50 μm. (C) Serum MDA and LPO levels in HCC mice. (D) Serum total antioxidant capacity (T-AOC) and GSH/GSSG ratio in HCC mice. Data are presented as mean ± SD (n = 4); *P < 0.05, **P < 0.01.
3.4 Antioxidants increase the expression of GST-pi in HCC
We investigated how antioxidants enhance HCC growth while blocking ROS production and DNA damage. To this end, we performed longitudinal, unbiased, quantitative proteomics using liver tissues from RES-treated and vehicle-treated DEN/HFD mice (Figure 5A). A total of 4,927 proteins were detected, of which 551 showed significant (>2-fold change) upregulation or downregulation in the liver tissues of RES-treated mice compared to that of vehicle-treated mice (Figure 5B). Pathway enrichment analysis revealed enrichment of the GSH metabolic pathway (Figure 5C). Consistently, KEGG analysis showed that the GSH metabolic pathway was enriched (Figure 5D). We screened differentially expressed proteins between the vehicle-treated and RES-treated groups and found that GST showed 2.76-fold higher expression in the RES-treated group than in the vehicle-treated group (Figure 5E). GSTs are a group of phase II detoxification enzymes that facilitate the binding of GSH to different types of endogenous and exogenous electrophilic molecules. The cytoplasmic GST superfamily consists of at least seven classes, with the most abundant in mammals being the alpha, mu, and pi classes of enzymes (Hayes and Pulford, 1995; Townsend and Tew, 2003). Recent studies have shown that GST-pi is highly expressed in liver tumor cells (Su et al., 2003) and is closely related to carcinogenesis, tumor formation (Dang et al., 2005) and the annual survival rate of various tumors (Yasuno et al., 1999). We therefore performed Western blot to detect GST-pi, and found that GST-pi expression was increased in the liver tissues of both the RES- or NAC-treated mice, whereas nucleoprotein γH2AX was decreased (Figure 5F). Taken together, these results indicate that GST-pi is involved in the promotion of HCC growth by antioxidants.
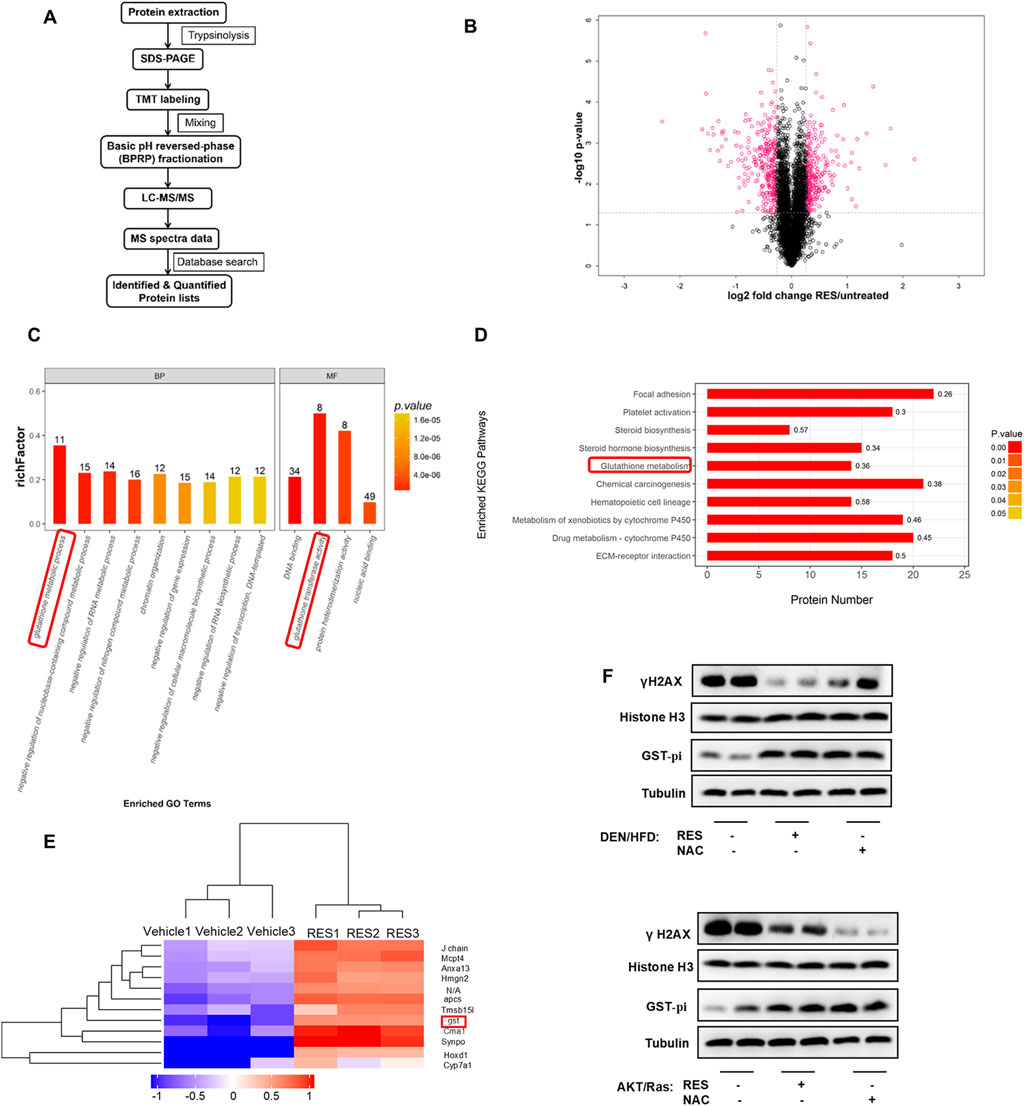
Figure 5. Proteomics screened GST-Pi as a potential effector upon antioxidants treatment. (A) Proteomic screening procedure is illustrated. (B) Volcano plot of average peptide intensities in both RES- and vehicle-treated HCC tissues. The horizontal dotted line indicates P < 0.05. Proteins with a fold change > 1.2 are shown in pink (n = 3). (C) GO enrichment analysis of the upregulated proteins using Fisher’s exact test. The top nine enriched biological pathways and top four molecular function pathways are shown (n = 3). (D) The top 10 KEGG pathways enriched in RES-treated mouse HCC tissues (n = 3). (E) The top 12 hits with the highest increase were selected for clustering analysis. The colors indicate relative abundance; red indicates higher abundance and blue indicates lower abundance (n = 3). (F) Western blot analysis of γH2AX and GST-pi in mouse liver tissues treated with antioxidants. Histone H3 was used as the internal reference for nucleoproteins. Tubulin was used as the loading control.
3.5 RES and NAC accelerate HCC initiation and progression via GST-pi
GST-pi plays a critical role in promoting tumorigenesis and drug resistance of tumor cells (Crawford and Weerapana, 2016). Next, we tested whether RES and NAC accelerated tumor progression through the activation of GST-pi. Since the primary hepatocytes can only be cultured for a short time and cannot grow in vitro, we chose HCC cell lines to evaluate the roles of RES and NAC in HCC development in vitro. We treated HepG2 cells with 0.8 mM OA and subsequently with 25 μM RES or 250 μM NAC. We found that RES or NAC significantly restored cell morphology (Figure 6A), increased cell viability (Figure 6B), and reduced apoptosis caused by OA treatment (Figure 6C), but did not restore proliferation at a series of concentrations (Figure 6D; Supplementary Figure S2). We then treated HepG2 cells with 20 μM EA, a well-characterized GST family inhibitor (Hansson et al., 1991). Following concomitant EA treatment, RES and NAC failed to reduce apoptosis in HepG2 cells. These results suggested that the promoting effect of antioxidants on HCC was dependent on GST-pi in vitro.
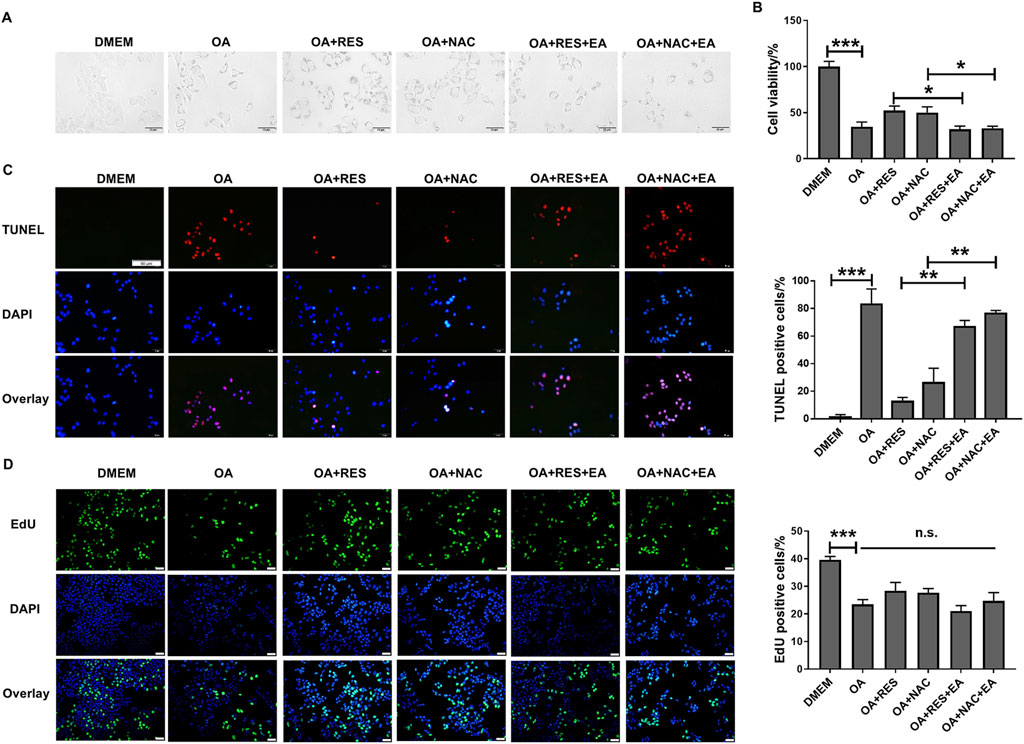
Figure 6. RES and NAC inhibit HCC cell apoptosis but do not accelerate cell proliferation in vitro. (A) Morphology of HepG2 cells. HepG2 cells treated with OA (0.8 mM) for 24 h with and without 25 μM RES or 250 μM NAC or/and 20 μM EA. (B) The viability of HepG2 cells was determined using the CCK-8 assay. (C) TUNEL staining of HepG2 cells, and the percentage of TUNEL-positive cells. Scale bar = 50 μm. (D) EdU staining of HepG2 cells, and the percentage of EdU-positive cells. Scale bar = 50 μm. Data are presented as mean ± SD (n = 3), n.s., not significant; *P < 0.05, **P < 0.01, ***P < 0.005.
We explored the effects of EA administration on the growth of AKT/Ras-induced HCC cells treated with RES or NAC. Treatment with 25 mg/kg/day EA abrogated the promoting effects of 0.4% w/w RES and 1 g/L NAC on HCC progression (Figure 7A). EA treatment also reduced the body weight and liver/body weight ratio of mice (Figures 7B,C). Moreover, EA treatment decreased tumor cell proliferation and increased DNA damage, apoptosis, and ROS levels (Figures 7D–G). Collectively, these results indicate that GST-pi mediates the promoting effect of antioxidants in HCC initiation and progression.
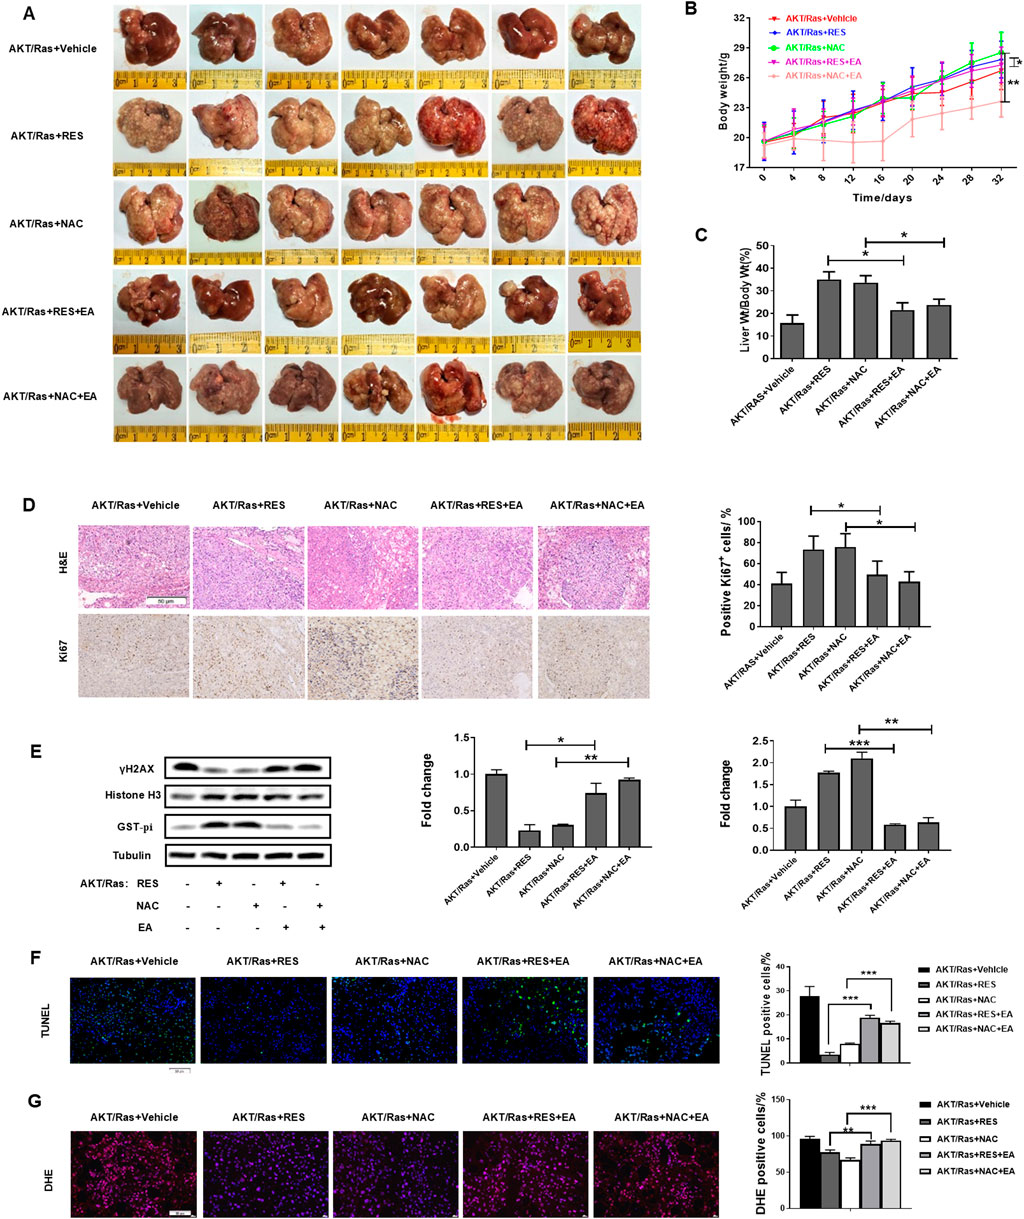
Figure 7. GST-pi inhibitor abrogates the promoting effects of antioxidants on HCC progression. AKT/Ras mice were treated with vehicle, 0.4% w/w RES, 0.4% w/w RES + 25 mg/kg/day EA, 1 g/L NAC, or 1 g/L NAC + 25 mg/kg/day EA. (A) Liver morphology of mice (n = 7). (B) Body weight gain during tumor development. (C) Liver-to-body ratio (n = 7). (D) HE or IHC staining showing HCC histology and AKT, Ras, and Ki67 expression. Scale bar = 50 μm (n = 7). (E) Western blot of γH2AX and GST-pi in the liver tissues (n = 2). Histone H3 was used as the internal reference for nucleoproteins. Tubulin was used as the loading control. (F) TUNEL staining of HCC mouse liver sections, and the percentage of TUNEL-positive cells. Scale bar = 50 μm (n = 7). (G) ROS detection by DHE staining of HCC mouse liver sections. Scale bar = 50 μm. Data are presented as mean ± SD (n = 7); *P < 0.05, **P < 0.01, ***P < 0.005.
3.6 RES and NAC enhance tumor growth by inhibiting MAPK pathway
Next, we investigated the mechanism by which GST-pi accelerates HCC progression. Recent studies have reported that GST-pi regulates the mitogen-activated protein kinase (MAPK) pathway, which is frequently activated in HCC (Sciskalska and Milnerowicz, 2020; Moon and Ro, 2021). To date, six groups of MAPKs have been identified, of which ERK1/2, JNK, and p38 are the three major ones (Sui et al., 2014). Thus, we assessed the activation of ERK1/2, JNK, and p38, and found that the ERK1/2, JNK, and p38 pathways were all inhibited, along with increased GST-pi in DEN/HFD-induced HCC treated with RES or NAC (Figure 8A). This result is consistent with the reported regulation of p38 (Sciskalska and Milnerowicz, 2020), ERK1/2 (Wang et al., 2019), and JNK by GST-pi (Thevenin et al., 2011; Townsend and Tew, 2003). In addition, in AKT/Ras-induced HCC model, antioxidants increased GST-pi protein levels and inhibited the activation of MAPK pathway proteins. EA significantly reduced GST-pi protein levels and activated MAPK pathway proteins (Figures 8B,C). The MAPK pathway is an important signaling pathway that promotes apoptosis (Sui et al., 2014; Wang J. et al., 2018). As expected, the expression of the anti-apoptotic protein Bcl2 increased and that of the pro-apoptotic protein Bax decreased upon RES or NAC treatment. Conversely, Bcl2 was inhibited, whereas Bax increased in the presence of the GST-pi inhibitor. Taken together, these results indicate that antioxidants inhibit apoptosis via the GST-pi-MAPK axis and play tumor-promoting role in HCC.
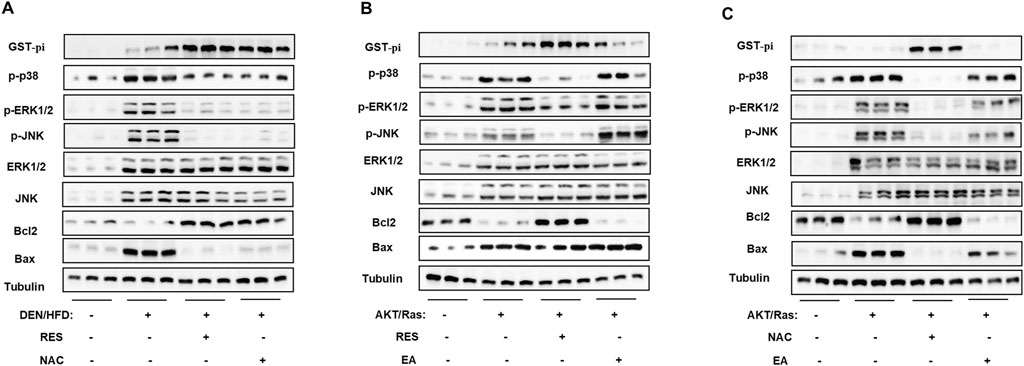
Figure 8. RES and NAC inhibit the MAPK pathway through GST-pi. (A) Western blotting of GST-pi, p-p38, p-ERK1/2, ERK1/2, p-JNK, JNK, Bcl2, and Bax in the liver tissues of DEN/HFD model mice fed HFD + vehicle, HFD + RES, or HFD + NAC. (B, C) Western blotting of proteins in the liver tissues of AKT/Ras mice fed normal chow plus EA plus RES (B) or NAC (C), respectively.
4 Discussion
Antioxidants, including vitamins, carotenes, and minerals, have long been used for cancer prevention and treatment because of their ability to neutralize ROS (Willcox et al., 2004; Giorgio, 2015). However, the antitumor effects of antioxidants have never been validated in clinical trials. Accumulating evidence has confirmed that antioxidants may accelerate tumor growth and metastasis. However, whether antioxidants can be used as daily supplements for prevention has not been fully addressed at both the whole-body and molecular levels. In this study, we demonstrated that RES and NAC enhanced HCC formation in both DEN/HFD- and AKT/Ras-induced HCC mouse models. In terms of mechanism, RES and NAC were found to upregulate GST-pi expression, inhibit the MAPK pathway, and reduce ROS, DNA damage, and apoptosis of HCC cells.
The promoting effect of antioxidants on HCC progression in our study is consistent with the results obtained in other tumor models in previous studies. In mouse lung cancer, NAC and vitamin E increased cell proliferation by reducing ROS and DNA damage and disrupting the ROS-p53 axis (Sayin et al., 2014). Similarly, in human malignant melanoma cells, NAC and the soluble vitamin E analog Trolox enhanced migration and invasion without affecting cell proliferation. In contrast, in DEN-induced HCC mouse model, the non-mitochondria-targeting antioxidants NAC and Trolox prevented tumorigenesis, whereas the mitochondria-targeting antioxidants Mito-Q and SS-31 promoted tumorigenesis (Wang B. B. et al., 2018). Together with our study, these findings suggest that patients with HCC should avoid taking antioxidants or use antioxidant supplements with caution. However, whether the data obtained from mice can be generalized to humans needs to be confirmed in clinical trials or cohort studies.
Fat accumulation was reportedly correlated with increased ROS in humans and mice, and increased ROS levels promote cell proliferation and differentiation (Boonstra and Post, 2004; Schafer and Buettner, 2001; Furukawa et al., 2004). Moreover, the risk of developing HCC can be further increased through the synergistic effects of HCV infection and NAFLD (Li et al., 2009; Parekh and Anania, 2007). Therefore, people may hold that antioxidants may delay or prevent cancer initiation in patients with NAFLD. However, our results indicate that RES and NAC can enhance tumor formation and development in mice, even with a high-fat diet or lipogenesis. Indeed, inhibition of hepatic lipogenesis in mice treated with DEN increased tumor incidence (Nelson et al., 2017). Inhibiting lipogenesis results in a significant increase in the levels of endogenous antioxidants such as NADPH and reduced GSH. This finding supports our conclusion that liver tumorigenesis in mice treated with DEN or driver oncogenes does not depend on lipogenesis. Our results suggest that NAC and RES enhance the initiation and development of HCC in mice. However, further investigations are needed to determine whether all antioxidants that can reduce lipid accumulation or inhibit hepatic steatosis, such as vitamin C, vitamin E (Shin, 2003), and puerarin flavonoids (Sun et al., 2023), can enhance the development of HCC. Whether all antioxidants enhance HCC formation requires further investigation, particularly because some antioxidants do not reduce lipid accumulation or inhibit hepatic steatosis. Therefore, their roles in blocking HCC formation and progression in the context of fatty liver warrant further investigation.
Our study highlighted the pivotal role of GST-pi in ROS scavenging and HCC. It has been reported that GST-pi is upregulated in pre-neoplastic lesions observed in animal cancer models induced by chemicals (Satoh et al., 1985) and a wide range of human tumors (Shea et al., 1988). When colon cancer cells are cultured under growth-limiting conditions, a deficiency in GST-pi expression leads to increased cellular oxidative stress, leading to apoptosis (Dang et al., 2005). Subsequent in vivo experiments showed that GST-pi had a significant impact on the initial stages of cancer development. In breast cancer, tumors that express GST-pi have been shown to be more aggressive and had worse prognosis compared to tumors that do not express GST-pi (Huang et al., 2003). GST-pi expression was found in 62.4% of ovarian tumors and directly affected the chemosensitivity of ovarian tumor cell lines to platinum drugs (Ikeda et al., 2003; Sawers et al., 2014). The pivotal role of GST-pi in carcinogenesis may depend on the regulation of several critical kinases in cancer cells. When exposed to chemical or oxidative stress, the dissociation of the GST-pi-JNK complex led to the release of GST-pi for oligomerization. Released JNK was then activated, triggering apoptosis (Adler et al., 1999; Davies et al., 2001). MAPK kinase and ERK1/2 kinase signaling in colon cancer was dependent on the presence of GST-pi, in line with our observations in this study (Dang et al., 2005).
Our findings provide further evidence supporting the controversial role of MAPK in HCC. ERK1/2, JNK, and p38 are the three major MAPK proteins (Sui et al., 2014). ERK1/2 is mainly activated by growth signals and promotes HCC cell growth (Moon and Ro, 2021), while JNK and p38 are mainly activated by environmental stress and play dual roles in various cancers (Sui et al., 2014). Inhibition of ERK can lead to apoptosis, whereas the inhibition of JNK and p38 can prevent apoptosis (Huynh et al., 2003). In this study, we found that RES and NAC increased GST-pi expression and subsequently inhibited the activation of JNK and p38, suggesting that JNK and p38 promoted cell apoptosis in HCC. In addition, JNK and p38 are capable of balancing autophagy and apoptosis (Sui et al., 2014). Whether autophagy is involved in the pro-tumoral role of antioxidants merits further investigation.
Notably, the conclusion that NAC and RES enhance HCC incidence only applies to the liver with aberrant lipid metabolism. Whether NAC and RES accelerate HCC along with other risk factors remains controversial. Several studies have shown that NAC and RES inhibit DEN-induced HCC and that elevated ROS level is required for tumor development (Bishayee et al., 2010; Lin et al., 2013). However, other studies have demonstrated that NAC promotes tumor growth (Sayin et al., 2014; Schafer et al., 2009). A prospective cohort study conducted from 1998 to 2009 showed that total urinary RES metabolite concentration was not associated with cancer mortality (Semba et al., 2014). In addition, in vitro experiments demonstrated that RES and NAC reduced the apoptosis of HCC cells pre-treated with OA but did not enhance cell proliferation, which was not fully consistent with the in vivo results. These results suggest that the stimulatory effects of antioxidants on HCC growth depend on the tumor microenvironment (TME). HCC TME contains many stromal and immune cell types, including fibroblasts, endothelial cells (Wang et al., 2022), regulatory T cells (Zhang et al., 2022), myeloid-derived suppressor cells (Hoechst et al., 2009), neutrophils (Geh et al., 2023), and tumor-associated macrophages (TAM) (Cheng et al., 2022). For instance, TAM can be repolarized by antioxidants to M1 in bladder cancer, enhancing the efficacy of anti-PD-L1 immunotherapy (Ma et al., 2022). Therefore, we speculate that antioxidants may also enhance HCC by directly regulating the TME, in addition to their roles in HCC cells, and we will further investigate these effects in future studies.
Data availability statement
The mass spectrometry proteomics data have been deposited to the ProteomeXchange Consortium (https://proteomecentral.proteomexchange.org) via the iProX partner repository with the dataset identifier PXD056132.
Ethics statement
The animal study was approved by the Animal Experiments Ethical Committee of Huazhong University of Science and Technology. The study was conducted in accordance with the local legislation and institutional requirements.
Author contributions
MZ: Investigation, Methodology, Validation, Writing – original draft. WY: Investigation, Methodology, Validation, Writing – original draft. CL: Formal Analysis, Methodology, Visualization, Writing – original draft. CC: Data curation, Methodology, Writing – review and editing. XL: Validation, Visualization, Writing – original draft. ZM: Data curation, Writing – original draft. YX: Validation, Writing – review and editing. GC: Data curation, Writing – review and editing. CW: Methodology, Writing – review and editing. LL: Supervision, Writing – review and editing. LW: Methodology, Project administration, Supervision, Writing – review and editing. ZX: Conceptualization, Resources, Supervision, Writing – review and editing. CX: Conceptualization, Resources, Writing – review and editing, Writing – original draft.
Funding
The author(s) declare that financial support was received for the research and/or publication of this article. This study was supported by the National Natural Science Foundation of China (grant numbers 82073091, 82273059, and 82273063) and Guizhou Province Science and Technology Project (ZK-2024-Key-097).
Conflict of interest
The authors declare that the research was conducted in the absence of any commercial or financial relationships that could be construed as a potential conflict of interest.
Generative AI statement
The authors declare that no Generative AI was used in the creation of this manuscript.
Publisher’s note
All claims expressed in this article are solely those of the authors and do not necessarily represent those of their affiliated organizations, or those of the publisher, the editors and the reviewers. Any product that may be evaluated in this article, or claim that may be made by its manufacturer, is not guaranteed or endorsed by the publisher.
Supplementary material
The Supplementary Material for this article can be found online at: https://www.frontiersin.org/articles/10.3389/fphar.2025.1574039/full#supplementary-material
References
Adler, V., Yin, Z., Fuchs, S. Y., Benezra, M., Rosario, L., Tew, K. D., et al. (1999). Regulation of JNK signaling by GSTp. EMBO J. 18, 1321–1334. doi:10.1093/emboj/18.5.1321
Alpha-Tocopherol Beta Carotene Cancer Prevention Study Group (1994). The effect of vitamin E and beta carotene on the incidence of lung cancer and other cancers in male smokers. N. Engl. J. Med. 330, 1029–1035. doi:10.1056/NEJM199404143301501
Anstee, Q. M., Reeves, H. L., Kotsiliti, E., Govaere, O., and Heikenwalder, M. (2019). From NASH to HCC: current concepts and future challenges. Nat. Rev. Gastroenterol. Hepatol. 16, 411–428. doi:10.1038/s41575-019-0145-7
Bishayee, A., Barnes, K. F., Bhatia, D., Darvesh, A. S., and Carroll, R. T. (2010). Resveratrol suppresses oxidative stress and inflammatory response in diethylnitrosamine-initiated rat hepatocarcinogenesis. Cancer Prev. Res. (Phila) 3, 753–763. doi:10.1158/1940-6207.CAPR-09-0171
Boonstra, J., and Post, J. A. (2004). Molecular events associated with reactive oxygen species and cell cycle progression in mammalian cells. Gene 337, 1–13. doi:10.1016/j.gene.2004.04.032
Calle, E. E., and Kaaks, R. (2004). Overweight, obesity and cancer: epidemiological evidence and proposed mechanisms. Nat. Rev. Cancer 4, 579–591. doi:10.1038/nrc1408
Chandrashekara, K. T., and Shakarad, M. N. (2011). Aloe vera or resveratrol supplementation in larval diet delays adult aging in the fruit fly, Drosophila melanogaster. J. Gerontol. A Biol. Sci. Med. Sci. 66, 965–971. doi:10.1093/gerona/glr103
Chen, X., and Calvisi, D. F. (2014). Hydrodynamic transfection for generation of novel mouse models for liver cancer research. Am. J. Pathol. 184, 912–923. doi:10.1016/j.ajpath.2013.12.002
Cheng, K., Cai, N., Zhu, J. H., Yang, X., Liang, H. F., and Zhang, W. G. (2022). Tumor-associated macrophages in liver cancer: ©rom mechanisms to therapy. Cancer Commun. 42, 1112–1140. doi:10.1002/cac2.12345
Cohen, J. C., Horton, J. D., and Hobbs, H. H. (2011). Human fatty liver disease: old questions and new insights. Science 332, 1519–1523. doi:10.1126/science.1204265
Crawford, L. A., and Weerapana, E. (2016). A tyrosine-reactive irreversible inhibitor for glutathione S-transferase Pi (GSTP1). Mol. Biosyst. 12, 1768–1771. doi:10.1039/c6mb00250a
Dang, D. T., Chen, F., Kohli, M., Rago, C., Cummins, J. M., and Dang, L. H. (2005). Glutathione S-transferase pi1 promotes tumorigenicity in HCT116 human colon cancer cells. Cancer Res. 65, 9485–9494. doi:10.1158/0008-5472.CAN-05-1930
Davies, S. M., Robison, L. L., Buckley, J. D., Tjoa, T., Woods, W. G., Radloff, G. A., et al. (2001). Glutathione S-transferase polymorphisms and outcome of chemotherapy in childhood acute myeloid leukemia. J. Clin. Oncol. 19, 1279–1287. doi:10.1200/JCO.2001.19.5.1279
Eichholzer, M., Stahelin, H. B., and Gey, K. F. (1992). Inverse correlation between essential antioxidants in plasma and subsequent risk to develop cancer, ischemic heart disease and stroke respectively: 12-year follow-up of the Prospective Basel Study. EXS 62, 398–410. doi:10.1007/978-3-0348-7460-1_38
Furukawa, S., Fujita, T., Shimabukuro, M., Iwaki, M., Yamada, Y., Nakajima, Y., et al. (2004). Increased oxidative stress in obesity and its impact on metabolic syndrome. J. Clin. Invest 114, 1752–1761. doi:10.1172/JCI21625
Geh, D., Gil, E. R., Laszczewska, M., Collins, A., Luli, S., Cameron, R., et al. (2023). Neutrophil degranulation and ageing as potential therapeutic targets in hepatocellular carcinoma? J. Hepatology 78, S542. doi:10.1016/s0168-8278(23)01314-4
Giorgio, M. (2015). Oxidative stress and the unfulfilled promises of antioxidant agents. Ecancermedicalscience 9, 556. doi:10.3332/ecancer.2015.556
Godic, A., Poljsak, B., Adamic, M., and Dahmane, R. (2014). The role of antioxidants in skin cancer prevention and treatment. Oxid. Med. Cell Longev. 2014, 860479. doi:10.1155/2014/860479
Hansson, J., Berhane, K., Castro, V. M., Jungnelius, U., Mannervik, B., and Ringborg, U. (1991). Sensitization of human melanoma cells to the cytotoxic effect of melphalan by the glutathione transferase inhibitor ethacrynic acid. Cancer Res. 51, 94–98.
Hayes, J. D., and Pulford, D. J. (1995). The glutathione S-transferase supergene family: regulation of GST and the contribution of the isoenzymes to cancer chemoprotection and drug resistance. Crit. Rev. Biochem. Mol. Biol. 30, 445–600. doi:10.3109/10409239509083491
Ho, C., Wang, C., Mattu, S., Destefanis, G., Ladu, S., Delogu, S., et al. (2012). AKT (v-akt murine thymoma viral oncogene homolog 1) and N-Ras (neuroblastoma ras viral oncogene homolog) coactivation in the mouse liver promotes rapid carcinogenesis by way of mTOR (mammalian target of rapamycin complex 1), FOXM1 (forkhead box M1)/SKP2, and c-Myc pathways. Hepatology 55, 833–845. doi:10.1002/hep.24736
Hoechst, B., Voigtlaender, T., Ormandy, L., Gamrekelashvili, J., Zhao, F., Wedemeyer, H., et al. (2009). Myeloid derived suppressor cells inhibit natural killer cells in patients with hepatocellular carcinoma via the NKp30 receptor. Hepatology 50, 799–807. doi:10.1002/hep.23054
Huang, D. Q., El-Serag, H. B., and Loomba, R. (2021). Global epidemiology of NAFLD-related HCC: trends, predictions, risk factors and prevention. Nat. Rev. Gastroenterol. Hepatol. 18, 223–238. doi:10.1038/s41575-020-00381-6
Huang, J., Tan, P. H., Thiyagarajan, J., and Bay, B. H. (2003). Prognostic significance of glutathione S-transferase-pi in invasive breast cancer. Mod. Pathol. 16, 558–565. doi:10.1097/01.MP.0000071842.83169.5A
Huynh, H., Nguyen, T. T., Chow, K. H., Tan, P. H., Soo, K. C., and Tran, E. (2003). Over-expression of the mitogen-activated protein kinase (MAPK) kinase (MEK)-MAPK in hepatocellular carcinoma: its role in tumor progression and apoptosis. BMC Gastroenterol. 3, 19. doi:10.1186/1471-230X-3-19
Ikeda, K., Sakai, K., Yamamoto, R., Hareyama, H., Tsumura, N., Watari, H., et al. (2003). Multivariate analysis for prognostic significance of histologic subtype, GST-pi, MDR-1, and p53 in stages II-IV ovarian cancer. Int. J. Gynecol. Cancer 13, 776–784. doi:10.1111/j.1525-1438.2003.13381.x
Jeon, B. T., Jeong, E. A., Shin, H. J., Lee, Y., Lee, D. H., Kim, H. J., et al. (2012). Resveratrol attenuates obesity-associated peripheral and central inflammation and improves memory deficit in mice fed a high-fat diet. Diabetes 61, 1444–1454. doi:10.2337/db11-1498
Kawada, N., and Otogawa, K. (2007). Role of oxidative stress and Kupffer cells in hepatic fibrosis. J. Gastroenterol. Hepatol. 22 (Suppl. 1), S85–S86. doi:10.1111/j.1440-1746.2006.04661.x
Klein, E. A., Thompson, I. M., Tangen, C. M., Crowley, J. J., Lucia, M. S., Goodman, P. J., et al. (2011). Vitamin E and the risk of prostate cancer: the selenium and vitamin E cancer prevention trial (SELECT). JAMA 306, 1549–1556. doi:10.1001/jama.2011.1437
Lee, S. A., Ho, C., Roy, R., Kosinski, C., Patil, M. A., Tward, A. D., et al. (2008). Integration of genomic analysis and in vivo transfection to identify sprouty 2 as a candidate tumor suppressor in liver cancer. Hepatology 47, 1200–1210. doi:10.1002/hep.22169
Le Gal, K., Ibrahim, M. X., Wiel, C., Sayin, V. I., Akula, M. K., Karlsson, C., et al. (2015). Antioxidants can increase melanoma metastasis in mice. Sci. Transl. Med. 7, 308re8. doi:10.1126/scitranslmed.aad3740
Leonard, S. S., Xia, C., Jiang, B. H., Stinefelt, B., Klandorf, H., Harris, G. K., et al. (2003). Resveratrol scavenges reactive oxygen species and effects radical-induced cellular responses. Biochem. Biophys. Res. Commun. 309, 1017–1026. doi:10.1016/j.bbrc.2003.08.105
Li, S., Ye, L., Yu, X., Xu, B., Li, K., Zhu, X., et al. (2009). Hepatitis C virus NS4B induces unfolded protein response and endoplasmic reticulum overload response-dependent NF-kappaB activation. Virology 391, 257–264. doi:10.1016/j.virol.2009.06.039
Lin, H., Liu, X. B., Yu, J. J., Hua, F., and Hu, Z. W. (2013). Antioxidant N-acetylcysteine attenuates hepatocarcinogenesis by inhibiting ROS/ER stress in TLR2 deficient mouse. PLoS One 8, e74130. doi:10.1371/journal.pone.0074130
Liu, Y., Tong, L., Luo, Y., Li, X., Chen, G., and Wang, Y. (2018). Resveratrol inhibits the proliferation and induces the apoptosis in ovarian cancer cells via inhibiting glycolysis and targeting AMPK/mTOR signaling pathway. J. Cell Biochem. 119, 6162–6172. doi:10.1002/jcb.26822
Llovet, J. M., Villanueva, A., Lachenmayer, A., and Finn, R. S. (2015). Advances in targeted therapies for hepatocellular carcinoma in the genomic era. Nat. Rev. Clin. Oncol. 12, 436. doi:10.1038/nrclinonc.2015.121
Ma, Y., Gao, M., and Liu, D. (2016). N-Acetylcysteine protects mice from high fat diet-induced metabolic disorders. Pharm. Res. 33, 2033–2042. doi:10.1007/s11095-016-1941-1
Ma, Z. Y., Yang, M. K., Foda, M. F., Zhang, K., Li, S. T., Liang, H. G., et al. (2022). Polarization of tumor-associated macrophages promoted by vitamin C-loaded liposomes for cancer immunotherapy. Acs Nano 16, 17389–17401. doi:10.1021/acsnano.2c08446
Madala, H. R., Punganuru, S. R., and Kalkunte, S. (2017). Synthesis of a novel non-diuretic, brain-penetrating, ethacrynic acid analog and demonstration of its potent efficacy in orthotopic glioblastoma (GBM) models. Faseb J. 31. doi:10.1096/fasebj.31.1_supplement.178.1
Moon, H., and Ro, S. W. (2021). MAPK/ERK signaling pathway in hepatocellular carcinoma. Cancers (Basel) 13, 3026. doi:10.3390/cancers13123026
Morselli, E., Maiuri, M. C., Markaki, M., Megalou, E., Pasparaki, A., Palikaras, K., et al. (2010). Caloric restriction and resveratrol promote longevity through the Sirtuin-1-dependent induction of autophagy. Cell Death Dis. 1, e10. doi:10.1038/cddis.2009.8
Nelson, M. E., Lahiri, S., Chow, J. D., Byrne, F. L., Hargett, S. R., Breen, D. S., et al. (2017). Inhibition of hepatic lipogenesis enhances liver tumorigenesis by increasing antioxidant defence and promoting cell survival. Nat. Commun. 8, 14689. doi:10.1038/ncomms14689
Neves, A. R., Lucio, M., Lima, J. L., and Reis, S. (2012). Resveratrol in medicinal chemistry: a critical review of its pharmacokinetics, drug-delivery, and membrane interactions. Curr. Med. Chem. 19, 1663–1681. doi:10.2174/092986712799945085
Parekh, S., and Anania, F. A. (2007). Abnormal lipid and glucose metabolism in obesity: implications for nonalcoholic fatty liver disease. Gastroenterology 132, 2191–2207. doi:10.1053/j.gastro.2007.03.055
Park, E. J., Lee, J. H., Yu, G. Y., He, G., Ali, S. R., Holzer, R. G., et al. (2010). Dietary and genetic obesity promote liver inflammation and tumorigenesis by enhancing IL-6 and TNF expression. Cell 140, 197–208. doi:10.1016/j.cell.2009.12.052
Park, S.-J., Ahmad, F., Philp, A., Baar, K., Williams, T., Luo, H., et al. (2012). Resveratrol ameliorates aging-related metabolic phenotypes by inhibiting cAMP phosphodiesterases. Cell 148, 421–433. doi:10.1016/j.cell.2012.01.017
Podrini, C., Borghesan, M., Greco, A., Pazienza, V., Mazzoccoli, G., and Vinciguerra, M. (2013). Redox homeostasis and epigenetics in non-alcoholic fatty liver disease (NAFLD). Curr. Pharm. Des. 19, 2737–2746. doi:10.2174/1381612811319150009
Russo, G. L., Tedesco, I., Spagnuolo, C., and Russo, M. (2017). Antioxidant polyphenols in cancer treatment: friend, foe or foil? Semin. Cancer Biol. 46, 1–13. doi:10.1016/j.semcancer.2017.05.005
Sablina, A. A., Budanov, A. V., Ilyinskaya, G. V., Agapova, L. S., Kravchenko, J. E., and Chumakov, P. M. (2005). The antioxidant function of the p53 tumor suppressor. Nat. Med. 11, 1306–1313. doi:10.1038/nm1320
Sadowska, A. M. (2012). N-Acetylcysteine mucolysis in the management of chronic obstructive pulmonary disease. Ther. Adv. Respir. Dis. 6, 127–135. doi:10.1177/1753465812437563
Samuni, Y., Goldstein, S., Dean, O. M., and Berk, M. (2013). The chemistry and biological activities of N-acetylcysteine. Biochim. Biophys. Acta 1830, 4117–4129. doi:10.1016/j.bbagen.2013.04.016
Satoh, K., Kitahara, A., Soma, Y., Inaba, Y., Hatayama, I., and Sato, K. (1985). Purification, induction, and distribution of placental glutathione transferase: a new marker enzyme for preneoplastic cells in the rat chemical hepatocarcinogenesis. Proc. Natl. Acad. Sci. U. S. A. 82, 3964–3968. doi:10.1073/pnas.82.12.3964
Sawers, L., Ferguson, M. J., Ihrig, B. R., Young, H. C., Chakravarty, P., Wolf, C. R., et al. (2014). Glutathione S-transferase P1 (GSTP1) directly influences platinum drug chemosensitivity in ovarian tumour cell lines. Br. J. Cancer 111, 1150–1158. doi:10.1038/bjc.2014.386
Sayin, V. I., Ibrahim, M. X., Larsson, E., Nilsson, J. A., Lindahl, P., and Bergo, M. O. (2014). Antioxidants accelerate lung cancer progression in mice. Sci. Transl. Med. 6, 221ra15. doi:10.1126/scitranslmed.3007653
Schafer, F. Q., and Buettner, G. R. (2001). Redox environment of the cell as viewed through the redox state of the glutathione disulfide/glutathione couple. Free Radic. Biol. Med. 30, 1191–1212. doi:10.1016/s0891-5849(01)00480-4
Schafer, Z. T., Grassian, A. R., Song, L., Jiang, Z., Gerhart-Hines, Z., Irie, H. Y., et al. (2009). Antioxidant and oncogene rescue of metabolic defects caused by loss of matrix attachment. Nature 461, 109–113. doi:10.1038/nature08268
Sciskalska, M., and Milnerowicz, H. (2020). The role of GSTπ isoform in the cells signalling and anticancer therapy. Eur. Rev. Med. Pharmacol. Sci. 24, 8537–8550. doi:10.26355/eurrev_202008_22650
Semba, R. D., Ferrucci, L., Bartali, B., Urpi-Sarda, M., Zamora-Ros, R., Sun, K., et al. (2014). Resveratrol levels and all-cause mortality in older community-dwelling adults. JAMA Intern Med. 174, 1077–1084. doi:10.1001/jamainternmed.2014.1582
Shea, T. C., Kelley, S. L., and Henner, W. D. (1988). Identification of an anionic form of glutathione transferase present in many human tumors and human tumor cell lines. Cancer Res. 48, 527–533.
Shin, S. J. (2003). Vitamin E modulates radiation-induced oxidative damage in mice fed a high-lipid diet. J. Biochem. Mol. Biol. 36, 190–195. doi:10.5483/bmbrep.2003.36.2.190
Sjogren, A. K., Andersson, K. M., Liu, M., Cutts, B. A., Karlsson, C., Wahlstrom, A. M., et al. (2007). GGTase-I deficiency reduces tumor formation and improves survival in mice with K-RAS-induced lung cancer. J. Clin. Invest 117, 1294–1304. doi:10.1172/JCI30868
Soyoung, K., Yoojeong, J., Youngshim, C., and Taesun, P. (2011). Resveratrol exerts anti-obesity effects via mechanisms involving down-regulation of adipogenic and inflammatory processes in mice. Proc. Nutr. Soc. 70, E140. doi:10.1017/S0029665111001911
Su, F., Hu, X., Jia, W., Gong, C., Song, E., and Hamar, P. (2003). Glutathion S transferase pi indicates chemotherapy resistance in breast cancer. J. Surg. Res. 113, 102–108. doi:10.1016/s0022-4804(03)00200-2
Sui, X., Kong, N., Ye, L., Han, W., Zhou, J., Zhang, Q., et al. (2014). p38 and JNK MAPK pathways control the balance of apoptosis and autophagy in response to chemotherapeutic agents. Cancer Lett. 344, 174–179. doi:10.1016/j.canlet.2013.11.019
Sun, C. B., Zhang, J., Hou, J., Hui, M. L., Qi, H. L., Lei, T., et al. (2023). Induction of autophagy via the PI3K/Akt/mTOR signaling pathway by Pueraria flavonoids improves non-alcoholic fatty liver disease in obese mice. Biomed. & Pharmacother. 157, 114005. doi:10.1016/J.Biopha.2022.114005
Sung, H., Ferlay, J., Siegel, R. L., Laversanne, M., Soerjomataram, I., Jemal, A., et al. (2021). Global cancer statistics 2020: GLOBOCAN estimates of incidence and mortality worldwide for 36 cancers in 185 countries. CA Cancer J. Clin. 71, 209–249. doi:10.3322/caac.21660
Tamimi, R. M., Hankinson, S. E., Campos, H., Spiegelman, D., Zhang, S., Colditz, G. A., et al. (2005). Plasma carotenoids, retinol, and tocopherols and risk of breast cancer. Am. J. Epidemiol. 161, 153–160. doi:10.1093/aje/kwi030
Taubes, G. (2012). Cancer research. Unraveling the obesity-cancer connection. Science 335 (28), 30–32. doi:10.1126/science.335.6064.28
Tennen, R. I., Michishita-Kioi, E., and Chua, K. F. (2012). Finding a target for resveratrol. Cell 148, 387–389. doi:10.1016/j.cell.2012.01.032
Thevenin, A. F., Zony, C. L., Bahnson, B. J., and Colman, R. F. (2011). GST pi modulates JNK activity through a direct interaction with JNK substrate, ATF2. Protein Sci. 20, 834–848. doi:10.1002/pro.609
Townsend, D. M., and Tew, K. D. (2003). The role of glutathione-S-transferase in anti-cancer drug resistance. Oncogene 22, 7369–7375. doi:10.1038/sj.onc.1206940
van Zandwijk, N., Dalesio, O., Pastorino, U., de Vries, N., and van Tinteren, H. (2000). EUROSCAN, a randomized trial of vitamin A and N-acetylcysteine in patients with head and neck cancer or lung cancer. For the EUropean organization for research and treatment of cancer head and neck and lung cancer cooperative groups. J. Natl. Cancer Inst. 92, 977–986. doi:10.1093/jnci/92.12.977
Vernon, G., Baranova, A., and Younossi, Z. M. (2011). Systematic review: the epidemiology and natural history of non-alcoholic fatty liver disease and non-alcoholic steatohepatitis in adults. Aliment. Pharmacol. Ther. 34, 274–285. doi:10.1111/j.1365-2036.2011.04724.x
Wang, B., Shen, C., Li, Y., Zhang, T., Huang, H., Ren, J., et al. (2019). Oridonin overcomes the gemcitabine resistant PANC-1/Gem cells by regulating GST pi and LRP/1 ERK/JNK signalling. Onco Targets Ther. 12, 5751–5765. doi:10.2147/OTT.S208924
Wang, B. B., Fu, J., Yu, T., Xu, A., Qin, W. H., Yang, Z. S., et al. (2018a). Contradictory effects of mitochondria- and non-mitochondria-targeted antioxidants on hepatocarcinogenesis by altering DNA repair in mice. Hepatology 67, 623–635. doi:10.1002/hep.29518
Wang, J., Sun, P., Chen, Y., Yao, H., and Wang, S. (2018b). Novel 2-phenyloxypyrimidine derivative induces apoptosis and autophagy via inhibiting PI3K pathway and activating MAPK/ERK signaling in hepatocellular carcinoma cells. Sci. Rep. 8, 10923. doi:10.1038/s41598-018-29199-8
Wang, T. J., Xu, C. R., Zhang, Z. J., Wu, H., Li, X. J., Zhang, Y., et al. (2022). Cellular heterogeneity and transcriptomic profiles during intrahepatic cholangiocarcinoma initiation and progression. Hepatology 76, 1302–1317. doi:10.1002/hep.32483
Westerlund, A., Steineck, G., Balter, K., Stattin, P., Gronberg, H., and Hedelin, M. (2011). Dietary supplement use patterns in men with prostate cancer: the Cancer Prostate Sweden study. Ann. Oncol. 22, 967–972. doi:10.1093/annonc/mdq456
Willcox, J. K., Ash, S. L., and Catignani, G. L. (2004). Antioxidants and prevention of chronic disease. Crit. Rev. Food Sci. Nutr. 44, 275–295. doi:10.1080/10408690490468489
Wisniewski, J. R., Zougman, A., Nagaraj, N., and Mann, M. (2009). Universal sample preparation method for proteome analysis. Nat. Methods 6, 359–362. doi:10.1038/nmeth.1322
Yasuno, T., Matsumura, T., Shikata, T., Inazawa, J., Sakabe, T., Tsuchida, S., et al. (1999). Establishment and characterization of a cisplatin-resistant human neuroblastoma cell line. Anticancer Res. 19, 4049–4057.
Zhang, C. Y., Liu, S., and Yang, M. (2022). Regulatory T cells and their associated factors in hepatocellular carcinoma development and therapy. World J. Gastroenterology 28, 3346–3358. doi:10.3748/wjg.v28.i27.3346
Zhang, S., Hunter, D. J., Forman, M. R., Rosner, B. A., Speizer, F. E., Colditz, G. A., et al. (1999). Dietary carotenoids and vitamins A, C, and E and risk of breast cancer. J. Natl. Cancer Inst. 91, 547–556. doi:10.1093/jnci/91.6.547
Zhang, X. H., Huang, C. Y., Cui, B. Y., Pang, Y. B., Liang, R., and Luo, X. L. (2021). Ethacrynic acid enhances the antitumor effects of afatinib in EGFR/T790M-Mutated NSCLC by inhibiting WNT/Beta-Catenin pathway activation. Dis. Markers 2021, 5530673. doi:10.1155/2021/5530673
Keywords: antioxidant, hepatocellular carcinoma, resveratrol, N-acetylcystein, GST-Pi
Citation: Zhang M, Yuan W, Li C, Chen C, Liu X, Ma Z, Xiang Y, Chen G, Wang C, Li L, Wang L, Xu Z and Xu C (2025) Resveratrol and N-acetylcystein reduce hepatic steatosis but enhance initiation and progression of hepatocellular carcinoma by inhibiting GST-pi-MAPK axis in mice. Front. Pharmacol. 16:1574039. doi: 10.3389/fphar.2025.1574039
Received: 10 February 2025; Accepted: 17 April 2025;
Published: 28 April 2025.
Edited by:
Raffaele Capasso, University of Naples Federico II, ItalyCopyright © 2025 Zhang, Yuan, Li, Chen, Liu, Ma, Xiang, Chen, Wang, Li, Wang, Xu and Xu. This is an open-access article distributed under the terms of the Creative Commons Attribution License (CC BY). The use, distribution or reproduction in other forums is permitted, provided the original author(s) and the copyright owner(s) are credited and that the original publication in this journal is cited, in accordance with accepted academic practice. No use, distribution or reproduction is permitted which does not comply with these terms.
*Correspondence: Lingli Wang, d2xpbmdsaUBnenVjbS5lZHUuY24=; Zhong Xu, eHVjb25nMDU2N0AxNjMuY29t; Chuanrui Xu, eGNyQGh1c3QuZWR1LmNu
†These authors have contributed equally to this work and share first authorship