 Seungchan Choi
 Suemin Park
 Jinah Jung3
 Siook Baek
 Hyeong-Seok Lim
- 1Department of Clinical Pharmacology and Therapeutics, Asan Medical Center, University of Ulsan College of Medicine, Seoul, Republic of Korea
- 2Department of Medical Science and Asan Medical Institute of Convergence Science and Technology, Asan Medical Center, University of Ulsan College of Medicine, Seoul, Republic of Korea
- 3Samsung Bioepis Co., Ltd., Incheon, Republic of Korea
Background: This analysis aims to evaluate the population pharmacokinetics (PK) and pharmacodynamics (PD) of denosumab and applied a population PK/PD approach to assess the biosimilarity of SB16 in comparison to reference product, denosumab (DEN).
Methods: Pooled serum concentrations data for SB16 and DEN from male healthy volunteers (HV) in the Phase I and from postmenopausal women with osteoporosis (PMO) Phase III studies, along with lumbar spine bone mineral density (BMD) data from Phase III study, were analyzed using a nonlinear mixed effects population PK/PD sequential modeling approach. The effects of key patient variables on PK/PD parameters were assessed. Treatment effects on clearance (CL) were retained in the model, regardless of statistical significance, to enable comparative simulation between SB16 and DEN. Modeling and simulation were performed using Monolix Suite™.
Results: A two-compartment target-mediated drug disposition (TMDD) model with quasi-steady state (QSS) approximation and first-order absorption adequately characterized the PK profile of denosumab. An indirect response model with maximal inhibitory function captured changes in lumbar spine BMD following treatment. The study population had a minimal effect on drug exposure and on changes in BMD, with <5% difference. Race and body weight accounted for up to 19% and 45% of the variability in drug exposure, respectively, but these differences translated into less than a 2% difference in changes in BMD for each covariate. The treatment group (SB16 vs. DEN) was not identified as a significant covariate. Including this factor on CL in the final PK/PD model, irrespective of its statistical significance, did not affect the PK/PD parameter estimates. Comparative simulations showed similar results for both treatment groups.
Conclusion: The developed TMDD-QSS model with indirect response model adequately characterized the PK/PD profile of denosumab. Covariate effects, including study population (HV vs. PMO), age, and race showed no clinically meaningful impact on treatment outcomes. Covariate analysis and simulation results revealed no significant differences in PK/PD parameters between SB16 and DEN. The similarity in the PK profile and change in lumbar spine BMD between SB16 and DEN were demonstrated, supporting the potential for SB16 to be substituted for the reference product in the treatment of osteoporosis.
1 Introduction
Denosumab is a fully human monoclonal IgG2 antibody that binds with high affinity and specificity to receptor activator of nuclear factor kappa-Β ligand (RANKL), a critical regulator of osteoclast formation, function, and survival. By inhibiting the interaction between RANKL and its receptor RANK on osteoclast precursors and mature osteoclasts, denosumab suppresses osteoclast-mediated bone resorption, thereby increasing bone mineral density (BMD) and reducing the risk of fractures (Hanley et al., 2012; Teitelbaum, 2000).
SB16 is a biosimilar product of reference denosumab (DEN), approved in the EU under the brand names Obodence™ and Xbryk® (European Medicines Agency, 2024b). In the US, SB16 is approved under the brand names Ospomyv™ and Xbryk® (denosumab-dssb) (U.S. Food and Drug Administration, 2025). The similarity of SB16 to DEN was established based on totality-of-evidence data, including comprehensive evaluation of physicochemical characteristics, biological activities, and clinical performance. To support clinical similarity, pharmacokinetic (PK) bioequivalence between SB16, EU-sourced reference denosumab (EU-DEN), and US-sourced denosumab (US-DEN) was demonstrated in a Phase I, randomized, double-blind, single-dose study (SB16-1001; NCT 04621318) involving healthy male participants. Additionally, SB16 exhibited comparable pharmacodynamics (PD), safety, and immunogenicity profiles. The 90% confidence intervals (CIs) for the pairwise comparison of geometric least-squares mean ratios for the area under the concentration-time curve extrapolated to infinity (AUCinf), area under the concentration-time curve up to the last quantifiable concentration (AUClast), and the maximum serum concentration of a drug (Cmax) were all within the predefined margin of 0.80–1.25 (Lee et al., 2023). In a Phase III study (SB16-3001; NCT04664959) involving postmenopausal women with osteoporosis (PMO), clinical equivalence between SB16 and EU-DEN was demonstrated with respect to efficacy, safety, PK, PD, and immunogenicity. The 95% CI for the least-squares mean difference in percent change from baseline in lumbar spine BMD at month 12 fell within the prespecified equivalence margin, supporting comparable therapeutic effects between the two treatments (Langdahl et al., 2024).
The serum concentration-time profiles of denosumab were described using a two-compartment model with first-order absorption and parallel linear and non-linear elimination pathways. The observed non-linearity in PK is likely attributable to the binding of denosumab to RANK, which serves as a hallmark evidence of target-mediated drug disposition (TMDD). A prior population PK analysis showed that a fixed 60 mg dose produced a level of RANKL inhibition comparable to that achieved by weight-based dosing (Sutjandra et al., 2011; U.S. Food and Drug Administration, 2010; Dua et al., 2015). Denosumab PK parameters are influenced on body weight; however, the resulting differences in drug exposure did not translate into variability in the PD response (European Medicines Agency, 2010). A previous report (Marathe et al., 2011) on integrated PD models of denosumab treatment characterized the time course of BMD and bone turnover markers (BTM) using mean data reported in the literature (Hasegawa et al., 2014). To our knowledge, no formal population PK/PD analysis has been conducted using the individual level data. Therefore, the objective of our PK/PD modeling and simulation was: 1) to evaluate PK and PD characteristics of denosumab based on the pooled individual data from healthy volunteers (HV) and PMO patients, including the evaluation of key covariates influencing denosumab PK/PD; and 2) to compare the PK/PD profiles of SB16, a biosimilar, with those of the reference product, DEN.
2 Materials and methods
2.1 Study population
Population PK/PD analyses were conducted using pooled clinical data from a Phase I comparative PK study (SB16-1001) in healthy male subjects and a Phase III comparative efficacy and safety study (SB16-3001) in patients with PMO (Table 1). In the Phase I study, 168 male healthy volunteers (HV) were randomized to receive a single subcutaneous (SC) dose of 60 mg SB16, EU-DEN, or US-DEN (Lee et al., 2024). In the Phase III study, 456 PMO patients were randomized to receive either SB16 or reference EU-DEN 60 mg SC at month 0 and month 6. At month 12, patients initially treated with EU-DEN were randomized again to either continue on EU-DEN or were transitioned to SB16. Patients in the SB16 treatment group continued to receive SB16 at month 12 (Langdahl et al., 2024). The key demographic and clinical characteristics of the two study populations are summarized in Table 2. The difference in age, gender, height, and body weight among the subjects reflected the inherent distinctions between the study population (I.e., male HV vs. female PMO patients). Most subjects in both studies were Caucasian. These subject characteristics were considered during the model development process.
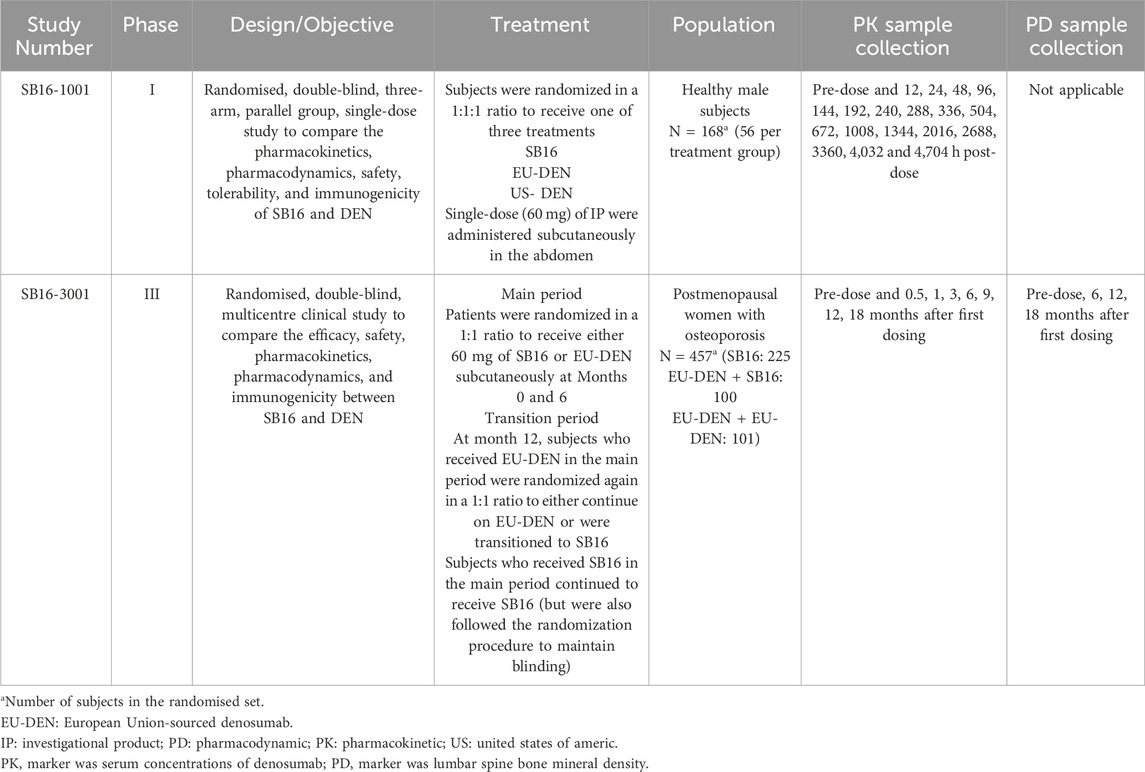
Table 1. Overview of SB16 comparative studies included in the population PK/PD analysis.
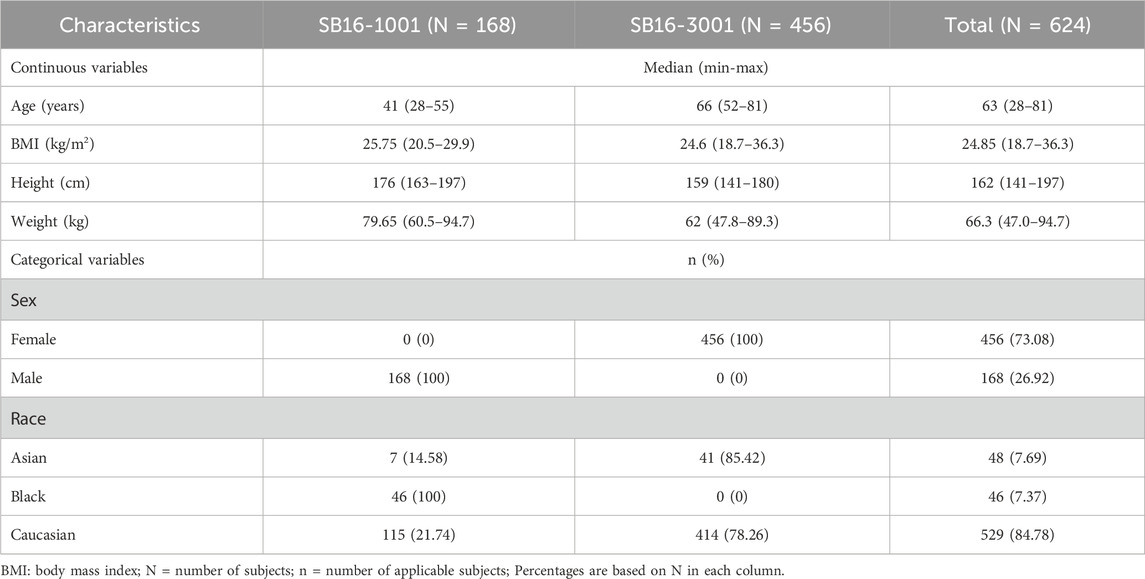
Table 2. Summary of subject characteristics in SB16 clinical studies included in population PK/PD analysis.
Both clinical trials were conducted in accordance with the Declaration of Helsinki (1996), the International Council for Harmonisation E6 (R2) Good Clinical Practice guidelines, and all applicable local regulatory requirements. Study protocols were reviewed and approved by the relevant Institutional Review Boards or Independent Ethics Committees at each study center. Written informed consent was obtained from all participants prior to enrollment.
2.2 Dataset and measurements
Overall, 6,583 serum denosumab concentration data points from 615 subjects across the Phase I and III studies, collected at prespecified timepoints in each study, along with 1,716 lumbar spine bone mineral density (BMD) measurements from 456 patients in the Phase III study, were included in the for PK/PD modeling (Table 1). In addition, a comparison of subject characteristics between DEN and SB16 in the Phase III study (SB16-3001) is provided in Supplementary Table S1.
All samples were analyzed at certified laboratories using validated analytical methods. Serum denosumab concentrations were measured employing a validated electrochemiluminescence immunoassay (ECLIA) specifically developed for the detection and quantification of denosumab. The lower limit of quantification (LLOQ) for this assay was 20 ng/mL. Among these, 615 pre-dose samples (9.34%) with concentrations below the LLOQ were set to zero for model initialization.
Of the 4,262 post-dose serum concentration samples, 3,133 samples (73.51%) were quantifiable and included in the model estimation, while 1,129 samples (26.49%) were below the LLOQ and thus treated as missing values (MDV = 1). Although excluded from the likelihood calculation, they were retained in the dataset to preserve the time structure and dosing history, ensuring accurate model fitting and simulation.
BMD of the lumbar spine (L1-4) vertebrae were measured during screening and prior to dosing at months 6, 12, and 18 using dual-energy X-ray absorptiometry (DXA) scanners from either GE Lunar [GE Healthcare, Chicago, IL, United States] or Hologic [Marlborough, MA, United States]. All scanners were certified, and DXA scan images were analyzed by the central reading center Calyx [Massachusetts, MA, United States] accordance with established practice guidelines. All patients’ subsequent DXA scans were acquired on the same scanner on which they had their baseline scan in screening. Investigator sites conducted quality control activities for DXA systems prior to the first patient scan (EMA, 2025).
2.3 Overall strategies for PK/PD modeling
An overview of the full modeling and simulation workflow is provided in Figure 1. In summary, serum concentration data pooled from the Phase I and III studies were analyzed using a nonlinear mixed effects population modeling approach. Covariate screening was subsequently performed during PK modeling to identify significant predictors of PK parameters and to explore potential differences in PK profiles between the biosimilar, SB16 and the reference product, DEN.
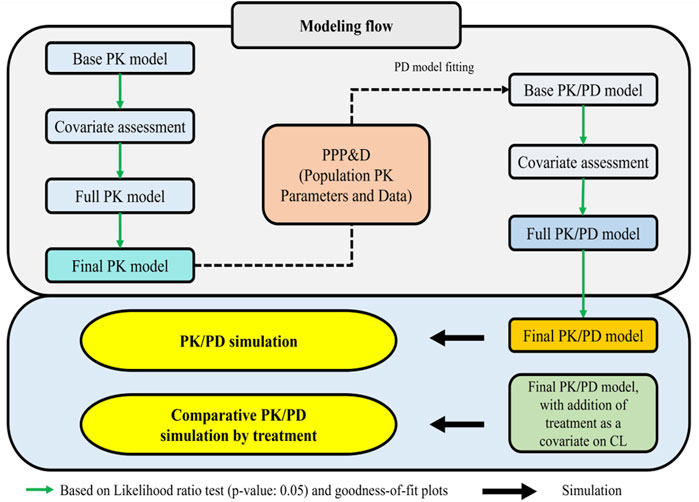
Figure 1. Workflow for PK/PD model and prediction of PK/PD profiles of denosumab CL: clearance; PD: pharmacodynamic; PK: pharmacokinetic: PPP&D: population PK parameters and data.
PK/PD modeling was conducted in a sequential Population PK parameters and Data (PPP&D) method approach. The population PK parameters estimated from the PK model were fixed in the PK-PD model, and both PK and PD data were used simultaneously to estimate PD parameters and their IIV, as well as the individual PK parameters (Lunn et al., 2009; Lacroix et al., 2012; Zhang et al., 2003).
Covariate screening was also conducted during PD modeling to identify significant predictors of the PD outcome and to assess treatment effects (SB16 vs. DEN). In the final PK/PD model, treatment effects on clearance (CL) were intentionally included irrespective of statistical significance to enable comparative simulations between SB16 and DEN.
All PK/PD models were implemented using the stochastic approximation expectation-maximization (SAEM) method in Monolix Suite™ 2024R1 (Lixoft SAS, Antony, France), and data processing was performed using R software v4.3.1 (R Foundation for Statistical Computing, Vienna, Austria).
2.4 Population PK/PD structural model
Consistent with the known PK characteristics of denosumab, exploratory analysis of serum concentration-time profiles following administration of SB16 and EU/US-DEN exhibited target-mediated drug disposition (TMDD) (Sutjandra et al., 2011; Gabrielsson et al., 2016). Accordingly, one and two-compartmental TMDD models with several approximations to drug-target receptor binding kinetics were tested (Dua et al., 2015; Gibiansky et al., 2008), and a two-compartment, quasi-steady-state (QSS) approximation of the TMDD model best described the PK data (Figure 2). The amount of drug administered subcutaneously (
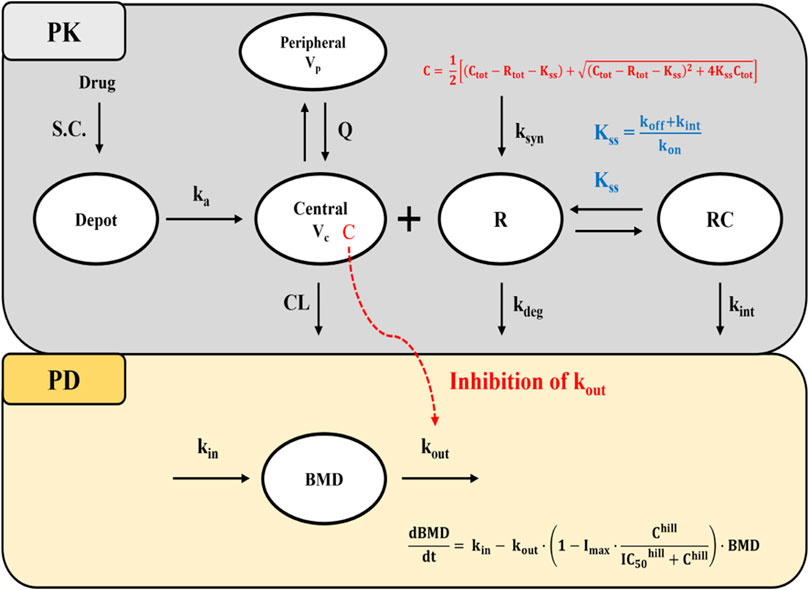
Figure 2. Schematic diagram of the QSS TMDD model and turnover model with inhibitory effect on kout. Abbreviations: S.C, subcutaneous; BMD: bone mineral density; ka: first-order absorption rate constant; CL: clearance; Q: inter-compartmental clearance; Vc: volume of distribution in the central compartment; Vp: volume of distribution in the peripheral compartment; Kss: quasi-steady-state equilibrium constant; kon: second-order association rate constant; koff: first-order dissociation rate constant; kdeg: first-order target degradation rate constant; kint: first-order internalization rate constant of the drug-target complex; ksyn: zero-order target synthesis rate constant; IC50: drug concentration that produces 50% of the maximum inhibition; Imax: Maximum inhibitory effect of drug; kin: zero-order rate constant for BMD synthesis; kout: first-order rate constant for BMD elimination; hill: hill coefficient; C:free drug concentration; Ctot: total drug concentration; Rtot: total target receptor concentration; Note that R and RC compartments represent the total target receptor activator of nuclear factor kappa-B ligand (RANKL) and RANKL-drug complexes, respectively.
In the absence of drug target level data, it was assumed that the free drug, target, and drug-target complex are in a QSS, where the binding rate is balanced by the sum of dissociation and internalization rates. This is described by steady-state constant
Under QSS conditions, the concentration of free drug (C) and drug-target complexes (RC) are described using Equation 5–6:
Prior to drug administration, it was assumed that the turnover rate of free target receptors (
For the PD model, an indirect response model based on turnover kinetics was employed to describe the changes in BMD following drug administration. Based on the mechanism of action of denosumab which reduces bone resorption by preventing formation and activity of osteoclast the inhibition of the elimination rate of lumbar spine BMD (
Prior to drug administration, it was assumed that the BMD turnover system was at steady state, such that the BMD production rate constant (kin) equals the product of the BMD elimination rate constant (kout) and the baseline BMD (BMD0), as shown in Equation 9:
Under this assumption, kin was not directly estimated but calculated accordingly.
To confine the estimated Imax parameter within the biologically plausible range of 0 and 1, and to implement interindividual variability on Imax, a logit transformation was applied as shown in Equation 10 (Adedokun et al., 2020):
where ImaxF is an unbounded parameter representing the logit-transformed value of Imax.
2.5 Statistical model
Interindividual variability (IIV) in most PK/PD parameters was modeled using an exponential distribution (Equation 11). The IIV for ith individual, ηi, is a random variable assumed to be independently selected from normal distribution with a mean of zero and variance of ω2.
where
The residual error model describing the difference between observed and the model-predicted values was selected based on the likelihood ratio test (LRT) and inspection of goodness-of-fit (GOF) plots.
Based on the analysis, a combined error model (Equation 12) was selected to describe the residual error in serum denosumab concentration, and an additive error model (Equation 13) was selected for lumbar spine BMD. The residual variability (RV) for the jth observed value in the ith individual, εadd,ij, εprop,ij, represent additive and proportional components, respectively. These errors are assumed to be independent and normal distribution, each with a mean of zero and a variance of σ2.
where yij: jth observed value in the ith individual; IPREDij: jth model predicted value in the ith individual; εadd,ij additive error; εprop,ij proportional error.
2.6 Model selection and evaluation
Model discrimination and validation were performed using statistical and graphical approaches. For statistical methods, the LRT was used to differentiate between hierarchical models at p-value <0.05, considering that the difference of −2 log-likelihood (-2LL) of the model follows an approximate chi-square distribution. A p-value of 0.05, corresponding to a decrease in objective function value (OFV) of 3.84 points, was considered as statistically significant. For the Wald test, a 95% CI for each parameter estimate was constructed using the point estimate and standard error derived from the model outcomes and checked if 95% CI excluded 0.
Basic GOF plots and visual predicted checks (VPCs) were applied to compare the observed values and model-predicted values, and model prediction was evaluated in terms of central tendency and variability. VPCs were performed by simulating 1000 replicates, and the resulting simulations were overlaid and compared with the original PK/PD data in plots generated using Monolix.
2.7 Covariate assessment
Covariate selection was performed using the conditional sampling use for the stepwise approach based on the correlation (COSSAC) algorithm, as implemented in Monolix. Study population (HV vs. PMO patients), body weight, age, race, and treatment group (biosimilar SB16 vs. DEN) were tested on relevant PK/PD parameters. At each iteration for covariate screening, covariates were checked for addition at p-value of 0.01 corresponding to a 6.635 points difference in log-likelihood (LL) then removal at p-value of 0.001 corresponding to 10.828 points difference in LL. The procedure alternated between forward inclusion and backward elimination steps, and the final model was selected based on the LRT (Ayral et al., 2021).
Continuous covariates were incorporated into the model using a normalized power function centered at the median value, and categorical covariates were modeled using an exponential function as presented in Equations 14, 15respectively:
where TVPi is the typical value for ith individual, Covi is the ith individual covariate value, Covref is the reference (median) value, θ is the estimated covariate effect, and Cati is a binary indicator variable representing the categorical covariate (1 for tested variable, 0 for reference).
The final covariate model was automatically selected by the COSSAC algorithm as the model with the lowest −2 log-likelihood among the candidate models explored through stepwise forward and backward procedures. After selection, the numerical stability of parameter estimates (e.g., standard errors and relative standard errors) was evaluated, and covariates associated with unstable estimates were removed.
2.8 Model-based simulation
Monte-Carlo simulations of serum denosumab concentration-time and lumbar spine BMD-time profile were performed by the treatment group and covariate subgroups using Simulx (Monolix Suite™ 2024R1). The simulations were based on the final population PK/PD models. For each of SB16 and EU/US-DEN treatment groups, simulation data were generated for 1,000 virtual participants receiving three successive SC administrations of 60 mg of drug at 6-month interval. The IIV and RV were incorporated to reflect population variability. Covariates were fixed based on predefined subgroup scenarios rather than sampled from distributions.
The fifth, 50th (median), and 95th percentiles of the PK metrics were calculated and compared across subgroups identified as significant predictors of PK during covariate assessment. Similarly, the percentage change from baseline in lumbar spine BMD was calculated and summarized using the median and 90% prediction interval (PI) for each subgroup.
2.9 PK/PD comparison between treatments
The treatment effects of the biosimilar SB16 and reference DEN, pooled from EU/US-DEN data, on the CL and Imax were assessed during covariate analysis. Furthermore, empirical Bayes estimates (EBEs) for key PK and PD parameters were visually compared between the two treatments using boxplots.
For the simulations used to compare PK and PD profiles of SB16 and DEN, the treatment group was intentionally retained as a covariate in the final PK/PD model, irrespective of its statistical significance in the covariate analysis. For each subject, PK metrics such as Cmax, time to peak drug concentration (Tmax) and area under the concentration-time curve within a dosing interval (τ) at steady state (AUCτ,ss) and change from baseline in lumbar spine BMD were calculated from the simulation data. The median and 90% PI were then summarized and compared between the two treatment groups.
3 Results
3.1 PK/PD model
The PK of denosumab was well-described by a two-compartment TMDD model with QSS approximation, adequately characterizing data from the Phase I study in healthy male volunteers and the Phase III study in female PMO patients (Table 3). IIV was estimated for all PK parameters. Statistically significant correlation between IIVs of CL/F and VP/F was identified after testing the correlations among all the IIVs. The PD model was described using an indirect response model with inhibitory effect on the elimination process (Table 4). Including IIV on the baseline BMD (BMD0) and the IC50 significantly improved the model fit.
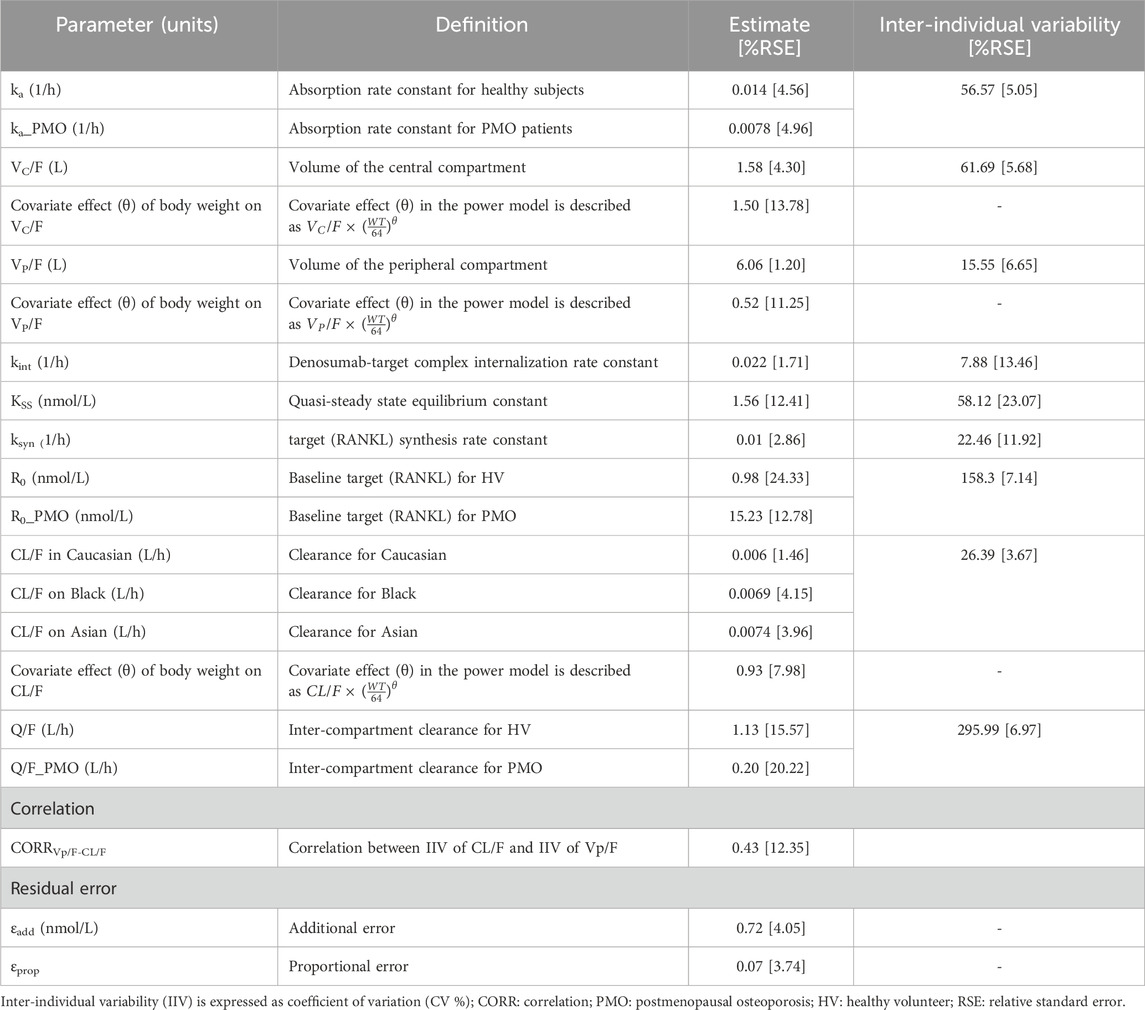
Table 3. Final population pharmacokinetic parameter estimates of denosumab.
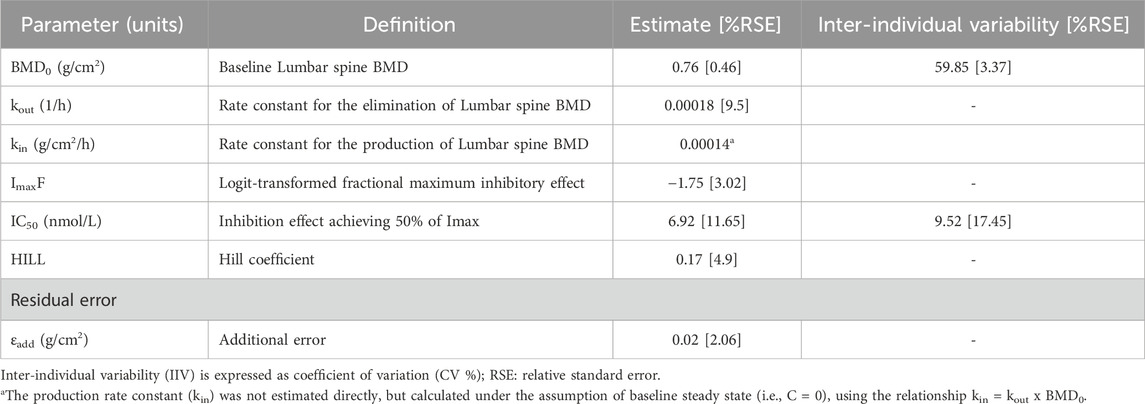
Table 4. Final population pharmacodynamic parameter estimates of denosumab.
All the fixed-effect PK/PD parameters and random effect parameters for IIV were estimated with acceptable precision, as indicted by relative standard errors (RSEs) < 25%. Although IIV of inter-compartmental clearance (Q) in healthy subjects was estimated to be high (coefficient of variation, CV: 295.99%), the estimate of the IIV was also obtained with high precision (RSE: 6.97%), suggesting that the observed variability is supported by the data. No significant signs of parameter instability or over-parameterization were observed.
Covariate analysis revealed that the study population (HV vs. PMO patients) statistically significantly affected ka (ratio of HV/PMO: 0.55), R0 (ratio: 15.49), and Q (ratio: 0.18). Body weight influenced VC/F, VP/F, and CL/F through a power model, with exponents of 1.5, 0.93, and 0.52, respectively. Race influenced CL/F, with values 1.14 times higher in Black individuals and 1.22 times higher in Asians compared to those of Caucasians. No patient-related variables, including treatment groups, were identified as covariates for any PD parameter.
GOF plots for the PK/PD model demonstrated good agreement between observed and predicted values (Figures 3, 4). The individual prediction plots (IPRED) showed data points closely clustered around the line of identity, indicating that the model adequately captured IIV (Figures 3B, 4B). Residual diagnostics further supported model adequacy, as individual weighted residuals (IWRES) were randomly distributed around zero across both time and predicted concentration axes. No patterns or evidence of heteroscedasticity were observed (Figures 3C,D, 4C,D).
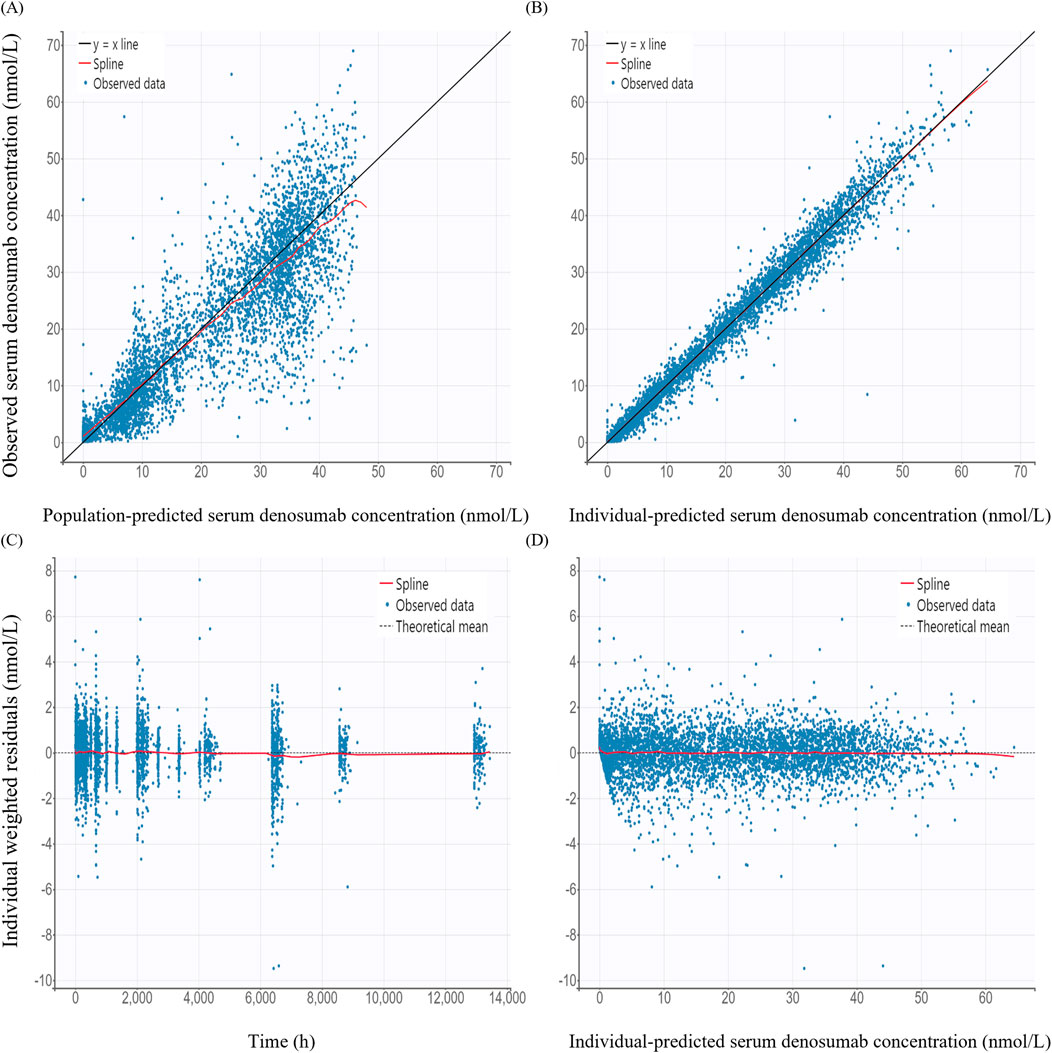
Figure 3. Basic goodness-of-fit plots of the final pharmacokinetic model (A) Observed versus population-predicted concentration; (B) Observed versus individual-predicted concentration; (C) Individual weighted residuals versus time; (D) Individual weighted residuals versus individual-predicted concentration.
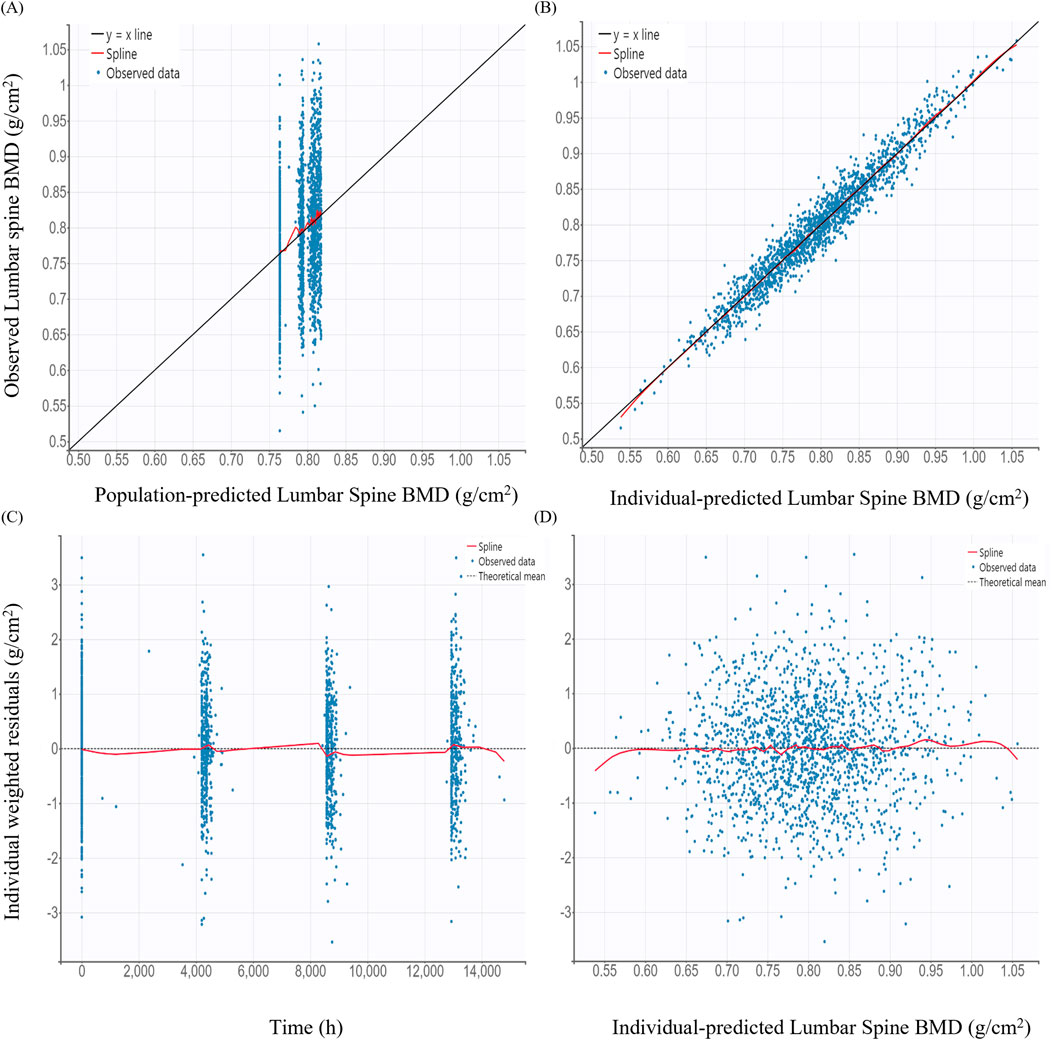
Figure 4. Basic goodness-of-fit plots of the final pharmacodynamic model (A) Observed versus population-predicted lumbar spine bone mineral density (BMD); (B) Observed versus individual-predicted lumbar spine BMD; (C) Individual weighted residuals versus time; (D) Individual weighted residuals versus individual-predicted lumbar spine BMD.
The VPC for the final PK/PD model showed that model predictions closely aligned with the observed data for serum denosumab concentrations and BMD (Figure 5). Most observed values fell within the 90% PI, indicating strong predictive performance.
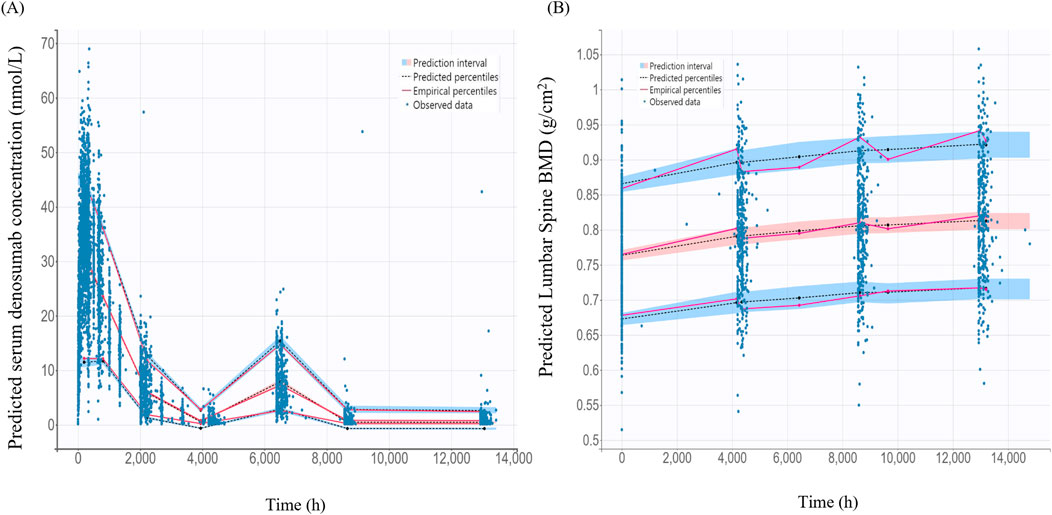
Figure 5. Visual predictive check for the final pharmacokinetic model and pharmacodynamics models (A) Final pharmacokinetic model for denosumab concentration; (B) Final pharmacodynamic model for lumbar spine bone mineral density (BMD); The black dashed lines represent the 5%, 50%, 95% percentiles of the model predictions. The shaded blue areas indicate the 95% prediction intervals for each percentile. Observed data are as blue dots.
3.2 Model-based simulations
Simulated denosumab exposure (steady-state AUC) across significant covariate subgroups are shown in Figure 6. The simulated AUC was approximately 4% lower in Phase III PMO patients compared to that in Phase I healthy subjects (Figure 6A). When stratified by body weight–represented by 45 kg (low), 64 kg (median), and 90 kg (high) the AUC was approximately 45% higher in the 45 kg group and 39% lower in the 90 kg group, relative to the 64 kg reference (Figure 6B). Additionally, simulated AUC values were approximately 11% and 19% lower in Black and Asian subjects, respectively, compared to Caucasians.
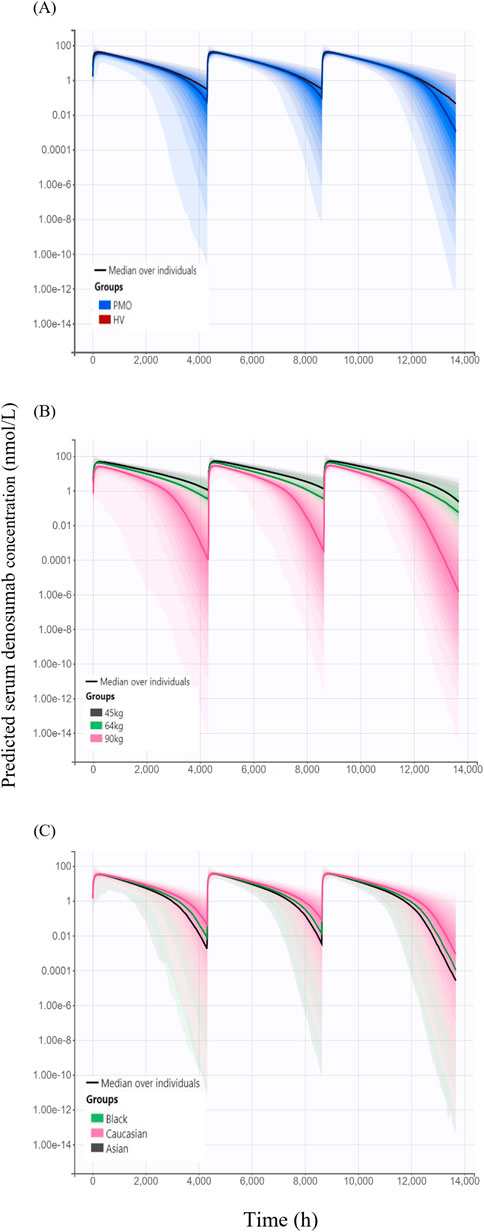
Figure 6. Simulated serum concentration–time profiles following three subcutaneous administrations of 60 mg denosumab at 6-month intervals, stratified by covariates (A) Comparison of simulated profiles between study cohorts: healthy volunteers (HV, Phase I) and patients with postmenopausal osteoporosis (PMO, Phase III); (B) Effect of body weight (45 kg, 64 kg, and 90 kg) on denosumab exposure; (C) Effect of race (Caucasian, Black, and Asian) on denosumab exposure; Solid lines represent the median concentrations across simulated individuals, and shaded areas represent the 95% prediction intervals, reflecting inter-individual variability in concentration-time profiles.
Model-based simulations were performed to evaluate how difference in denosumab exposure across covariates influences PD responses, measured by changes from baseline in lumbar spine BMD. The percentage change from baseline in lumbar spine BMD following 6-month treatment intervals over 18 months was slightly higher in the Phase I healthy subjects (6.65%) than in the Phase III PMO patients (6.45%) (Figure 7A). Simulated changes from baseline in lumbar spine BMD by weight groups were 7.11%, 6.66%, and 5.54% for the 45 kg, 64 kg and 90 kg groups, respectively (Figure 7B). Similarly, simulated changes from baseline in lumbar spine BMD were 6.45%, 6.15%, and 5.93% for Caucasian, Black, and Asian subjects, respectively (Figure 7C).
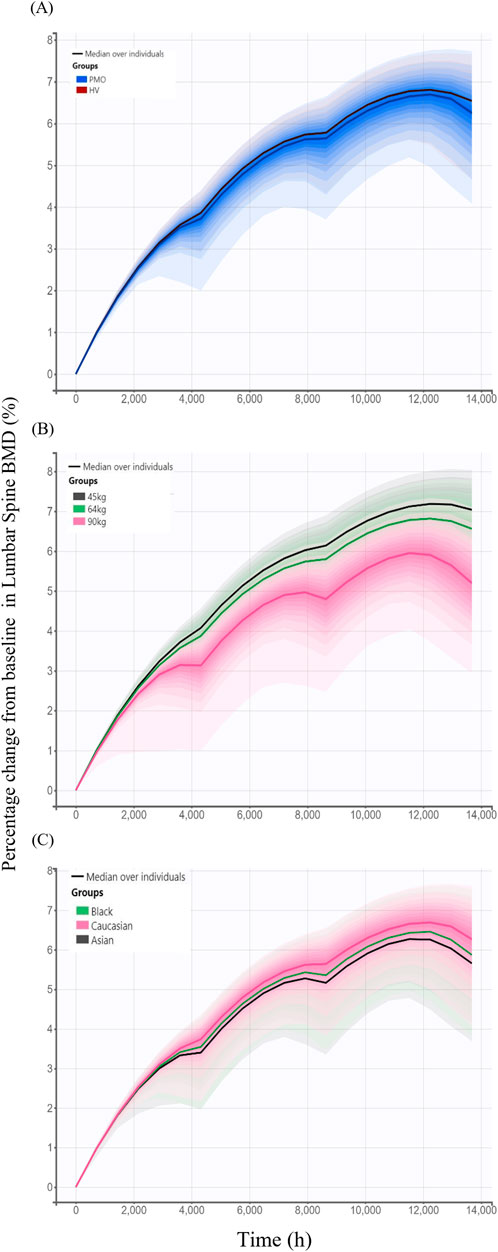
Figure 7. Simulated changes from baseline in lumbar spine bone mineral density over 18 months following three subcutaneous administrations of 60 mg denosumab at 6-month intervals stratified by covariates. (A) Comparison between study cohorts: healthy volunteers (HV, Phase I) and patients with postmenopausal osteoporosis (PMO, Phase III); (B) Effect of body weight (45 kg, 64 kg, and 90 kg); (C) Effect of race (Caucasian, Black, and Asian); Solid lines represent the median profiles across simulated individuals, and shaded areas represent the 95% prediction intervals, reflecting inter-individual variability.
3.3 PK/PD comparison of SB16 and DEN
Treatment (SB16 vs. DEN) was not identified as a statistically significant covariate since decrease in OFV was observed during covariate screening. Consequently, it was not included in the final PK-PD model. Boxplots of the EBEs for key PK and PD parameters showed that the distributions of ETAs were highly comparable between the two treatment groups, with no significant difference observed (Figure 8).
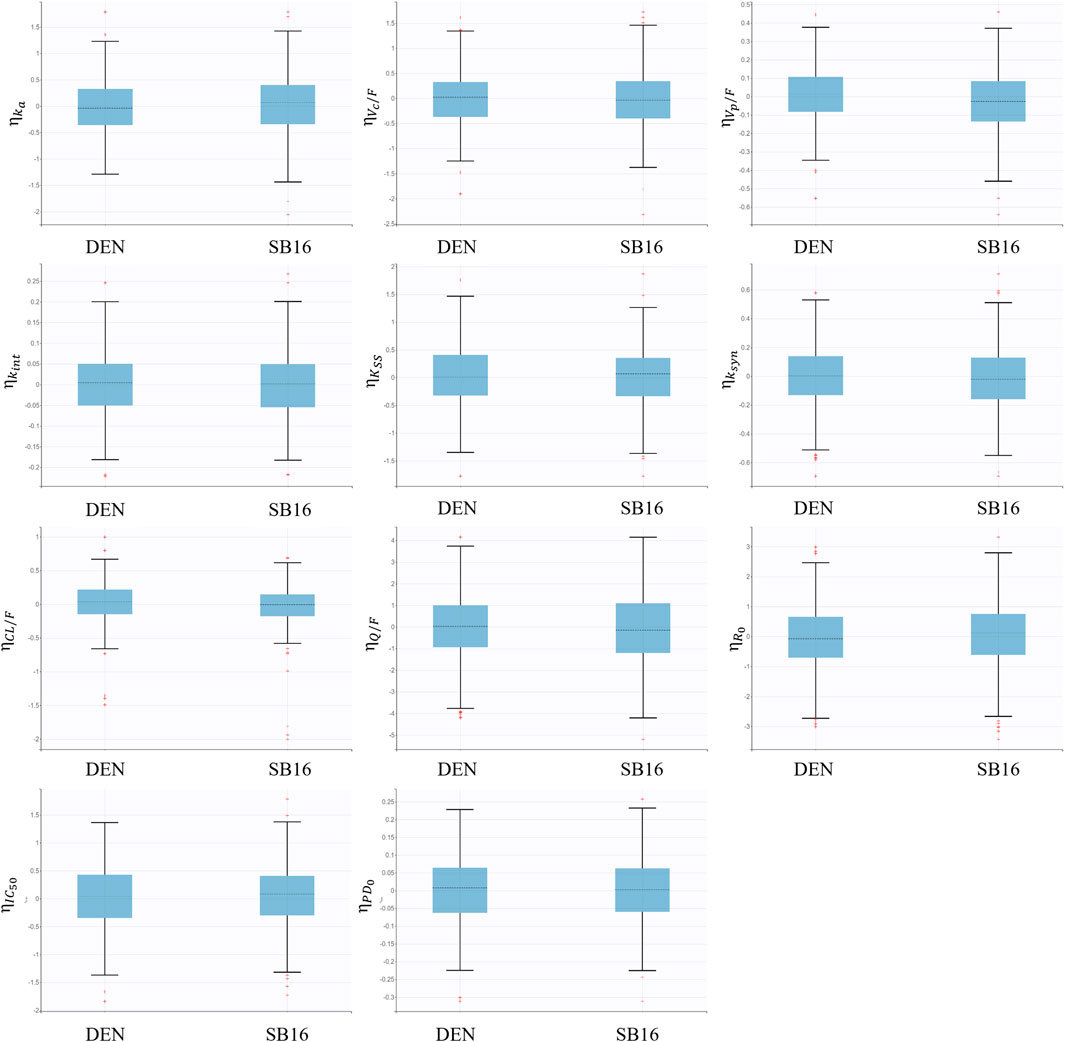
Figure 8. Boxplots for inter-individual variability of main fixed effect parameters stratified by treatment groups.
For treatment-specific simulation, the treatment group was intentionally included as a covariate in the final PK-PD model. The implemented CL/F ratio of SB16 to DEN was 0.9982, indicating a negligible difference between treatments. As shown in Figure 9, the time–concentration profile, time-lumbar spine BMD profile, and percentage change from baseline in lumbar spine BMD over time were nearly identical between the biosimilar and the reference product. A comparison of secondary PK and PD parameters demonstrated highly similar results between the two treatment groups (Table 5). To further confirm the robustness of this comparability, an additional simulation was conducted using individual PK and PD parameters estimated specifically in postmenopausal women with osteoporosis. The resulting profiles remained consistent with the primary findings and are provided in Supplementary Figure S1.
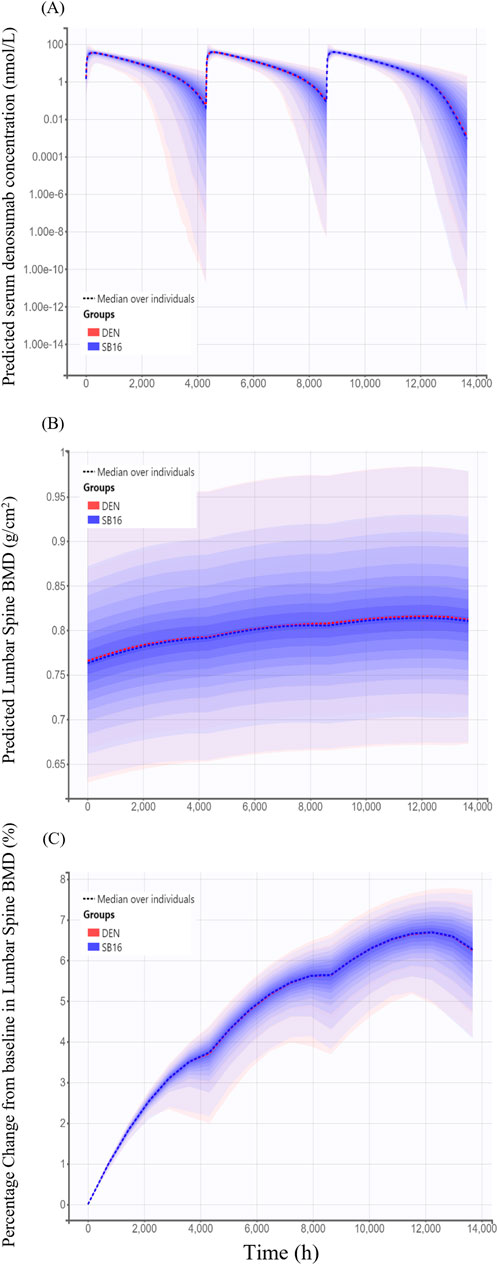
Figure 9. Simulated time profiles comparing SB16 and DEN after three subcutaneous administrations of 60 mg denosumab at 6-month intervals (A) Predicted serum concentration–time profiles; (B) Predicted lumbar spine bone mineral density (BMD); (C) Predicted percentage change from baseline in lumbar spine BMD. Solid lines represent the median profiles across simulated individuals, and shaded areas represent the 95% prediction intervals, reflecting inter-individual variability.
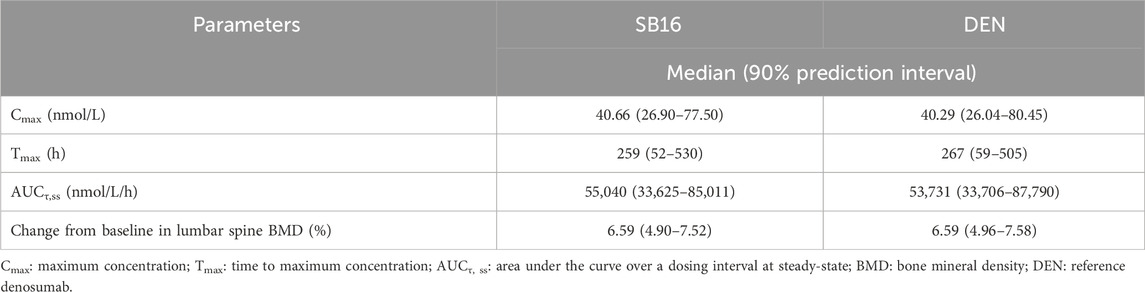
Table 5. Comparison of simulated PK and PD results between SB16 and DEN.
4 Discussion
Population PK/PD analyses were conducted using combined data from a comparative clinical PK study and a comparative efficacy and safety study to characterize the PK/PD of denosumab and compare SB16, a biosimilar with EU/US-DEN, the reference product. Consistent with a previous report for reference denosumab (Sutjandra et al., 2011), a two-compartment TMDD model based on QSS approximation and first-order absorption adequately described the PK data for SB16 and EU/US-DEN. In addition, an indirect response PD model with a maximal inhibitory function captured the treatment effect on lumbar spine BMD following administration.
RANKL concentrations data were not available for the current analysis; therefore, the developed QSS-TMDD model leveraged prior knowledge of the mechanistic interaction between denosumab and RANKL, alongside both linear and target-mediated drug clearance pathways. This approach allowed for the estimation of physiologically plausible, target-specific model parameters that were overall consistent with the reported values for therapeutic monoclonal antibodies (Gibiansky and Gibiansky, 2019). However, drug concentration data alone were insufficient to capture the turnover rate of the target (kdeg) and drug-target complex (kint). The estimated KSS (KD + kint/kon) value of 1.56 nM was higher than the reported in vitro KD of 3 pM (Arthur et al., 2012), with low variability (<25%RSE). The absence of target concentration data limits the precise estimation of the parameters related to pharmacological target dynamics in a full TMDD framework.
High shrinkage was observed in TMDD-related parameters (R0, kint, and KSS), likely due to the limited informativeness of the dataset for estimating receptor-mediated dynamics. In particular, the absence of receptor concentration data is a known factor that impairs the identifiability of TMDD parameters and leads to increased shrinkage (Gibiansky et al., 2008). Shrinkage was also high for the IC50 parameter in the PD model, which can be attributed to the sparse sampling of BMD, limiting the ability to characterize the inflection point of the exposure–response relationship. While these observations reflect limitations in parameter identifiability, they do not indicate model misspecification and are not expected to compromise the structural adequacy or overall interpretability of the final model (Savic and Karlsson, 2009; Xu et al., 2012). To address potential diagnostic bias due to high shrinkage, individual predictions were generated using Monolix’s conditional distribution approach, which provides a more reliable basis for GOF and covariate evaluations than EBE (Monolix Suite Documentation, 2024).
As changes in BMD reflect the net outcome of physiological bone remodeling, the delayed response to denosumab treatment was mechanistically characterized using an indirect response model, which is commonly applied to describe the endogenous turnover system (Felmlee et al., 2012). To reflect the known mechanism of action by which denosumab inhibits osteoclast activation, the drug was modeled to suppress the natural bone resorption rate constant (kout), thereby increasing BMD (Yee and Raje, 2012). A Hill coefficient was incorporated to allow flexible PD modeling (Gabrielsson and Hjorth, 2016). The IC50 value was estimated to be 6.92 nmol/L, representing the concentration at which denosumab achieves 50% of its maximal inhibitory effect on BMD degradation.
Covariate analysis revealed that the study population (HV vs. PMO patients) influences drug absorption and intercompartmental clearance (Q/F). The ka was estimated to be 0.014 h-1 in HV and 0.0078 h-1 in PMO patients, corresponding to an absorption half-life of 2.1 and 3.7 days, respectively. This difference may be partially attributed to overall health status and age-related reductions in lymph flow rate, with younger individuals exhibiting higher lymphatic flow and, consequently, faster absorption rate (Thomas and Balthasar, 2019). Given that denosumab is indicated for the treatment of osteoporosis, the estimated absorption half-life of 3.7 days along with an IIV of 56.57% in this model is consistent with the previously reported human value of 3.3 days (Sutjandra et al., 2011). The Q/F was estimated at 1.13 L/h and 0.20 L/h in HV and PMO, respectively. However, the effects of the study population on ka and Q/F are translated into <5% difference in the simulated AUC and BMD outcomes. As expected, baseline target concentrations were higher in PMO patients (15.23 nM) than in healthy individuals (0.98 nM) (Lewiecki, 2011), but this difference had minimal influence on the estimation of target dynamics, owing to the low variability (<25%RSE) associated with R0 and kint.
The estimated central and peripheral volumes of distribution (VC/F and VP/F) were 1.58 L and 6.06 L, respectively, and were modeled as functions of body weight, estimated power exponents of 1.50 for VC/F and 0.52 for VP/F. Although the estimated VC was lower than that of plasma volume, the steady-state volume of distribution encompassing both central and peripheral compartments was 7.64 L. This value falls within the range reported in the Phase I study (SB16-1001) and aligns with the known VSS range of 2.9–20 L for therapeutic monoclonal antibodies (Kuester et al., 2006; Roskos et al., 2004; Dirks and Meibohm, 2010).
The relatively small value of VC/F may be attributed to structural limitations in the absorption model. As previously reported, misspecification of the absorption process can lead to biased estimation of distribution parameters such as VC/F and bioavailability (Therapeutic Goods Administration, 2011; Wade et al., 1993). Given the complexity of subcutaneous absorption and relatively sparse data points during the absorption phase in this study, the estimated VC/F likely reflects limitations in the absorption model rather than a physiologically meaningful volume (Dirks and Meibohm, 2010).
Body weight and race were identified significant covariates on CL/F. Model-based simulations adjusting for these covariates showed that the AUC was approximately 45% higher in individuals weighing 45 kg and 39% lower in those weighing 90 kg relative to the 64 kg reference group. The predicted AUCs were 11% and 19% lower in Black and Asian subjects, respectively, relative to Caucasians. Despite these differences, no clinically meaningful difference was observed in PD outcomes; lumbar spine BMD responses remained within a narrow range across subgroups 7.11%, 6.66%, and 5.54% by weight; 6.45%, 6.15%, and 5.93% by race. Furthermore, no patient characteristics were identified as significant covariates influencing the PD parameters associated with changes in lumbar spine BMD. These findings are consistent with clinical data demonstrating comparable improvement in BMD regardless of race or BMI, supporting the current recommended dosage (European Medicines Agency, 2010; Jaber et al., 2020; European Medicines Agency, 2024c).
For similarity assessment of biosimilar SB16 and the reference product, EU- and US-sourced reference products were analyzed as a single pooled-reference group rather than as separate comparators. This approach is justified, as the same pivotal clinical data were used to support the approval of the originator product in both regions (European Medicines Agency, 2010; U.S. Food and Drug Administration, 2013). Furthermore, SB16 has already been approved in both the EU and US following rigorous similarity evaluations, including bridging studies (U.S. Food and Drug Administration, 2025; European Medicines Agency, 2024a). Two approaches were employed to assess the similarity. First, the model-generated plots showed that CL/F and Imax exhibited similar ETA distributions between SB16 and DEN. Although the treatment group was not identified as a significant covariate, including this factor as a predictor for CL/F in the model yields a CL/F the ratio of was 0.9982 between groups, with a standard error close to zero. Second, model-based simulations including treatment group as a covariate on CL/F showed that the change from baseline in lumbar spine BMD at 18 months for both SB16 and DEN was 6.59, with overlapping prediction intervals. The results align with BMD changes observed in clinical trials −6.5% increase at 24 months (Bone et al., 2008) and a mean increase of 3.0%–6.7% at 12 months in osteoporotic women (McClung et al., 2006). The modeling-based approach provides mechanistic and quantitative evidence of biosimilarity based on understanding inter-individual variability in PK/PD.
Although lumbar spine BMD has been accepted as a primary endpoint for assessing similarity in therapeutic efficacy in osteoporosis treatment (Jeka et al., 2024), our analysis results showed a wide range of AUC values (61%–145%) across subgroups corresponded to a narrower BMD response range (84%–107%), suggesting a plateau effect at the tested dose. This observation likely reflects the inherently slow biological kinetics of bone remodeling; BMD changes emerge gradually over months following antiresorptive therapy due to the low turnover rate of bone tissue. Consequently, BMD may not adequately capture modest or short-term differences in drug exposure, particularly in comparisons between the products expected to be highly similar.
To address this limitation, more responsive PD biomarkers may be required to improve sensitivity in biosimilarity assessments. For example, serum C-terminal telopeptide (CTX), a key marker of bone resorption, has been shown to decrease significantly within several days of denosumab administration, whereas BMD changes take several months to become apparent (McClung et al., 2006). In line with this, our ongoing research focuses on developing an integrated PK/PD model that incorporates denosumab PK, CTX dynamics, and subsequent BMD changes from baseline to characterize the relationships among these factors and to enable early prediction and monitoring of treatment effects.
In conclusion, this population PK/PD analysis of SB16 and reference denosumab, using data from studies involving healthy subjects and PMO patients, well characterized the PK/PD profile of denosumab. This is achieved by a two-compartment QSS-TMDD model integrated with an inhibitory effect function in the indirect response PD model. No key patient variables were found to significantly influence the PD response of the drug, and any observed difference in drug exposure among patient subgroups was considered to have negligible clinical relevance. Furthermore, model-based simulations demonstrated PK/PD similarity between SB16 and reference denosumab, supporting the potential for SB16 to be substituted for the reference product in treatment of osteoporosis.
Data availability statement
The original contributions presented in the study are included in the article/Supplementary Material. Any further inquiries can be directed to the corresponding author.
Author contributions
SC: Writing – original draft, Writing – review and editing, Investigation, Formal Analysis, Methodology, Project administration, Validation. SP: Project administration, Writing – review and editing, Writing – original draft. JJ: Resources, Project administration, Writing – review and editing. SB: Writing – review and editing, Resources. H-SL: Conceptualization, Writing – review and editing, Supervision, Project administration, Methodology.
Funding
The author(s) declare that financial support was received for the research and/or publication of this article. The research (2024OM0608) project, and the production of this manuscript, was funded through a dedicated grant from Sponsor (Samsung Bioepis Co., Ltd). The funder was not involved in the study design, collection, analysis, interpretation of data, the writing of this article, or the decision to submit it for publication.
Acknowledgments
Acknowledgement is made to Samsung Bioepis Co., Ltd, which provided the clinical data used for this research, and the Scientific Publications Team at Asan Medical Cener for their editorial assistance in preparing this manuscript.
Conflict of interest
Authors JJ and SB were employed by Samsung Bioepis Co., Ltd.
The remaining authors declare that the research was conducted in the absence of any commercial or financial relationships that could be construed as a potential conflict of interest.
Generative AI statement
The author(s) declare that no Generative AI was used in the creation of this manuscript.
Publisher’s note
All claims expressed in this article are solely those of the authors and do not necessarily represent those of their affiliated organizations, or those of the publisher, the editors and the reviewers. Any product that may be evaluated in this article, or claim that may be made by its manufacturer, is not guaranteed or endorsed by the publisher.
Supplementary material
The Supplementary Material for this article can be found online at: https://www.frontiersin.org/articles/10.3389/fphar.2025.1631034/full#supplementary-material
Abbreviations
DEN, denosumab; PK, pharmacokinetics; PMO, postmenopausal women with osteoporosis; PD, pharmacodynamics; HV, healthy volunteers; BMD, bone mineral density; CL, clearance; TMDD, target-mediated drug disposition; QSS, quasi-steady state; RANKL, receptor activator of nuclear factor kappa-Β ligand; BTM, bone turnover markers; SC, single subcutaneous; ECLIA, electrochemiluminescence immunoassay; LLOQ, lower limit of quantification; BLQ, below the limit of quantification; IP, investigational product; EOS, end of study; ET, early termination; DXA, dual-energy X-ray absorptiometry; IIV, Interindividual variability; LRT, likelihood ratio test; GOF, goodness-of-fit; RV, residual variability; OFV, objective function value; VPC, visual predictive checks; PI, prediction interval.
References
Adedokun, O. J., Xu, Z., Liao, S., Strauss, R., Reinisch, W., Feagan, B. G., et al. (2020). Population pharmacokinetics and exposure-response modeling of golimumab in adults with moderately to severely active ulcerative colitis. Clin. Ther. 42 (1), 157–174.e4. doi:10.1016/j.clinthera.2019.11.010
Arthur, K. K., Gabrielson, J. P., Hawkins, N., Anafi, D., Wypych, J., Nagi, A., et al. (2012). In vitro stoichiometry of complexes between the soluble RANK ligand and the monoclonal antibody denosumab. Biochemistry 51 (4), 795–806. doi:10.1021/bi2007806
Ayral, G., Si Abdallah, J. F., Magnard, C., and Chauvin, J. (2021). A novel method based on unbiased correlations tests for covariate selection in nonlinear mixed effects models: the COSSAC approach. CPT Pharmacometrics Syst. Pharmacol. 10 (4), 318–329. doi:10.1002/psp4.12612
Bone, H. G., Bolognese, M. A., Yuen, C. K., Kendler, D. L., Wang, H., Liu, Y., et al. (2008). Effects of denosumab on bone mineral density and bone turnover in postmenopausal women. J. Clin. Endocrinol. Metab. 93 (6), 2149–2157. doi:10.1210/jc.2007-2814
Dayneka, N. L., Garg, V., and Jusko, W. J. (1993). Comparison of four basic models of indirect pharmacodynamic responses. J. Pharmacokinet. Biopharm. 21 (4), 457–478. doi:10.1007/BF01061691
Dirks, N. L., and Meibohm, B. (2010). Population pharmacokinetics of therapeutic monoclonal antibodies. Clin. Pharmacokinet. 49 (10), 633–659. doi:10.2165/11535960-000000000-00000
Dua, P., Hawkins, E., and van der Graaf, P. H. (2015). A tutorial on target-mediated drug disposition (TMDD) models. CPT Pharmacometrics Syst. Pharmacol. 4 (6), 324–337. doi:10.1002/psp4.41
EMA (2025). Samsung Bioepis Co., Ltd. A phase III, randomised, double-blind, multicentre clinical study to compare the efficacy, safety, pharmacokinetics, pharmacodynamics, and immunogenicity between SB16 (proposed denosumab biosimilar) and prolia in postmenopausal women with osteoporosis. EudraCT Number 2020-001479-34. Available online at: https://www.clinicaltrialsregister.eu/ctr-search/trial/2020-001479-34/DK.
European Medicines Agency (2010). Prolia (denosumab): EPAR – public assessment report. Amsterdam: EMA. Available online at: https://www.ema.europa.eu/en/documents/assessment-report/prolia-epar-public-assessment-report_en.pdf.
European Medicines Agency (2024a). Obodence 60 mg solution for injection in prefilled syringe: summary of product characteristics. Amsterdam, NL: EMA. Available online at: https://www.ema.europa.eu/en/documents/product-information/obodence-epar-product-information_en.pdf.
European Medicines Agency (2024b). Obodence assessment report. Committee for medicinal products for human use (CHMP). Available online at: https://www.ema.europa.eu/en/documents/assessment-report/obodence-epar-public-assessment-report_en.pdf.
European Medicines Agency (2024c). “Prolia 60 mg solution for injection in pre-filled syringe,” in Summary of product characteristics. Amsterdam: EMA. Available online at: https://www.ema.europa.eu/en/documents/product-information/prolia-epar-product-information_en.pdf.
Felmlee, M. A., Morris, M. E., and Mager, D. E. (2012). “Mechanism-based pharmacodynamic modeling,” in Computational toxicology: methods in molecular biology. Editors B. Reisfeld, and A. N. Mayeno (Totowa (NJ): Humana Press), 929, 583–600. doi:10.1007/978-1-62703-050-2_21
Gabrielsson, J., and Hjorth, S. (2016). Pattern recognition in pharmacodynamic data analysis. AAPS J. 18 (1), 64–91. doi:10.1208/s12248-015-9842-5
Gabrielsson, J., and Weiner, D. (2007). “Model evaluation: diagnostic plots,” in Pharmacokinetic and pharmacodynamic data analysis: concepts and applications. Editors J. Gabrielsson, and D. Weiner 4th ed. (Stockholm: Swedish Pharmaceutical Press), 235–254.
Gabrielsson, J., Meibohm, B., and Weiner, D. (2016). Pattern recognition in pharmacokinetic data analysis. AAPS J. 18 (1), 47–63. doi:10.1208/s12248-015-9817-6
Gibiansky, L., and Gibiansky, E. (2019). “Modeling biologics with target-mediated drug disposition,” in Presented at: PAWS – intermediate workshop (Auckland, New Zealand).
Gibiansky, L., Gibiansky, E., Kakkar, T., and Ma, P. (2008). Approximations of the target-mediated drug disposition model and identifiability of model parameters. J. Pharmacokinet. Pharmacodyn. 35 (5), 573–591. doi:10.1007/s10928-008-9102-8
Hanley, D. A., Adachi, J. D., Bell, A., and Brown, V. (2012). Denosumab: mechanism of action and clinical outcomes. Int. J. Clin. Pract. 66 (12), 1139–1146. doi:10.1111/ijcp.12022
Hasegawa, C., Ohno, T., and Ieiri, I. (2014). The use of population pharmacokinetic and pharmacodynamic modeling and simulation in anti-osteoporotic drug development: a perspective. Jpn. J. Clin. Pharmacol. Ther. 45 (5), 187–196. doi:10.3999/jscpt.45.187
Jaber, M. M., Al-Kofahi, M., Sarafoglou, K., and Brundage, R. C. (2020). Individualized absorption models in population pharmacokinetic analyses. CPT Pharmacometrics Syst. Pharmacol. 9 (6), 307–309. doi:10.1002/psp4.12513
Jeka, S., Reginster, J. Y., Lewiecki, E. M., Bhatta, S., Su, Y., Lin, Y., et al. (2024). Biosimilar denosumab in postmenopausal women with osteoporosis: a phase 3, randomized, double-blind, active-controlled trial. Arch. Osteoporos. 19 (1), 58. doi:10.1007/s11657-024-07161-9
Kuester, K., and Kloft, C. (2006). “Pharmacokinetics of monoclonal antibodies,” in Pharmacokinetics and pharmacodynamics of biotech drugs. Editor B. Meibohm (Weinheim: Wiley VCH), 45–91.
Lacroix, B. D., Friberg, L. E., and Karlsson, M. O. (2012). Evaluation of IPPSE, an alternative method for sequential population PKPD analysis. J. Pharmacokinet. Pharmacodyn. 39 (2), 177–193. doi:10.1007/s10928-012-9240-x
Langdahl, B., Chung, Y. S., Plebanski, R., Czerwinski, E., Dokoupilova, E., Supronik, J., et al. (2024). Proposed denosumab biosimilar SB16 vs reference denosumab in postmenopausal osteoporosis: phase 3 results up to month 12. J. Clin. Endocrinol. Metab. 110, e1951–e1958. doi:10.1210/clinem/dgae611
Lee, H., Park, J., Jang, H., Lee, S. J., and Kim, J. (2024). Population pharmacokinetic, pharmacodynamic and efficacy modeling of SB12 (proposed eculizumab biosimilar) and reference eculizumab. Eur. J. Clin. Pharmacol. 80, 1325–1338. doi:10.1007/s00228-024-03703-8
Lee, H. A., Kim, S., Seo, H., and Kim, S. (2023). A phase I, randomized, double-blind, single-dose pharmacokinetic study to evaluate the biosimilarity of SB16 (proposed denosumab biosimilar) with reference denosumab in healthy male subjects. Expert Opin. Investig. Drugs 32 (10), 959–966. doi:10.1080/13543784.2023.2273510
Lewiecki, E. M. (2011). Safety and tolerability of denosumab for the treatment of postmenopausal osteoporosis. Drug Healthc. Patient Saf. 3, 79–91. doi:10.2147/DHPS.S7727
Lunn, D., Best, N., Spiegelhalter, D., Graham, G., and Neuenschwander, B. (2009). Combining MCMC with ‘sequential’ PKPD modelling. J. Pharmacokinet. Pharmacodyn. 36 (1), 19–38. doi:10.1007/s10928-008-9109-1
Marathe, D. D., Marathe, A., and Mager, D. E. (2011). Integrated model for denosumab and ibandronate pharmacodynamics in postmenopausal women. Biopharm. Drug Dispos. 32 (8), 471–481. doi:10.1002/bdd.770
McClung, M. R., Lewiecki, E. M., Cohen, S. B., Bolognese, M. A., Woodson, G. C., Moffett, A. H., et al. (2006). Denosumab in postmenopausal women with low bone mineral density. N. Engl. J. Med. 354 (8), 821–831. doi:10.1056/NEJMoa044459
Monolix Suite Documentation. (2024). Scatter plots of residuals and use of conditional distribution. Available online at: https://monolixsuite.slp-software.com/monolix/2024R1/scatter-plot-of-residuals.
Roskos, L. K., Davis, C. G., and Schwab, G. M. (2004). The clinical pharmacology of therapeutic monoclonal antibodies. Drug Dev. Res. 61 (3), 108–120. doi:10.1002/ddr.10346
Savic, R. M., and Karlsson, M. O. (2009). Importance of shrinkage in empirical Bayes estimates for diagnostics: problems and solutions. AAPS J. 11 (3), 558–569. doi:10.1208/s12248-009-9133-0
Sutjandra, L., Rodriguez, R. D., Doshi, S., Ma, M., Peterson, M. C., Jang, G. R., et al. (2011). Population pharmacokinetic meta-analysis of denosumab in healthy subjects and postmenopausal women with osteopenia or osteoporosis. Clin. Pharmacokinet. 50 (12), 793–807. doi:10.2165/11594240-000000000-00000
Teitelbaum, S. L. (2000). Bone resorption by osteoclasts. Science 289 (5484), 1504–1508. doi:10.1126/science.289.5484.1504
Therapeutic Goods Administration (2011). Australian public assessment report for denosumab (Prolia). Canberra, AU: TGA. Available online at: https://www.tga.gov.au/sites/default/files/auspar-prolia.pdf.
Thomas, V. A., and Balthasar, J. P. (2019). Understanding inter-individual variability in monoclonal antibody disposition. Antibodies 8 (4), 56. doi:10.3390/antib8040056
U.S. Food and Drug Administration (2010). Prolia (denosumab) injection: clinical pharmacology and biopharmaceutics review. Silver Spring (MD). Silver Spring, MD: FDA Center for Drug Evaluation and Research. Available online at: https://www.accessdata.fda.gov/drugsatfda_docs/nda/2010/125320s000ClinPharmR.pdf.
U.S. Food and Drug Administration (2025). Ospomyv (denosumab-dssb) injection, for subcutaneous use: highlights of prescribing information. Silver Spring, MD: FDA. Available online at: https://www.accessdata.fda.gov/drugsatfda_docs/label/2025/761392Orig1s000lbl.pdf.
U.S. Food and Drug Administration. (2013). in Prolia (denosumab) summary review. Silver spring (MD): FDA; 2011. Application No. 125320. Available online at: https://www.accessdata.fda.gov/drugsatfda_docs/nda/2013/125320Orig1s094.pdf.
Wade, J. R., Kelman, A. W., Howie, C. A., and Whiting, B. (1993). Effect of misspecification of the absorption process on subsequent parameter estimation in population analysis. J. Pharmacokinet. Biopharm. 21 (2), 209–222. doi:10.1007/BF01059771
Xu, R., Tiwari, G., Granneman, G. R., Wang, Y., Nandy, P., and Vermeulen, A. (2012). Shrinkage in nonlinear mixed-effects population models: quantification, influencing factors, and impact. AAPS J. 14 (4), 927–936. doi:10.1208/s12248-012-9407-9
Yee, A. J., and Raje, N. S. (2012). Denosumab, a RANK ligand inhibitor, for the management of bone loss in cancer patients. Clin. Interv. Aging 7, 331–338. doi:10.2147/CIA.S14566
Keywords: denosumab, biosimilar, target-mediated drug disposition, osteoporosis, PK/PD modeling and simulation, monolix
Citation: Choi S, Park S, Jung J, Baek S and Lim H-S (2025) Population pharmacokinetics/pharmacodynamics analysis confirming biosimilarity of SB16 to reference denosumab. Front. Pharmacol. 16:1631034. doi: 10.3389/fphar.2025.1631034
Received: 19 May 2025; Accepted: 21 July 2025;
Published: 19 August 2025.
Edited by:
Xinning Yang, United States Food and Drug Administration, United StatesReviewed by:
Ye Yuan, United States Food and Drug Administration, United StatesAnthony Hazel, United States Food and Drug Administration, United States
Copyright © 2025 Choi, Park, Jung, Baek and Lim. This is an open-access article distributed under the terms of the Creative Commons Attribution License (CC BY). The use, distribution or reproduction in other forums is permitted, provided the original author(s) and the copyright owner(s) are credited and that the original publication in this journal is cited, in accordance with accepted academic practice. No use, distribution or reproduction is permitted which does not comply with these terms.
*Correspondence: Hyeong-Seok Lim, bWRoc2xpbUBnbWFpbC5jb20=
‡ORCID: Hyeong-Seok Lim, orcid.org/0000-0003-1420-8200