 Max A. Wilson
 Anna Sumera
 Emre Berk1
 Sam A. Booker
- 1Institute for Neuroscience and Cardiovascular Research, University of Edinburgh, Edinburgh, United Kingdom
- 2Simons Initiative for the Developing Brain, University of Edinburgh, Edinburgh, United Kingdom
- 3Patrick Wild Centre, University of Edinburgh, Edinburgh, United Kingdom
Introduction: Fragile X Syndrome is a common, inherited single gene cause of intellectual disability, associated with autism, epilepsy, anxiety, and sensory disturbances. Many of these features have been attributed to cellular dysfunction leading to impaired synaptic plasticity, in particular through metabotropic glutamate and GABA receptor signalling. The function of these pathways in inhibitory interneurons has not been fully elucidated. In this study we test the hypothesis that somatostatin interneurons (SST-INs) display impaired synaptic plasticity, which leads to circuit-level plasticity deficits.
Methods: We use a combination of whole-cell and extracellular recordings in acute hippocampal brain slices prepared from adult, male wild-type and Fmr1-/y mice.
Results: We find that long-term potentiation in SST-INs is enhanced in Fmr1-/y mice, and that this plasticity is susceptible to GABAB receptor activation. However, long-term potentiation at temporoammonic inputs to CA1 region is not impaired in Fmr1-/y mice following tetanic stimulation. We find that temporoammonic long-term potentiation is equivalently modified by metabotropic glutamate and GABA receptor pharmacology, despite changes in presynaptic function.
Discussion: These data show that while SST-IN function is impaired in Fmr1-/y mice, circuit level plasticity is maintained. This study provides new insights into the function of drugs proposed for the treatment of Fragile X Syndrome.
Introduction
Fragile X Syndrome (FXS) is a common and inherited cause of intellectual disability, resulting from silencing of the FMR1 gene leading to loss of the Fragile X Messenger Ribonuclear Protein (FMRP); a RNA-binding protein that regulates protein synthesis and function (Bassell and Warren, 2008). FXS is typified in affected individuals by intellectual disability, cognitive inflexibility, seizures, autism, sensory alterations, and anxiety; many of which have a basis in altered neuronal excitability and plasticity (Booker and Kind, 2021; Contractor et al., 2015) and which have been identified in Fmr1-/y mouse and rat models (Gibson et al., 2008; Domanski et al., 2019; Booker and Kind, 2021; Asiminas et al., 2022).
Research into FXS using rodent models has been dominated by the mGluR theory (Huber et al., 2002), which proposes that exaggerated group I metabotropic glutamate receptor (mGluR) signalling, especially via mGluR5, leads to unchecked activity-dependent protein synthesis and exaggerated long-term depression (LTD.; Bear, 2005; Bear et al., 2004). Additional to the mGluR theory, loss of FMRP leads to changes in cellular excitability. Beyond modifying the excitability of excitatory neurons, evidence suggests impaired inhibitory signalling (Antoine et al., 2019; Domanski et al., 2019; Gibson et al., 2008), including loss of ionotropic GABAA receptors (GABAAR) (d'Hulst et al., 2006; Gantois et al., 2006) and metabotropic GABAB receptors (GABABR) (Kang et al., 2017; Wahlstrom-Helgren and Klyachko, 2015). These synaptic and cellular abnormalities are thought to underpin many FXS-related phenotypes including sensory hypersensitivity, learning/memory impairments, and epilepsy (see Contractor et al. (2015) for review); but how GABA and glutamate receptors contribute to hippocampal circuit function remains not fully explored.
In the hippocampus, synaptic inputs onto CA1 pyramidal neurons (PNs) are organised along two distinct pathways: Schaffer collateral (SC) inputs from CA3 targeting proximal dendrites, and temporoammonic (TA) inputs from layer III of the lateral entorhinal cortex, which target distal dendrites in stratum lacunosum-moleculare (SLM) (Remondes and Schuman, 2002; Amaral and Witter, 1989); the latter of which is associated with contextual and spatial memory formation (Vago and Kesner, 2008). In rodent models of FXS, TA inputs to CA1 display reduced strength (Asiminas et al., 2022; Booker et al., 2020) and feed-forward inhibition in the TA pathway is weakened (Wahlstrom-Helgren and Klyachko, 2015). A major subtype of hippocampal GABAergic interneuron expressing the neuropeptide somatostatin (SST-IN) form synapses that co-align with TA inputs, while receiving predominantly feedback inputs from CA1 PNs (Booker and Vida, 2018; Booker et al., 2018; Ali and Thomson, 1998). SST-INs have been shown to regulate the action potential firing activity (Royer et al., 2012) and synaptic integration of PNs (Lovett-Barron et al., 2012), contribute to theta and beta oscillatory activity (Artinian et al., 2019; Katona et al., 2014; Vasuta et al., 2015), and gate multimodal information flow between and within cortical regions (Abbas et al., 2018; Artinian et al., 2019; Leão et al., 2012; Naka et al., 2019). Importantly for FXS, SST-INs undergo synaptic plasticity mediated by group 1 mGluRs (mGluR1α and mGluR5) (Topolnik et al., 2006), with long-term potentiation (LTP) at excitatory synapses onto SST-INs inhibiting the TA region and enhancing SC-CA1 synapses via disinhibitory connections (Le Duigou and Kullmann, 2011; Vasuta et al., 2015). Plasticity of SST-INs is inhibited by activation postsynaptic GABABRs, which directly suppress dendritic L-type Ca2+ channels (Booker et al., 2018). As such, pharmacological targeting of GABABR and mGluR pathways may have profound effects on the SST-IN microcircuit. Indeed, a recent study examining TA LTP in Fmr1-/y mice revealed reduced plasticity (Ordemann et al., 2021), however this study blocked both GABAAR and GABABRs throughout, precluding the influence of SST-IN GABAergic signalling. Drugs targeting both GABA and mGluR signalling have undergone clinical trials in FXS, notably baclofen (a selective GABABR agonist; Berry-Kravis et al., 2012), Fenobam, mavoglurant, and basimglurant (mGluR5 negative allosteric modulators and antagonists; Berry-Kravis et al., 2016; Berry-Kravis et al., 2009), and ERK signalling (lovastatin, Çaku et al., 2014). Meanwhile, compounds like ganaxolone, which target extrasynaptic GABAARs, have shown preclinical benefits by restoring inhibitory tone (Ligsay et al., 2017). Thus, GABAergic SST-INs, may be uniquely placed to modify inhibitory circuit function, contributing to impaired hippocampal processing in FXS.
We hypothesised that SST-INs in Fmr1-/y mice may undergo excessive LTP, through mGluR1/5 dependent mechanisms, leading to impaired TA-CA1 plasticity. Further, we posited that pharmacological modulation of SST-IN signalling could differentially modify circuit plasticity. Using whole-cell recordings from SST-INs in CA1 and extracellular field recordings of TA synaptic responses, we assessed the impact of drugs targeting GABABRs, GABAARs, mGluR1α, and mGluR5. We show that while LTP in SST-INs in Fmr1-/y mice is elevated, this does not lead to circuit level defects. Further, we show that TA-LTP in Fmr1-/y mice displays no differences in sensitivity to mGluR1/5 or GABA receptor pharmacology.
Materials and methods
Animals
All procedures were performed according to Home Office (ASPA, 2013) and The University of Edinburgh Ethical Board guidelines. Fmr1-/y mice were maintained on a C57/Bl6JCRL background, housed on a 12h light/dark cycle, and with ad libitum access to food and water. For all experiments, adult (8–18 weeks) male mice were used, due to the X-linked nature of the Fmr1 gene. Some mice were maintained as heterozygous for Cre-recombinase under the SSt promoter. For all experiments WT and Fmr1-/y mice were used, with experiments blind to genotype during recording and analysis.
Acute brain slice preparation
Brain slices were prepared as previously described (Oliveira et al., 2021). Briefly, mice were terminally anaesthetised with isoflurane, then decapitated and their brains rapidly dissected into ice-cold sucrose-modified artificial cerebrospinal fluid (sucrose-ACSF; ACSF; in mM: 87 NaCl, 2.5 KCl, 25 NaHCO3, 1.25 NaH2PO4, 25 glucose, 75 sucrose, 7 MgCl2, 0.5 CaCl2) which was saturated with carbogen (95% O2/5% CO2). Brains were glued to a vibratome stage (Leica VT1200S, Leica, Germany), then either 400 µm (for whole-cell recordings) or 500 µm (for extracellular recordings) horizontal slices containing the hippocampi were cut. Following slicing, brain slices were placed in either: a submerged holding chamber containing sucrose-ACSF warmed to 35 °C for 30 min, then at room temperature; or on small squares of filter paper placed in a liquid/gas interface chamber, containing recording ACSF (in mM: 125 NaCl, 2.5 KCl, 25 NaHCO3, 1.25 NaH2PO4, 25 glucose, 1 MgCl2, 2 CaCl2) and bubbled with carbogen.
Whole-cell recording
For whole-cell recordings from SST-INs, slices were transferred to a submerged recording chamber, flowing at 6–8 mL/min with recording ACSF, which was carbogenated and warmed to near physiological temperatures (31 °C ± 1 °C) by an inline heater (Scientifica, United Kingdom). Slices were visualized with an upright microscope (SliceScope, Scientifica, United Kingdom), equipped with a ×40 water-immersion objective lens (N.A. 0.8) using a digital camera (SciCam Pro, Scientifica, United Kingdom). Whole-cell patch-clamp recordings were made using a Multiclamp 700B amplifier (Molecular Devices, United States). Recording pipettes were pulled from borosilicate glass capillaries (1.5 mm outer/0.86 mm inner diameter, Harvard Apparatus, United States) on a horizontal electrode puller (P-1000, Sutter Instruments, CA, United States). Pipettes were filled with K-gluconate based solution (in mM: 142 K-gluconate, 4 KCl, 0.5 EGTA, 10 HEPES, 2 MgCl2, 2 Na2ATP, 0.3 Na2GTP, 10 Na2Phosphocreatine, 2.7 Biocytin, pH = 7.4, 290–310 mOsm), giving a resistance of 4–6 MΩ. Unless otherwise stated, all voltage-clamp recordings were performed at a holding potential of −65 mV and all current-clamp recordings from the resting membrane potential (VM). Access resistance (RA) was monitored, but not compensated in voltage-clamp and the bridge balanced in current-clamp. Signals were filtered online at 2–10 kHz using the built in 2-pole Bessel filter of the amplifiers, digitized and acquired at 20 kHz (Digidata 1550B, Axon Instruments, United States), using pClamp 11 (Molecular Devices, CA, United States) acquisition software. Data were analyzed offline using the open source Stimfit software package (Schlögl et al., 2013).
Putative SST-INs were identified in brain slices as horizontally oriented cells at the str. oriens/alveus border, which in response to −125 to +125 pA (25 pA steps, 500 ms duration) produced a characteristic large voltage “sag” in response to hyperpolarising currents and moderate frequency, repetitive, non-adapting trains of action potentials to depolarising stimuli. LTP was induced in SST-INs in whole-cell recordings as previously described (Booker et al., 2018). EPSCs were elicited by a bipolar stimulating electrode placed in the alveus of CA1 ∼500 µm distal from the SST-IN soma. Following a 5-min control baseline, LTP was induced with a theta-burst stimulation (TBS) paradigm, which combined associative pairing of five trains of presynaptic EPSCs (4 stimuli at 100 Hz) with postsynaptic depolarization to −20 mV (60 ms duration), repeated 3 times at 30 s intervals as has been described previously (Topolnik et al., 2006). The resulting synaptic potentiation was recorded for at least 25 min following the TBS stimuli and LTP expressed as the change in mean EPSC amplitude measured between 20–25 min post-TBS relative to the 5-minute-baseline preceding the TBS. To activate GABABRs, slices were treated with 20 μM baclofen for 20 min prior to LTP induction. Following recordings, all cells were sealed with outside-out patch configuration, then fixed for 24–72 h in 4% paraformaldehyde in 0.1 M phosphate buffer (PB).
Visualization, imaging and reconstruction of the recorded neurons
Post hoc identification of recorded neurons was performed as previously described (Booker et al., 2014). Slices were rinsed in phosphate buffered saline (PBS; 0.1 M PB + 0.9% NaCl) and then blocked with 10% normal goat serum (NGS), 0.5% TritonX-100% and 0.05% NaN3 diluted in PBS for 1 h at room temperature. Slices were incubated for 72 h in a solution containing 5% NGS, 0.5% TritonX-100% and 0.05% NaN3 and primary antibodies against SST-14 (rabbit, 1:500, Peninsula Laboratories, United States) at 4 °C. Slices were then rinsed in PBS and then incubated with fluorescently conjugated secondary antibodies (Goat anti-rabbit IgG, AlexaFluor 568; 1:500, Invitrogen, United Kingdom) and fluorescent-conjugated streptavidin (AlexaFluor 633; 1:500, Invitrogen, United Kingdom) in a solution containing 3% NGS, 0.1% TritonX-100% and 0.05% NaN3 for 24 h at 4 °C. Slices were rinsed in PBS, then PB, and mounted on glass slides (Fluoromount-G, Southern Biotech, AL, United States). Biocytin filled cells were imaged with a laser scanning confocal microscope (SP8, Leica, Germany) under a 20× (N.A 0.75) objective and z-axis stacks of images (2048 × 2048 pixel radial resolution, 1 µm axial steps) collected to allow identification of somato-dendritic and axonal arborizations. To assess immunoreactivity of the recorded neurons the somata of neurons were imaged with an oil-immersion 63× (N.A 1.3) objective lens, with images taken over the somata. Example cells were reconstructed offline from 20x stacks using the SNT plug-in for the FIJI (Longair et al., 2011).
Extracellular field recording
For field excitatory postsynaptic potential (fEPSP) recordings, slices were transferred to an interface recording chamber perfused with carbogenated recording ACSF at 2–3 mL/min and maintained at 30 ± 1 °C. Recording pipettes with a resistance of 1–3 MΩ were pulled from borosilicate glass capillaries (1.5 mm outer/0.86 mm inner diameter, Harvard Apparatus, United Kingdom) on a horizontal electrode puller and filled with recording ACSF. Slices were visualised using a wide-field microscope (Leica, Germany) and pipettes placed in stratum lacunosum-moleculare (SLM) layer of hippocampal CA1. LTP was induced in extracellular field recordings from CA1. fEPSPs were evoked using a paired-pulse protocol via a bipolar stimulating electrode placed in SLM of CA1, ∼500 μm to 1 mm distal to the recording electrode, targeting the TA pathway. Following a 10-min baseline, pharmacological agents were applied via the circulating aCSF. To activate GABABRs, slices were treated with 20 μM baclofen for 20 min, followed by a 20 min washout. To antagonise mGluR1α and mGluR5, 20 μM LY367385 and 10 μM Fenobam were bath-applied, respectively, and responses recorded for 30–40 min. To block GABAARs, 10 μM gabazine was applied, with effects measured 20–30 min post-application. In gabazine experiments, CA3–CA1 projections were severed to prevent recurrent excitation.
A new 10 min baseline was recorded in each drug condition or following washout. LTP was induced using a high-frequency stimulation (HFS) protocol consisting of two 100 Hz trains of 100 pulses, delivered 30 s apart. Potentiation was monitored for 60 min post-HFS, and LTP magnitude expressed as the mean fEPSP slope measured between 50 and 60 min relative to the 10-min baseline. LTP was considered successful if the 50–60-min slope exceeded baseline by >10%. Signals were rejected if the average baseline slope of 1-2 and 9–10 min were ±10%. Recordings were filtered online with a 1 Hz high-pass and 500 Hz low-pass filter and digitised at 10 kHz. All data were acquired and analysed offline using WinLTP (v3.01, University of Bristol, United Kingdom).
To assess the locus of plasticity expression, we performed coefficient of variation analysis on fEPSP slopes pre-vs. post-HFS. We plotted the CV2 ratio (r = CV2(pre)/CV2(post) against the mean slope ratio (m = µ(post)/µ(pre) for each experiment. Most points with m > 1 (successful LTP) clustered near or below the identity line (r = 1), indicating a mix of pre- and postsynaptic contributions to LTP.
Drugs
GABABR agonist baclofen (Bacl; 20 μM), mGluR1α antagonist LY367385 (LY; 20 μM), mGluR5 antagonist Fenobam (Feno; 10 μM), and GABAAR antagonist gabazine (10 μM) were dissolved in dH2O or DMSO and sourced from HelloBio (HelloBio Ltd., United Kingdom) or Tocris (Bio-Techne Ltd., United Kingdom).
Statistical analysis
All experiments were performed blind to genotype, and data are presented as mean ± SEM. In most cases, one cell or slice was recorded per animal per treatment, limiting the ability to assess intra-animal variability; thus, individual cells or slices were treated as the primary independent replicates. Statistical analyses were conducted on cell-averaged data following assessment of normality. Parametric or non-parametric tests were applied as appropriate, including two-way ANOVA, unpaired Student’s t-tests, Mann–Whitney U-tests, and Wilcoxon signed-rank tests. To determine whether LTP-induction or pharmacological treatment resulted in differences from baseline, 1-sample Wilcoxon signed-rank tests were performed (against 100% baseline), which are indicated on graphs immediately below box-plots. For datasets involving linear regression, comparisons were made using sum-of-squares F-tests. Statistical significance was defined as p < 0.05. Statistical tests and graphing were performed using GraphPad Prism (GraphPad Software v10.4.1, San Diego, CA, United States).
Results
In the present study, we tested the hypothesis that in Fmr1-/y mice SST-INs display enhanced LTP, consistent with the presence of excessive mGluR1/5 signalling, which leads to impairments in temporoammonic synaptic plasticity. For this, we performed whole-cell and extracellular field recordings from CA1 of adult Fmr1-/y mice, compared to wild-type (WT) littermates.
CA1 SST-INs show enhanced LTP of TA inputs in Fmr1-/y mice
SST-INs were targeted for recording at the str. oriens/alveus border. In the present study LTP was recorded from 47 cells which met inclusion criteria, of which 38 were recovered for immunohistochemistry. 2 cells were excluded from further analysis as they lacked SST immunoreactivity. SST-INs typically displayed a horizontally-oriented somatodendritic axis, with axons that extended in SLM (Figure 1A). Immediately following achieving whole-cell configuration we measured basal intrinsic excitability of SST-INs in str. oriens of CA1. In response to hyperpolarising current injections SST-INs produced large amplitude sag potentials, consistent with a high Ih of these cells, while depolarisation consistently gave rise to medium-fast action potential discharge in both WT and Fmr1-/y mice. No difference in action potential output was observed between genotypes (Figure 1B).

Figure 1. Elevated LTP in CA1 SST-INs in Fmr1-/y mice is susceptible to GABABR activation. (A) Overview of experiments and identity of recorded cells. Left, schema of recording configuration for measuring aTBS induced LTP in SST-INs. Middle, low magnification flattened confocal stack showing a recorded SST-IN (scale: 100 μm). Right, high magnification image of the same recorded cell (magenta and arrow) confirming SST immunoreactivity (green; scale: 20 μm). (B) Example voltage responses of SST-INs from WT (black, upper) and Fmr1-/y (red, lower) mice, following ± 125 pA (500 ms duration) stimulation. The average action potential output of all recorded SST-INs is quantified for all current steps delivered. (C) Upper, example traces from WT (black) and Fmr1-/y (red) mice before and after (grey and pink, respectively) induction of aTBS LTP under vehicle conditions or following 20 min pre-application of 20 μM R-baclofen. Lower, time-course plots of EPSC amplitude all WT (n = 11 cells from 8 mice) and Fmr1-/y (n = 9 cells from 7 mice) SST-INs in vehicle and following baclofen pre-treatment (WT: n = 6 cells from 4 mice, grey; Fmr1-/y: n = 8 cells from 6 mice, pink). (D) Comparison of the magnitude of EPSC potentiation measured under control conditions and following baclofen pre-treatment in WT and Fmr1-/y SST-INs. (E) CV2 analysis of aTBS LTP recordings from WT (grey circles) and Fmr1-/y (pink circles) SST-INs. The average responses of both genotypes are depicted ±SEM (black and red, respectively) as well as the linear regression of each group (dashed lines). (F) Paired-pulse recordings from SST-INs showing stimulation location. Example paired-pulse responses in WT (upper, black) and Fmr1-/y (lower, red), in vehicle or 20 μM baclofen. Measured PPR from SST-INs following alveus stimulation. (G) Schematic of TA LTP recording, while measuring alveus EPSCs in SST-INs showing stimulation locations. Example alveus EPSCs from WT (upper, black) and Fmr1-/y (lower, red), before and after (grey and pink) 2 × 100 Hz stimulation to the SLM. Timecourse of alveus EPSC amplitude following TA LTP induction. Quantification of peak EPSC change 20–25 min post HFS. Data is shown as mean ± SEM (B,C,E) or box-plots depicting 25%–75% range, maximum range (D,F,G) and individual data points (open circles). Statistics shown from 2-way ANOVA (B,D,F) Mann-Whitney (G) or Wilcoxon signed-rank (D,G) tests, ns-p > 0.05, **** - p < 0.0001 from Holm-Sidak tests; or ns p > 0.05, # - p < 0.05 (Wilcoxon signed-rank test).
Associative theta-burst stimuli (aTBS) induced LTP in SST-INs is known to be mediated by group 1 mGluRs (Topolnik et al., 2006), and which is sensitive to GABABR activation (Booker et al., 2018). To determine whether this form of synaptic plasticity was altered in Fmr1-/y mice, we stimulated the alveus and recorded EPSCs from SST-INs under control conditions and following pre-treatment of slices with the selective agonist R-baclofen (20 µM) for 20 min (Figure 1C). In Fmr1-/y SST-INs, aTBS of alveus inputs induced LTP had an average potentiation at 25–30 min, which was larger than for WT mice (WT: 133.2% ± 8.2% vs. Fmr1-/y: 216.1% ± 21.7%; t(11,9) = 7.4, p < 0.0001, Holm-Sidak test), indicating enhanced synaptic potentiation in Fmr1-/y SST-INs. Baclofen inhibited SST-IN LTP in both WT and Fmr1-/y mice, as the same aTBS induction of SST-INs failed to produce facilitation of EPSCs (WT: 102.5% ± 6.3%; Fmr1-/y: 96.3% ± 7.4%), which did not differ between genotypes (t(6,8) = 0.29, p = 0.77, Holm-Sidak test, Figure 1D). To probe the locus of LTP magnitude differences, we performed squared coefficient of variation analysis (Faber and Korn, 1991). Plotting the SST-IN LTP data from WT mice revealed a relationship close to unity, meanwhile in Fmr1-/y mice this relationship tended to be skewed into the post-synaptic domain (F = 18.9, p = 0.0004, sum of least-squares F-test, Figure 1E). To determine whether differences in LTP were due to altered presynaptic function, we next measured paired-pulse ratio (PPR) of alveus inputs to SST-INs. We found that under control conditions, EPSCs driven by alveus stimulation were similarly facilitating in both WT and Fmr1-/y SST-INs, with pre-application of baclofen leading to elevated PPR in a genotype-independent manner (Figure 1F).
Finally, SST-INs have been shown to undergo long-term strengthening following activation of distal synaptic inputs, which propagate through the local microcircuit (Maccaferri and McBain, 1995). To confirm whether such inputs to CA1 undergo plasticity in our hands, we performed whole-cell recordings from SST-INs whilst stimulating alveus inputs, followed by 2 × 100 Hz stimulation of SLM. We observed robust potentiation of alveus EPSCs 20–25 min following TA stimulation in WT (134.1% ± 13.2% of baseline, t(6) = 2.6, p = 0.04, paired t-test) and Fmr1-/y (196.6% ± 14.5% of baseline, t(4) = 3.5, p = 0.03, paired t-test) SST-INs, which was higher in the latter (U(7,5) = 5, p = 0.048, Mann-Whitney test, Figure 1G).
These data show that although intrinsic excitability of SST-INs is unchanged, excitatory inputs to SST-INs undergo exaggerated LTP in Fmr1-/y mice, which is fully supressed by baclofen. This heightened plasticity is likely postsynaptic in origin, propagates through CA1 PNs to SST-INs, and thus could lead to impaired TA plasticity.
TA–CA1 LTP is maintained in Fmr1-/y mice following high-frequency stimulation
Given that SST-IN LTP is elevated in Fmr1-/y mice, we next asked if this led to impaired LTP at TA inputs in SLM of CA1. To assess this we recorded field excitatory postsynaptic potentials (fEPSPs) from the SLM of CA1, which reflects the response of TA inputs onto PN distal dendrites (Figure 2A). Synaptic strength was monitored as fEPSP slope during a 10 min baseline, then a high-frequency stimulation (HFS; 2 × 1 s, 100 Hz) was delivered to induce LTP (Figure 2B). In CA1 of WT mice (23 slices) we observed robust post-tetanic potentiation (PTP) immediately (1–2 min) following HFS to the SLM 173.2% ± 10.6% (p < 0.001, Wilcoxon signed rank test, Figure 2C). When measured at 50–60 min post-HFS, we observed increased fEPSP slopes, relatively to baseline of 146.5% ± 10.0% (p < 0.0001, Wilcoxon signed rank test, Figure 2D). Based on a criterion of 10% facilitation at 50–60 min post HFS constituting LTP, 16 of 23 slices displayed LTP in WT mice. Similarly, in Fmr1-/y mice (20 slices), we observed PTP of 206.4% ± 15.7% (p < 0.0001, Wilcoxon signed-rank test) which did not differ from WT slices (U(42) = 172, p = 0.163; Mann-Whitney test, Figure 2C). Likewise, fEPSP slopes at 50–60 min post HFS were elevated to 134.5% ± 8.0% (p = 0.0002, Wilcoxon signed-rank test), which did not differ between genotypes in terms of magnitude (U(42) = 200, p = 0.476; Mann-Whitney test, Figure 2D). 13 of 20 Fmr1-/y slices displayed successful LTP inductions, which was not different from WT slices (p = 0.75, Chi-square test, Figure 2E).
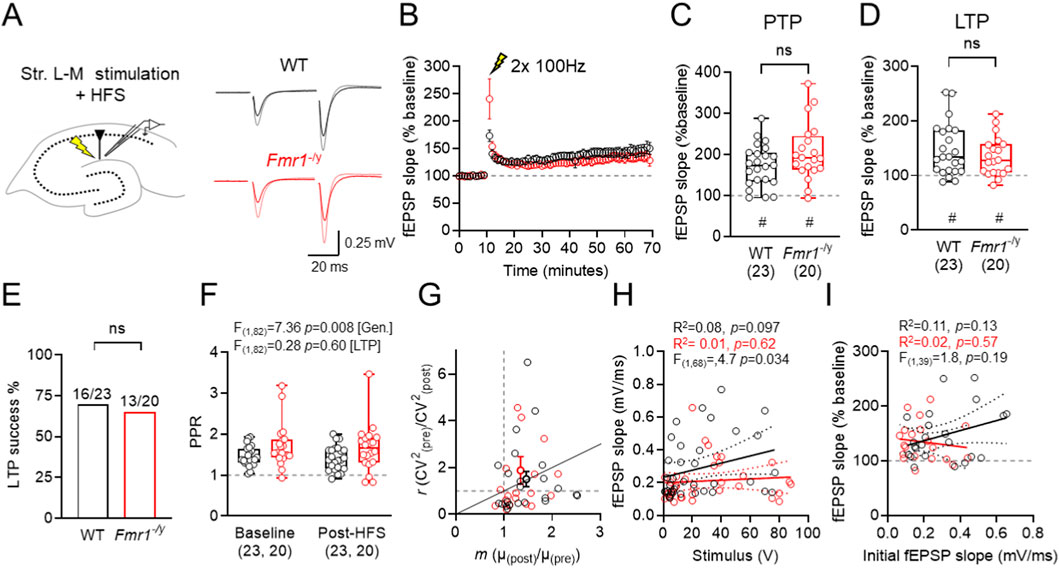
Figure 2. Extracellular field recordings in SLM show intact LTP in the TA–CA1 pathway of Fmr1-/y mice. (A) Schematic of fEPSP recording configuration, showing recording and stimulation locations, and example fEPSP traces from WT and Fmr1-/y mice, recorded before and after HFS (grey and pink, respectively). (B) Time-course of fEPSP recordings (compared to baseline) following high-frequency stimulation (HFS, lightning bolt) of TA inputs in CA1 SLM of WT (black) and Fmr1-/y mice (red). (C) fEPSP slopes measured 50–60 min post-HFS, relative to baseline. (D) Proportion of successful LTP inductions, defined as fEPSP slope change >10% above baseline 50–60 min post-HFS. (E) Post-tetanic potentiation (PTP) magnitude measured 1 min after HFS. (F) PPR recorded before (baseline) and post-HFS. (G) Coefficient-of-variation squared (CV2) analysis of pre- and post-HFS responses. (H) Comparison of stimulus strength vs. fEPSP slope for all fEPSP recordings. (I) Comparison of baseline fEPSP slope and fEPSP potentiation at 50–60 min post-HFS. All data shown from WT: n = 23 slices; Fmr1-/y: n = 20 slices. Data is shown as mean ± SEM (B) or box-plots depicting 25%–75% range, maximum range (C,E,F) or as scatter plots (G,H,I) all with individual data points overlaid (open circles). Statistics shown from Mann-Whitney tests (C,E) 2-way ANOVA (F) linear regression with F-tests (H,I) and or Wilcoxon signed-rank (C,E) tests. Statistical significance shown as: ns-p > 0.05; or ns p > 0.05, # - p < 0.05 (Wilcoxon signed-rank test).
Despite no difference in LTP, we did observe genotype-dependent differences in baseline synaptic transmission and short-term plasticity. In particular, the paired pulse ratio (PPR) of pre-HFS fEPSP was significantly higher in Fmr1-/y slices compared to WT, independent of LTP induction (F(1,82) = 7.36; [genotype], p = 0.008; Two-way ANOVA; Figure 2F), suggesting a FMRP dependent effect on release probability; despite no difference in CV2 analysis (Figure 2G). Consistent with our previous observations (Booker et al., 2020), synaptic strength was weaker at TA inputs to CA1, as reflected by a lower y-intercept of Fmr1-/y slices when fEPSP slope vs. stimulation intensity is plotted (F(1,68) = 4.704; p = 0.034; [intercepts]; Figure 2H). We did not find any genotype difference in the magnitude of LTP compared to the initial fEPSP slope (F(1,39) = 1.8; p = 0.19; [slope]; Figure 2I).
Together, these data suggest that although Fmr1-/y mice exhibit reduced basal synaptic function (higher PPR, lower fEPSP slopes) at TA inputs to CA1, overall LTP magnitude is maintained. The preservation of TA-CA1 LTP in Fmr1-/y slices despite heightened SST-IN plasticity may reflect compensatory effects, such as impaired inhibition.
Pharmacological modulation of GABABRs, GABAARs and group 1 mGluRs minimally affects basal synaptic transmission at TA inputs
As the inhibitory potential of SST-INs is regulated by GABAAR, GABABRs, and mGluRs (Topolnik et al., 2006; Ali and Thomson, 1998; Leão et al., 2012; Booker et al., 2018) we next determined the effect that modulating these receptors had on basal fEPSPs evoked by TA stimulation in WT and Fmr1-/y mice. To achive this, we bath applied GABABR agonist baclofen (20 μM), GABAAR antagonist gabazine (SR95531, 10 μM), mGluR1α antagonist LY367385 (20 μM), mGluR5 negative allosteric modulator Fenobam (10 μM), and the mGluR1/5 agonist s-DHPG (10 μM) to paired fEPSPs (50 ms interval) evoked by TA stimulation (Figure 3A). Measurement of the fEPSP slope during wash-in resulted in minimal observable difference in overal TA response during the 20 min wash-in period for baclofen (WT n = 10; Fmr1-/y n = 9 slices), gabazine (WT n = 9; Fmr1-/y n = 9 slices), and LY367385 (WT n = 6; Fmr1-/y n = 12 slices) (Figure 3B). However, Fenobam (WT n = 11; Fmr1-/y n = 13 slices) and DHPG (WT n = 9; Fmr1-/y n = 9 slices) both led to an increase in fEPSP slopes in Fmr1-/y slices. Comparing whether these drugs displayed genotype-specific differences in activity, we found that fEPSP slopes in Fmr1-/y slices following baclofen wash-in were signifcantly lower than WT (U(18) = 19, p = 0.035, Mann-Whitney test). However, we found that gabazine (U(17) = 39, p = 0.93, Mann-Whitney test), LY367385 (U(17) = 33, p = 0.82, Mann-Whitney test), Fenobam (U(23) = 53, p = 0.30, Mann-Whitney test), nor DHPG (U(20) = 36, p = 0.22, Mann-Whitney test), did not diplay genotype-specific differences in fEPSP slope (Figure 3C). Equally, none of these drugs signficantly altered PPR at TA inputs to CA1 (Figure 3D). Together, these data reveal that while GABABRs may display some genotype effects, there is minimal difference in mGluR1/5 and GABAAR mediated control of TA inputs to CA1.
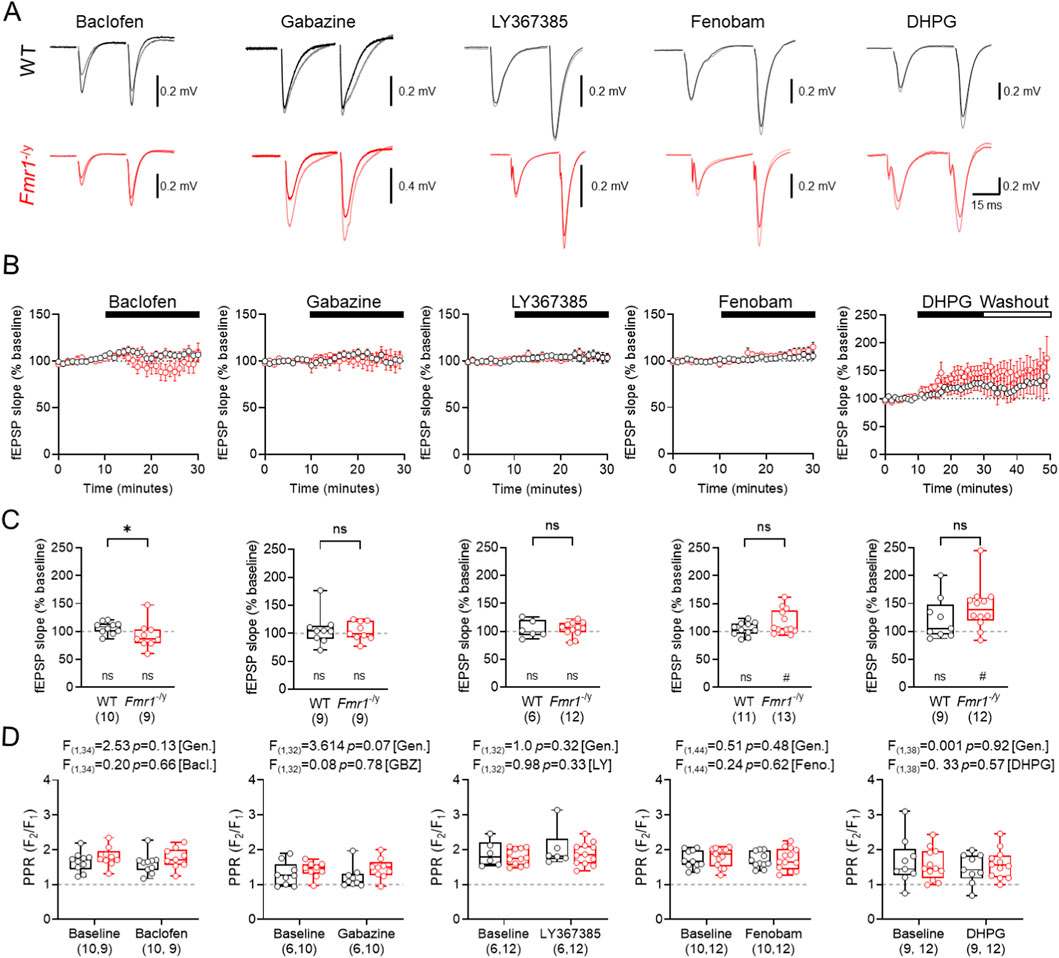
Figure 3. Comparison of GABA and mGluR modifying drugs on TA basal synaptic transmission (A) Example fEPSP traces recorded before and after drug incubation in WT (black) and Fmr1-/y (red) mice. Drugs applied from left to right include: 20 μM baclofen (GABABR agonist), 10 μM gabazine (GABAAR antagonist), 20 μM LY367385 (mGluR1α antagonist), 10 μM Fenobam (mGluR5 antagonist), and 10 μM s-DHPG (mGluR1/5 agonist). (B) Timecourse plots shown separately for each treatment condition and genotype. The duration of each drug application is shown above (black bar). (C) Mean fEPSP slope measured over the final 10 min of drug application for each of the drugs listed. (D) Paired-pulse ratio (PPR) before and after drug application. Data shown as mean ± SEM (B) or box-plots depicting 25%–75% range, maximum range (C,D). WT and Fmr1-/y sample sizes indicated in each bar); all with individual data points overlaid (open circles). Statistics shown from Mann Whitney tests (C) 2-way ANOVA (D) and Wilcoxon signed-rank tests (C). Statistics shown as: ns-p > 0.05, * - p < 0.05; or ns p > 0.05, # - p < 0.05 (Wilcoxon signed-rank test).
GABA receptor modulation does not differentially effect TA LTP in WT and Fmr1-/y mice
SST-IN activation recruits both GABAARs and GABABRs (Watson and Booker, 2024), and their plasticity itself is regulated by GABABR activation (Booker et al., 2018). As such, we next determined whether GABABR activation (Figure 4A), or GABAAR inhibition (Figure 4B) differentially regulates TA LTP. Following baclofen (20 uM) application we induced TA LTP as before. Following 2 × 100 Hz HFS, we observed robust PTP in WT of 244.4% ± 28.5% (n = 8 slices, p = 0.0078, Wilcoxon signed-rank test) and 208.7% ± 18.2% in Fmr1-/y (n = 9 slices, p = 0.0039, Wilcoxon signed-rank test), which was not different between genotypes (U(16) = 26, p = 0.37, Mann-Whitney test). Consistently, at 50–60 min post HFS, we observed robust potentiation of fEPSP slopes in WT of 181.1% ± 17.6% (n = 8 slices, p = 0.0078, Wilcoxon signed-rank test) and 186.8% ± 20.0% in Fmr1-/y (n = 9 slices, p = 0.0078, Wilcoxon signed-rank test), which again was not different between genotypes (U(16) = 30.5, p = 0.90, Mann-Whitney test). A direct within-genotype comparison of the effect of baclofen is shown in Figure 6. Following baclofen application, all slices from both genotypes displayed LTP induction (WT: 8/8, Fmr1-/y: 9/9). We found no genotype or LTP-dependent effects on PPR in WT or Fmr1-/y slices (F(1,28) = 0.59, p = 0.45; [genotype]; F(1,28) = 0.83; p = 0.37; [HFS]; Two-way ANOVA). CV2 analysis revealed both pre- and postsynaptic mechanisms contributing to LTP in both genotypes in slices treated with baclofen.
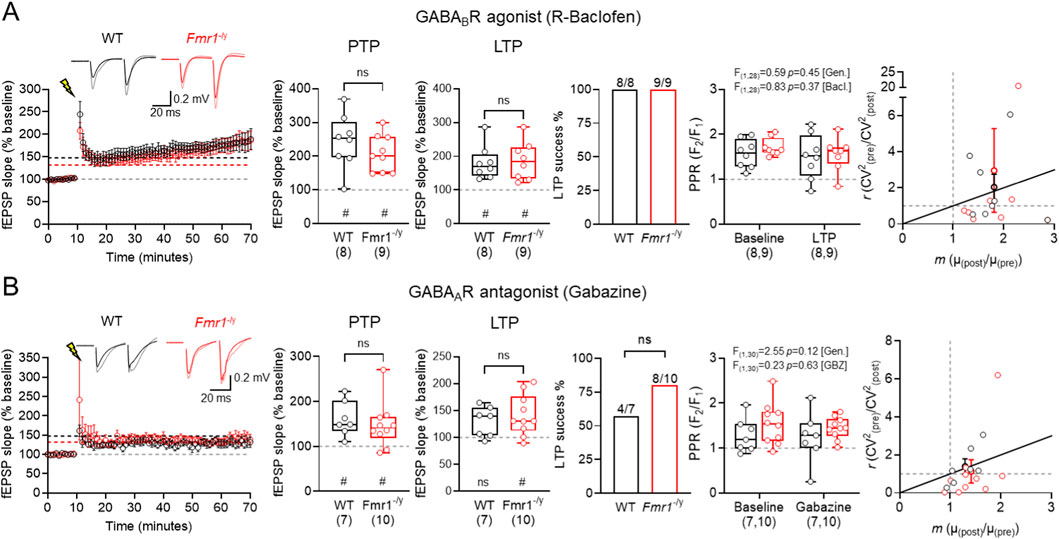
Figure 4. No genotype-specific effects of GABA modulating drugs on TA LTP in Fmr1-/y mice. (A) Time-course of fEPSP slope following HFS (lightning bolt) at TA inputs in wild-type (WT, black) and Fmr1-/y (red) mice, following 30 min incubation with 20 μM baclofen followed by a 20 min washout. Inset, example fEPSP traces from WT and Fmr1-/y mice recorded before (black and red, respectively) and after HFS (grey and pink, respectively). PTP magnitude measured 1 min after HFS and LTP measured 50–60 min post-HFS, both relative to baseline fEPSP slope. Proportion of mice exhibiting successful LTP induction, defined as a 50–60 min post-HFS slope >10% above baseline. PPR measured before and after HFS, and CV2 analysis pre- and post-HFS responses. WT: n = 8 slices; Fmr1-/y: n = 9 slices. (B) The same data, but shown for TA LTP recordings performed after 30 min incubation with the GABAAR antagonist gabazine (10 μM). WT: n = 7 mice; Fmr1-/y: n = 10 mice. Data is shown as mean ± SEM or box-plots depicting 25%–75% range, maximum range; all with individual data points overlaid (open circles). Statistics shown from Mann-Whitney tests, Chi-squared tests, 2-way ANOVA or Wilcoxon signed-rank tests; ns-p > 0.05 (Mann-Whitney test); or ns p > 0.05, # - p < 0.05 (Wilcoxon signed-rank tests).
Following application of gabazine (Figure 4B) we observed robust PTP in WT of 161.2% ± 14.7% (n = 7 slices, p = 0.0156, Wilcoxon signed-rank test) and 147.4% ± 16.1% of Fmr1-/y (n = 10 slices, p < 0.01, Wilcoxon signed-rank test), with no differences between genotype (U(16) = 26, p = 0.42, Mann-Whitney test). At 50–60 min post-HFS we did not observe significant LTP in WT of 129.3% ± 10.6% (n = 7, p = 0.078, Wilcoxon signed-rank test) only LTP in Fmr1-/y of 141.7% ± 12.0% (n = 10, p = 0.0059, Wilcoxon signed-rank test), which was not different between genotypes (U(16) = 31, p = 0.74, Mann-Whitney test). A direct within-genotype comparison of the effect of gabazine is shown in Figure 6. In the presence of gabazine, successful LTP induction was not different from control (WT: 4/7, Fmr1-/y: 8/10). We found no genotype or LTP dependent effect on PPR (F(1,30) = 2.55, p = 0.12; [genotype]; F(1,30) = 0.23, p = 0.63, [HFS], Two-way ANOVA). CV2 analysis suggested that gabazine induced a predominantly postsynaptic-mediated induction of LTP.
These data indicate that there are no genotype specific effects of GABAAR inhibition or GABABR activation on TA LTP in CA1, in the Fmr1-/y mouse. This indicates that perhaps enhanced SST-IN LTP has a limited net effect on this pathway.
mGluR modulation also does not differentially effect TA LTP in WT and Fmr1-/y mice
LTP in SST-INs requires activation of mGluR1α and mGluR5 (Topolnik et al., 2006; Vasuta et al., 2015), and indeed mGluR1/5 have been implicated in altered hippocampal plasticity of Fmr1-/y mice (Osterweil et al., 2010). Thus, we next determined the effects of blocking mGluR1α, inhibiting mGluR5, or activating both of these receptors on TA LTP.
For mGluR1α, following LY367385 bath-application (Figure 5A), we observed PTP in WT of 182.0% ± 17.8% (n = 6 slices, p = 0.031, Wilcoxon signed-rank test) and Fmr1-/y slices of 198.5% ± 17.9% (n = 12 slices, p < 0.001, Wilcoxon signed-rank test), with no significant difference between genotypes (U(17) = 34, p = 0.89, Mann-Whitney test). At 50–60 min post-HFS, LTP was not observed in WT of 112.5% ± 7.6% (n = 6 slices, p = 0.09, Wilcoxon signed-rank test) or Fmr1-/y slices of 113.7% ± 5.9% (n = 12 slices, p = 0.034, Wilcoxon signed-rank test), and no difference between genotype (U(17) = 33, p = 0.82, Mann-Whitney test). WT and Fmr1-/y slices showed reduced, but comparable LTP success (WT: 4/6, Fmr1-/y: 6/12; p = 0.50, Chi-square test). LY367385 did not significantly alter PPR post-HFS (F(1,32) = 0.34; p = 0.57; [LY367385]; Two-way ANOVA) in either WT (Pre: 2.02 ± 0.2 vs. Post: 2.17 ± 0.23) or Fmr1-/y (Pre: 2.05 ± 0.14 vs. Post: 2.11 ± 0.14; F(1,32) = 0.01; p = 0.92; [genotype]). CV2 analysis revealed that the minimal LTP induced in the presence of LY367385 was predominantly postsynaptic in nature.
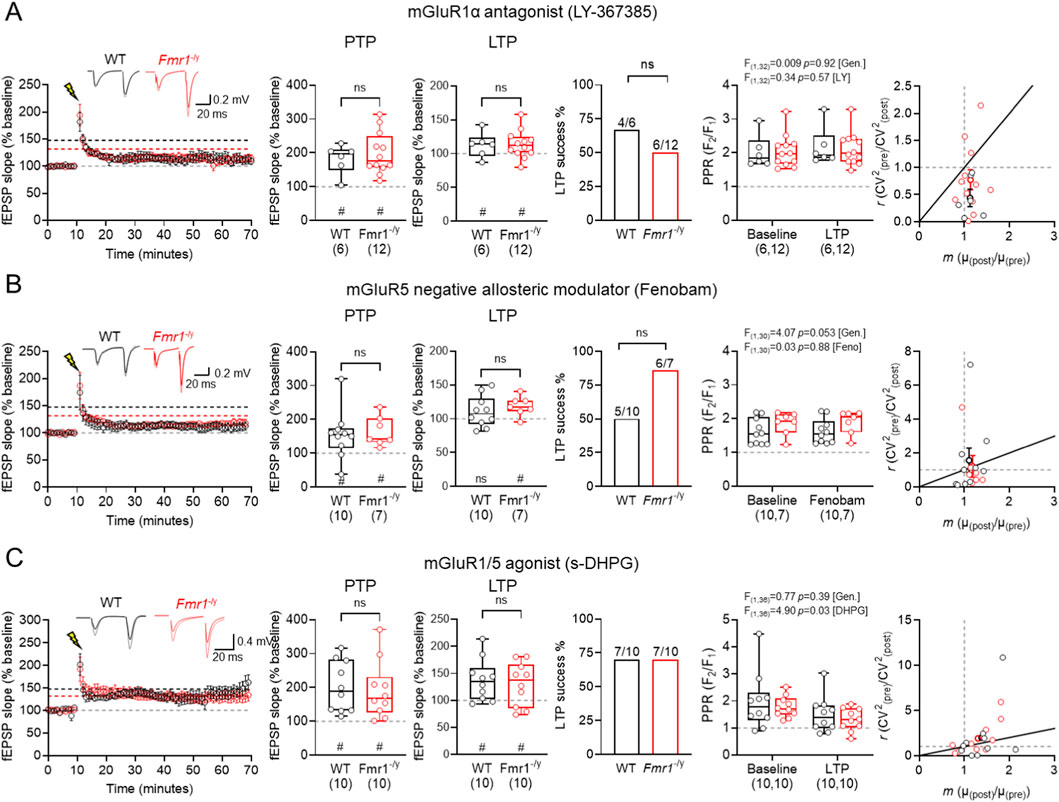
Figure 5. Group 1 mGluR modulation has no genotype effects on TA LTP in Fmr1-/y mice. (A) Time-course of fEPSP slope following HFS at TA inputs in wild-type (WT, black) and Fmr1-/y (red) mice, following 30 min bath application of the mGluR1α antagonist LY367385 (20 μM). Inset, example fEPSP traces from WT and Fmr1-/y mice recorded before (black and red, respectively) and after HFS (grey and pink, respectively). PTP magnitude measured 1 min after HFS and LTP measured 50–60 min post-HFS, both relative to baseline fEPSP slope. Proportion of mice exhibiting successful LTP induction, defined as a 50–60 min post-HFS slope >10% above baseline. PPR measured before and after HFS, and CV2 analysis pre- and post-HFS responses. WT: n = 6 slices; Fmr1-/y: n = 12 slices. (B) The same data, but shown for TA LTP recordings performed after 30 min incubation with the mGluR5 antagonist Fenobam (10 μM). WT: n = 10 mice; Fmr1-/y: n = 7 mice. (C) The same data, but shown for recordings performed after 30 min incubation with the mGluR1/5 agonist s-DHPG (10 μM). WT: n = 10 slices; Fmr1-/y: n = 10 slices. Data is shown as mean ± SEM or box-plots depicting 25%–75% range, maximum range; all with individual data points overlaid (open circles). Statistics shown from Mann-Whitney tests, Chi-squared tests, 2-way ANOVA or Wilcoxon signed-rank tests; ns-p > 0.05 (Mann-Whitney test); or ns p > 0.05, # - p < 0.05 (Wilcoxon signed-rank tests).
In slices incubated with Fenobam (Figure 5B) we observed PTP in WT of 155.3% ± 22.7% (n = 10 slices, p = 0.49, Wilcoxon signed-rank test) and Fmr1-/y PTP of 164.7% ± 16.5% was similar (n = 7 slices, p = 0.016, Wilcoxon signed-rank test), with no significant genotype effects (U(16) = 33, p = 0.89, Mann-Whitney test). We found Fenobam to consistently reduce LTP magnitude in WT slices of 110.6% ± 7.2% (n = 10 slices, p = 0.32, Wilcoxon signed-rank test) while Fmr1-/y slices continued to display LTP of 118.6% ± 5.4% (n = 7 slices, p = 0.03, Wilcoxon signed-rank test) with no significant difference between genotype (U(16) = 24, p = 0.32, Mann-Whitney test). The LTP success rate following Fenobam application was similar between WT and Fmr1-/y slices (WT: 5/10 vs. Fmr1-/y: 6/7; p = 0.13, Chi-square test). Fenobam did not alter PPR post-HFS with no main effect of treatment (F(1,30) = 0.0253; p = 0.88; [Fenobam]; Two-way ANOVA). We observed a tendency for PPR to be lower post-HFS in WT (Pre: 1.62 ± 0.12 vs. Post: 1.63 ± 0.12) compared to Fmr1-/y (Pre: 1.86 ± 0.13 vs. Post: 1.90 ± 0.13; F(1,30) = 4.065; [genotype], p = 0.053). CV2 analysis revealed a predominantly postsynaptic locus.
In slices incubated with 10 μM DHPG (Figure 5C), a concentration known to induce LTP at unitary inputs onto SST INs (Le Vasseur et al., 2008), we observed PTP in WT of 201.9% ± 24.0% (n = 10 slices, p = 0.002, Wilcoxon signed-rank test) and Fmr1-/y slices of 191.6% ± 26.9% (n = 10 slices, p = 0.002, Wilcoxon signed-rank test), with no significant genotype effects (U(19) = 45, p = 0.74, Mann-Whitney test). Following DHPG application we found HFS to consistently induce robust LTP in WT slices of 137.6% ± 12.2% (n = 10 slices, p = 0.014, Wilcoxon signed-rank test) and Fmr1-/y slices of 130.3% ± 12.7% (n = 10 slices, p = 0.048, Wilcoxon signed-rank test) with no significant difference between genotype (U(19) = 45, p = 0.74, Mann-Whitney test). The LTP success rate following DHPG application was similar between WT and Fmr1-/y slices (WT: 7/10 vs. Fmr1-/y: 7/10; p = 0.99, Chi-square test). DHPG on PPR revealed a significant effect of treatment (F(1,36) = 4.899; p = 0.033; [DHPG]; Two-way ANOVA). We observed a tendency PPR to be lower post-HFS in WT (Pre: 1.98 ± 0.33 vs. Post: 1.49 ± 0.21) and Fmr1-/y slices (Pre: 1.78 ± 0.12 vs. Post: 1.31 ± 0.13; F(1,36) = 0.7702; [genotype], p = 0.39). CV2 analysis revealed both pre- and postsynaptic mechanisms contributing to LTP in both genotypes in the presence of DHPG.
Taken together, these data indicate that Group 1 mGluRs, which are known to contribute to SST-IN plasticity, do not differentially effect TA LTP in Fmr1-/y mice; rather these drugs modulate LTP in a consistent manner between genotypes. This implies that enhanced SST-IN LTP in Fmr1-/y mice either does not propagate to circuit level, or that effects are nuanced with broad pharmacological approaches saturating effects.
Comparison of different modifiers of GABA and group1 mGluR signalling
To allow direct comparison between fEPSP recordings made under control conditions and following drug application, we performed a side-by-side comparison of PTP and LTP effects (Figure 6).
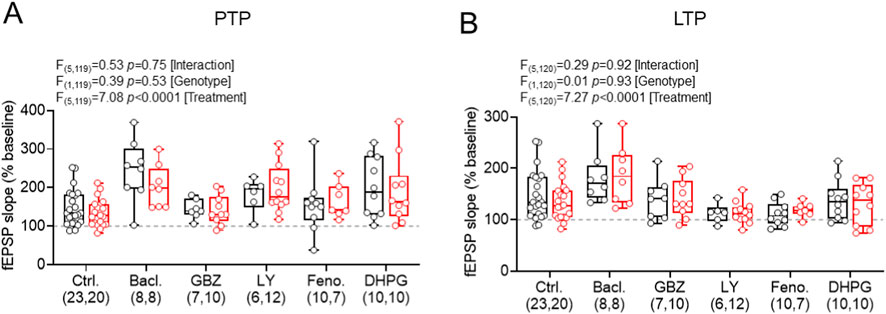
Figure 6. Summary of drug incubations on PTP and LTP magnitude post-HFS revealed no significant differences. (A) Post-HFS fEPSP slope (measured 0–1 min after stimulation) for PTP measured under control conditions and following application of baclofen (GABABR agonist), gabazine (GABAAR antagonist), LY367385 (mGluR1α antagonist), Fenobam (mGluR5 antagonist), or s-DHPG (mGluR1/5 agonist); in wild-type (WT, black) and Fmr1-/y (red) mice. (B) Data in the same form, but shown for LTP measured at 50–60 min post-HFS. All data shown as box-plots depicting 25%–75% range, maximum range; all with individual data points overlaid (open circles). Sample sizes (n = slices per group) are shown underneath. Statistics shown from 2-way ANOVA.
For PTP (Figure 6A), groupwise comparison revealed a significant effect of treatment (F(5,119) = 7.08; p < 0.0001 [treatment]; 2-way ANOVA). In WT TA recordings, we observed that baclofen (t(23,8) = 4.14, p < 0.0001, Fishers LSD test) and DHPG (t(23,10) = 2.43, p = 0.017, Fishers LSD test) significantly increased PTP, but gabazine (t(23,7) = 0.14, p = 0.89, Fishers LSD test), LY367385 (t(23,6) = 1.32, p = 0.19, Fishers LSD test), and Fenobam (t(23,10) = 0.36, p = 0.72, Fishers LSD test) did not. We found no effect of genotype (F(1,119) = 0.39; p = 0.53; 2-way ANOVA), or interaction of genotype and treatment (F(5,119) = 0.53; p = 0.75; 2-way ANOVA). These indicate that modulators of GABA and mGluRs appear to display differential effects on presynaptic-induced short-term plasticity in a genotype independent manner.
Comparing LTP outcomes (Figure 6B), groupwise comparison also revealed a significant treatment effect (F(5,120) = 7.27; p < 0.0001; 2-way ANOVA). In WT TA LTP recordings, we observed that baclofen treatment increased LTP (t(23,8) = 2.13, p = 0.035, Fishers LSD test), but LY367385 (t(23,6) = 1.99, p = 0.049, Fishers LSD test) and Fenobam (t(23,10) = 2.54, p = 0.012, Fishers LSD test) both substantially decreased LTP. Meanwhile, gabazine (t(23,8) = 0.48, p = 0.63, Fishers LSD test) and DHPG (t(23,10) = 0.68, p = 0.50, Fishers LSD test) had no apparent effect on TA LTP. Again, we found no effect of genotype (F(1,120) = 0.01; p = 0.93; 2-way ANOVA), or interaction of genotype and treatment (F(5,120) = 0.29; p = 0.92; 2-way ANOVA).
Together, these data confirm our earlier findings of an absence of genotype effect on TA LTP in Fmr1-/y mice. Furthermore, baclofen, LY367385, and Fenobam (which are all predicted to block SST-IN LTP) all modified LTP, albeit not in the same direction. These findings confirm the potential role of SST-INs in TA LTP, but that its induction and maintenance is not impaired in Fmr1-/y mice.
Discussion
Our findings demonstrate that SST-INs play a significant role in shaping LTP in the TA pathway, but that while they themselves display enhanced LTP, their control of plasticity at this pathway is not altered in a mouse model of FXS. This dissociation suggests that hippocampal circuits in Fmr1-/y mice likely compensate for reduced TA input and elevate SST-IN LTP to maintain a functional transfer of spatial information.
We found no significant change in the intrinsic excitability of SST-INs in adult Fmr1-/y mice. This is notable, given the broader neuronal hyperexcitability reported in CA1 PNs (Booker et al., 2020; Bataveljic et al., 2024; Luque et al., 2017; Luque et al., 2024), as well as in the neocortex of Fmr1-/y mice (Deng and Klyachko, 2016). One plausible explanation is that homeostatic plasticity normalises SST-IN excitability over development. Alternatively, FMRP-related ion channel changes (e.g., in HCN or Kv channels) might be offset by other compensation in SST-INs (Hewitt et al., 2025), however we did not observe the same hypoexcitability of SST-INs that Hewitt and colleagues report. Regardless, the major changes in SST-IN function in models of FXS appear at the synaptic level rather than in inherent excitability. Indeed, we observed a robust enhancement of LTP at excitatory synapses onto SST-INs in Fmr1-/y mice. While WT SST-INs displayed modest potentiation following aTBS, Fmr1-/y SST-INs exhibited far greater potentiation. This is consistent with excessive activation of mGluRs, as has been reported previously for FXS (Osterweil et al., 2010), and which are required for LTP of SST-INs (Topolnik et al., 2006; Le Vasseur et al., 2008). Furthermore, we confirm that activation of CA1 PNs via the TA path leads to propagation of excessive LTP onto SST-INs in the Fmr1-/y mouse, as previously described in WT mice (Maccaferri and McBain, 1995) providing validation of our fEPSP experiments. Together, this suggests that loss of FMRP leads to upregulated plasticity of excitatory inputs onto SST-INs.
What are the circuit-level consequences of exaggerated SST-IN LTP? Our data suggests that such plasticity fails to supress TA LTP in Fmr1-/y mice, when measured with fEPSPs. This is contrary to recent reports when all inhibition (both GABAARs and GABABRs) was blocked (Ordemann et al., 2021). In our study, we have not blocked GABABR signalling, specifically as it has been shown to modify CA1 inputs via presynaptic mechanisms in Fmr1-/y mice (Wahlstrom-Helgren and Klyachko, 2015). The fact that we see no differential effect of baclofen application may reflect as saturation of such presynaptic inhibition, as SST-IN input and output is strongly regulated by GABABR activation (Booker et al., 2020). This suggests a more complex picture, where TA inputs to CA1 are reduced in amplitude, undergo typical plasticity mechanisms under pharmacologically naïve conditions, possess elevated GABABR presynaptic function, combined with excessive SST-IN LTP. The most parsimonious explanation for these various effects is a compensatory reduction in the output of SST-INs (Figure 7). However, reduced SST-IN synaptic strength alone would not explain the typical expression of TA LTP we observe in Fmr1-/y mice, as these interneurons are known to inhibit dendritic plasticity mechanisms in CA1 PNs (Udakis et al., 2025). Such effects could require enhanced disinhibitory mechanisms known to result from SST-IN recruitment (Leão et al., 2012; Vasuta et al., 2015), and vasoactive intestinal peptide (VIP) -expressing INs (which mostly target other INs) display elevated activity in Fmr1-/y mice (Rahmatullah et al., 2023). Such a compensatory rebalancing of inhibitory microcircuits may come at the expense of network fidelity, where poor signal-to-noise ratios or disrupted temporal coding potentially contribute to cognitive inflexibility in FXS (Asiminas et al., 2022). Dissection of these mechanisms remains unexplored, but may hold the key to understanding hippocampal circuit function and plasticity in rodent models of FXS.
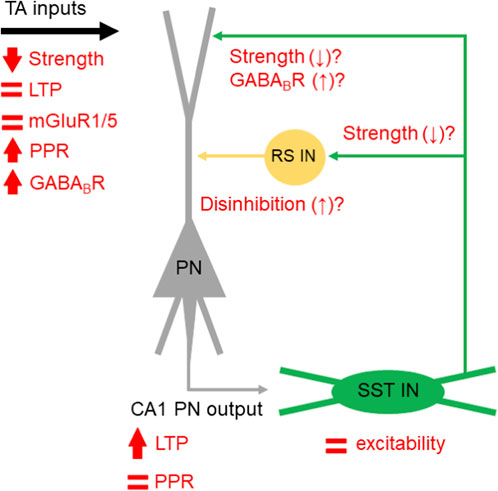
Figure 7. Summary of proposed and speculative changes in synaptic function in the SST-IN microcircuit in CA1. A schematic PN (grey) and SST-IN (green) are shown, with observed function in Fmr1-/y mice indicated (red symbols).
Our pharmacological manipulations directly investigated translationally-relevant plasticity mechanisms of hippocampal circuits relating to FXS therapies. In FXS, GABABR signalling shows dysregulation, with presynaptic GABABR-mediated inhibition stronger at inhibitory synapses, reducing GABA release (Wahlstrom-Helgren and Klyachko, 2015), and postsynaptic GABABR signalling downregulated (Kang et al., 2017). Application of R-baclofen in acute slices activates all membrane localised GABABRs (Lüscher et al., 1997), including those that inhibit SST-INs (Booker et al., 2018; Booker et al., 2020), but also those expressing parvalbumin (Booker et al., 2013), cholecystokinin (Booker et al., 2017), and neurogliaform types (Oláh et al., 2007); as well as hippocampal PNs (Degro et al., 2015). Such motifs of GABABR inhibition of PNs and INs appear to be common to CA1 and the rodent dentate gyrus (Degro et al., 2024), suggesting that common motifs of GABABR inhibition may be found throughout the cortex. How these various GABABR signalling mechanisms interact and contribute to circuit level processing in FXS is not yet clear, however such diversity may explain why facilitating GABABR signalling has benefit to behavioural and network phenotypes in Fmr1-/y mice (Henderson et al., 2012; Sinclair et al., 2017; Zhang et al., 2015) and improved some features affected individuals (Berry-Kravis et al., 2012). GABAARs also display impaired expression in Fmr1-/y mice (d'Hulst et al., 2006), thus silencing GABAARs may be predicted to have disproportionate genotype-specific effects. Our data revealed no differential effect of the GABAAR antagonist gabazine on TA-LTP in WT mice, in agreement with similar recordings from the Schaffer-collaterals (Chapman et al., 1998). This suggests two possibilities: a) that phasic GABAAR-mediated inhibition is not a major constraint on LTP in this pathway, or b) that broad administration of gabazine abolishes both direct inhibition and also disinhibition. The latter option is perhaps most likely, as GABABR activation is also known to enhance LTP through disinhibitory mechanisms (see Kulik et al., 2018).
In contrast to GABABR activation, inhibiting mGluR1α with LY367385 or mGluR5 with Fenobam similarly impaired LTP in both genotypes, which we attribute to the loss of SST-IN LTP, as mGluR1α is highly enriched and required for their LTP induction (Vasuta et al., 2015); despite no change to basal TA transmission. As SST-INs displayed enhanced plasticity in Fmr1-/y mice, these data indicate that mGluR1/5 inhibition impairs TA LTP induction independent of genotype. Interestingly, stimulation of mGluR1/5 with DHPG, at a concentration above its EC50 and known to induce LTP in SST INs (Le Vasseur et al., 2008) but not widely used to assess population level LTD., revealed no differential effect on basal synaptic transmission nor TA LTP. This is somewhat at odds with suggested exaggerated function of group 1 mGluRs in Fmr1-/y mice (Osterweil et al., 2010), as we find no evidence for LTD. mechanisms of fEPSPs, conversely we observe increased synaptic strength, which did not differ between genotypes. As FMRP is found throughout the dendrites (Hale et al., 2021), it is perplexing that we did not observe genotype specific differences in DHPG function. Further investigation is required to identify mGluR1/5 function in hippocampal distal dendrites. From a therapeutic perspective, mGluR1α antagonism would have limited therapeutic benefit, as this fully and selectively suppresses SST-IN function and may reduce typical circuit function. Conversely, mGluR5 inhibition (e.g., Fenobam) is consistent with the mGluR theory of FXS (Bear et al., 2004). Our data suggests that Fenobam had limited differential effect on TA LTP in Fmr1-/y mice, which with an absence of DHPG effects, may explain the mixed outcomes of mGluR5 blocker trials in FXS patients (Berry-Kravis et al., 2016; Berry-Kravis et al., 2009; Jacquemont et al., 2011), which addressed some behavioural symptoms but did not markedly improve cognition. Further targeted research is needed to disentangle the functional interaction of disinhibition and mGluR signalling mechanisms at long-range synaptic connections.
Summary
In summary, our data reveal that despite enhanced LTP of SST-INs, TA LTP is largely typical in a mouse model of FXS. Further, we show that mGluR1α, mGluR5, GABABRs, and GABAARs do not display genotype selective effects on TA LTP in Fmr1-/y mice. These results highlight that while cell-type specific effects on synaptic function may exist, these appear to be largely compensated for at the circuit level.
Data availability statement
The raw data supporting the conclusions of this article will be made available by the authors, upon reasonable request.
Ethics statement
The animal study was approved by University of Edinburgh Animal Welfare and Ethical Review Body (AWERB). The study was conducted in accordance with the local legislation and institutional requirements.
Author contributions
MW: Data curation, Validation, Conceptualization, Methodology, Writing – original draft, Supervision, Writing – review and editing, Formal Analysis, Investigation, Visualization. AS: Writing – review and editing, Methodology, Investigation, Formal Analysis. EB: Investigation, Writing – review and editing. SB: Investigation, Funding acquisition, Writing – review and editing, Supervision, Writing – original draft, Validation, Data curation, Visualization, Resources, Methodology, Formal Analysis, Conceptualization, Project administration.
Funding
The author(s) declared that financial support was received for this work and/or its publication. This work was funded by the Simons Initiative for the Developing Brain, UK Medical Research Council (SAB - MR/Y014529/1), Edinburgh Neuroscience, and the RS McDonald Seedcorn Fund.
Acknowledgements
We thank members of the Booker lab for helpful comments relating to the data and analysis, and the University of Edinburgh Biological Veterinary Service (BVS) team for providing ongoing support.
Conflict of interest
The author(s) declared that this work was conducted in the absence of any commercial or financial relationships that could be construed as a potential conflict of interest.
Generative AI statement
The author(s) declared that generative AI was not used in the creation of this manuscript.
Any alternative text (alt text) provided alongside figures in this article has been generated by Frontiers with the support of artificial intelligence and reasonable efforts have been made to ensure accuracy, including review by the authors wherever possible. If you identify any issues, please contact us.
Publisher’s note
All claims expressed in this article are solely those of the authors and do not necessarily represent those of their affiliated organizations, or those of the publisher, the editors and the reviewers. Any product that may be evaluated in this article, or claim that may be made by its manufacturer, is not guaranteed or endorsed by the publisher.
References
Abbas, A. I., Sundiang, M. J., Henoch, B., Morton, M. P., Bolkan, S. S., Park, A. J., et al. (2018). Somatostatin interneurons facilitate hippocampal-prefrontal synchrony and prefrontal spatial encoding. Neuron 100, 926–939. e3. doi:10.1016/j.neuron.2018.09.029
Ali, A. B., and Thomson, A. M. (1998). Facilitating pyramid to horizontal oriens-alveus interneurone inputs: dual intracellular recordings in slices of rat hippocampus. J. Physiol. 507 (Pt 1), 185–199. doi:10.1111/j.1469-7793.1998.185bu.x
Amaral, D. G., and Witter, M. P. (1989). The three-dimensional organization of the hippocampal formation: a review of anatomical data. Neuroscience 31, 571–591. doi:10.1016/0306-4522(89)90424-7
Antoine, M. W., Langberg, T., Schnepel, P., and Feldman, D. E. (2019). Increased excitation-inhibition ratio stabilizes synapse and circuit excitability in four autism mouse models. Neuron 101, 648–661. e4. doi:10.1016/j.neuron.2018.12.026
Artinian, J., Jordan, A., Khlaifia, A., Honoré, E., LA Fontaine, A., Racine, A.-S., et al. (2019). Regulation of hippocampal memory by mTORC1 in somatostatin interneurons. J. Neurosci. 39, 8439–8456. doi:10.1523/JNEUROSCI.0728-19.2019
Asiminas, A., Booker, S. A., Dando, O. R., Kozic, Z., Arkell, D., Inkpen, F. H., et al. (2022). Experience-dependent changes in hippocampal spatial activity and hippocampal circuit function are disrupted in a rat model of fragile X syndrome. Mol. Autism 13, 49. doi:10.1186/s13229-022-00528-z
Bassell, G. J., and Warren, S. T. (2008). Fragile X syndrome: loss of local mRNA regulation alters synaptic development and function. Neuron 60, 201–214. doi:10.1016/j.neuron.2008.10.004
Bataveljic, D., Pivonkova, H., De Concini, V., Hébert, B., Ezan, P., Briault, S., et al. (2024). Astroglial Kir4. 1 potassium channel deficit drives neuronal hyperexcitability and behavioral defects in fragile X syndrome mouse model. Nat. Communications 15, 3583. doi:10.1038/s41467-024-47681-y
Bear, M. (2005). Therapeutic implications of the mGluR theory of fragile X mental retardation. Genes, Brain Behav. 4, 393–398. doi:10.1111/j.1601-183X.2005.00135.x
Bear, M. F., Huber, K. M., and Warren, S. T. (2004). The mGluR theory of fragile X mental retardation. Trends Neurosciences 27, 370–377. doi:10.1016/j.tins.2004.04.009
Berry-Kravis, E., Hessl, D., Coffey, S., Hervey, C., Schneider, A., Yuhas, J., et al. (2009). A pilot open label, single dose trial of fenobam in adults with fragile X syndrome. J. Medical Genetics 46, 266–271. doi:10.1136/jmg.2008.063701
Berry-Kravis, E. M., Hessl, D., Rathmell, B., Zarevics, P., Cherubini, M., Walton-Bowen, K., et al. (2012). Effects of STX209 (arbaclofen) on neurobehavioral function in children and adults with fragile X syndrome: a randomized, controlled, phase 2 trial. Sci. Translational Medicine 4, 152ra127. doi:10.1126/scitranslmed.3004214
Berry-Kravis, E., Des Portes, V., Hagerman, R., Jacquemont, S., Charles, P., Visootsak, J., et al. (2016). Mavoglurant in fragile X syndrome: results of two randomized, double-blind, placebo-controlled trials. Sci. Translational Medicine 8, 321ra5. doi:10.1126/scitranslmed.aab4109
Booker, S. A., and Kind, P. C. (2021). Mechanisms regulating input-output function and plasticity of neurons in the absence of FMRP. Brain Res. Bull. 175, 69–80. doi:10.1016/j.brainresbull.2021.06.025
Booker, S. A., Gross, A., Althof, D., Shigemoto, R., Bettler, B., Frotscher, M., et al. (2013). Differential GABAB-receptor-mediated effects in perisomatic-and dendrite-targeting parvalbumin interneurons. J. Neurosci. 33 (18), 7961–7974.
Booker, S. A., and Vida, I. (2018). Morphological diversity and connectivity of hippocampal interneurons. Cell Tissue Research 373, 619–641. doi:10.1007/s00441-018-2882-2
Booker, S. A., Song, J., and Vida, I. (2014). Whole-cell patch-clamp recordings from morphologically-and neurochemically-identified hippocampal interneurons. J. Visualized Experiments JoVE, 51706. doi:10.3791/51706
Booker, S. A., Althof, D., Gross, A., Loreth, D., Müller, J., Unger, A., et al. (2017). KCTD12 auxiliary proteins modulate kinetics of GABAB receptor-mediated inhibition in cholecystokinin-containing interneurons. Cereb. Cortex 27 (3), 2318–2334.
Booker, S. A., Loreth, D., Gee, A. L., Watanabe, M., Kind, P. C., Wyllie, D. J., et al. (2018). Postsynaptic GABABRs inhibit L-type calcium channels and abolish long-term potentiation in hippocampal somatostatin interneurons. Cell Reports 22, 36–43. doi:10.1016/j.celrep.2017.12.021
Booker, S. A., De Oliveira, L. S., Anstey, N. J., Kozic, Z., Dando, O. R., Jackson, A. D., et al. (2020). Input-output relationship of CA1 pyramidal neurons reveals intact homeostatic mechanisms in a mouse model of fragile X syndrome. Cell Rep. 32, 107988. doi:10.1016/j.celrep.2020.107988
Çaku, A., Pellerin, D., Bouvier, P., Riou, E., and Corbin, F. (2014). Effect of lovastatin on behavior in children and adults with fragile X syndrome: an open-label study. Am. Journal Medical Genetics Part A 164, 2834–2842. doi:10.1002/ajmg.a.36750
Chapman, C. A., Perez, Y., and Lacaille, J. C. (1998). Effects of GABAA inhibition on the expression of long-term potentiation in CA1 pyramidal cells are dependent on tetanization parameters. Hippocampus 8, 289–298. doi:10.1002/(SICI)1098-1063(1998)8:3<289::AID-HIPO10>3.0.CO;2-X
Contractor, A., Klyachko, V. A., and Portera-Cailliau, C. (2015). Altered neuronal and circuit excitability in fragile X syndrome. Neuron 87, 699–715. doi:10.1016/j.neuron.2015.06.017
D'Hulst, C., De Geest, N., Reeve, S. P., Van Dam, D., De Deyn, P. P., Hassan, B. A., et al. (2006). Decreased expression of the GABAA receptor in fragile X syndrome. Brain Research 1121, 238–245. doi:10.1016/j.brainres.2006.08.115
Degro, C. E., Kulik, A., Booker, S. A., and Vida, I. (2017). Compartmental distribution of GABAB receptor-mediated currents along the somatodendritic axis of hippocampal principal cells. Front. synaptic neurosci. 7, 6.
Degro, C. E., Vida, I., and Booker, S. A. (2024). Postsynaptic GABAB-receptor mediated currents in diverse dentate gyrus interneuron types. Hippocampus 34 (10), 551–562.
Deng, P.-Y., and Klyachko, V. A. (2016). Increased persistent sodium current causes neuronal hyperexcitability in the entorhinal cortex of Fmr1 knockout mice. Cell Reports 16, 3157–3166. doi:10.1016/j.celrep.2016.08.046
Domanski, A. P., Booker, S. A., Wyllie, D. J., Isaac, J. T., and Kind, P. C. (2019). Cellular and synaptic phenotypes lead to disrupted information processing in Fmr1-KO mouse layer 4 barrel cortex. Nat. Commun. 10, 4814. doi:10.1038/s41467-019-12736-y
Faber, D. S., and Korn, H. (1991). Applicability of the coefficient of variation method for analyzing synaptic plasticity. Biophys. J. 60 (5), 1288–1294.
Gantois, I., Vandesompele, J., Speleman, F., Reyniers, E., D'Hooge, R., Severijnen, L.-A., et al. (2006). Expression profiling suggests underexpression of the GABAA receptor subunit δ in the fragile X knockout mouse model. Neurobiol. Disease 21, 346–357. doi:10.1016/j.nbd.2005.07.017
Gibson, J. R., Bartley, A. F., Hays, S. A., and Huber, K. M. (2008). Imbalance of neocortical excitation and inhibition and altered UP states reflect network hyperexcitability in the mouse model of fragile X syndrome. J. Neurophysiology 100, 2615–2626. doi:10.1152/jn.90752.2008
Hale, C. R., Sawicka, K., Mora, K., Fak, J. J., Kang, J. J., Cutrim, P., et al. (2021). FMRP regulates mRNAs encoding distinct functions in the cell body and dendrites of CA1 pyramidal neurons. Elife 10, e71892
Henderson, C., Wijetunge, L., Kinoshita, M. N., Shumway, M., Hammond, R. S., Postma, F. R., et al. (2012). Reversal of disease-related pathologies in the fragile X mouse model by selective activation of GABAB receptors with arbaclofen. Sci. Translational Medicine 4, 152ra128. doi:10.1126/scitranslmed.3004218
Hewitt, L. T., Marron, A. M., and Brager, D. H. (2025). Higher hyperpolarization-activated current in a subpopulation of interneurons in stratum oriens of area CA1 in the hippocampus of fragile X mice. J. Neurophysiology 133, 1558–1571. doi:10.1152/jn.00510.2024
Huber, K. M., Gallagher, S. M., Warren, S. T., and Bear, M. F. (2002). Altered synaptic plasticity in a mouse model of fragile X mental retardation. Proc. Natl. Acad. Sci. 99, 7746–7750. doi:10.1073/pnas.122205699
Jacquemont, S., Curie, A., Des Portes, V., Torrioli, M. G., Berry-Kravis, E., Hagerman, R. J., et al. (2011). Epigenetic modification of the FMR1 gene in fragile X syndrome is associated with differential response to the mGluR5 antagonist AFQ056. Sci. Translational Medicine 3, 64ra1. doi:10.1126/scitranslmed.3001708
Kang, J.-Y., Chadchankar, J., Vien, T. N., Mighdoll, M. I., Hyde, T. M., Mather, R. J., et al. (2017). Deficits in the activity of presynaptic γ-aminobutyric acid type B receptors contribute to altered neuronal excitability in fragile X syndrome. J. Biol. Chem. 292, 6621–6632. doi:10.1074/jbc.M116.772541
Katona, L., Lapray, D., Viney, T. J., Oulhaj, A., Borhegyi, Z., Micklem, B. R., et al. (2014). Sleep and movement differentiates actions of two types of somatostatin-expressing GABAergic interneuron in rat hippocampus. Neuron 82, 872–886. doi:10.1016/j.neuron.2014.04.007
Kulik, Á., Booker, S. A., and Vida, I. (2018). Differential distribution and function of GABABRs in somato-dendritic and axonal compartments of principal cells and interneurons in cortical circuits. Neuropharmacology 136, 80–91.
Le Duigou, C., and Kullmann, D. M. (2011). Group I mGluR agonist-evoked long-term potentiation in hippocampal oriens interneurons. J. Neurosci. 31, 5777–5781. doi:10.1523/JNEUROSCI.6265-10.2011
Le Vasseur, M., Ran, I., and Lacaille, J.-C. (2008). Selective induction of metabotropic glutamate receptor 1– and metabotropic glutamate receptor 5–dependent chemical long-term potentiation at oriens/alveus interneuron synapses of mouse hippocampus. Neuroscience 151 (1), 28–42. doi:10.1016/j.neuroscience.2007.09.071
Leão, R. N., Mikulovic, S., Leão, K. E., Munguba, H., Gezelius, H., Enjin, A., et al. (2012). OLM interneurons differentially modulate CA3 and entorhinal inputs to hippocampal CA1 neurons. Nat. Neuroscience 15, 1524–1530. doi:10.1038/nn.3235
Ligsay, A., Van Dijck, A., Nguyen, D. V., Lozano, R., Chen, Y., Bickel, E. S., et al. (2017). A randomized double-blind, placebo-controlled trial of ganaxolone in children and adolescents with fragile X syndrome. J. Neurodevelopmental Disorders 9, 1–13. doi:10.1186/s11689-017-9207-8
Longair, M. H., Baker, D. A., and Armstrong, J. D. (2011). Simple neurite tracer: open source software for reconstruction, visualization and analysis of neuronal processes. Bioinformatics 27, 2453–2454. doi:10.1093/bioinformatics/btr390
Lovett-Barron, M., Turi, G. F., Kaifosh, P., Lee, P. H., Bolze, F., Sun, X.-H., et al. (2012). Regulation of neuronal input transformations by tunable dendritic inhibition. Nat. Neuroscience 15, 423–430. doi:10.1038/nn.3024
Luque, M. A., Beltran-Matas, P., Marin, M. C., Torres, B., and Herrero, L. (2017). Excitability is increased in hippocampal CA1 pyramidal cells of Fmr1 knockout mice. PLoS One 12, e0185067. doi:10.1371/journal.pone.0185067
Luque, M. A., Morcuende, S., Torres, B., and Herrero, L. (2024). Kv7/M channel dysfunction produces hyperexcitability in hippocampal CA1 pyramidal cells of Fmr1 knockout mice. J. Physiology 602, 3769–3791. doi:10.1113/JP285244
Lüscher, C., Jan, L. Y., Stoffel, M., Malenka, R. C., and Nicoll, R. A. (1997). G protein-coupled inwardly rectifying K+ channels (GIRKs) mediate postsynaptic but not presynaptic transmitter actions in hippocampal neurons. Neuron 19 (3), 687–695.
Maccaferri, G., and McBain, C. J. (1995). Passive propagation of LTD to stratum oriens-alveus inhibitory neurons modulates the temporoammonic input to the hippocampal CA1 region. Neuron. 15 (1), 137–145.
Naka, A., Veit, J., Shababo, B., Chance, R. K., Risso, D., Stafford, D., et al. (2019). Complementary networks of cortical somatostatin interneurons enforce layer specific control. Elife 8, e43696. doi:10.7554/eLife.43696
Oláh, S., Komlosi, G., Szabadics, J., Varga, C., Toth, E., Barzo, P., et al. (2007). Output of neurogliaform cells to various neuron types in the human and rat cerebral cortex. Front. Neural Circuits 1, 84.
Oliveira, L. S., Sumera, A., and Booker, S. A. (2021). Repeated whole-cell patch-clamp recording from CA1 pyramidal cells in rodent hippocampal slices followed by axon initial segment labeling. Star. Protocols 2, 100336. doi:10.1016/j.xpro.2021.100336
Ordemann, G. J., Apgar, C. J., Chitwood, R. A., and Brager, D. H. (2021). Altered A-type potassium channel function impairs dendritic spike initiation and temporoammonic long-term potentiation in fragile X syndrome. J. Neurosci. 41, 5947–5962. doi:10.1523/JNEUROSCI.0082-21.2021
Osterweil, E. K., Krueger, D. D., Reinhold, K., and Bear, M. F. (2010). Hypersensitivity to mGluR5 and ERK1/2 leads to excessive protein synthesis in the hippocampus of a mouse model of fragile X syndrome. J. Neurosci. 30, 15616–15627. doi:10.1523/JNEUROSCI.3888-10.2010
Rahmatullah, N., Schmitt, L. M., De Stefano, L., Post, S., Robledo, J., Chaudhari, G., et al. (2023). Hypersensitivity to distractors in fragile X syndrome from loss of modulation of cortical VIP interneurons. J. Neurosci. 43, 8172–8188. doi:10.1523/JNEUROSCI.0571-23.2023
Remondes, M., and Schuman, E. M. (2002). Direct cortical input modulates plasticity and spiking in CA1 pyramidal neurons. Nature 416, 736–740. doi:10.1038/416736a
Royer, S., Zemelman, B. V., Losonczy, A., Kim, J., Chance, F., Magee, J. C., et al. (2012). Control of timing, rate and bursts of hippocampal place cells by dendritic and somatic inhibition. Nat. Neuroscience 15, 769–775. doi:10.1038/nn.3077
Schlögl, A., Jonas, P., Schmidt-Hieber, C., and Guzman, S. (2013). Stimfit: a fast visualization and analysis environment for cellular neurophysiology. Biomed. Engineering/Biomedizinische Tech. 58, 000010151520134181. doi:10.1515/bmt-2013-4181
Sinclair, D., Featherstone, R., Naschek, M., Nam, J., Du, A., Wright, S., et al. (2017). GABA-B agonist baclofen normalizes auditory-evoked neural oscillations and behavioral deficits in the Fmr1 knockout mouse model of fragile X syndrome. Eneuro 4. doi:10.1523/ENEURO.0380-16.2017
Topolnik, L., Azzi, M., Morin, F., Kougioumoutzakis, A., and Lacaille, J. C. (2006). mGluR1/5 subtype-specific calcium signalling and induction of long-term potentiation in rat hippocampal oriens/alveus interneurones. J. Physiology 575, 115–131. doi:10.1113/jphysiol.2006.112896
Udakis, M., Claydon, M. D., Zhu, H. W., Oakes, E. C., and Mellor, J. R. (2025). Hippocampal OLM interneurons regulate CA1 place cell plasticity and remapping. Nat. Commun. 16 (1), 9912.
Vago, D. R., and Kesner, R. P. (2008). Disruption of the direct perforant path input to the CA1 subregion of the dorsal hippocampus interferes with spatial working memory and novelty detection. Behav. Brain Research 189, 273–283. doi:10.1016/j.bbr.2008.01.002
Vasuta, C., Artinian, J., Laplante, I., Hébert-Seropian, S., Elayoubi, K., and Lacaille, J.-C. (2015). “Metaplastic regulation of CA1 schaffer collateral pathway plasticity by hebbian MGluR1a-mediated plasticity at excitatory synapses onto somatostatin-expressing interneurons,”, 2. Eneuro. doi:10.1523/ENEURO.0051-15.2015
Wahlstrom-Helgren, S., and Klyachko, V. A. (2015). GABAB receptor-mediated feed-forward circuit dysfunction in the mouse model of fragile X syndrome. J. Physiology 593, 5009–5024. doi:10.1113/JP271190
Watson, T. C., and Booker, S. A. (2024). Somatostatin interneurons recruit pre-and postsynaptic GABAB receptors in the adult mouse dentate gyrus. Eneuro 11 (8).
Keywords: Fmr1 mouse, Fragile X Syndrome, GABAB receptor, group 1 metabotropic glutamate receptor, hippocampus, somatostatin interneuron, synaptic plasticity (LTP), temporoammonic pathway
Citation: Wilson MA, Sumera A, Berk E and Booker SA (2026) Elevated somatostatin interneuron long-term potentiation minimally regulates temporoammonic plasticity in a mouse model of Fragile X Syndrome. Front. Pharmacol. 16:1640921. doi: 10.3389/fphar.2025.1640921
Received: 04 June 2025; Accepted: 18 December 2025;
Published: 15 January 2026.
Edited by:
Arthur Riegel, University of Arizona, United StatesReviewed by:
Christian Cea-Del Rio, Universidad de Santiago de Chile, ChileRaquel Bajo-Grañeras, Complutense University of Madrid, Spain
Copyright © 2026 Wilson, Sumera, Berk and Booker. This is an open-access article distributed under the terms of the Creative Commons Attribution License (CC BY). The use, distribution or reproduction in other forums is permitted, provided the original author(s) and the copyright owner(s) are credited and that the original publication in this journal is cited, in accordance with accepted academic practice. No use, distribution or reproduction is permitted which does not comply with these terms.
*Correspondence: Sam A. Booker, c2Jvb2tlckBlZC5hYy51aw==