 Wenli Li
 Wei Huang
 Peng Zhou
 Yongchuan Yao
 Biao Cai
 Shu Ye
- 1School of Integrated Chinese and Western Medicine, Anhui University of Chinese Medicine, Hefei, China
- 2Anhui Provincial Key Laboratory of Chinese Medicinal Formula, Hefei, China
- 3Innovation Center for Medical Research on the Prevention and Treatment of Neurodegenerative Diseases Using Integrated Traditional Chinese and Western Medicine, Hefei, China
- 4The First Affiliated Hospital of Anhui University of Traditional Chinese Medicine, Hefei, China
Introduction: Sporoderm-Removed Ganoderma lucidum Spore Powder (S-GLSP), derived from the spores of the medically valued fungus Ganoderma lucidum, exhibits diverse pharmacological activities and shows considerable potential in the treatment of Alzheimer’s disease (AD). However, its underlying mechanisms of action remain incompletely elucidated. This study aims to investigate the protective effects of S-GLSP against AD and to explore the molecular mechanisms involved.
Materials and Methods: The chemical profile of S-GLSP extract was characterized using LC-MS/MS. Alzheimer’s disease models were established both in vivo and in vitro: a rat model was induced by D-galactose combined with intracerebroventricular injection of Aβ, while a cellular model was stimulated with LPS. The neuroprotective effects of S-GLSP were assessed through behavioral tests and hematoxylin-eosin (HE) staining. Immunofluorescence staining, Western blot (WB), RT-qPCR, and ELISA were employed to evaluate microglial polarization and NLRP3 inflammasome activation. Cell viability was measured using MTT and EdU assays. Finally, NLRP3 knockdown was performed to verify whether S-GLSP modulates microglial polarization via regulation of the NLRP3 inflammasome.
Results: A total of 42 chemical compounds were identified in S-GLSP, including flavonoids, alkaloids, terpenoids, saccharides, phenolics, fatty acids, nucleosides, amino acids, and other. S-GLSP treatment alleviated neuronal damage, improved learning and memory deficits, and reduced the expression of phosphorylated tau (p-tau) in AD model rats. Further experiments in vitro and in vivo showed that S-GLSP downregulated M1 phenotypic markers (CD86, iNOS, TNF-α) and upregulated M2 markers (CD206, Arg-1, IL-10). Moreover, S-GLSP inhibited NLRP3 inflammasome activation and regulated the secretion of IL-1β and IL-18, effects that were consistent with those observed following NLRP3 knockdown.
Conclusion: Our findings demonstrate that S-GLSP alleviates Alzheimer’s disease pathology by inhibiting NLRP3 inflammasome activation, promoting a shift in microglial polarization from the M1 to the M2 phenotype, and modulating the release of inflammatory cytokines. This study provides novel mechanistic insights into the therapeutic potential of S-GLSP for AD.
1 Introduction
Alzheimer’s disease (AD) remains one of the most challenging progressive neurodegenerative disorders, characterized by memory loss, cognitive decline, and impairments in reasoning and emotional regulation. As the disease advances, patients gradually lose the ability to live independently, imposing substantial societal and familial burdens (Knopman et al., 2021). To date, drug development for AD has progressed slowly, and existing approved medications are unable to reverse the pathological course of the disease. Notably, recent therapeutic strategies have shifted toward targeting neuroimmune cells—such as microglia and astrocytes—and modulating peripheral inflammation to alleviate central nervous system (CNS) inflammation, offering promising diagnostic and therapeutic avenues for AD (Yan et al., 2024). Among these, microglia-mediated chronic neuroinflammation has been shown to drive AD progression by promoting amyloid-beta (Aβ) plaque accumulation and neurofibrillary tangle (NFT) formation (Kwon and Koh, 2020). Therefore, reprogramming aberrant microglial polarization has emerged as a potential strategy to curb disease progression. In this context, multi-target compounds derived from Traditional Chinese Medicine have attracted increasing research attention.
Ganoderma lucidum (Curtis) P. Karst, a medicinal and edible fungus widely used in Asian countries, represents a botanical drug with substantial therapeutic value. Systematic studies have revealed that Ganoderma lucidum and its active compounds exhibit considerable potential in AD treatment. They are known to delay disease progression and improve cognitive function through multiple mechanisms, including inhibition of tau hyperphosphorylation, reduction of Aβ aggregation, suppression of neuronal apoptosis, regulation of acetylcholinesterase, modulation of microglial activation, and interference with the NF-κB/MAPK signaling pathway (Chen et al., 2024). Ganoderma lucidum spore powder (GLSP), containing the full spectrum of bioactive constituents of the fungus, comprises a wide range of chemical compounds such as triterpenoids, polysaccharides, fatty acids, alkaloids, and vitamins, which collectively contribute to its anti-inflammatory, immunomodulatory, antioxidant, and neuroprotective properties (Zhang et al., 2024). Sporoderm-removed Ganoderma lucidum spore powder (S-GLSP), a highly processed formulation, exhibits improved bioavailability and higher concentrations of active compounds (Soccol et al., 2016). In 2020, broken Ganoderma spores were officially listed in China’s Health Food Catalog (The State Pharmacopoeia Commission of People’s Republic of China, 2020). A previous study reported that S-GLSP extract significantly improved memory performance in a rat model of Alzheimer’s induced by intracerebroventricular streptozotocin (Zhao et al., 2021).
Nevertheless, the protective role of S-GLSP in AD and its underlying molecular mechanisms remain incompletely understood. The NOD-like receptor protein 3 (NLRP3) inflammasome—composed of NLRP3, ASC, and pro-caspase-1 (Fu and Wu, 2023)—is the most widely studied inflammasome complex and is closely linked to AD pathogenesis (Li and Gong, 2025). Upon activation by Aβ, microglia promote the assembly of the NLRP3 inflammasome, which in turn triggers a cascade of inflammatory responses (Heneka et al., 2013; Van Zeller et al., 2021). Excessive NLRP3 activation not only exacerbates tau pathology and synaptic dysfunction but also sustains a harmful inflammatory milieu via elevated IL-1β release (Felsky et al., 2019). Thus, microglial NLRP3 is considered a key node linking Aβ and tau pathology in AD (Ising et al., 2019).
In this study, we performed a comprehensive chemical profiling of S-GLSP using high-resolution mass spectrometry and evaluated its pharmacological effects in a rat model of AD induced by D-galactose and bilateral hippocampal Aβ25-35 injection. We further elucidated the mechanisms by which S-GLSP inhibits NLRP3-mediated neuroinflammation and regulates microglial polarization.
2 Materials and methods
2.1 Materials
S-GLSP (wall breaking rate ≥98%) were purchased from Anhui HuangshanYunle Ganoderma Lucidum Co., Ltd. (Anhui, China). Professor Nianjun Yu authenticated all G. lucidum at Anhui University of Chinese Medicine. D-galactose was obtained from Macklin (Shanghai, China). Aβ25-35 was acquired from Sigma-Aldrich (St. Louis, MO, United States).
2.2 Analysis of the chemical composition of S-GLSP
2.2.1 Sample preparation and extraction
The S-GLSP (50 mg ± 2 mg) was weighed, mixed with beads, and 500 μL of extraction solution (MeOH: ACN: H2O, 2:2:1 v/v/v) containing deuterated internal standards. The mixture was incubated at −40 °C for 30 min. Then, the sample was centrifuged at 12,000 rpm (RCF = 13,800 × g, R = 8.6 cm) for 15 min at 4 °C. The supernatant was transferred to a fresh glass vial for analysis.
2.2.2 LC-MS/MS analysis
LC-MS/MS analyses were performed using a UHPLC system (Vanquish, Thermo Fisher Scientific) equipped with a Phenomenex Kinetex C18 column (2.1 mm × 100 mm, 2.6 μm) coupled to an Orbitrap Exploris 120 mass spectrometer (Orbitrap MS, Thermo Fisher Scientific). Mobile phase A consisted of 0.01% acetic acid in water, and mobile phase B:IPA:ACN (1:1,v/v). The autosampler temperature was maintained at 4 °C, and the injection volume was 2 μL.
The Orbitrap Exploris 120 mass spectrometer was utilized for its capability to acquire MS/MS spectra in data-dependent acquisition (DDA) mode, controlled by the acquisition software Xcalibur (Thermo). The ESI source conditions were set as follows: sheath gas flow rate at 50 Arb, auxiliary gas flow rate at 15 Arb, capillary temperature at 320 °C, full MS resolution at 60,000, MS/MS resolution at 15,000, collision energy (SNCE) at 20/30/40, and spray voltage at 3.8 kV (positive mode) or −3.4 kV (negative mode), respectively.
2.2.3 Data processing
The raw LC-MS/MS data were converted to the mzML format using MSConvert (ProteoWizard, version 3.0.18205). Data preprocessing was then performed using the XCMS package (version 4.7.3) in R (version 4.3.1), and Biotree DB (version 3.0).
2.3 Animals and treatments
Sprague-Dawley rats (250–350 g) were supplied by the Experimental Animal Center of Liaoning (Certificate No. SCXK (Liao) 2023-0001). The rats were housed individually in a temperature-controlled facility (23 °C ± 1 °C, 50%–60% humidity) under a 12 h/12 h light/dark cycle (lights on at 9:00 a.m., designated as ZT 0). Food and water were provided ad libitum. All animal experiments were conducted in accordance with the ARRIVE 2.0 guidelines (Boutron et al., 2020)and approved by the Animal Ethics Committee of Anhui University of Chinese Medicine (Approval No. AHUCM-rats-2023082).
Fifty rats were randomly assigned to five groups: (n = 10 per group): control (CTRL), Model, low-dose S-GLSP (S-GLSP-L, 360 mg/kg), high-dose S-GLSP (S-GLSP-H, 720 mg/kg), and donepezil (1.5 mg/kg). The AD model was established as previously described (Huang et al., 2024). Briefly, rats received daily intraperitoneal injections of D-galactose (100 mg/kg) along with bilateral hippocampal injections of Aβ25-35 (10 μg per side). After 14 days of D-galactose administration, the S-GLSP-L and S-GLSP-H groups were treated orally with 360 mg/kg and 720 mg/kg S-GLSP (Zhao et al., 2021), respectively, while the DP group received 1.5 mg/kg of donepezil by gavage. Following the experimental procedures, rats were deeply anesthetized with sodium pentobarbital (45 mg/kg, i. p.) for terminal tissue collection. A schematic of the experimental timeline is provided in Figure 1.

Figure 1. Timeline of the animal experimental protocol.
2.4 Behavioral tests
All behavioral assessments were conducted by investigators blinded to the experimental groups. The tests were performed in a sequential manner: the Morris Water Maze (MWM) was conducted first, followed by the Y-Maze test after a 48-h rest period to minimize carryover effects between paradigms.
2.4.1 Morris water maze
The spatial learning and memory abilities of rats were assessed using the Morris Water Maze Test. The maze consisted of a circular pool (160 cm in diameter) divided into four equal quadrants. A hidden escape platform was placed in the third quadrant, submerged 1 cm below the water surface. Days 1–4 (Acquisition Trial): rats were released sequentially from each of the four quadrants once daily and given 90 s to locate the hidden platform. Animals that failed to find the platform within the allotted time were gently guided to it and allowed to remain there for 15 s. Day 5 (Spatial Probe Test): rats were introduced into the pool from the first quadrant, and the time to reach the platform location in third quadrant within 90 s (escape latency) was recorded. Day 6 (Place Navigation Test): The platform was removed, and the rats were allowed to swim freely in the pool for 90 s. The number of crossings over the previous platform location was recorded. All behavioral sessions were video-tracked and analyzed using the SMART 3.0 system (Panlab, Barcelona, Spain). (The experiment was conducted under double-blind conditions.)
2.4.2 Y maze
The Y-maze test was conducted using an apparatus with three identical arms (40 × 10 × 35 cm each), positioned at 120° angles and designated as the start arm, familiar arm, and novel arm. The experiment consisted of two phases separated by a 24-h interval. During the training phase, the novel arm was blocked, and rats were allowed to freely explore the start and familiar arms for 10 min. In the test phase conducted 24 h later, all three arms were made accessible, and each rat was allowed to explore the maze freely for 5 min. The time spent in the novel arm was recorded as an indicator of cortex-dependent working memory. All behavioral sessions were video-recorded and analyzed with the YMT-100 Y video tracking system (Chengdu Tai meng Software Co., Ltd., China). (The experiment was conducted under double-blind conditions.)
2.5 Hematoxylin & eosin (H&E) staining
After fixation with 4% paraformaldehyde, the brain tissue was dehydrated, cleared, and embedded in paraffin. The embedded paraffin blocks were sectioned into 5 μm-thick slices using microtome. Subsequently, the sections were stained with hematoxylin and eosin (H&E) for histological examination, and neuronal morphology in the hippocampal CA1 region was observed under a light microscope.
2.6 Western blot assays
The brain tissues or treated cells were lysed in RIPA lysis buffer (Beyotime Biotechnology, Shanghai, China) and protein concentrations were quantified by BCA assay. The protein samples were separated by 10%–12% SDS-PAGE, transferred to PVDF membranes. And the membranes were blocked with 5% skim milk at room temperature for 2 h, followed by an overnight incubation with primary antibodies: anti-phospho-tau (p-tau, 1:1,000, catalog no. 30505, Cell Signaling Technology, MA, United States), anti-iNOS (1:1,000, catalog no. 340668, ZenBio, Chengdu, China), anti-Arg-1 (1:1,000, catalog no. YM4860, Immunoway, Jiangsu, China), anti-NLRP3 (1:1,000, catalog no. ab263899, Abcam, Cambridge, United Kingdom), anti-ASC (1:1,000, catalog no. YT0365, Immunoway, Jiangsu, China), anti-cleaved Caspase-1 (1:1,000, catalog no. AF4005, Affinity, Jiangsu, China), anti-IL-1β (1:1,000, catalog no. ab216995, Abcam, Cambridge, United Kingdom), anti-IL-18 (1:8,000, catalog no. 10663-1-AP, Proteintech, Wuhan, China), anti-β-actin (1:5,000, catalog no. R380624, ZenBio, Chengdu, China), and anti-GAPDH (1:5,000, catalog no. R380626, ZenBio, Chengdu, China). The following day, the membranes were incubated with the appropriate HRP-conjugated secondary antibodies for 2 h. After washing, the bands were visualized with an ECL chemiluminescence substrate kit (Biosharp, Hefei, China), and quantified by densitometry using ImageJ software.
2.7 Immunofluorescent staining
Brain sections or cell slides fixed with 4% paraformaldehyde underwent antigen retrieval. Briefly, the prepared samples were permeabilized with 0.5% Triton X-100 for 10 min at room temperature, and blocked with 5% bovine serum albumin (BSA) for 1 h. Subsequently, they were incubated overnight at 4 °C with the following primary antibodies: anti-Iba-1 (1:300, catalog no. YM4765, Immunoway, Jiangsu, China), anti-CD86 (1:100, catalog no. YT7823, Immunoway, Jiangsu, China), and anti-CD206 (1:100, catalog no. YT5640, Immunoway, Jiangsu, China). After washing with PBST, the samples were incubated with fluorophore-conjugated secondary antibodies for 2 h, followed by nuclear staining with DAPI in the dark for 5 min. Immunofluorescence images were captured using a fluorescence microscope (Olympus IX-81/FV1000, Japan) and analyzed with ImageJ software. The whole-slide imaging was performed using CaseViewer 2.4.
2.8 Quantitative RT-PCR (RT-qPCR)
Total RNA extracted with TRIzol from brain tissues or treated cells. Then, complementary DNA (cDNA) was synthesized from the extracted RNA using the Revert Aid First Strand cDNA Synthesis Kit (Thermo Fisher Scientific, San Jose, CA, United States). Quantitative PCR (qPCR) was performed on a LightCycler 96 system with SYBR Green master mix (Qiagen, Germany) GAPDH was used as the endogenous control, and relative expression of target genes (TNF-α and IL-10) was determined via the 2−ΔΔCT method. The primer sequences are provided in Table 1.

Table 1. Sequences of PCR primers.
2.9 Cell culture
BV2 cells were obtained from the Cell Bank of the Chinese Academy of Sciences (Shanghai, China). The cells were routinely cultured in high-glucose Dulbecco’s Modified Eagle Medium (DMEM) supplemented with 10% fetal bovine serum (FBS) and 1% penicillin-streptomycin, and maintained at 37 °C in a humidified atmosphere of 5% CO2. All experiments were performed using cells in the logarithmic growth phase.
2.10 Cell viability
BV2 cells (1 × 10⁴/well) were seeded in 96-well plates and allowed to adhere for 24 h. To assess the effect of S-GLSP on cell viability, the cells were treated with a range of S-GLSP concentrations (0–175 μg/mL) for 24 h. In a separate experiment designed to evaluate the protective effect of S-GLSP against LPS-induced toxicity, cells were pretreated with S-GLSP (25, 50, 75 μg/mL) for 4 h, after which all groups except the control (CTRL) were exposed to 1 μg/mL LPS for an additional 24 h. Following the respective treatments, 20 μL of MTT solution (5 mg/mL, Solarbio, M1020) was added to each well, and the plates were incubated at 37 °C for 4 h. The medium was then carefully aspirated, and the resulting formazan crystals were dissolved in 150 μL of dimethyl sulfoxide (DMSO). Absorbance was measured at 490 nm using a microplate reader (Peiou, Shanghai, China).
2.11 Transfection
BV2 cells were transfected with 50 nM NLRP3 siRNA (Hanheng Biotechnology Co., Wuhan, China) using Lipofectamine™ 2000 (Thermo Fisher Scientific, 11668019) for 6 h prior to drug treatment. A non-targeting siRNA (NC) was used as negative control. Following transfection, the cells were divided into six experimental groups: CTRL, LPS, LPS + S-GLSP, LPS + NC, LPS + si-NLRP3, and LPS + si-NLRP3 + S-GLSP for subsequent investigations.
2.12 EdU staining
Cell proliferation was assessed using the EdU Cell Proliferation Detection Kit (Sangon Biotech, Shanghai, China) according to the manufacturer’s protocol. After the staining procedure, fluorescence images were acquired, and the EdU-positive cell ratio was quantified using ImageJ software for subsequent statistical analysis.
2.13 Statistical analysis
All data were analyzed with SPSS 26.0 and are expressed as the mean ± standard error of the mean (SEM). Differences among groups were evaluated by one-way analysis of variance (ANOVA), followed by Dunnett’s post hoc test. In cases where the assumption of homogeneity of variance was met, the least significant difference (LSD) test was applied. A P-value of less than 0.05 was considered statistically significant.
3 Results
3.1 The main chemical compounds of S-GLSP extract
UHPLC analysis was employed to characterize the chemical profile of the S-GLSP extract. As shown in the total ion chromatogram (TIC) in positive ion mode (Figure 2), a total of 42 compounds were identified, which were classified into flavonoids, alkaloids, terpenoids, saccharides, phenolics, fatty acids, nucleosides, amino acids, and other compound classes (Table 2).

Figure 2. Total ion diagram of S-GLSP extract in positive and negative ion mode. (A) NEG; (B) POS.

Table 2. Chemical compounds analysis of S-GLSP extract by UHPLC.
3.2 Neuroprotective effect of S-GLSP in Alzheimer’s disease rats
Behavioral assessments demonstrated that S-GLSP treatment at 720 mg/kg significantly improved cognitive performance in AD model rats. In the Morris water maze test, S-GLSP markedly shortened escape latency and increased the number of platform crossings (Figures 3A–C). Furthermore, the five-day learning curves revealed a substantial improvement in learning ability in the S-GLSP-H and DP groups compared to the Model group. Consistently, in the Y-maze test, S-GLSP significantly prolonged the time spent in the novel arm (Figures 3D,E). Based on these results, the 720 mg/kg dose was selected for subsequent mechanistic studies.

Figure 3. S-GLSP ameliorates neuronal damage and Alzheimer’s disease-specific pathology in AD model rats. (n = 10). (A) The swimming trajectory map on the fifth day of the MWM test. (B) The escape latency to find the hidden platform of the Morris water maze test (days 1–5). (C) The number of platform crossings of the Morris water maze test. (D) The motion trajectory diagram of the Y-maze test. (E) The time spent in the novel arm in Y-maze test. (F) H&E staining of hippocampal CA1 region (scale bar = 50 μm). (G–H) The protein levels of p-tau in the brain lysates were assessed by WB. Data are shown as the mean ± SEM. *P < 0.01 vs. CTRL; #P < 0.05, ##P < 0.01 vs. Model.
To evaluate both general neuronal morphology and specific Alzheimer’s disease pathology, we performed H&E staining and assessed the levels of hyperphosphorylated tau (p-tau), a core pathological protein in AD. Histopathological evaluation by H&E staining revealed severe neuronal damage in the hippocampus of model group rats, including disordered arrangement, cell loss, and structural disintegration. In contrast, S-GLSP treatment notably ameliorated these pathological changes, yielding a neuronal morphology comparable to the donepezil-treated group (Figure 3F). Given that hyperphosphorylation of tau protein is a hallmark neuropathological feature of AD (Azarpazhooh et al., 2020), we further examined the effect of S-GLSP on tau phosphorylation. Western blot analysis confirmed that S-GLSP significantly suppressed the expression of phosphorylated tau (p-tau) (Figures 3G,H), indicating its ability to modulate a key AD-related pathogenic process. We all know that the overexpression of phosphorylated tau (p-tau) protein, which forms neurofibrillary tangles, is one of the pathological hallmarks of AD (Azarpazhooh et al., 2020). Therefore, the ability to inhibit tau protein hyperphosphorylation is a key criterion for evaluating potential AD drug treatments. In our experiments, treatment with S-GLSP notably ameliorated both the structural neuronal damage observed by H&E staining and the aberrant p-tau accumulation, indicating its dual protective role against both general neurotoxicity and specific AD-related pathogenic processes.
3.3 Effect of S-GLSP on microglial polarization in Alzheimer’s disease rats
Microglial overactivation contributes to sustained neuroinflammation, which in turn accelerates Alzheimer’s disease progression (Villegas-Llerena et al., 2016). Specifically, excessive polarization toward the M1 phenotype promotes neuronal injury and degeneration (Subhramanyam et al., 2019), whereas M2 microglia exert neuroprotective effects by clearing pathogenic debris and releasing anti-inflammatory and neurotrophic mediators (Ginhoux et al., 2010; Colonna and Butovsky, 2017). In this study, immunofluorescence analysis revealed that S-GLSP (720 mg/kg) significantly decreased the density of M1 microglia (CD86+/Iba-1+) while increasing that of M2 microglia (CD206+/Iba-1+) (Figures 4A–D). Consistent with these findings, Western blot results showed that S-GLSP downregulated the M1 marker iNOS and upregulated the M2 marker Arg-1 (Figures 4G–I). Further support came from RT-qPCR analysis, which indicated that S-GLSP enhanced mRNA expression of the anti-inflammatory cytokine IL-10 and suppressed that of the pro-inflammatory cytokine TNF-α (Figures 4E,F).

Figure 4. S-GLSP promotes microglial polarization from M1 to M2 phenotype in AD rats. (n = 3). (A,B) Representative immunofluorescence images showing colocalization of Iba-1 (red) with CD86 (green, M1 marker) or CD206 (green, M2 marker). (scale bar = 50 μm). (C,D) Quantification analysis of CD86+/Iba-1+ and CD206+/Iba-1+ colabeled cells across different groups. (E,F) The mRNA levels of TNF-α (M1 marker) and IL-10 (M2 marker). (G–I) The protein levels of iNOS and Arg-1. Data are shown as the mean ± SEM. *P < 0.01 vs. CTRL; #P < 0.05, ##P < 0.01 vs. Model.
3.4 Effect of S-GLSP on NLRP3 inflammasome activation in AD rats
The NLRP3 inflammasome plays a pivotal role in Alzheimer’s disease by regulating neuroinflammatory responses (Feng et al., 2020; Jha et al., 2024). Its activation in microglia can be triggered by aggregated Aβ oligomers and fibrils, which act as damage-associated molecular patterns (DAMPs) (Ayyubova and Madhu, 2025). Consistent with these findings, our Western blot analysis showed that the protein levels of NLRP3, ASC, and cleaved-caspase-1 were significantly increased in the brains of AD model rats (Figures 5A–F). This inflammasome activation was accompanied by elevated expression of the downstream inflammatory cytokines IL-1β and IL-18 (Figures 5G–J). Notably, treatment with S-GLSP significantly suppressed the upregulation of these inflammasome-related proteins and cytokines (Figures 5A–J).
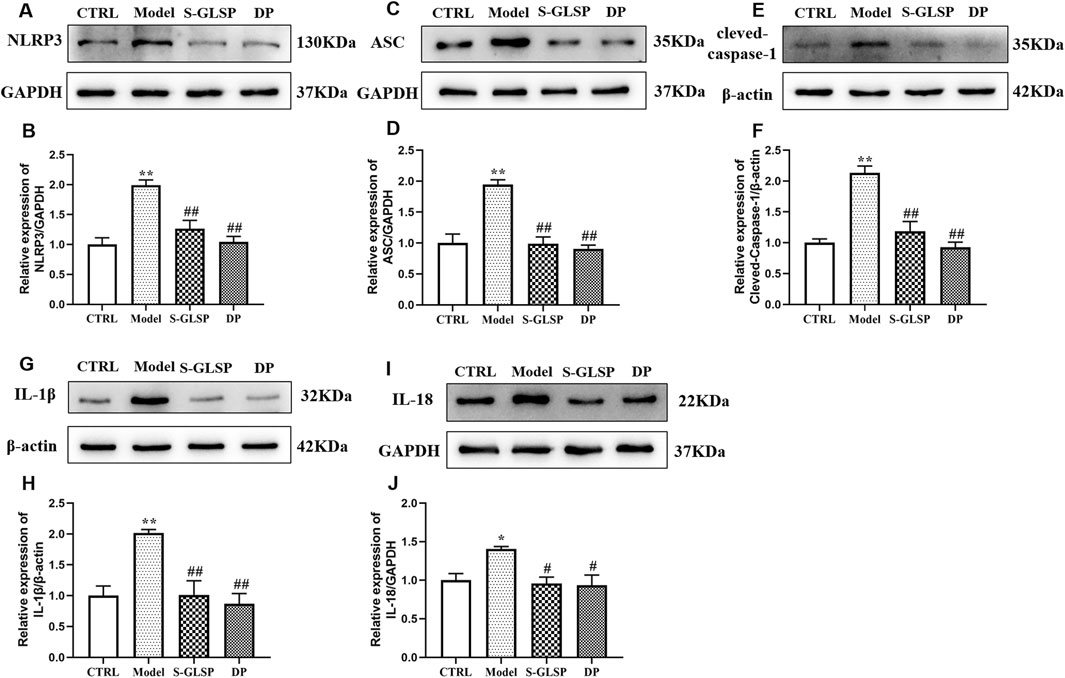
Figure 5. S-GLSP suppresses NLRP3 inflammasome activation in AD rats. (n = 3). (A–J) The Protein levels of NLRP3, ASC, cleved-caspase-1, IL-1β and IL-18. Data are shown as the mean ± SEM. *P < 0.01 vs. CTRL; #P < 0.05, ##P < 0.01 vs. Model.
3.5 Effect of S-GLSP on LPS-induced BV-2 microglial cells
Based on this, the safe concentration range was determined to be 25–75 μg/mL. In LPS-stimulated BV-2 cells, viability was significantly reduced; however, pretreatment with S-GLSP (25, 50, and 75 μg/mL) attenuated this decrease in a concentration-dependent manner, with the most pronounced effect observed at 50 μg/mL (Figure 6B). This concentration was therefore selected for subsequent experiments.

Figure 6. S-GLSP protects against LPS-induced injury in BV2 microglial cells. (n = 3). (A) Cell viability after 24 h treatment with different concentrations of S-GLSP. (B) Cell viability following S-GLSP pretreatment and subsequent LPS challenge. (C) NLRP3 mRNA expression after siRNA transfection. (D,E) Cell proliferation assessed by EdU staining. Data are shown as the mean ± SEM. *P < 0.01 vs. CTRL; #P < 0.05, ##P < 0.01 vs. Model.
To explore the role of NLRP3 in the anti-AD mechanism of S-GLSP, we performed NLRP3 knockdown in BV-2 cells. Among three siRNA constructs, si-NLRP3-3 achieved the highest knockdown efficiency and was used in further studies (Figure 6C). EdU staining revealed that LPS suppressed BV-2 cell proliferation, an effect that was reversed by either NLRP3 silencing or S-GLSP treatment. Furthermore, the combination of NLRP3 knockdown and S-GLSP treatment showed an additive, but not statistically synergistic, trend towards further enhancing cell proliferation compared to either intervention alone (Figures 6D,E).
3.6 Effect of S-GLSP on LPS-induced microglial polarization in BV-2 cells
Immunofluorescence and Western blot analyses demonstrated that LPS stimulation significantly promoted microglial polarization toward the M1 phenotype, as evidenced by increased expression of M1 markers and decreased expression of M2 markers (Figures 7A–D,G-I). Both NLRP3 knockdown and S-GLSP treatment effectively reversed this LPS-induced polarization shift. Moreover, the combination of NLRP3 silencing and S-GLSP treatment produced a synergistic effect, more potently restoring the M1/M2 balance (Figures 7A–D,G-I).

Figure 7. S-GLSP promotes M2 microglial polarization in LPS-induced BV2 cells. (n = 6). (A,B) Representative immunofluorescence images showing Iba-1 (red) colocalized with CD86 (green) or CD206 (green). (Scale bar = 25 μm). (C,D) Quantification of CD86+ and CD206+ colabeled cells across different groups. (E,F) The mRNA levels of TNF-α and IL-10 in LPS-induced BV2 cells. (G–I) The protein levels of iNOS and Arg-1in LPS-induced BV2 cells. Data are shown as the mean ± SEM. *P < 0.01 vs. CTRL; #P < 0.05, ##P < 0.01 vs. Model.
Consistent with these findings, RT-qPCR analysis revealed that LPS stimulation significantly upregulated TNF-α mRNA expression and downregulated IL-10 expression. NLRP3 knockdown and S-GLSP treatment each attenuated these changes, while their combination resulted in a more pronounced anti-inflammatory response (Figures 7E,F).
3.7 Effect of S-GLSP on NLRP3 inflammasome activation in LPS-induced BV-2 cells
Western blot analysis demonstrated that LPS stimulation significantly upregulated the expression of NLRP3 inflammasome compounds, including NLRP3, ASC, and cleaved-caspase-1, in BV-2 cells (Figures 8A–F). Consistent with inflammasome activation, the levels of the downstream inflammatory cytokines IL-1β and IL-18 were also elevated (Figures 8G–J). Both NLRP3 knockdown and S-GLSP treatment effectively suppressed these changes, and their combination resulted in a synergistic inhibition of the NLRP3 inflammasome pathway.

Figure 8. S-GLSP inhibits NLRP3 inflammasome activation in LPS-induced BV2 cells. (n = 3). (A–L) The Protein levels of NLRP3, ASC, cleved-caspase-1, IL-1β, IL-18 and p-tau. Data are shown as the mean ± SEM. *P < 0.01 vs. CTRL; #P < 0.05, ##P < 0.01 vs. Model.
To further evaluate the functional relevance of these findings, we examined neuronal tau pathology in HT-22 cells following co-culture with the treated BV-2 cells. Western blot analysis revealed that S-GLSP significantly reduced the expression of phosphorylated tau (p-tau) in HT-22 cells exposed to conditioned media from LPS-stimulated BV-2 cells (Figures 8K,L). This protective effect suggests that S-GLSP mitigates tau hyperphosphorylation through mechanisms involving the suppression of NLRP3 inflammasome activation, regulation of microglial polarization, and inhibition of pro-inflammatory cytokine release.
4 Discussion
The principal finding of this study is that S-GLSP confers remarkable protection against neuroinflammation in Alzheimer’s disease models by modulating microglial polarization from a detrimental M1 state towards a protective M2 state. Crucially, we have identified that the underlying mechanism involves the suppression of the NLRP3 inflammasome pathway, a key driver of neuroinflammatory processes. These results not only underscore the therapeutic potential of S-GLSP for AD but also provide a mechanistic elucidation for its traditional use in promoting neurological health.
Alzheimer’s disease (AD) pathogenesis involves a complex interplay of pathological mechanisms, with neuroinflammation increasingly recognized as a critical driver of disease progression. Elevated levels of neuroinflammatory mediators have been consistently detected in the cerebrospinal fluid, blood, and cerebral cortex of AD patients (Swardfager et al., 2010; Leng and Edison, 2021). Central to this neuroinflammatory process are microglia, the resident immune cells of the central nervous system that maintain brain homeostasis through inflammation regulation, phagocytic clearance, and neural support (Singh, 2022; Gao et al., 2023). In response to pathological stimuli such as amyloid-beta (Aβ) and neurofibrillary tangles (NFTs) accumulation, microglia undergo activation and polarize into distinct functional phenotypes (Kwon and Koh, 2020; Kulkarni et al., 2022; Botella Lucena and Heneka, 2024). The classical M1 phenotype exhibits neurotoxic properties through the release of pro-inflammatory cytokines including TNF-α, IL-1β, and IL-6, which accelerate neurodegenerative processes and contribute to neuronal damage (Ogunmokun et al., 2021; Kulkarni et al., 2022). Conversely, the alternative M2 phenotype demonstrates neuroprotective effects by secreting anti-inflammatory factors such as IL-4, IL-10, and TGF-β, which help regulate immune responses and promote tissue repair (Jiang et al., 2021). Repolarization of microglia from the M1 to the M2 phenotype has emerged as a promising therapeutic strategy for Alzheimer’s disease. In AD, the anti-inflammatory M2 phenotype is often compromised, leading to a polarization imbalance that exacerbates neuroinflammation and neuronal injury (Zhou et al., 2020; Amanollahi et al., 2023). Supporting this concept, studies have demonstrated that promoting M2 polarization-for instance, through TLR4 inhibition in APP/PS1 mice-exerts neuroprotective effects and ameliorates cognitive deficits (Cui et al., 2020). More broadly, enhancing M2 microglial activity, whether by pharmacological or genetic approaches, has been shown to attenuate neuroinflammation, improve phagocytic clearance of plaques and tangles, and restore brain homeostasis (Merighi et al., 2022). In line with existing literature, our study confirmed that AD model rats exhibit a marked microglial polarization imbalance, characterized by an upregulation of M1 markers (CD86, iNOS) and a concomitant downregulation of M2 markers (CD206, Arg-1). This skewed polarization towards the M1 phenotype fosters a chronic inflammatory milieu, contributing to neuronal damage and the cognitive deficits observed in our models. Consistent with our other findings, further serological tests revealed a significant increase in the pro-inflammatory cytokine TNF-α and a concurrent decrease in the anti-inflammatory cytokine IL-10 in the serum of model group rats. The efficacy of S-GLSP in rectifying this imbalance-effectively promoting an M2-dominant anti-inflammatory profile. This finding is consistent with the growing therapeutic strategy of targeting microglial polarization to halt disease progression.
Ganoderma lucidum (Lingzhi) has been valued in traditional Chinese medicine for millennia due to its therapeutic properties. Ganoderma spores, regarded as the essence of the mushroom, contain its complete genetic material and are now widely used as a medicinal and nutraceutical product thanks to advances in spore wall-breaking technology (Shen et al., 2020). Chemical analyses have confirmed that S-GLSP contains a wide spectrum of bioactive compounds, including flavonoids, alkaloids, terpenoids, saccharides, phenolics, fatty acids, nucleosides, amino acids, and phenylpropanoids. These compounds contribute to its neuroprotective effects in AD through multiple pathways. For instance, Ganoderma triterpenoids have been shown to inhibit the ROCK signaling pathway, reducing neuronal damage and apoptosis in the hippocampus and improving cognitive deficits in APP/PS1 mice (Yu et al., 2020). Similarly, Ganoderic acid A (GAA) alleviates neuroinflammation and enhances cognitive function by modulating the Th17/Treg axis (Zhang et al., 2021), while Ganoderma lucidum polysaccharides suppress the secretion of pro-inflammatory mediators such as inducible nitric oxide synthase (iNOS), interleukin-6 (IL-6), and interleukin-1 beta (IL-1β), thereby attenuating microglia-mediated neuroinflammation (Cai et al., 2017; Liu et al., 2023; Chen et al., 2025). Collectively, these studies underscore the indisputable anti-inflammatory and neuroprotective properties of Ganoderma lucidum and its bioactive constituents (Cao et al., 2024). In line with these findings, the present study demonstrates that S-GLSP treatment significantly ameliorates learning and memory impairments in AD rats, supporting its potential as a therapeutic candidate for AD. This observation is consistent with a previous report that S-GLSP improves cognitive function in a rat model of sporadic AD by inhibiting the NF-κB/NLRP3 inflammatory pathway in the medial prefrontal cortex (Qin et al., 2024). Moreover, our in vitro and in vivo experiments revealed that S-GLSP not only mitigates neuronal injury but also promotes the transition of microglia from the pro-inflammatory M1 phenotype to the anti-inflammatory M2 phenotype, providing mechanistic insight into its protective role in AD.
Furthermore, our results indicate that S-GLSP significantly suppresses both NLRP3 inflammasome expression and the secretion of its downstream inflammatory cytokines, IL-1β and IL-18. The NLRP3 inflammasome, a multiprotein complex comprising NLRP3, ASC, and pro-caspase-1 (Abderrazak et al., 2015), is abundantly expressed in the central nervous system, particularly in microglia. Upon activation, it triggers the cleavage of pro-caspase-1 into its active form, caspase-1, which subsequently processes pro-IL-1β and pro-IL-18 into their mature forms, driving neuroinflammatory responses (Tschopp and Schroder, 2010; Heneka et al., 2018; Van Zeller et al., 2021). Evidence from neuropathological examinations and transgenic models underscores the pivotal role of NLRP3 in AD progression, facilitating the accumulation of β-amyloid and tau pathology (Pereira et al., 2019). Importantly, the release of IL-1β and IL-18 reinforces microglial activation toward the pro-inflammatory M1 phenotype, creating a feed-forward cycle of inflammation. In this study, we demonstrated that S-GLSP effectively disrupts this cascade by inhibiting NLRP3 inflammasome activation and modulating microglial polarization, as confirmed in both in vitro and in vivo experiments. Notably, we utilized a high-dose LPS stimulation paradigm in BV2 microglia, which resulted in the full activation of the NLRP3 inflammasome, as evidenced by the cleavage of caspase-1 and the maturation of IL-1β and IL-18. While this deviates from the canonical two-signal model often observed in other cell types, it is consistent with reports of signal integration in microglia under potent inflammatory stress (Yang et al., 2023; Gu et al., 2024). This context underscores the significance of our finding that S-GLSP effectively disrupts this complete activation cascade.
In conclusion, our study provides compelling evidence that S-GLSP is a promising natural product for mitigating AD-related neuroinflammation. We have mechanistically linked its therapeutic effects to the inhibition of the NLRP3 inflammasome, which in turn rebalances microglial polarization, thereby creating a neuroprotective environment. A detailed diagram of this mechanism is shown in Figure 9. These findings scientifically validate the potential of S-GLSP as a viable candidate for developing innovative AD therapeutics. Future research should focus on isolating the most active anti-inflammatory fractions within S-GLSP and validating these effects in advanced models and, ultimately, in clinical trials.

Figure 9. Proposed mechanism: S-GLSP promotes M2 microglial polarization by regulating NLRP3 inflammasome activation.
Data availability statement
The original contributions presented in the study are included in the article/Supplementary Material, further inquiries can be directed to the corresponding authors.
Ethics statement
Ethical approval was not required for the studies on humans in accordance with the local legislation and institutional requirements because only commercially available established cell lines were used. The animal study was approved by the Experimental Animal Ethics Committee of Anhui University of Chinese Medicine. The study was conducted in accordance with the local legislation and institutional requirements.
Author contributions
WL: Investigation, Writing – original draft. WH: Investigation, Methodology, Writing – original draft. PZ: Supervision, Writing – review and editing. YY: Resources, Supervision, Writing – review and editing. BC: Funding acquisition, Resources, Writing – review and editing. SY: Funding acquisition, Project administration, Writing – review and editing.
Funding
The authors declare that financial support was received for the research and/or publication of this article. This work was supported by the National Natural Science Foundation of China (82205235 and 82374553); The Cultivation Program for Outstanding and Top Talents in Anhui Universities (gxbjZD2022024); The Key Project Foundation of Natural Science Research of Anhui University of Chinese Medicine (2022AH050502); Anhui Province 2024 Action Project for Training Young and Middle aged Teachers in Universities (YQYB2024028).
Conflict of interest
The authors declare that the research was conducted in the absence of any commercial or financial relationships that could be construed as a potential conflict of interest.
Generative AI statement
The authors declare that no Generative AI was used in the creation of this manuscript.
Any alternative text (alt text) provided alongside figures in this article has been generated by Frontiers with the support of artificial intelligence and reasonable efforts have been made to ensure accuracy, including review by the authors wherever possible. If you identify any issues, please contact us.
Publisher’s note
All claims expressed in this article are solely those of the authors and do not necessarily represent those of their affiliated organizations, or those of the publisher, the editors and the reviewers. Any product that may be evaluated in this article, or claim that may be made by its manufacturer, is not guaranteed or endorsed by the publisher.
Supplementary material
The Supplementary Material for this article can be found online at: https://www.frontiersin.org/articles/10.3389/fphar.2025.1690192/full#supplementary-material
References
Abderrazak, A., Syrovets, T., Couchie, D., El Hadri, K., Friguet, B., Simmet, T., et al. (2015). NLRP3 inflammasome: from a danger signal sensor to a regulatory node of oxidative stress and inflammatory diseases. Redox Biol. 4, 296–307. doi:10.1016/j.redox.2015.01.008
Amanollahi, M., Jameie, M., Heidari, A., and Rezaei, N. (2023). The dialogue between neuroinflammation and adult neurogenesis: mechanisms involved and alterations in neurological diseases. Mol. Neurobiol. 60 (2), 923–959. doi:10.1007/s12035-022-03102-z
Ayyubova, G., and Madhu, L. N. (2025). Microglial NLRP3 inflammasomes in Alzheimer's disease pathogenesis: from interaction with autophagy/mitophagy to therapeutics. Mol. Neurobiol. 62 (6), 7124–7143. doi:10.1007/s12035-025-04758-z
Azarpazhooh, M. R., Avan, A., Cipriano, L. E., Munoz, D. G., Erfanian, M., Amiri, A., et al. (2020). A third of community-dwelling elderly with intermediate and high level of Alzheimer's neuropathologic changes are not demented: a meta-analysis. Ageing Res. Rev. 58, 101002. doi:10.1016/j.arr.2019.101002
Botella Lucena, P., and Heneka, M. T. (2024). Inflammatory aspects of Alzheimer's disease. Acta Neuropathol. 148 (1), 31. doi:10.1007/s00401-024-02790-2
Boutron, I., Percie du Sert, N., Ahluwalia, A., Alam, S., Avey, M. T., Baker, M., et al. (2020). Reporting animal research: explanation and elaboration for the ARRIVE guidelines 2.0. PLOS Biol. 18 (7), e3000411. doi:10.1371/journal.pbio.3000411
Cai, Q., Li, Y., and Pei, G. (2017). Polysaccharides from Ganoderma lucidum attenuate microglia-mediated neuroinflammation and modulate microglial phagocytosis and behavioural response. J. Neuroinflammation 14 (1), 63. doi:10.1186/s12974-017-0839-0
Cao, C., Liao, Y., Yu, Q., Zhang, D., Huang, J., Su, Y., et al. (2024). Structural characterization of a galactoglucomannan with anti-neuroinflammatory activity from Ganoderma lucidum. Carbohydr. Polym. 334, 122030. doi:10.1016/j.carbpol.2024.122030
Chen, X. J., Deng, Z., Zhang, L. L., Pan, Y., Fu, J., Zou, L., et al. (2024). Therapeutic potential of the medicinal mushroom Ganoderma lucidum against Alzheimer's disease. Biomed. Pharmacother. 172, 116222. doi:10.1016/j.biopha.2024.116222
Chen, L., Wang, X., Sun, J., Xue, J., Yang, X., and Zhang, Y. (2025). Structural characteristics of a heteropolysaccharide from Ganoderma lucidum and its protective effect against Alzheimer's disease via modulating the microbiota-gut-metabolomics. Int. J. Biol. Macromol. 297, 139863. doi:10.1016/j.ijbiomac.2025.139863
Colonna, M., and Butovsky, O. (2017). Microglia function in the central nervous system during health and neurodegeneration. Annu. Rev. Immunol. 35 (1), 441–468. doi:10.1146/annurev-immunol-051116-052358
Cui, W., Sun, C., Ma, Y., Wang, S., Wang, X., and Zhang, Y. (2020). Inhibition of TLR4 induces M2 microglial polarization and provides neuroprotection via the NLRP3 inflammasome in Alzheimer's Disease. Front. Neurosci. 14, 444. doi:10.3389/fnins.2020.00444
Felsky, D., Roostaei, T., Nho, K., Risacher, S. L., Bradshaw, E. M., Petyuk, V., et al. (2019). Neuropathological correlates and genetic architecture of microglial activation in elderly human brain. Nat. Commun. 10 (1), 409. doi:10.1038/s41467-018-08279-3
Feng, Y. S., Tan, Z. X., Wu, L. Y., Dong, F., and Zhang, F. (2020). The involvement of NLRP3 inflammasome in the treatment of Alzheimer's disease. Ageing Res. Rev. 64, 101192. doi:10.1016/j.arr.2020.101192
Fu, J., and Wu, H. (2023). Structural mechanisms of NLRP3 inflammasome assembly and activation. Annu. Rev. Immunol. 41, 301–316. doi:10.1146/annurev-immunol-081022-021207
Gao, C., Jiang, J., Tan, Y., and Chen, S. (2023). Microglia in neurodegenerative diseases: mechanism and potential therapeutic targets. Signal Transduct. Target. Ther. 8 (1), 359. doi:10.1038/s41392-023-01588-0
Ginhoux, F., Greter, M., Leboeuf, M., Nandi, S., See, P., Gokhan, S., et al. (2010). Fate mapping analysis reveals that adult microglia derive from primitive macrophages. Science 330 (6005), 841–845. doi:10.1126/science.1194637
Gu, Y., Hu, Z.-F., Zheng, D.-W., Yang, Y.-Q., Dong, X.-L., and Chen, W.-F. (2024). Baohuoside I suppresses the NLRP3 inflammasome activation via targeting GPER to fight against Parkinson's disease. Phytomedicine 126, 155435. doi:10.1016/j.phymed.2024.155435
Heneka, M. T., Kummer, M. P., Stutz, A., Delekate, A., Schwartz, S., Vieira-Saecker, A., et al. (2013). NLRP3 is activated in Alzheimer's disease and contributes to pathology in APP/PS1 mice. Nature 493 (7434), 674–678. doi:10.1038/nature11729
Heneka, M. T., McManus, R. M., and Latz, E. (2018). Inflammasome signalling in brain function and neurodegenerative disease. Nat. Rev. Neurosci. 19 (10), 610–621. doi:10.1038/s41583-018-0055-7
Huang, W., Chen, Q., Zhou, P., Ye, S., and Fang, Z. (2024). Neuroprotective effect of chrysophanol in Alzheimer disease via modulating the Ca2+/EGFR-PLCγ pathway. Neurosci. Lett. 824, 137684. doi:10.1016/j.neulet.2024.137684
Ising, C., Venegas, C., Zhang, S., Scheiblich, H., Schmidt, S. V., Vieira-Saecker, A., et al. (2019). NLRP3 inflammasome activation drives tau pathology. Nature 575 (7784), 669–673. doi:10.1038/s41586-019-1769-z
Jha, D., Bakker, E., and Kumar, R. (2024). Mechanistic and therapeutic role of NLRP3 inflammasome in the pathogenesis of Alzheimer's disease. J. Neurochem. 168 (10), 3574–3598. doi:10.1111/jnc.15788
Jiang, Q., Wei, D., He, X., Gan, C., Long, X., and Zhang, H. (2021). Phillyrin prevents neuroinflammation-induced blood-brain barrier damage following traumatic brain injury via altering microglial polarization. Front. Pharmacol. 12, 719823. doi:10.3389/fphar.2021.719823
Knopman, D. S., Amieva, H., Petersen, R. C., Chetelat, G., Holtzman, D. M., Hyman, B. T., et al. (2021). Alzheimer disease. Nat. Rev. Dis. Prim. 7 (1), 33. doi:10.1038/s41572-021-00269-y
Kulkarni, B., Cruz-Martins, N., and Kumar, D. (2022). Microglia in Alzheimer's disease: an unprecedented opportunity as prospective drug target. Mol. Neurobiol. 59 (5), 2678–2693. doi:10.1007/s12035-021-02661-x
Kwon, H. S., and Koh, S. H. (2020). Neuroinflammation in neurodegenerative disorders: the roles of microglia and astrocytes. Transl. Neurodegener. 9 (1), 42. doi:10.1186/s40035-020-00221-2
Leng, F., and Edison, P. (2021). Neuroinflammation and microglial activation in Alzheimer disease: where do we go from here? Nat. Rev. Neurol. 17 (3), 157–172. doi:10.1038/s41582-020-00435-y
Li, Z., and Gong, C. (2025). NLRP3 inflammasome in Alzheimer's disease: molecular mechanisms and emerging therapies. Front. Immunol. 16, 1583886. doi:10.3389/fimmu.2025.1583886
Liu, X., Yang, L., Li, G., Jiang, Y., Zhang, G., and Ling, J. (2023). A novel promising neuroprotective agent: Ganoderma lucidum polysaccharide. Int. J. Biol. Macromol. 229, 168–180. doi:10.1016/j.ijbiomac.2022.12.276
Merighi, S., Nigro, M., Travagli, A., and Gessi, S. (2022). Microglia and Alzheimer's disease. Int. J. Mol. Sci. 23 (21), 12990. doi:10.3390/ijms232112990
Ogunmokun, G., Dewanjee, S., Chakraborty, P., Valupadas, C., Chaudhary, A., Kolli, V., et al. (2021). The potential role of cytokines and growth factors in the pathogenesis of Alzheimer's disease. Cells 10 (10), 2790. doi:10.3390/cells10102790
Pereira, C. F., Santos, A. E., Moreira, P. I., Pereira, A. C., Sousa, F. J., Cardoso, S. M., et al. (2019). Is Alzheimer's disease an inflammasomopathy? Ageing Res. Rev. 56, 100966. doi:10.1016/j.arr.2019.100966
Qin, Y., Zhao, Y., Hu, X., Chen, X., Jiang, Y. P., Jin, X. J., et al. (2024). Ganoderma lucidum spore extract improves sleep disturbances in a rat model of sporadic Alzheimer's disease. Front. Pharmacol. 15, 1390294. doi:10.3389/fphar.2024.1390294
Shen, S. F., Zhu, L. F., Wu, Z., Wang, G., Ahmad, Z., and Chang, M. W. (2020). Extraction of triterpenoid compounds from Ganoderma lucidum spore powder through a dual-mode sonication process. Drug Dev. Ind. Pharm. 46 (6), 963–974. doi:10.1080/03639045.2020.1764022
Singh, D. (2022). Astrocytic and microglial cells as the modulators of neuroinflammation in Alzheimer's disease. J. Neuroinflammation 19 (1), 206. doi:10.1186/s12974-022-02565-0
Soccol, C. R., Bissoqui, L. Y., Rodrigues, C., Rubel, R., Sella, S. R., Leifa, F., et al. (2016). Pharmacological properties of biocompounds from spores of the lingzhi or reishi medicinal mushroom Ganoderma lucidum (Agaricomycetes): a review. Int. J. Med. Mushrooms 18 (9), 757–767. doi:10.1615/IntJMedMushrooms.v18.i9.10
Subhramanyam, C. S., Wang, C., Hu, Q., and Dheen, S. T. (2019). Microglia-mediated neuroinflammation in neurodegenerative diseases. Semin. Cell Dev. Biol. 94, 112–120. doi:10.1016/j.semcdb.2019.05.004
Swardfager, W., Lanctot, K., Rothenburg, L., Wong, A., Cappell, J., and Herrmann, N. (2010). A meta-analysis of cytokines in Alzheimer's disease. Biol. Psychiatry 68 (10), 930–941. doi:10.1016/j.biopsych.2010.06.012
The State Pharmacopoeia Commission of the People’s Republic of China, (2020). Pharmacopoeia of the People’s Republic of China. Beijing: China Medical Science Press.
Tschopp, J., and Schroder, K. (2010). NLRP3 inflammasome activation: the convergence of multiple signalling pathways on ROS production? Nat. Rev. Immunol. 10 (3), 210–215. doi:10.1038/nri2725
Van Zeller, M., Dias, D., Sebastiao, A. M., and Valente, C. A. (2021). NLRP3 inflammasome: a starring role in Amyloid-beta- and tau-driven pathological events in Alzheimer's disease. J. Alzheimers Dis. 83 (3), 939–961. doi:10.3233/JAD-210268
Villegas-Llerena, C., Phillips, A., Garcia-Reitboeck, P., Hardy, J., and Pocock, J. M. (2016). Microglial genes regulating neuroinflammation in the progression of Alzheimer's disease. Curr. Opin. Neurobiol. 36, 74–81. doi:10.1016/j.conb.2015.10.004
Yan, H., Wang, W., Cui, T., Shao, Y., Li, M., Fang, L., et al. (2024). Advances in the understanding of the correlation between neuroinflammation and microglia in alzheimer’s disease. Immunotargets Ther. 13, 287–304. doi:10.2147/itt.S455881
Yang, Z., Liu, Y., Chen, X., Huang, S., Li, Y., Ye, G., et al. (2023). Empagliflozin targets Mfn1 and Opa1 to attenuate microglia-mediated neuroinflammation in retinal ischemia and reperfusion injury. J. Neuroinflammation 20 (1), 296. doi:10.1186/s12974-023-02982-9
Yu, N., Huang, Y., Jiang, Y., Zou, L., Liu, X., Liu, S., et al. (2020). Ganoderma lucidum triterpenoids (GLTs) reduce neuronal apoptosis via inhibition of ROCK signal pathway in APP/PS1 transgenic Alzheimer's disease mice. Oxid. Med. Cell. Longev. 2020, 9894037. doi:10.1155/2020/9894037
Zhang, Y., Wang, X., Yang, X., Yang, X., Xue, J., and Yang, Y. (2021). Ganoderic acid A to alleviate neuroinflammation of Alzheimer's disease in mice by regulating the imbalance of the Th17/Tregs axis. J. Agric. Food Chem. 69 (47), 14204–14214. doi:10.1021/acs.jafc.1c06304
Zhang, J., Cui, X., Luo, W., Li, S., Beng, S., Wang, W., et al. (2024). The qualitative and quantitative analysis of Ganoderma lucidum spore powder chemical compounds as p38 MAPK inhibitors by the generation and verification of pharmacophore modelling. Lwt 194, 115817. doi:10.1016/j.lwt.2024.115817
Zhao, H. L., Cui, S. Y., Qin, Y., Liu, Y. T., Cui, X. Y., Hu, X., et al. (2021). Prophylactic effects of sporoderm-removed Ganoderma lucidum spores in a rat model of streptozotocin-induced sporadic Alzheimer's disease. J. Ethnopharmacol. 269, 113725. doi:10.1016/j.jep.2020.113725
Keywords: sporoderm-removed ganoderma lucidum spore powder, Alzheimer’s disease, microglial polarization, neuroinflammation, NLRP3 inflammasome
Citation: Li W, Huang W, Zhou P, Yao Y, Cai B and Ye S (2025) Sporoderm-removed ganoderma lucidum spore powder (S-GLSP) alleviates neuroinflammation injury by regulating microglial polarization through inhibition of NLRP3 inflammasome activation. Front. Pharmacol. 16:1690192. doi: 10.3389/fphar.2025.1690192
Received: 05 September 2025; Accepted: 12 November 2025;
Published: 25 November 2025.
Edited by:
Vincent Kam Wai Wong, Macau University of Science and Technology, ChinaReviewed by:
Cristiane Socorro Ferraz Maia, Federal University of Pará, BrazilXia Lijuan, Zhejiang Medical College, China
Copyright © 2025 Li, Huang, Zhou, Yao, Cai and Ye. This is an open-access article distributed under the terms of the Creative Commons Attribution License (CC BY). The use, distribution or reproduction in other forums is permitted, provided the original author(s) and the copyright owner(s) are credited and that the original publication in this journal is cited, in accordance with accepted academic practice. No use, distribution or reproduction is permitted which does not comply with these terms.
*Correspondence: Shu Ye, eWVzaHVAYWh0Y20uZWR1LmNu; Biao Cai, Y2FpYmlhb0BhaHRjbS5lZHUuY24=
†These authors have contributed equally to this work