Abstract
Background:
Pharmacogenomics is viewed as one route to understanding inter-individual variability in drug response. However, clinical uptake in psychiatry is slower than in other medical fields such as oncology, so assessing evidence for psychiatric genotype-drug pairs and understanding what influences the magnitude of these effects is essential.
Methods:
We performed a systematic search for studies investigating pharmacogenomic variation in the context of antipsychotic and antidepressant use. Outcomes varied, including those related to drug bioavailability (“proximal”) or side effects, symptom severity, and other treatment outcomes (“distal”). We performed a meta-analysis, moderated by outcome type, to quantify the average pharmacogenomic effect size across proximal and distal outcomes and assess whether they differ significantly from one another. We developed a Pharmacogenomic (PGx) Effect Size Explorer for Psychiatric Drugs dashboard that allows users to explore the dataset and perform simplified meta-analyses, power calculations, and Bayesian shrinkage analyses based on drugs, enzymes, and outcomes of interest (see: https://locksk.shinyapps.io/pgx-effect-sizes/).
Results:
We analysed 2,102 standardised mean differences (SMDs) from 184 studies, finding evidence that pharmacogenomic effect sizes for proximal outcomes were significantly larger than distal (Δβ = −0.203 [95% CI −0.288 to −0.118], p = 6 × 10⁻⁶). This trend was consistent across sub-groups restricted to the most common gene-drug pairings in the dataset. Power calculations for hypothetical future studies using two-sample t-tests showed that, to attain at least 80% statistical power, analyses of distal outcomes require a larger sample size than proximal outcomes.
Discussion:
We demonstrate that pharmacogenomic effect sizes are significantly larger for proximal outcomes related to pharmacokinetics than for distal outcomes related to efficacy and toxicity. Understanding how the biological mechanisms underlying different outcomes might impact pharmacogenomic effect sizes could help to inform participant recruitment for future psychiatric pharmacogenomic studies, alongside the development of pharmacogenomic guidelines for psychiatric medications.
1 Introduction
The effects of most drugs vary even when prescribed to individuals for the same indication. Moreover, real-world effectiveness often falls below the expectations set by clinical trials, an “efficacy-effectiveness gap” that pervades medicine (Eichler et al., 2011). Pharmacological effects can lead to huge benefits for some individuals, be barely noticeable for others, and for a few even cause a net negative impact through adverse drug reactions (ADRs). Problems with the external validity of randomised controlled trials, diverse healthcare and drug use practices, or patient-level variation in drug response are all likely contributors to the gap (Groenwold, 2021). In psychiatry, where “treatment resistant” symptoms affect a large proportion of patients (Howes et al., 2022), these issues have been systematically raised and examined. While there is limited evidence that common psychotropics or even psychotherapy interventions are less efficacious than drugs prescribed for non-psychiatric conditions (Leucht et al., 2012; Huhn et al., 2014), the development and refinement of psychiatric drugs is notoriously slow compared to other fields (Nutt, 2025), partly because many mechanisms of action involved in psychopharmacology and their precise effect on disease processes and neurobiology remain unclear (Huda, 2019; Howes et al., 2022).
Substantial efforts in psychiatric research are dedicated to more accurately predicting treatment response to current drugs, which could eventually lessen the efficacy-effectiveness gap (Dellen, 2024). One route to accomplishing this task is stratified medicine or “precision psychiatry”, which involves identifying patient subgroups with respect to their characteristics or response to drugs (Bell, 2014). While a myriad of factors (e.g., environmental, physiological, genomic) are known to affect treatment response in psychiatry (Stern et al., 2018), genetic variation is of particularly strong interest for developing stratified approaches as it is identifiable and stable from birth. Which genetic variants affect response to drugs, and whether they influence pharmacokinetic or pharmacodynamic processes, is the topic of study of pharmacogenomics (Pirmohamed and Park, 2001). Advances in this field have led to algorithms, developed by expert groups (Klein and Ritchie, 2018) or industry (Behera et al., 2025), that can inform screening for haplotypes known to influence the activity of drug metabolising enzymes (classically termed “star alleles”), and infer how carriers might respond to a given drug. While the research sustaining the psychiatric arm of this discipline has seen a large growth in activity in recent years, and an increasing number of prospective trials are being funded, most promising results are still confined to the scientific literature and have not yet been translated into clinical interventions (Bousman et al., 2023a).
Translational efforts need to be based on robust research evidence, and pharmacogenomics has a number of international expert consortia routinely assessing any pharmacogenomic reports linked to commonly prescribed drugs (Whirl-Carrillo et al., 2021). Indeed, for many drug-gene pairs, pharmacogenomic effects have been investigated broadly, from simple molecular processes to complex patient-reported outcomes. While any of these reports could be used by regulators in deciding whether to recommend an implementation of pharmacogenomic testing (Wu, 2015), genetic evidence related to pharmacodynamic phenotypes such as drug response and ADRs tends to be considered the most likely to lead to a clinically useful and cost-effective intervention (Hughes, 2018).
This perception is worth emphasising. In psychiatry, robust associations of pharmacogenomic variants with pharmacodynamic outcomes are rare, and pharmacogenomic guidelines for psychotropics are mostly based on studies of drug metabolism and other indicators of drug pharmacokinetics (Bousman et al., 2020). A potential explanation for this asymmetry is that, outside of severe ADRs, pharmacodynamic phenotypes seem akin to complex traits. They are multifactorial, polygenic, and require large samples for accurately estimating genetic effects, given these are often weak (Roden et al., 2019). In contrast, pharmacokinetic phenotypes seem to fit oligogenic inheritances with moderate-to-high heritabilities, and are therefore more tractable for genetic discovery studies (Roden et al., 2006; Ingelman-Sundberg and Molden, 2025). This echoes classic discussions in psychiatry about the use of “endophenotypes”: quantitative measures of biological processes relevant to psychiatric disorders that show stronger associations with genetic variants than the disorders themselves (Gottesman and Gould, 2003). Endophenotypes are meant to be surrogates of some of the elements that characterise multifactorial disorders, in the same way that pharmacokinetic processes are important drivers of pharmacodynamics, but not the only ones (Simon and von Fabeck, 2025). This implies the expectation that the effects of any given genetic variant are largest on phenotypes that closely reflect the biological processes that it directly causes or moderates. On the other hand, effect sizes become diluted as phenotypes move further away from basic molecular mechanisms and become influenced by other factors, genetic and otherwise.
In this paper, we aim to quantify effects of pharmacogenomic variation through this framework, initially postulated in research on metabolic control (Kacser and Burns, 1981). Borrowing from the “proximal-distal continuum” concept of health outcomes research (Brenner et al., 1995), we term “proximal outcomes” as those based on quantitative biological measures, which tend to be mechanistically closer to genetic variation. On the other end, “distal outcomes” are those usually captured by clinical phenotyping, being often further away from any single genetic effect and subject to multifactorial influences. We implemented this classification on a series of meta-analyses of pharmacogenomic reports focused on enzymes important to the metabolism of antidepressant and antipsychotic drugs (i.e., the cytochrome P450, or CYP, family of enzymes). While this literature is necessarily heterogeneous, investigating many drugs, enzymes, and outcomes, our aim was to curate a corpus of data that can be used for diverse applications, including the design and interpretation of psychiatric pharmacogenomic studies. If indeed genetic effects differ between proximal and distal outcomes, identifying even a wide range of plausible effect sizes for each category could assist with accurately estimating the statistical power of future basic and translational research (Huang et al., 2020), as well as flagging potential errors or biases in existing studies (Gelman and Carlin, 2014).
2 Methods
2.1 Literature search
This meta-analysis was performed in line with the Preferred Reporting Items for Systematic reviews and Meta-Analyses (PRISMA; Moher et al., 2010) guidelines (Supplementary Material). We searched PUBMED, Cochrane, and SCOPUS databases for literature published between 1996 (when standardised pharmacogenomic nomenclature was introduced) and November 2024. Briefly, the search looked across titles for the following key terms in the format [pharmacogenomic term] AND [drug term] AND [outcome term] AND NOT [‘review’/‘guidelines’]. The full list of search terms is found in the Supplementary Material. Records returned from the three databases were combined, and duplicate entries were removed (Figure 1).
FIGURE 1
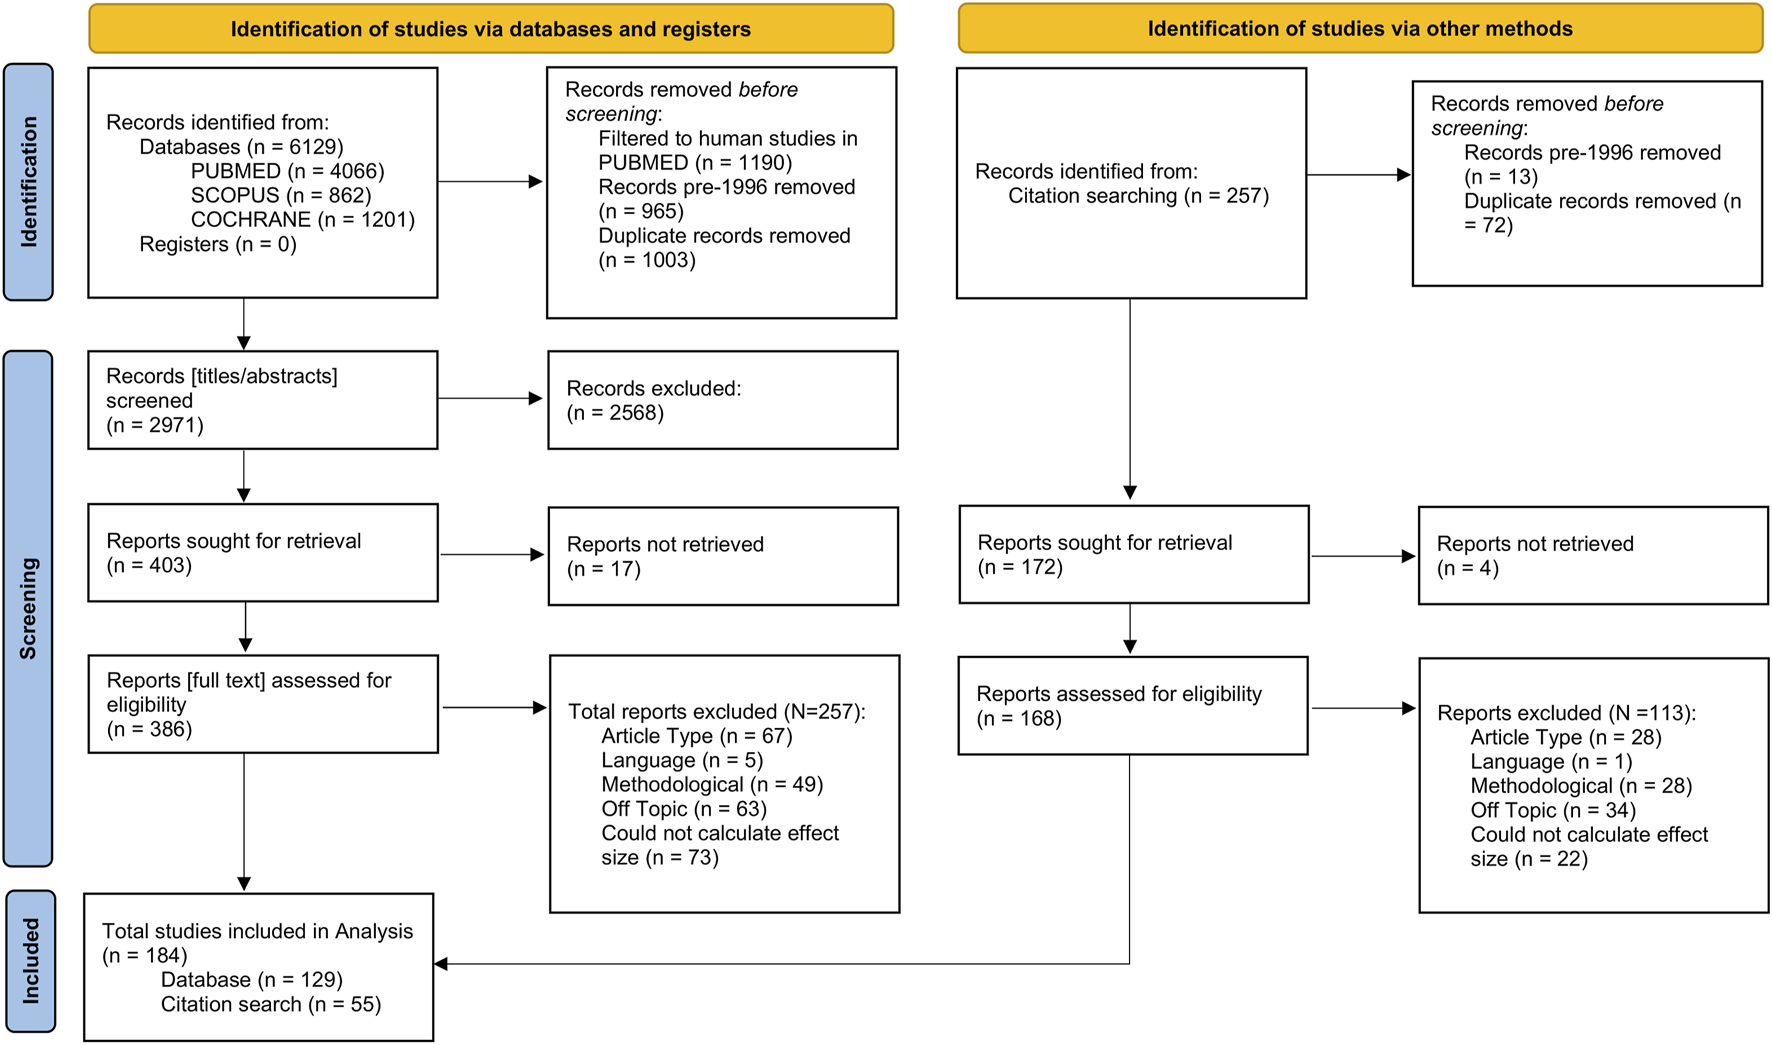
Flowchart showing the number of records identified from the literature search, the numbers following screening, retrieval, and finally, the number of records included in the final analysis. Flowchart template was adapted from the Preferred Reporting Items for Systematic reviews and Meta-Analyses (PRISMA; Moher et al., 2010).
2.2 Study selection
We compiled studies investigating associations of genotype-based pharmacogenomic variables with a range of outcomes in individuals taking psychiatric drugs. Broadly, these outcomes included measures of drug or metabolite bioavailability or clearance, drug doses, and measures of clinical response or ADRs (Table 1). We focussed on pharmacogenomic variation (i.e., genetics-inferred metabolism phenotypes, pharmacogenomic star alleles) in the CYP family of proteins given their role in the metabolism of many widely prescribed drugs (Zhao et al., 2021), including most psychotropics (Spina and de Leon, 2015).
TABLE 1
| Proximal outcomes | Distal outcomes |
|---|---|
| Active moiety pharmacokinetics (e.g., concentration, half-life, clearance, AUC) | Adverse drug reactions |
| Drug pharmacokinetics (e.g., concentration, half-life, clearance, AUC) | Drug dose |
| Metabolite pharmacokinetics (e.g., concentration, half-life, clearance, AUC) | Treatment outcomes (e.g., remission, hospitalisation, treatment discontinuation, medication switching) |
| Metabolic ratios | Symptom severity |
Examples of phenotypes included in the meta-analyses and whether they were rated as proximal or distal outcomes.
Titles and abstracts were screened first to determine eligibility based on fit to the research topic of this study. For reports passing this screening, we retrieved the full text and Supplementary Material if available. After full text inspection, we included reports in our analyses that were (i) original research articles, (ii) in English language, or able to be translated without ambiguities by the authors, (iii) were methodologically relevant, (iv) investigated an outcome, enzyme, or drug of interest, and (v) contained sufficient information to extract or infer effect sizes (see “Statistical Analysis”). We excluded studies conducted in vitro, using population modelling, or investigating drug-drug interactions. Studies in which pharmacogenomic information was not used (i.e., phenotyping by probe drug) or those investigating combinatorial metabolism phenotypes were also excluded. Where effect size information was shown graphically but was not explicitly mentioned in the report text, it was extracted from plots using a free online application (PlotDigitizer: Version 3.1.6, 2025). Finally, we also examined the reference lists of included studies for any relevant work that might have been missed by the initial literature search and screened these references as above (Figure 1).
2.3 Statistical analysis
Data were analysed in R v4.4.0 in R Studio 2024.04.0 Build 735 (R Core Team, 2021). Based on the information available in the eligible reports, we derived standardised mean differences (SMDs). In the context of this study, SMDs refer to the difference in effect between a group of individuals with an atypical CYP metabolism phenotype versus a normal metabolism phenotype. We also extracted SMDs for the effects of individual pharmacogenomic variants against wild-type alleles when these were reported. To calculate SMDs, group means and standard deviations were the preferred inputs. Where median and interquartile ranges were reported, approximate means and standard deviations were calculated using methods outlined by Wan et al. (2014). These were converted to SMDs using the esc ‘effect size conversion’ R package (v0.5.1; Lüdecke, 2018). Other data reported (e.g., number of observations, Odds Ratios, and t statistics, in order of preference) were also converted using the esc package. Full information about these calculations is provided in the Supplementary Material.
Additional details that were extracted from each report included: authors, year of publication, drug, enzyme, assessed outcome, and pharmacogenomic information. Where available, pharmacogenomic information was obtained as metabolism phenotypes; otherwise, phenotypes were inferred from genotype information using reference tables provided by ClinPGx (formerly PharmGKB) and CPIC (Supplementary Material). When conversion was not possible, information was left in the same format as reported. For classifying outcomes, a binary variable was created, as described in Table 1. In summary, pharmacokinetic outcomes (e.g., relating to bioavailability or clearance of a drug or metabolite) were rated as “proximal”. Outcomes were alternatively labelled “distal” if they related to pharmacodynamics or potential consequences of altered metabolism; these included, for example, reports of drug doses, experiences of adverse drug reactions (ADRs), or ratings of symptom severity.
Our primary analysis utilised the full set of calculated effect sizes. To account for heterogeneity between drugs, enzymes, and pharmacogenomic measures analysed, we used absolute effect sizes as the outcome variable, and the outcome binary rating (i.e., proximal/distal) as the moderator variable. We included a random intercept for effect size ID, and study ID, and a random slope for the moderator, with an unstructured variance-covariance matrix. As a sensitivity analysis, we repeated the primary meta-analysis on gene-drug subgroups to determine whether findings relating to proximal and distal effect sizes were replicable across subsets of the data. Gene-drug pairings with at least one hundred effect sizes were selected, including CYP2D6-risperidone (N = 412), CYP2C19-escitalopram (N = 221), CYP2D6-aripiprazole (N = 120), and CYP2D6-haloperidol (N = 106). For these analyses, we used a simplified random effects structure of effect size ID nested within study ID.
As a secondary analysis, we tested for whether the outcome phenotype (“proximal” or “distal”) influenced the effects of genetics-inferred enzyme activity across distinct metabolism phenotypes. This analysis included only effect sizes for which pharmacogenomic information was available as, or could be converted to, metabolism phenotypes. We extended the primary meta-analysis model to include an interaction term between rating and metabolism phenotype as the moderators, keeping the same random-effects structure. Comparisons between estimates of metaboliser phenotype effect sizes were performed using Wald-type tests. Holm’s method was used to correct for multiple comparisons.
We used metafor (v4.8.0; Viechtbauer, 2010) to fit multi-level, multivariate meta-analyses. In all analyses, we used a three-level correlated and hierarchical effects model. To account for dependency in our data, we imputed a variance-covariance matrix in metafor with positive correlations between clusters of effects (ρ = 0.6). We also performed robust variance estimation based on the clubSandwich package (v0.6.1; Pustejovsky, 2024) to further account for this dependency via a sandwich estimator with bias reduced-linearisation for small-sample correction. We tested models using different random effect structures, alongside different parameters of ρ to assess how these affected our analysis, also using profile likelihood plots to assess parameter identifiability and potential model over-parametrisation (see Supplementary Material). We fit two meta-analyses, one without the intercept to attain effect estimates for both proximal and distal outcomes, and one with an intercept to test whether proximal and distal effect estimates are significantly different. Finally, due to concerns that assessing traditional funnel plots using the SMD can lead to false positives when checking for publication bias, we additionally plot the SMD against 1/√N (Zwetsloot et al., 2017). We formally tested for publication bias using an adjusted version of Egger’s Test that accounts for the multi-level nature of the data, also using 1/√N in place of the standard error moderator (Rodgers and Pustejovsky, 2021).
2.4 Applications
We conducted power analyses using the pwr package (v1.3.0; Champely, 2020) to assess how sample sizes required to attain 80% power in pharmacogenomics research vary depending on the phenotype assessed. Effect sizes used were the proximal and distal effect estimates obtained from the primary meta-analysis and their robust 95% confidence intervals.
We also used the SMDs from this meta-analysis to model potential effect-size inflation for proximal and distal outcomes, consistent with the ‘winner’s curse’ phenomenon (Zöllner and Pritchard, 2007). As described in the Supplementary Material, results from our models can be used as prior distributions to generate posterior bias-reduced estimates of pharmacogenomic effects in existing and future studies.
Finally, we developed an interactive dashboard allowing users to filter, browse, visualise, and download data collected for this meta-analysis. This allows interested readers to access the effect size data in a user-friendly manner, alongside acting as a resource to help researchers to plan their future studies into pharmacogenomic variation and psychiatric medicine through a basic power calculation. The dashboard also allows users to fit three-level correlated and hierarchical effects meta-analyses on the filtered data to allow for an initial assessment of the pooled effect sizes for genes, drugs, and enzymes of interest. The dashboard was built using the R shiny package (v1.11.0; Chang et al., 2025) and follows the guidelines in the Netherlands eScience Center ‘Five Recommendations for FAIR Software’ tool (Netherlands eScience Center & DANS, 2020), which is based on FAIR4RS (FAIR for Research Software; Barker et al., 2022) Principles.
3 Results
Briefly, we identified and screened for eligibility 6,129 entries from the literature search, of which 386 full texts were selected to be assessed for inclusion. Following this, we identified an additional 257 records from citation searching, of which 168 were selected to have full texts assessed for inclusion. In total, we calculated 2,119 effect sizes from 184 studies (N = 129 from the literature search; N = 55 from citation searching). After excluding extreme values (SMD ≥ 5 or SMD ≤ −5), 2,102 effect sizes remained.
Over half (63%) of analyses were performed on samples recruited in Europe, with the next largest group (23%) coming from Asia. The most frequently studied drugs were risperidone (20%) and escitalopram (13%). The most studied enzymes were CYP2D6 (57%) and CYP2C19 (30%). There were similar numbers of proximal (56%) and distal (44%) outcomes across the analyses. A full description of the dataset is found in Table 2, below.
TABLE 2
| Variable | N (effect sizes) (%) | N (studies) (%) | Mean SMD | Mean abs (SMD) |
|---|---|---|---|---|
| Outcome | ||||
| Proximal | 1,172 (56%) | 124 (54%) | 0.198 | 0.698 |
| Distal | 930 (44%) | 107 (46%) | 0.062 | 0.393 |
| Continent | ||||
| Asia | 475 (23%) | 69 (38%) | 0.236 | 0.641 |
| Europe | 1,328 (63%) | 91 (49%) | 0.128 | 0.579 |
| Mixed | 4 (0.2%) | 1 (1%) | 0.083 | 0.083 |
| North America | 213 (10%) | 18 (10%) | 0.040 | 0.453 |
| Oceania | 72 (3.4%) | 3 (2%) | 0.006 | 0.096 |
| South America | 10 (0.5%) | 2 (1%) | −0.191 | 0.531 |
| Africa | 0 (0%) | 0 (0%) | | |
| Drug studied | ||||
| Antidepressant | 839 (40%) | 60 (31%) | 0.144 | 0.624 |
| Antipsychotic | 1,019 (48%) | 98 (51%) | 0.132 | 0.573 |
| Unknown/Multiple | 244 (12%) | 34 (18%) | 0.140 | 0.312 |
| Enzyme studied | ||||
| CYP1A2 | 139 (6.6%) | 19 (8%) | −0.038 | 0.299 |
| CYP2B6 | 35 (1.7%) | 3 (1%) | −0.046 | 0.428 |
| CYP2C19 | 627 (30%) | 45 (20%) | 0.047 | 0.412 |
| CYP2C9 | 46 (2.2%) | 6 (3%) | 0.101 | 0.359 |
| CYP2D6 | 1,188 (57%) | 145 (64%) | 0.233 | 0.691 |
| CYP3A4/5 | 67 (3.2%) | 8 (4%) | −0.226 | 0.464 |
| Metabolism phenotype | ||||
| Intermediate Metaboliser | 811 (48%) | 130 (40%) | 0.243 | 0.578 |
| Poor metaboliser | 429 (26%) | 68 (21%) | 0.321 | 0.837 |
| Rapid metaboliser | 113 (6.7%) | 18 (5%) | −0.118 | 0.236 |
| Ultrarapid metaboliser | 329 (20%) | 50 (15%) | −0.130 | 0.449 |
| Unknown | 420 | 62 (19%) | 0.025 | 0.429 |
Descriptive information about the analyses included in the effect size data. For each variable, number of studies and effect sizes are reported. The mean of the Standardised Mean Difference (SMD) and absolute Standardised Mean Difference (abs (SMD)) for each group are also given.
3.1 Meta-analysis of proximal and distal outcomes
As shown in Figure 2, we found evidence for a significant effect of pharmacogenomic variation on proximal (β = 0.481 [95% CI 0.411–0.552], p = 8 × 10⁻²⁵) and distal outcomes (β = 0.278 [95% CI 0.218–0.339], p = 1 × 10⁻¹³). The intercept model showed that the proximal effect size was indeed significantly larger than the distal effect size (Δβ = −0.203 [95% CI -0.288 to −0.118], p = 6 × 10⁻⁶). Most of the variance in our dataset was at a within-study level (σ2 = 0.164). Between-study variance was larger for proximal outcomes (τ2 = 0.062), than for distal outcomes (τ2 = 0.017).
FIGURE 2
![Orchard plot showing standardized mean differences for two groups: Distal and Proximal. Distal, in teal, has a confidence interval of [0.218, 0.339] and prediction interval of [-0.567, 1.124], with k = 930. Proximal, in pink, has a confidence interval of [0.411, 0.552] and prediction interval of [-0.463, 1.426], with k = 1172. Circle size indicates inverse square root of N.](https://www.frontiersin.org/files/Articles/1719761/xml-images/fphar-16-1719761-g002.webp)
Orchard plot (Nakagawa et al., 2021) showing the distribution of effect sizes (Standardised Mean Difference, SMD) across proximal and distal outcomes. Size of points is determined by a sample-size based measure of precision (1/√N). Pooled estimates for proximal and distal effect sizes are represented by the black diamond, with error bars representing robust 95% confidence intervals (thick) and 95% prediction intervals (thin); see IntHout et al. (2016) for more information. Number of effect sizes is represented by k, with number of studies in brackets. Note that while an absolute scale was used for the effect sizes included in the meta-analysis, standard procedures were used for calculating prediction intervals, in which the lower bound is not limited at zero.
3.2 Sensitivity meta-analyses: across gene-drug pairings
We repeated the primary analysis in subgroups restricted to the most common gene-drug pairings (i.e., those with at least 100 analyses available). We observed that proximal effect sizes were significantly larger than distal effect sizes in the Risperidone-CYP2D6 group (Δβ = −0.206 [95% CI -0.361 to −0.052], p = 0.013) and the Aripiprazole-CYP2D6 group (Δβ = −0.301 [95% CI -0.591 to −0.011], p = 0.044). We did not observe a significant difference between the effect sizes in the haloperidol-CYP2D6 group (Δβ = −0.294 [95% CI -0.602–0.014], p = 0.057) and the escitalopram-CYP2C19 group (Δβ = −0.171 [95% CI -0.633–0.29], p = 0.405). However, the directions of all effects were consistent with the primary analysis. Results for effect sizes for proximal and distal outcomes, separately, across each of the gene-drug subgroups are given in the Supplementary Material.
3.3 Secondary analysis: differences across metabolism phenotypes
We fit a meta-analysis restricted to effect sizes for which metabolism phenotype information was available. We tested for moderation effects via the addition of an outcome-metabolism phenotype interaction term to the model, comparing the effect of an atypical metabolism phenotype (i.e., Poor, Intermediate, Rapid, or Ultrarapid) versus the normal metabolism phenotype for either proximal, or distal outcomes. We included 1,682 effect sizes from 146 different studies with results shown in Figure 3 and the Supplementary Material.
FIGURE 3
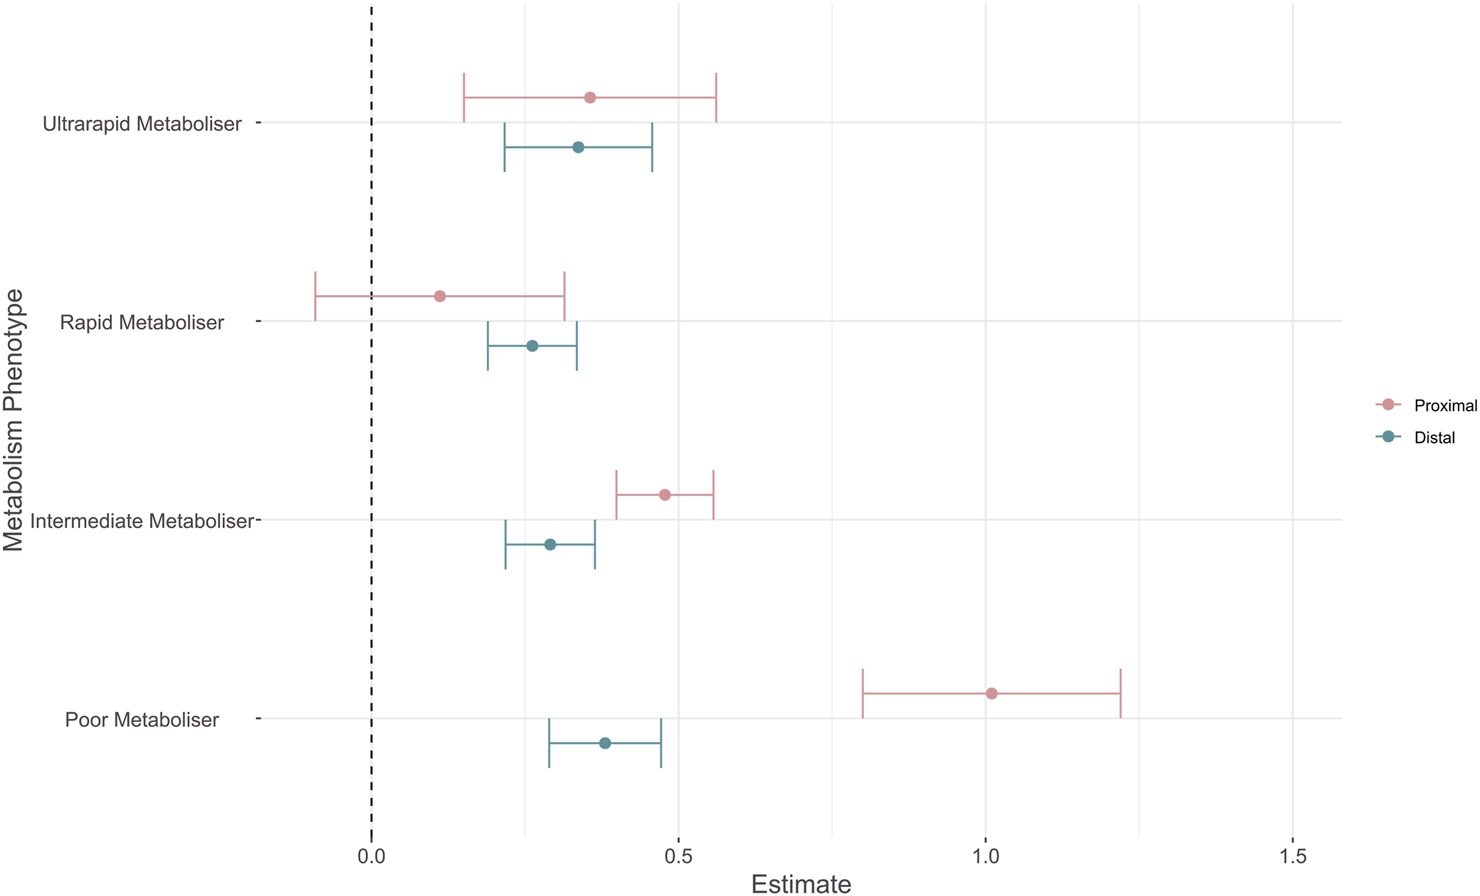
Forest plot showing absolute effect sizes of pharmacogenomic metabolism phenotypes on proximal and distal outcomes. Point shows the effect estimates for proximal (pink) and distal (blue) outcomes, error bars show robust 95% confidence intervals. Effect estimates reflect that of an atypical metabolism phenotype (i.e., Poor, Intermediate, Rapid, or Ultrarapid) versus the normal metabolism phenotype for either proximal, or distal outcomes.
We tested for differences between model estimates using Wald-type tests. Reported p values are corrected for multiple comparisons with Holm’s method. Effect sizes for proximal outcomes were significantly larger than distal outcomes for the poor metabolism phenotype (β = −0.63 (SE = 0.103), p = 9 × 10⁻⁷) and the intermediate metabolism phenotype (β = −0.187 (SE = 0.046), p = 3 × 10⁻⁴). There was no significant difference between proximal and distal estimates for both the rapid (β = 0.15 (SE = 0.094), p = 0.272) and ultrarapid (β = −0.019 (SE = 0.11), p = 0.863) metaboliser statuses. When assessing whether metabolism phenotypes had distinct effects within outcomes, we observed that the estimate for the poor metabolism phenotype was significantly different to all other phenotypes for proximal outcomes (Table 3). The effect size of an intermediate metabolism phenotype was also significantly larger than that of a rapid metabolism phenotype. For distal outcomes, there were no significant differences between the effect estimates of metabolism phenotypes (Table 4). As in the primary analysis, the largest variance component was at the within-study level (σ2 = 0.171), with greater between-study heterogeneity for proximal outcomes (τ2 = 0.075) than distal outcomes (τ2 = 0.024).
TABLE 3
| Tests of equality of effect sizes (proximal outcomes) | Estimate | SE | p value | p value (Holm) |
|---|---|---|---|---|
| Intermediate metaboliser - poor metaboliser | −0.5320 | 0.0946 | 7 × 10⁻⁶ | 4 × 10⁻⁵ |
| Rapid metaboliser - poor metaboliser | −0.8985 | 0.1416 | 1 × 10⁻⁴ | 5 × 10⁻⁴ |
| Ultrarapid metaboliser - poor metaboliser | −1.3657 | 0.1333 | 2 × 10⁻¹⁴ | 1 × 10⁻¹³ |
| Rapid metaboliser - intermediate metaboliser | −0.3665 | 0.0913 | 0.004 | 0.012 |
| Ultrarapid metaboliser - intermediate metaboliser | −0.1219 | 0.0905 | 0.192 | 0.192 |
| Ultrarapid metaboliser - rapid metaboliser | 0.2445 | 0.1240 | 0.081 | 0.162 |
Results of ANOVA comparing whether proximal effect sizes for two different metabolism phenotypes (shown in the test column) are significantly different from each other.
TABLE 4
| Tests of equality of effect sizes (distal outcomes) | Estimate | SE | p value | p value (Holm) |
|---|---|---|---|---|
| Intermediate metaboliser - poor metaboliser | −0.0893 | 0.0368 | 0.0250 | 0.1270 |
| Rapid metaboliser - poor metaboliser | −0.1185 | 0.0353 | 0.0140 | 0.0840 |
| Ultrarapid metaboliser - poor metaboliser | −0.0435 | 0.0414 | 0.3120 | 0.8980 |
| Rapid metaboliser - intermediate metaboliser | −0.0291 | 0.0301 | 0.3720 | 0.8980 |
| Ultrarapid metaboliser - intermediate metaboliser | 0.0458 | 0.0422 | 0.2990 | 0.8980 |
| Ultrarapid metaboliser - rapid metaboliser | 0.0750 | 0.0425 | 0.1280 | 0.5120 |
Results of ANOVA comparing whether distal effect sizes for two different metabolism phenotypes (shown in the test column) are significantly different from each other.
3.4 Applications
Based on the effect sizes generated in the primary meta-analysis, across all drugs and genes assessed, we generated curves to visualise the relationship between sample size and statistical power. These values are given as N per group for a two-sample t-test and are based on the average pharmacogenomic effect sizes estimated for proximal and distal outcomes (Figure 4). For a proximal outcome, the optimum sample size for 80% power was estimated at 69 individuals per group (range: 53–94), where each group constitutes a specific genotype or metabolism phenotype. For a distal outcome, the optimum sample size for 80% power was estimated at 204 individuals per group (range: 138–332). Similarly, the Bayesian analysis supports a larger shrinkage factor (also called “exaggeration ratio”) across most of the z-score distribution for distal outcomes (mean = 1.97) than for proximal outcomes (mean = 1.28). Assuming the simplest scenario of equal unadjusted effect sizes, this suggests that posterior estimates for distal outcomes will be smaller than that for proximal outcomes in most cases (Supplementary Material). Finally, we developed a companion Shiny App allowing for the visualisation of effect size distributions and power curves. We also included the ability for users to perform their own exploratory meta-analyses using the full dataset, or filtered to whichever enzyme, drug, and outcome combinations desired. This also generates probability distributions based on the filtered data and a calculator for estimating posterior effect sizes that account for winner’s curse.
FIGURE 4
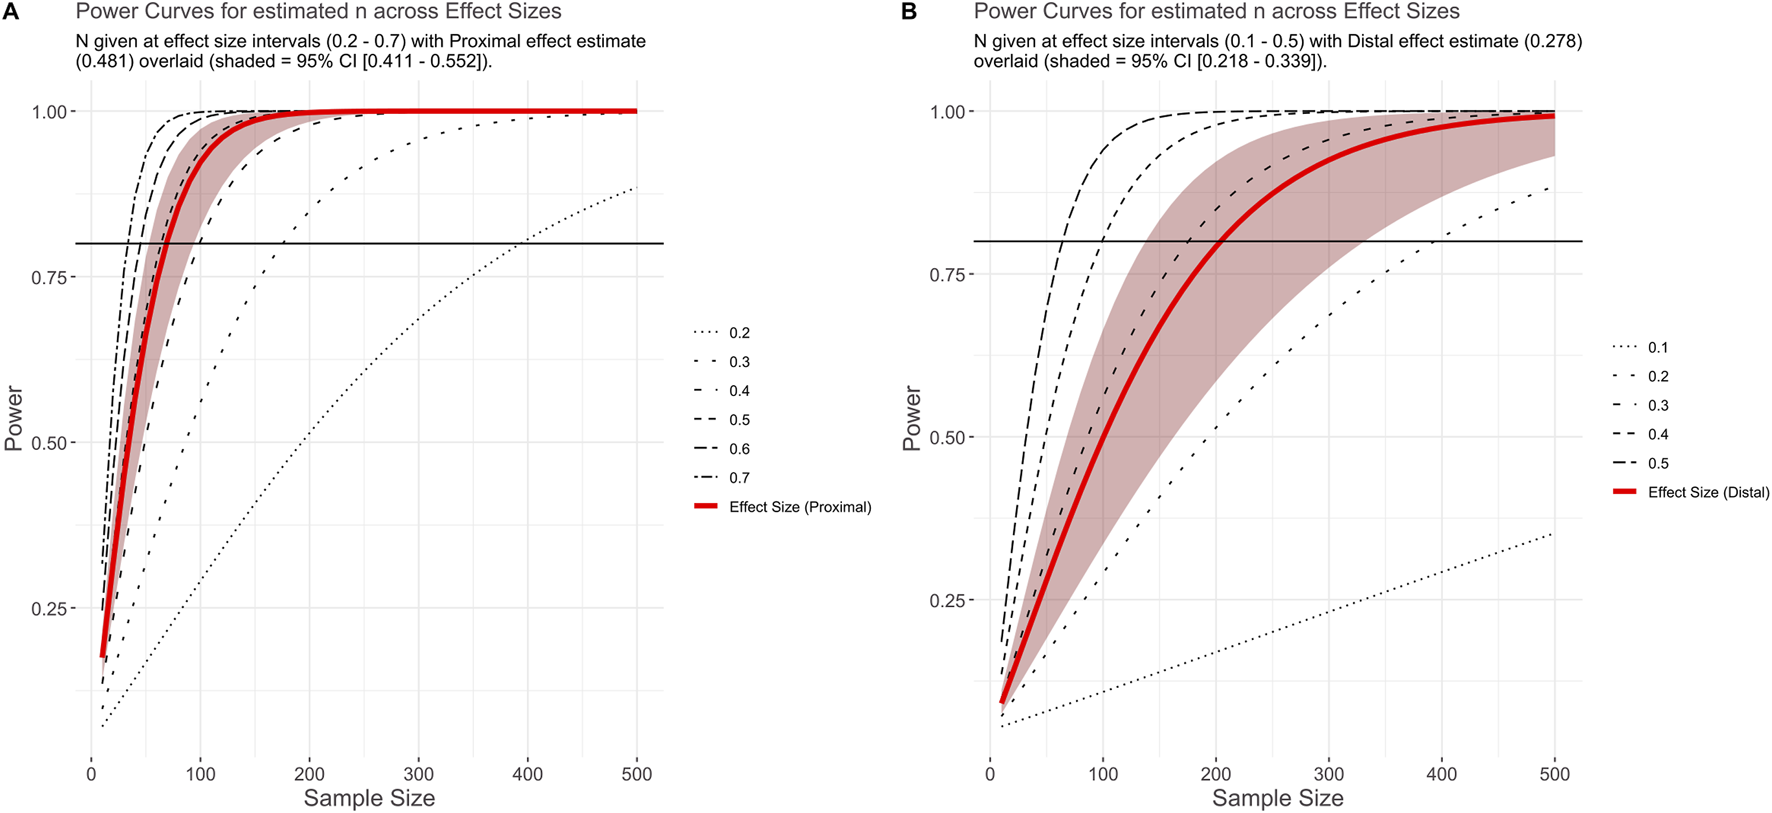
Plot shows power at a given effect size and sample size. Panels show power curves based on effect sizes generated for proximal (A) and distal (B) effect sizes (and robust 95% CI) from the primary meta-analysis. Black horizontal line indicates 80% power.
4 Discussion
Here, we assess and quantify the effect size of pharmacogenomic variation across a large spectrum of phenotypes related to antidepressants and antipsychotics. This study builds on primary pharmacogenomics experiments, often restricted to single drugs, disorders, or outcomes (Teng et al., 2023). Instead, we employ broad inclusion criteria enabling a substantial meta-analysis of psychiatric pharmacogenomic effects. We report on 2,102 effect sizes from 184 studies, demonstrating larger effects of pharmacogenomic variation on proximal outcomes than on distal outcomes. This result echoes reports of larger odds ratios for associations between genetic variants and pharmacogenomic phenotypes than for genetic variants and other dichotomous outcomes in the GWAS catalog, including complex polygenic disorders (Maranville and Cox, 2016). We also showcase how the collected corpus of studies can be used to inform future pharmacogenomics research and study design and provide an interactive web app for browsing the raw data, facilitating the reproduction of our analyses or their adaptation to outcomes or drugs of specific interest for other researchers.
Our primary finding was that, as expected, the effect of pharmacogenomic variation on proximal outcomes was significantly greater than that of distal outcomes. This generalises previous observations made in drug-gene guidelines about strong genetic effects on pharmacokinetics translating into weaker or unclear effects on clinical outcomes (Bousman et al., 2023b; Duarte et al., 2024). The difference in effect sizes between proximal and distal outcomes was consistent in all sensitivity analyses we made on each of the most common gene-drug subgroups in the psychiatric literature and significant in half of them, suggesting that our results are not driven by heterogeneity in the drugs or enzyme systems captured by our broad literature review. Furthermore, our analysis provides a rationale for the lack of pharmacodynamic primary evidence observed in psychiatric pharmacogenomic guidelines (Bousman et al., 2020), and supports that pharmacogenomic studies might see benefits in explicitly assessing how their phenotypes map to a “proximal-distal continuum” (Brenner et al., 1995) of genetic effects. Ideally, studies should also consider multiple outcomes relevant to clinical practice when possible, as recommended previously (Guchelaar et al., 2025).
Currently, the translation of pharmacogenomics research to clinical recommendations is primarily informed by strength of evidence ratings written into drug-gene guidelines. As an example, the five-step variant scoring system employed by ClinPGx to standardise reports includes evidence ratings by phenotype, p-value, cohort size, study type, and effect size (Whirl-Carrillo et al., 2021). In this calculation, the “phenotype” criteria gives a larger score to studies of drug efficacy, toxicity or dosage, while the “effect size” category increases the weight of an association if a threshold of magnitude is passed (OR ≥ 2, OR =< 0.5). Our results suggest that these two ratings might effectively have opposing effects, as proximal associations tend to report larger effects (pooled OR = 2.4) more commonly than distal outcomes (pooled OR = 1.7). Therefore, as the size of the pharmacogenomics literature increases and the routine access of clinicians to genomic information draws near, specific pharmacogenomic weighting rules for different phenotypes or outcome classes might need to be added to the present scheme. As there is already an explicit aim of ensuring that analyses of clinically meaningful (often distal) outcomes form the basis of drug-gene guidelines when available, such a modification would ensure a fairer evaluation of their results on the evidence assessment process.
We also investigated whether proximal-distal outcome differences in effect sizes existed across the functional spectrum of the enzymes included in our review. In these analyses we noted the distinction between estimates for proximal and distal outcomes was less pronounced than in the primary analysis, with differences apparent only across the slower metabolism phenotypes (i.e., intermediate and poor). In particular, studies of poor versus normal metabolisers showed significantly larger effects than other atypical metabolism phenotypes, albeit only across proximal outcomes (Figure 3), which is consistent with previous meta-analyses across a range of outcomes (Calafato et al., 2020; Zhang et al., 2020; Li et al., 2024). These results suggest that greater care might be needed for defining metabolism phenotypes, particularly for those reflecting increased function. Furthermore, the fact that effect size estimates from ultra-rapid metabolisers versus normal metabolisers mostly overlap those of rapid and intermediate metabolisers for both proximal and distal outcomes supports that this phenotype might be particularly ill-defined in most studies. To this effect, it has already been shown that “normal” metabolisers of several enzymes have higher variability in pharmacokinetic measures when compared to atypical metabolisers identified by genetic testing, which might be attributed to the existence of functional alleles not currently assessed in pharmacogenomic studies (Lauschke et al., 2024).
Our findings have applications beyond this study. First, we provide estimates for the expected effect sizes of psychiatric pharmacogenomics analyses, based on the type of phenotype investigated. These can inform data collection efforts for future research. As an illustration, our results suggest that if per-group sample sizes are collected aiming for an appropriately-powered analysis of a proximal phenotype (e.g. drug metabolism), they are likely to be substantially underpowered for assessing a distal outcome (e.g. treatment response). Second, a retrospective analysis of our dataset using outcome-specific calculations for 80% statistical power (Figure 4), shows that most analyses included in our review may indeed not reach this power threshold (78.4% proximal, 84.3% distal). This suggests that barriers to participant recruitment, and potentially the availability of research funding, remain a limitation to psychiatric pharmacogenomics work (Pardiñas et al., 2021). Motivated by this finding, we conducted an estimation of the signal-to-noise ratio of past research in psychiatric pharmacogenomics using our collected studies, following the general procedure in van Zwet and Gelman (2022). The derived estimates allow for a Bayesian re-evaluation of the test statistics of comparable studies, accounting for the inflation in effect sizes that is often due to “winner’s curse” (Zöllner and Pritchard, 2007). We provide a worked example of this methodology in the Supplementary Material, and implement all the relevant formulae to reproduce or replicate our calculations in a dedicated section of our Shiny app.
One of the strengths of this research is the large number of studies and effects included in the meta-analysis. This was attained through broad but well-defined inclusion criteria, namely all analyses investigating pharmacogenomic variation in cytochrome P450 (CYP) genes in participants taking psychiatric drugs. In the future, we anticipate well-powered pharmacogenomic analyses will come from biobank cohorts with linked electronic health records (Empey et al., 2025). Such population-scale datasets will be an asset for broader research questions. However, they may not allow for more granular analyses focusing on specific subsets of patients, drugs, genes, or outcomes, given their rarity in the general population or comparative lack of phenotypic detail. In line with this, and based on calls to improve transparency and reproducibility in meta-analytic research (Ahern et al., 2021), we developed a companion dashboard in R Shiny that enables users to browse, filter, and download the data used in the present meta-analysis. The application also allows users to perform exploratory meta-analyses of subgroups of the data, as well as power calculations based on these results. In such a rapidly evolving field, this is not intended to substitute future efforts to compile or curate the literature but does allow users to quickly assess reported effect sizes for arbitrary combinations of drugs, enzymes, and/or outcomes that might be of interest; we anticipate that these features will be useful for quickly and easily assessing feasibility of study designs early in the research process.
A primary limitation of this research is the lack of studies identified from African and South American nations, excluding Brazil. Therefore, the results from this meta-analysis may not be generalisable to countries and participants in these locations. This needs to be taken into account as pharmacogenomic variation is known to differ across populations, in some instances quite dramatically (e.g., CYP3A4/5; Masimirembwa et al., 2014). However, consistent with a previous review (Popejoy, 2019), many studies did not report detailed ancestry information and so we were unable to statistically account for this. Another limitation derived from the assessed papers is that, while most studies used up-to-date nomenclature and metabolism phenotype definitions, several used criteria which are currently outdated. This has been corrected wherever possible, but it has not been feasible in all cases. Methodologically, visual inspection of funnel plots from the meta-analysis and results from the adapted Egger’s regression test are suggestive of funnel plot asymmetry. This has sometimes been argued as a consequence of publication bias and the inclusion of underpowered studies, but more complex factors could be at play (Afonso et al., 2024). Therefore, we made efforts to guard against potential biases in our effect size estimations by using correlated and hierarchical effects models with robust variance structures, as is best practice for datasets with potentially complex dependencies. A final limitation is that it is possible that measurement issues could partly explain our findings. Proximal outcomes such as drug pharmacokinetics and clearance can be physically measured and are thus generally easier to quantify than distal outcomes such as symptom severity. While ADRs and other distal clinical events (i.e. death) might also be easily and reliably assessed, if instruments of lower psychometric resolution are more common in distal outcomes research, this would also dilute genetic effects (Sluis et al., 2010). We are unable to account for this in our analysis as we do not have good estimates of the reliability or measurement error of all instruments involved, so our results should be considered with this caveat.
In summary, we found evidence of substantial variability in the magnitude of effect sizes reported by psychiatric pharmacogenomic studies, which we could relate to a simple phenotype classification involving either “proximal” or “distal” outcomes. We found evidence that this effect size disparity is apparent even when explicitly accounting for metabolism phenotype and is particularly pronounced for variation conferring slower enzyme activity. We have quantified these differences between proximal and distal effect sizes and provide ways in which future study design can be improved, for example via power calculations based on the results we compiled throughout our literature review. These findings may also have relevance for pharmacogenomics consortia, and future efforts focused on other drugs and disciplines of study might support new evaluations of the strength of evidence behind genotype-guided pharmacogenomic recommendations.
Statements
Data availability statement
The original contributions presented in the study are included in the article/Supplementary Material, further inquiries can be directed to the corresponding author.
Ethics statement
Ethical approval was not required for the study involving humans in accordance with the local legislation and institutional requirements. Written informed consent to participate in this study was not required from the participants or the participants’ legal guardians/next of kin in accordance with the national legislation and the institutional requirements.
Author contributions
SKL: Writing – review and editing, Writing – original draft, Software, Investigation, Data curation, Formal Analysis, Visualization. DBK: Writing – review and editing, Methodology. JH: Visualization, Software, Writing – review and editing. ES: Validation, Methodology, Writing – review and editing. SEL: Writing – original draft, Data curation, Writing – review and editing, Validation, Conceptualization, Supervision, Methodology. MCO’D: Validation, Supervision, Methodology, Conceptualization, Writing – review and editing. AFP: Methodology, Writing – review and editing, Supervision, Writing – original draft, Visualization, Conceptualization, Formal Analysis, Project administration, Validation, Data curation.
Funding
The author(s) declared that financial support was received for this work and/or its publication. This work was supported by a PhD studentship from Mental Health Research UK (SKL). Authors were also supported by grants from the Medical Research Council (SEL, MCO’D, AFP; MR/Y004094/1 and MR/Z503745/1), the European Union’s Horizon 2020 programme (DBK, MCO’D, AFP; #964874), the European Union’s Horizon 2021 programme (AFP, #101057454), and the Dementia Research Institute (ES; UKDRI supported by the Medical Research Council (UKDRI-3206), Alzheimer’s Research UK, and Alzheimer’s Society). MCO’D is supported by a collaborative research grant from Takeda Pharmaceuticals Ltd. for a project unrelated to work presented here. AFP and MCO’D also reported receiving grants from Akrivia Health for a project unrelated to this submission. Takeda and Akrivia Health played no part in the conception, design, implementation, or interpretation of this study.
Acknowledgments
We would like to thank Peter A. Holmans for critical feedback on the manuscript.
Conflict of interest
The author(s) declared that this work was conducted in the absence of any commercial or financial relationships that could be construed as a potential conflict of interest.
Generative AI statement
The author(s) declared that generative AI was not used in the creation of this manuscript.
Any alternative text (alt text) provided alongside figures in this article has been generated by Frontiers with the support of artificial intelligence and reasonable efforts have been made to ensure accuracy, including review by the authors wherever possible. If you identify any issues, please contact us.
Publisher’s note
All claims expressed in this article are solely those of the authors and do not necessarily represent those of their affiliated organizations, or those of the publisher, the editors and the reviewers. Any product that may be evaluated in this article, or claim that may be made by its manufacturer, is not guaranteed or endorsed by the publisher.
Supplementary material
The Supplementary Material for this article can be found online at: https://www.frontiersin.org/articles/10.3389/fphar.2025.1719761/full#supplementary-material
References
1
Afonso J. Ramirez-Campillo R. Clemente F. M. Büttner F. C. Andrade R. (2024). The perils of misinterpreting and misusing “Publication Bias” in meta-analyses: an education review on funnel plot-based methods. Sports Med. Auckl. N. Z.54, 257–269. 10.1007/s40279-023-01927-9
2
Ahern T. P. MacLehose R. F. Haines L. Cronin-Fenton D. P. Damkier P. Collin L. J. et al (2021). Improving the transparency of meta-analyses with interactive web applications. BMJ Evid.-Based Med.26, 327–332. 10.1136/bmjebm-2019-111308
3
Barker M. Chue Hong N. P. Katz D. S. Lamprecht A.-L. Martinez-Ortiz C. Psomopoulos F. et al (2022). Introducing the FAIR principles for research software. Sci. Data9, 622. 10.1038/s41597-022-01710-x
4
Behera S. Catreux S. Rossi M. Truong S. Huang Z. Ruehle M. et al (2025). Comprehensive genome analysis and variant detection at scale using DRAGEN. Nat. Biotechnol.43, 1177–1191. 10.1038/s41587-024-02382-1
5
Bell J. (2014). Stratified medicines: towards better treatment for disease. Lancet383, S3–S5. 10.1016/S0140-6736(14)60115-X
6
Bousman C. A. Bengesser S. A. Aitchison K. J. Amare A. T. Aschauer H. Baune B. T. et al (2020). Review and consensus on pharmacogenomic testing in psychiatry. Pharmacopsychiatry54, 5–17. 10.1055/a-1288-1061
7
Bousman C. A. Maruf A. A. Marques D. F. Brown L. C. Müller D. J. (2023a). The emergence, implementation, and future growth of pharmacogenomics in psychiatry: a narrative review. Psychol. Med.53, 7983–7993. 10.1017/S0033291723002817
8
Bousman C. A. Stevenson J. M. Ramsey L. B. Sangkuhl K. Hicks J. K. Strawn J. R. et al (2023b). Clinical pharmacogenetics implementation consortium (CPIC) guideline for CYP2D6, CYP2C19, CYP2B6, SLC6A4, and HTR2A genotypes and serotonin reuptake inhibitor antidepressants. Clin. Pharmacol. Ther.114, 51–68. 10.1002/cpt.2903
9
Brenner M. H. Curbow B. Legro M. W. (1995). The proximal-distal continuum of multiple health outcome measures: the case of cataract surgery. Med. Care33, AS236–AS244.
10
Calafato M. S. Austin-Zimmerman I. Thygesen J. H. Sairam M. Metastasio A. Marston L. et al (2020). The effect of CYP2D6 variation on antipsychotic-induced hyperprolactinaemia: a systematic review and meta-analysis. Pharmacogenomics J.20, 629–637. 10.1038/s41397-019-0142-9
11
Champely S. (2020). pwr: basic functions for power analysis. Available online at: https://github.com/heliosdrm/pwr.
12
Chang W. Cheng J. Allaire J. J. Sievert C. Schloerke B. Xie Y. et al (2025). Shiny: web application framework for R. Available online at: https://shiny.posit.co/.
13
Dellen E. van (2024). Precision psychiatry: predicting predictability. Psychol. Med.54, 1500–1509. 10.1017/S0033291724000370
14
Duarte J. D. Thomas C. D. Lee C. R. Huddart R. Agundez J. A. G. Baye J. F. et al (2024). Clinical pharmacogenetics implementation consortium guideline (CPIC) for CYP2D6, ADRB1, ADRB2, ADRA2C, GRK4, and GRK5 genotypes and beta-blocker therapy. Clin. Pharmacol. Ther.116, 939–947. 10.1002/cpt.3351
15
Eichler H.-G. Abadie E. Breckenridge A. Flamion B. Gustafsson L. L. Leufkens H. et al (2011). Bridging the efficacy–effectiveness gap: a regulator’s perspective on addressing variability of drug response. Nat. Rev. Drug Discov.10, 495–506. 10.1038/nrd3501
16
Empey P. E. Karnes J. H. Johnson J. A. (2025). Pharmacogenetics: opportunities for the all of us research program and other large data sets to advance the field. Annu. Rev. Pharmacol. Toxicol.65, 111–130. 10.1146/annurev-pharmtox-061724-080718
17
Gelman A. Carlin J. (2014). Beyond power calculations: assessing type S (Sign) and type M (Magnitude) errors. Perspect. Psychol. Sci.9, 641–651. 10.1177/1745691614551642
18
Gottesman I. I. Gould T. D. (2003). The endophenotype concept in psychiatry: etymology and strategic intentions. Am. J. Psychiatry160, 636–645. 10.1176/appi.ajp.160.4.636
19
Groenwold R. H. H. (2021). Chapter 2 - the efficacy-effectiveness gap. In: Pragmatic randomized clinical trials, GirmanC. J.RitcheyM. E., editors. London, United Kingdom: Academic Press, 9–19. 10.1016/B978-0-12-817663-4.00024-6
20
Guchelaar H.-J. van der Wouden C. H. Manson L. E. N. Abdullah-Koolmees H. Blagec K. Blagus T. et al (2025). Pharmacogenetic implementation studies—lessons learned from the PREPARE study. Clin. Pharmacol. Ther. /a118, 803–812. 10.1002/cpt.3749
21
Howes O. D. Thase M. E. Pillinger T. (2022). Treatment resistance in psychiatry: state of the art and new directions. Mol. Psychiatry27, 58–72. 10.1038/s41380-021-01200-3
22
Huang W. Percie du Sert N. Vollert J. Rice A. S. C. (2020). General principles of preclinical study design. In: Good research practice in non-clinical pharmacology and biomedicine, BespalovA.MichelM. C.StecklerT., editors. Cham: Springer International Publishing. 55–69. 10.1007/164_2019_277
23
Huda A. S. (2019). The medical model in mental health: an explanation and evaluation. Oxford: Oxford University Press.
24
Hughes D. A. (2018). Economics of pharmacogenetic-guided treatments: underwhelming or overstated?Clin. Pharmacol. Ther.103, 749–751. 10.1002/cpt.1030
25
Huhn M. Tardy M. Spineli L. M. Kissling W. Förstl H. Pitschel-Walz G. et al (2014). Efficacy of pharmacotherapy and psychotherapy for adult psychiatric disorders: a systematic overview of meta-analyses. JAMA Psychiatry71, 706–715. 10.1001/jamapsychiatry.2014.112
26
IntHout J. Ioannidis J. P. A. Rovers M. M. Goeman J. J. (2016). Plea for routinely presenting prediction intervals in meta-analysis. BMJ Open6 (7), e010247. 10.1136/bmjopen-2015-010247
27
Ingelman-Sundberg M. Molden E. (2025). Therapeutic drug monitoring, liquid biopsies or pharmacogenomics for prediction of human drug metabolism and response. Br. J. Clin. Pharmacol.91, 1569–1579. 10.1111/bcp.16048
28
Kacser H. Burns J. A. (1981). The molecular basis of dominance. Genetics97, 639–666. 10.1093/genetics/97.3-4.639
29
Klein T. E. Ritchie M. D. (2018). PharmCAT: a pharmacogenomics clinical annotation tool. Clin. Pharmacol. Ther.104, 19–22. 10.1002/cpt.928
30
Lauschke V. M. Zhou Y. Ingelman-Sundberg M. (2024). Pharmacogenomics beyond single common genetic variants: the way forward. Annu. Rev. Pharmacol. Toxicol.64, 33–51. 10.1146/annurev-pharmtox-051921-091209
31
Leucht S. Hierl S. Kissling W. Dold M. Davis J. M. (2012). Putting the efficacy of psychiatric and general medicine medication into perspective: review of meta-analyses. Br. J. Psychiatry200, 97–106. 10.1192/bjp.bp.111.096594
32
Li D. Pain O. Fabbri C. Wong W. L. E. Lo C. W. H. Ripke S. et al (2024). Metabolic activity of CYP2C19 and CYP2D6 on antidepressant response from 13 clinical studies using genotype imputation: a meta-analysis. Transl. Psychiatry14, 296. 10.1038/s41398-024-02981-1
33
Lüdecke D. (2018). Esc: effect size computation for Meta analysis. 10.5281/zenodo.1249218
34
Maranville J. C. Cox N. J. (2016). Pharmacogenomic variants have larger effect sizes than genetic variants associated with other dichotomous complex traits. Pharmacogenomics J.16, 388–392. 10.1038/tpj.2015.47
35
Masimirembwa C. Dandara C. Hasler J. (2014). Chapter 43 - population diversity and pharmacogenomics in Africa. In: Handbook of pharmacogenomics and stratified medicine. PadmanabhanS., editor. San Diego: Academic Press, 971–998. 10.1016/B978-0-12-386882-4.00043-8
36
Moher D. Liberati A. Tetzlaff J. Altman D. G. PRISMA Group (2010). Preferred reporting items for systematic reviews and meta-analyses: the PRISMA statement. Int. J. Surg.8, 336–341. 10.1016/j.ijsu.2010.02.007
37
Nakagawa S. Lagisz M. O’Dea R. E. Rutkowska J. Yang Y. Noble D. W. A. et al (2021). The orchard plot: cultivating a forest plot for use in ecology, evolution, and beyond. Res. Synth. Methods12 (1), 4–12. 10.1002/jrsm.1424
38
Netherlands eScience Center & DANS (2020). Five recommendations for FAIR research software. FAIR Res. Softw. Available online at: https://fair-software.nl/home (Accessed November 18, 2025).
39
Nutt D. J. (2025). Drug development in psychiatry: 50 years of failure and how to resuscitate it. Lancet Psychiatry12, 228–238. 10.1016/S2215-0366(24)00370-5
40
Pardiñas A. F. Owen M. J. Walters J. T. R. (2021). Pharmacogenomics: a road ahead for precision medicine in psychiatry. Neuron109, 3914–3929. 10.1016/j.neuron.2021.09.011
41
Pirmohamed M. Park B. K. (2001). Genetic susceptibility to adverse drug reactions. Trends Pharmacol. Sci.22, 298–305. 10.1016/S0165-6147(00)01717-X
42
PlotDigitizer (2025). PlotDigitizer Version 3.1.6. Available online at: https://plotdigitizer.com.
43
Popejoy A. B. (2019). Diversity in precision medicine and pharmacogenetics: methodological and conceptual considerations for broadening participation. Pharmacogenomics Pers. Med.12, 257–271. 10.2147/PGPM.S179742
44
Pustejovsky J. (2024). clubSandwich: cluster-robust (Sandwich) variance estimators with small-sample corrections. Available online at: http://jepusto.github.io/clubSandwich/.
45
R Core Team (2021). R: a language and environment for statistical computing. Available online at: https://www.R-project.org/.
46
Roden D. M. Altman R. B. Benowitz N. L. Flockhart D. A. Giacomini K. M. Johnson J. A. et al (2006). Pharmacogenomics: challenges and opportunities. Ann. Intern. Med.145, 749–757. 10.7326/0003-4819-145-10-200611210-00007
47
Roden D. M. McLeod H. L. Relling M. V. Williams M. S. Mensah G. A. Peterson J. F. et al (2019). Pharmacogenomics. Lancet394, 521–532. 10.1016/S0140-6736(19)31276-0
48
Rodgers M. A. Pustejovsky J. E. (2021). Evaluating meta-analytic methods to detect selective reporting in the presence of dependent effect sizes. Psychol. Methods26, 141–160. 10.1037/met0000300
49
Simon N. von Fabeck K. (2025). Are plasma drug concentrations still necessary? Rethinking the pharmacokinetic link in dose–response relationships. Front. Pharmacol.16, 1660323. 10.3389/fphar.2025.1660323
50
Sluis S. Verhage M. Posthuma D. Dolan C. V. (2010). Phenotypic complexity, measurement bias, and poor phenotypic resolution contribute to the missing heritability problem in genetic association studies. PLos One5, e13929. 10.1371/journal.pone.0013929
51
Spina E. de Leon J. (2015). Clinical applications of CYP genotyping in psychiatry. J. Neural Transm.122, 5–28. 10.1007/s00702-014-1300-5
52
Stern S. Linker S. Vadodaria K. C. Marchetto M. C. Gage F. H. (2018). Prediction of response to drug therapy in psychiatric disorders. Open Biol.8, 180031. 10.1098/rsob.180031
53
Teng Y. Sandhu A. Liemburg E. J. Naderi E. Alizadeh B. Z. (2023). The progress and pitfalls of pharmacogenetics-based precision medicine in schizophrenia spectrum disorders: a systematic review and meta-analysis. J. Pers. Med.13, 471. 10.3390/jpm13030471
54
van Zwet E. Gelman A. (2022). A proposal for informative default priors scaled by the standard error of estimates. Am. Stat.76, 1–9. 10.1080/00031305.2021.1938225
55
Viechtbauer W. (2010). Conducting meta-analyses in R with the metafor package. J. Stat. Softw.36, 1–48. 10.18637/jss.v036.i03
56
Wan X. Wang W. Liu J. Tong T. (2014). Estimating the sample mean and standard deviation from the sample size, median, range and/or interquartile range. BMC Med. Res. Methodol.14, 135. 10.1186/1471-2288-14-135
57
Whirl-Carrillo M. Huddart R. Gong L. Sangkuhl K. Thorn C. F. Whaley R. et al (2021). An evidence-based framework for evaluating pharmacogenomics knowledge for personalized medicine. Clin. Pharmacol. Ther.110, 563–572. 10.1002/cpt.2350
58
Wu A. H. B. (2015). Pharmacogenomic testing and response to warfarin. Lancet385, 2231–2232. 10.1016/S0140-6736(14)62219-4
59
Zhang L. Brown S. J. Shan Y. Lee A. M. Allen J. D. Eum S. et al (2020). CYP2D6 genetic polymorphisms and risperidone pharmacokinetics: a systematic review and meta-analysis. Pharmacother. J. Hum. Pharmacol. Drug Ther.40, 632–647. 10.1002/phar.2434
60
Zhao M. Ma J. Li M. Zhang Y. Jiang B. Zhao X. et al (2021). Cytochrome P450 enzymes and drug metabolism in humans. Int. J. Mol. Sci.22, 12808. 10.3390/ijms222312808
61
Zöllner S. Pritchard J. K. (2007). Overcoming the winner’s curse: estimating penetrance parameters from case-control data. Am. J. Hum. Genet.80, 605–615. 10.1086/512821
62
Zwetsloot P.-P. Van Der Naald M. Sena E. S. Howells D. W. IntHout J. De Groot J. A. et al (2017). Standardized mean differences cause funnel plot distortion in publication bias assessments. eLife6, e24260. 10.7554/eLife.24260
Summary
Keywords
antidepressant, antipsychotic, meta-analysis, metaboliser status, pharmacodynamics, pharmacokinetics, statistical power, winner’s curse
Citation
Lock SK, Kappel DB, Hutton J, Simmonds E, Legge SE, O'Donovan MC and Pardiñas AF (2026) Near, far, wherever you are: phenotype-related variation in pharmacogenomic effect sizes across the psychiatric drug literature. Front. Pharmacol. 16:1719761. doi: 10.3389/fphar.2025.1719761
Received
06 October 2025
Revised
03 December 2025
Accepted
22 December 2025
Published
16 January 2026
Volume
16 - 2025
Edited by
Janko Samardzic, University of Belgrade, Serbia
Reviewed by
Kariofyllis Karamperis, University of Patras, Greece
Michal Korostynski, Institute of Pharmacology PAS, Poland
Updates
Copyright
© 2026 Lock, Kappel, Hutton, Simmonds, Legge, O'Donovan and Pardiñas.
This is an open-access article distributed under the terms of the Creative Commons Attribution License (CC BY). The use, distribution or reproduction in other forums is permitted, provided the original author(s) and the copyright owner(s) are credited and that the original publication in this journal is cited, in accordance with accepted academic practice. No use, distribution or reproduction is permitted which does not comply with these terms.
*Correspondence: Antonio F. Pardiñas, pardinasa@cardiff.ac.uk
Disclaimer
All claims expressed in this article are solely those of the authors and do not necessarily represent those of their affiliated organizations, or those of the publisher, the editors and the reviewers. Any product that may be evaluated in this article or claim that may be made by its manufacturer is not guaranteed or endorsed by the publisher.