 Leonardo Bonilha
 Travis Nesland
 Chris Rorden
 Julius Fridriksson
- 1Department of Neurosciences, Medical University of South Carolina, Charleston, SC, USA
- 2Department of Psychology, University of South Carolina, Columbia, SC, USA
- 3Department of Communication Sciences and Disorders, University of South Carolina, Columbia, SC, USA
Background: It is now possible to map neural connections in vivo across the whole brain (i.e., the brain connectome). This is a promising development in neuroscience since many health and disease processes are believed to arise from the architecture of neural networks.
Objective: To describe the normal range of hemispheric asymmetry in structural connectivity in healthy older adults.
Materials and Methods: We obtained high-resolution structural magnetic resonance images (MRI) from 17 healthy older adults. For each subject, the brain connectome was reconstructed by parcelating the probabilistic map of gray matter into anatomically defined regions of interested (ROIs). White matter fiber tractography was reconstructed from diffusion tensor imaging and streamlines connecting gray matter ROIs were computed. Asymmetry indices were calculated regarding ROI connectivity (representing the sum of connectivity weight of each cortical ROI) and for regional white matter links. All asymmetry measures were compared to a normal distribution with mean = 0 through one-sample t-tests.
Results: Leftward cortical ROI asymmetry was observed in medial temporal, dorsolateral frontal, and occipital regions. Rightward cortical ROI asymmetry was observed in middle temporal and orbito-frontal regions. Link-wise asymmetry revealed stronger connections in the left hemisphere between the medial temporal, anterior, and posterior peri-Sylvian and occipito-temporal regions. Rightward link asymmetry was observed in lateral temporal, parietal, and dorsolateral frontal connections.
Conclusion: We postulate that asymmetry of specific connections may be related to functional hemispheric organization. This study may provide reference for future studies evaluating the architecture of the connectome in health and disease processes in older individuals.
Introduction
With recent advances in structural neuroimaging, it is now possible to track medium and large-scale pathways of white matter fibers and to construct the map of neural connectivity across the entire brain (the brain connectome) (1, 2). The brain connectome constitutes a promising development in neuropsychiatry since many physiological and pathological processes are believed to affect the architecture of neural networks (3–6). For example, normal cognitive development spanning from childhood to senior years is traditionally believed to be associated with maturation of neural networks supporting cognitive domains such as attention (7), memory (8), language (9), and executive function (10). Similarly, neurological diseases including epilepsy and dementia are associated with pathological rearrangements or impoverishment of normal networks at a systems level (11, 12). Furthermore, psychiatric diseases such as schizophrenia (13), bipolar disorder (14), and addiction (15) are related to reinforcements of pathological networks.
In order to better understand how different biological processes affect the normal connectome, it is important to accurately characterize the connectome organization in healthy individuals. Specifically, it is important to define the degree of individual variability and hemispheric asymmetry that can be expected from the normal population.
Since hemispheric asymmetry is abnormal in neuropsychiatric diseases such as schizophrenia (16), bipolar disorder (17, 18), and depression (19), in this study we aimed to describe the patterns of hemispheric asymmetry and individual variability of the brain connectome obtained from a cohort of healthy senior individuals. We employed high-resolution magnetic resonance images (MRI) to reconstruct structural brain connectivity based upon white matter pathways linking anatomically defined cortical regions of interest (ROIs). We aimed to describe the group-wise distribution of asymmetries involving cortical connectivity and white matter pathways.
Materials and Methods
Subjects
We studied 17 right-handed healthy subjects (mean age 53 years, SD = 7 years, range = 40–76) who were recruited from the local community. None of the subjects had a history of neurological, psychiatric, or chronic medical illnesses. All patients signed an informed consent to participate in this study. The Institutional Review Board at the University of South Carolina approved this study.
Image Acquisition
All subjects underwent MRI scanning at a 3T Siemens Trio equipped with a 12-channel head coil located at the University of South Carolina, yielding: (1) T1-weighed images (3D MP-RAGE, TR = 2250 ms, TE = 4.15 ms, 256 × 256 matrix, 256 mm × 256 mm FOV, parallel imaging GRAPPA = 2, 80 reference lines, TA = 377 s); and (2) Diffusion weighted images (dMRI)-EPI scan (30-directions with b = 1000 s/mm2 and b = 2000 s/mm2, TR = 6100 ms, TE = 101 ms, 82 × 82 matrix, 222 mm × 222 mm FOV, parallel imaging GRAPPA = 2, 80, 45 contiguous 2.7 mm axial slices, TA = 390 s).
Image Pre-Processing
The construction of the connectome involved two parallels pre-processing steps, namely, the segmentation of the cerebral cortex into multiple anatomical ROIs and reconstruction of white matter fibers. These steps are explained below:
Segmentation of the Cerebral Cortex
T1-weighted MR images were converted into NIfTI format utilizing the dcm2nii tool from the MRIcron software package (20). Images in native space were non-linearly normalized into standard MNI space using the Clinical Toolbox (21) employing unified segmentation-normalization routines as part of the software Statistical Parametric Mapping (SPM8). Of note, the Clinical Toolbox was particularly designed to accurately quantify tissue volumes in seniors and older adults (21).
This step yielded probabilistic maps of gray and white matter in MNI space.
Next, the base b = 0 T2-weighted dMRI volume was linearly transformed to standard space utilizing a boundary-based registration approach (22). This step was performed using FMRIB’s Linear Image Registration Tool (FLIRT), as part of FMRIB Software Library (FSL) (23). The registration parameters were then used to transform the Automated Anatomical Labeling (AAL) atlas (24) and the white and gray matter probabilistic maps onto the dMRI space. Once in dMRI space, a map of cortical regions segmented according to AAL was obtained by overlaying the registered AAL atlas onto the registered probabilistic gray matter map. The intersection between these images (including only voxels with a probability greater than 50% of being gray matter) represented the segmented cortical map. A list describing all ROIs used in this study can be observed in Table A1 in Appendix.
White Matter Fiber Reconstruction
Extraction of diffusion gradients was performed with dcm2nii (20). The dMRI volumes were aligned to the b = 0 dMRI image using the FSL FLIRT tool (23). In diffusion space, whole brain tractography was reconstructed with the software Diffusion Toolkit (25) according to the following parameters: (1) angle threshold = 45°, (2) inclusion mask derived from the average of diffusion weighted signal and from the white matter probabilistic map registered to dMRI space, (3) FACT propagation algorithm, (4) spline filter.
Calculation of the Connectome
From each patient, the path of each tractography streamline was assessed. All streamlines were seeded in white matter, and the end-points of each streamline were computed. Streamlines with end-points within ROIs were counted as links between these ROIs. Streamlines with end-points outside ROIs were discarded. After all streamlines were assessed, the result was a weighted connectivity matrix A, where the entry Aij represented the number of streamlines connecting regions i and j (i.e., the weighted link between i and j). Note that only direct links between regions i and j were included in the link Aij.
Finally, each link weight was corrected based on the surface of the connected ROIs and the distance between the ROIs, as proposed by Hagmann et al., where the link weight is inversely proportional to the sum of the linked ROI surfaces and fiber length, in order to account for tractography bias related to size of connected ROIs and distance traveled by the streamline (2).
Connectome Asymmetry
Asymmetry was evaluated for ROIs and for links
Regions of interested asymmetry was calculated by assessing the sum of link weights connecting an ROI, in comparison with the homologous ROI in the contralateral hemisphere. The connectivity of each ROI was computed without discrimination regarding the opposite end of the streamline. For example, when computing the connectivity of the left hippocampus, all possible connections of the left hippocampus were computed, including connections to ROIs in the ipsilateral and contralateral hemispheres. Connections of the left hippocampus to itself or to the contralateral hippocampus were discarded.
For each ROI, cortical connectivity asymmetry was calculated according to the following asymmetry index (AI) = (R-L)/[(R + L)/2]; where L represents the connectivity of the ROI in the left hemisphere and R represents the connectivity of the ROI in the homologous ROI in the right hemisphere. A one-sample t-test was performed to evaluate whether the distribution of ROI asymmetries across all subjects was statistically different than a distribution with mean = 0. This step was performed for each ROI. Note that ROI asymmetry represents the sum of connections to an ROI, irrespective to which other ROI is being linked to that ROI. Thus, ROI asymmetry should be interpreted in the context of link-wise asymmetry.
Link-wise hemispheric asymmetry was calculated by assessing the difference in weight for each link, according to the same asymmetry index AI = (R-L)/[(R + L)/2]; where L represents the link between ROIs within the left hemisphere and R represents the link between the homologous ROIs within the right hemisphere. Note that inter-hemispheric connections were excluded from this calculation. Cerebellar links were also excluded. Only supratentorial links within the same hemisphere were assessed. A one-sample t-test was performed to evaluate whether the distribution of asymmetries for each link across subjects was statistically different than a distribution with mean = 0.
Results
The average connectivity matrix is demonstrated in Figure 1. The ROIs are numbered in accordance with the glossary from Table A1 in Appendix. Briefly, regions 1–45 represent ROIs located in the left hemisphere, whilst regions 46–90 represent ROIs located in the right hemisphere. As such, within the average connectivity matrix with 90 × 90 entries, the upper left quadrant demonstrates links between ROIs in the left hemisphere, and the lower right quadrant demonstrates links between ROIs within the right hemisphere. The right upper and the left lower quadrants of the connectivity matrix represent reciprocal left to right connections. Since connections are not directed (i.e., the strength of connectivity from region i to j is the same as the connectivity from region j to i), the matrix is symmetrical along its main diagonal. As expected, links within the same hemisphere exhibited a higher weight compared with connectivity links between different hemispheres.
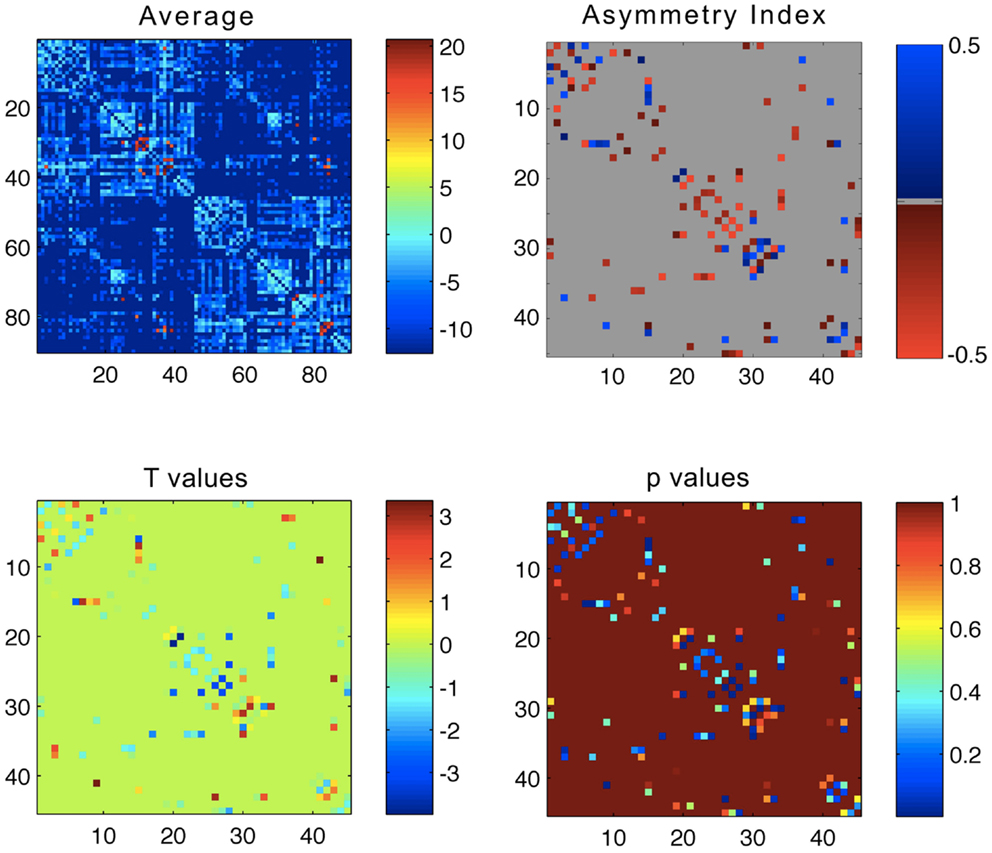
Figure 1. Upper left panel: average connectivity matrix from all subjects – the scale bar represents log(connectivity weight). Upper right panel – link-wise average asymmetry index. Lower left panel – T values from a one-sample t-test evaluating the differences between the asymmetry indices and a distribution with mean = 0. Lower right panel – p values from the one-sample t-test. For all plots, the x- and y-axis represent ROIs numbered from 1 to 90 in accordance, where ROIs 1–45 are located in the left hemisphere, and 46–90 in the right hemisphere. The legend for ROI numbering can be seen in Table A1 in Appendix.
The average link-wise hemispheric asymmetry is also demonstrated in Figure 1. This matrix only includes 45 × 45 entries, where each cell represents the asymmetry index for each link. In order to avoid false estimations of asymmetry in links that were tracked only in a few subjects, we only included links that were tracked in greater than 75% of subjects (i.e., at least 13/17 subjects). Each matrix cell represents the asymmetry index for the connection between the ROI listed in the column and the ipsilateral ROI listed in the row. The ROIs are numbered in accordance with Table A1 in Appendix (from 1 to 45, regardless of side).
The distribution of ROI asymmetries is shown in Figure 2. The box-plot demonstrates the range of asymmetries across all subjects for each ROI. As expected, there were no regions of extreme asymmetry. A one-sample t-test revealed that among all possible 45 ROIs, a significant leftward asymmetry was noted on the inferior occipital region, fusiform gyrus, lingual gyrus, parahippocampal gyrus, amygdala, inferior frontal operculum, superior frontal gyrus, and mid cingulate gyrus. Conversely, a rightward asymmetry was noted for the middle temporal gyrus and superior frontal orbital region. These results are shown in Table 1.
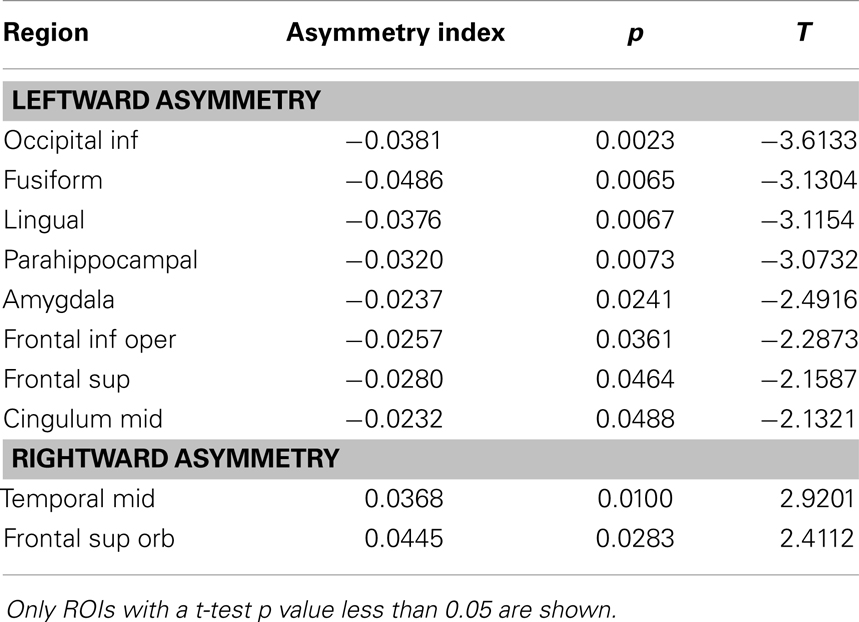
Table 1. Asymmetry of cortical ROI global connectivity.
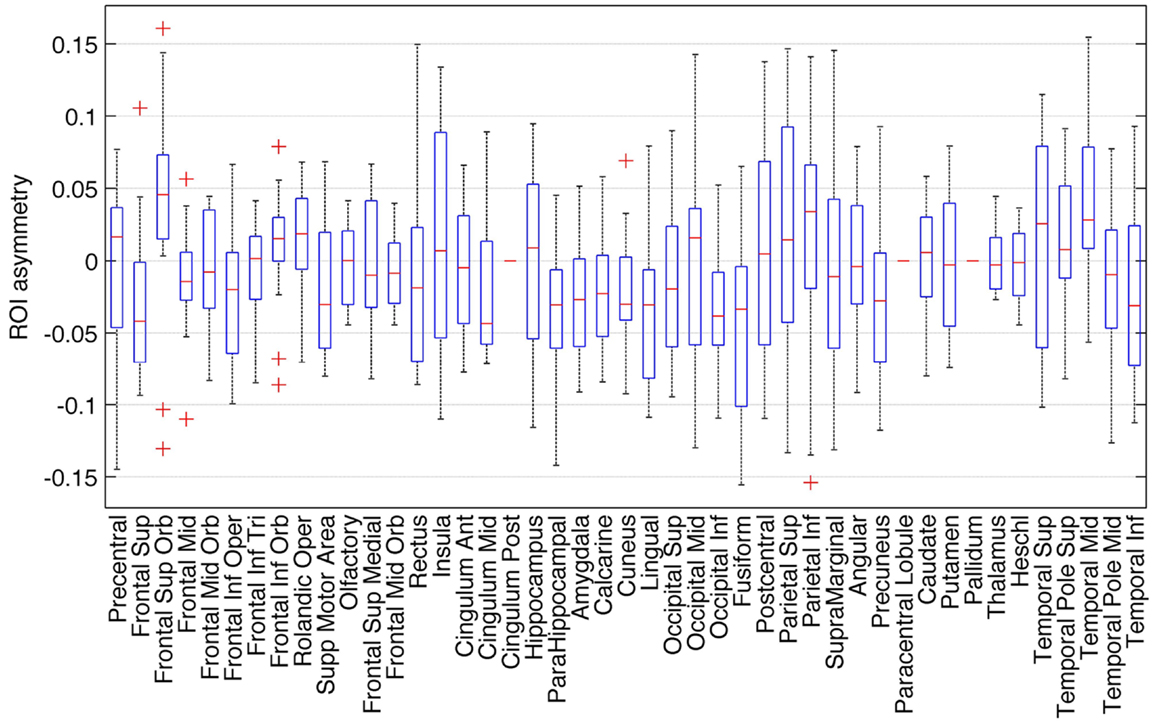
Figure 2. Box-plot demonstrating the distribution of asymmetry indices for all ROIs. Positive asymmetry indices represent a leftward asymmetry.
Link-wise asymmetry was observed toward both hemispheres. A significant leftward asymmetry was noted on the following reciprocal connections: amydgala to parahippocampal gyrus; middle to inferior occipital regions; fusiform to lingual gyri; fusiform to occipital inferior gyrus; insula to inferior frontal opercular region; fusiform to parahippocampal gyrus; precuneus to lingual gyrus; angular to superior parietal region; precuneus to mid cinculate gyrus. Conversely, a significant rightward asymmetry was noted on the following reciprocal connections: superior temporal gyrus to rolandic opercular region; middle temporal gyrus to middle occipital region; inferior to superior parietal regions; insula to inferior frontal triangularis region; precuneus to superior parietal region. These results are summarized in Table 2.
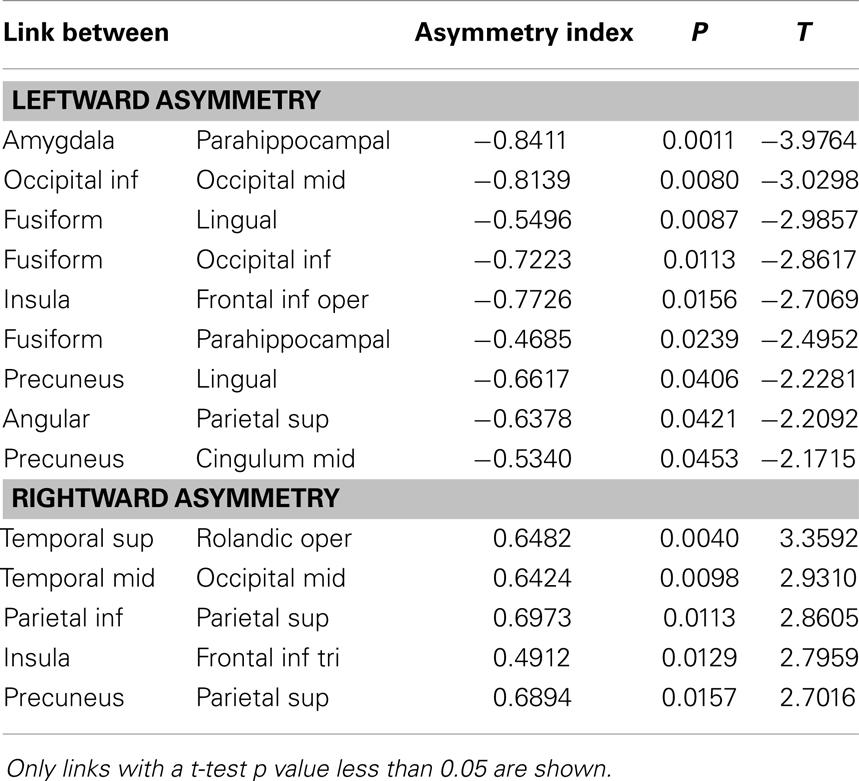
Table 2. Asymmetry of cortical links.
These results are demonstrated in Figure 1, which shows the distribution of T scores and p values for all links, represented in 45 × 45 matrices, where each matrix cell demonstrates the T value or the p value for the asymmetry distribution for the connection between the row ROI and the column ROI. Figure 3 demonstrates the anatomical distribution of links with an absolute mean asymmetry higher than 0.5. The three-dimensional anatomical reconstruction of regional links was defined based on an in-house developed atlas of anatomical connectivity involving all 90 ROIs used in this study. The location of travel of all streamlines connecting each possible pair of ROIs was defined based on the spatial distribution of center points (or “centroid”) of serial transverse sections across the white matter streamlines corresponding to each link, through an in-house modified version of the methods described by Garyfallidis et al (26). The centroids for each link were connected to define the main pathway of streamline travel. This step was repeated for all possible links. The utility of this approach was exclusively for anatomical visualization of the results, as demonstrated in Figure 3.
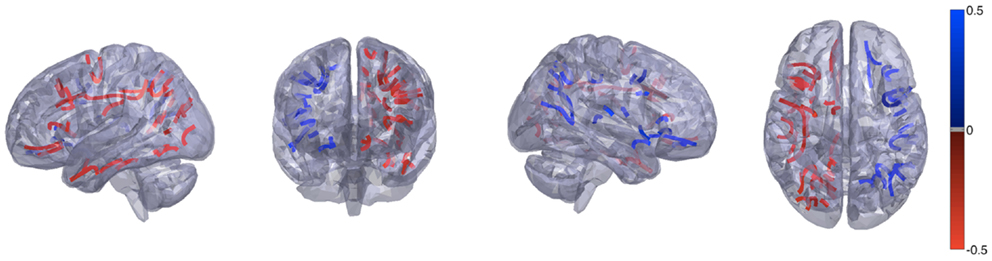
Figure 3. Anatomical demonstration of the location of links with an absolute asymmetry index greater than 0.5. Links in red exhibit a leftward asymmetry, while links in blue demonstrate a rightward asymmetry.
Discussion
In this study, we investigated the individual variability of hemispheric asymmetry in structural connectivity in healthy senior individuals. By reconstructing the structural connectome from each subject, and by assessing the distribution of asymmetry indices related to cortical ROI connectivity and link weight, we observed that, within a sample composed of healthy older adults, there was mild but noticeable hemispheric asymmetry in structural connectivity.
We observed a more prominent leftward asymmetry in cortical connectivity, i.e., a larger number of regions demonstrated a higher degree of connectivity in the left hemisphere. Specifically, cortical ROIs located in the occipital lobe, medial temporal, dorsolateral and medial frontal lobe and cingulate exhibited a higher weight of connectivity in the left hemisphere. Conversely, fewer cortical regions demonstrated a rightward asymmetry, with the middle temporal gyrus and the orbito-frontal regions exhibiting a significantly higher cortical connectivity on the right hemisphere.
In turn, we also observed regional hemispheric asymmetry in relationship with the strength of connectivity between specific ROIs. In accordance with the previous observation about global cortical connectivity, a leftward asymmetry was also more commonly observed among links. Interestingly, a leftward asymmetry was observed on peri-Sylvian and medial temporal – occipital regions. Conversely, a rightward asymmetry was noted on lateral temporal – frontal – occipital and parietal links. While did not test the relationship between these links and cognitive performance, it is possible to speculate that some lateral asymmetry may be related to functional specialization of some of these connections. For instance, leftward asymmetry may be associated with dominant hemisphere language processing involving verbal memory (parahippocampal – amydala connections) (27), phonological processing (insula – frontal operculum connections) (28), and semantic retrieval (29) (angular gyrus – superior parietal connections). Conversely, a rightward asymmetry may be observed in networks associated with visual-spatial processing (30) (intraparietal connections, precuneus-parietal connections).
It should be noted that we adopted a liberal statistical threshold (i.e., the level of statistical significance from the one-sample t-tests was not corrected based on multiple comparisons). We adopted a liberal threshold since we expected that the degree of asymmetry exhibited by our population would be mild, and given the number of multiple comparisons, a more stringent threshold would preclude the evaluation of the locations with a higher degree of asymmetry. Nonetheless, given our sample size, it is possible that some of our observed asymmetries may be related to sample bias and may constitute false positives. For this reason, we recommend the interpretation of the results from this manuscript in this context. The asymmetry index is possibly a better representation of the magnitude of asymmetry, rather than over-emphasizing the importance of links or ROIs with p < 0.05.
The results reported in this study should help the contextual evaluation of other connectome studies applied to health and disease. We demonstrated the range of asymmetry in a small cohort of normal older adults with the purpose of providing a reference for future studies evaluating processes that affect neural network organization. Thus, future studies should also be interpreted with special attention to specific characteristics of the demographics from the population studied.
Conflict of Interest Statement
The authors declare that the research was conducted in the absence of any commercial or financial relationships that could be construed as a potential conflict of interest.
References
1. Hagmann P, Cammoun L, Gigandet X, Gerhard S, Grant PE, Wedeen V, et al. MR connectomics: principles and challenges. J Neurosci Methods (2010) 194(1):34–45. doi:10.1016/j.jneumeth.2010.01.014
2. Hagmann P, Cammoun L, Gigandet X, Meuli R, Honey CJ, Wedeen VJ, et al. Mapping the structural core of human cerebral cortex. PLoS Biol (2008) 6(7):e159. doi:10.1371/journal.pbio.0060159
3. Sporns O. The human connectome: origins and challenges. Neuroimage (2013) 80:53–61. doi:10.1016/j.neuroimage.2013.03.023
4. Leergaard TB, Hilgetag CC, Sporns O. Mapping the connectome: multi-level analysis of brain connectivity. Front Neuroinform (2012) 6:14. doi:10.3389/fninf.2012.00014
5. Sporns O. From simple graphs to the connectome: networks in neuroimaging. Neuroimage (2012) 62(2):881–6. doi:10.1016/j.neuroimage.2011.08.085
6. Bullmore E, Sporns O. The economy of brain network organization. Nat Rev Neurosci (2012) 13(5):336–49. doi:10.1038/nrn3214
7. Rueda MR, Fan J, McCandliss BD, Halparin JD, Gruber DB, Lercari LP, et al. Development of attentional networks in childhood. Neuropsychologia (2004) 42(8):1029–40. doi:10.1016/j.neuropsychologia.2003.12.012
8. Klingberg T. Development of a superior frontal-intraparietal network for visuo-spatial working memory. Neuropsychologia (2006) 44(11):2171–7. doi:10.1016/j.neuropsychologia.2005.11.019
9. Glasser MF, Rilling JK. DTI tractography of the human brain’s language pathways. Cereb Cortex (2008) 18(11):2471–82. doi:10.1093/cercor/bhn011
10. Kantarci K, Senjem ML, Avula R, Zhang B, Samikoglu AR, Weigand SD, et al. Diffusion tensor imaging and cognitive function in older adults with no dementia. Neurology (2011) 77(1):26–34. doi:10.1212/WNL.0b013e31822313dc
11. Richardson MP. Large scale brain models of epilepsy: dynamics meets connectomics. J Neurol Neurosurg Psychiatry (2012) 83(12):1238–48. doi:10.1136/jnnp-2011-301944
12. Lo CY, Wang PN, Chou KH, Wang J, He Y, Lin CP. Diffusion tensor tractography reveals abnormal topological organization in structural cortical networks in Alzheimer’s disease. J Neurosci (2010) 30(50):16876–85. doi:10.1523/JNEUROSCI.4136-10.2010
13. Quan M, Lee SH, Kubicki M, Kikinis Z, Rathi Y, Seidman LJ, et al. White matter tract abnormalities between rostral middle frontal gyrus, inferior frontal gyrus and striatum in first-episode schizophrenia. Schizophr Res (2013) 145(1–3):1–10. doi:10.1016/j.schres.2012.11.028
14. Chan WY, Yang GL, Chia MY, Woon PS, Lee J, Keefe R, et al. Cortical and subcortical white matter abnormalities in adults with remitted first-episode mania revealed by tract-based spatial statistics. Bipolar Disord (2010) 12(4):383–9. doi:10.1111/j.1399-5618.2010.00829.x
15. Sutherland MT, McHugh MJ, Pariyadath V, Stein EA. Resting state functional connectivity in addiction: lessons learned and a road ahead. Neuroimage (2012) 62(4):2281–95. doi:10.1016/j.neuroimage.2012.01.117
16. Oertel-Knochel V, Knochel C, Stablein M, Linden DE. Abnormal functional and structural asymmetry as biomarker for schizophrenia. Curr Top Med Chem (2012) 12(21):2434–51. doi:10.2174/1568026611212210014
17. Brown GG, Lee JS, Strigo IA, Caligiuri MP, Meloy MJ, Lohr J. Voxel-based morphometry of patients with schizophrenia or bipolar I disorder: a matched control study. Psychiatry Res (2011) 194(2):149–56. doi:10.1016/j.pscychresns.2011.05.005
18. Caligiuri MP, Brown GG, Meloy MJ, Eyler LT, Kindermann SS, Eberson S, et al. A functional magnetic resonance imaging study of cortical asymmetry in bipolar disorder. Bipolar Disord (2004) 6(3):183–96. doi:10.1111/j.1399-5618.2004.00116.x
19. Rotenberg VS. Functional brain asymmetry as a determinative factor in the treatment of depression: theoretical implications. Prog Neuropsychopharmacol Biol Psychiatry (2008) 32(8):1772–7. doi:10.1016/j.pnpbp.2008.08.011
21. Rorden C, Bonilha L, Fridriksson J, Bender B, Karnath HO. Age-specific CT and MRI templates for spatial normalization. Neuroimage (2012) 61(4):957–65. doi:10.1016/j.neuroimage.2012.03.020
22. Greve DN, Fischl B. Accurate and robust brain image alignment using boundary-based registration. Neuroimage (2009) 48(1):63–72. doi:10.1016/j.neuroimage.2009.06.060
23. Jenkinson M, Bannister P, Brady M, Smith S. Improved optimization for the robust and accurate linear registration and motion correction of brain images. Neuroimage (2002) 17(2):825–41. doi:10.1006/nimg.2002.1132
24. Tzourio-Mazoyer N, Landeau B, Papathanassiou D, Crivello F, Etard O, Delcroix N, et al. Automated anatomical labeling of activations in SPM using a macroscopic anatomical parcellation of the MNI MRI single-subject brain. Neuroimage (2002) 15(1):273–89. doi:10.1006/nimg.2001.0978
25. Wang R, Benner T, Sorensen AG, Wedeen VJ. Diffusion toolkit: a software package for diffusion imaging data processing and tractography. Proc Intl Soc Mag Reson Med (2007). Avalilable from: http://cds.ismrm.org/ismrm-2007/files/03720.pdf
26. Garyfallidis E, Brett M, Correia MM, Williams GB, Nimmo-Smith I. Quick-Bundles, a method for tractography simplification. Front Neurosci (2012) 6:175. doi:10.3389/fnins.2012.00175
27. Cipolotti L, Bird CM. Amnesia and the hippocampus. Curr Opin Neurol (2006) 19(6):593–8. doi:10.1097/01.wco.0000247608.42320.f9
28. Schwartz MF, Faseyitan O, Kim J, Coslett HB. The dorsal stream contribution to phonological retrieval in object naming. Brain (2012) 135(Pt 12):3799–814. doi:10.1093/brain/aws300
29. Cloutman L, Gottesman R, Chaudhry P, Davis C, Kleinman JT, Pawlak M, et al. Where (in the brain) do semantic errors come from? Cortex (2009) 45(5):641–9. doi:10.1016/j.cortex.2008.05.013
30. Karnath HO, Rorden C. The anatomy of spatial neglect. Neuropsychologia (2012) 50(6):1010–7. doi:10.1016/j.neuropsychologia.2011.06.027
Appendix
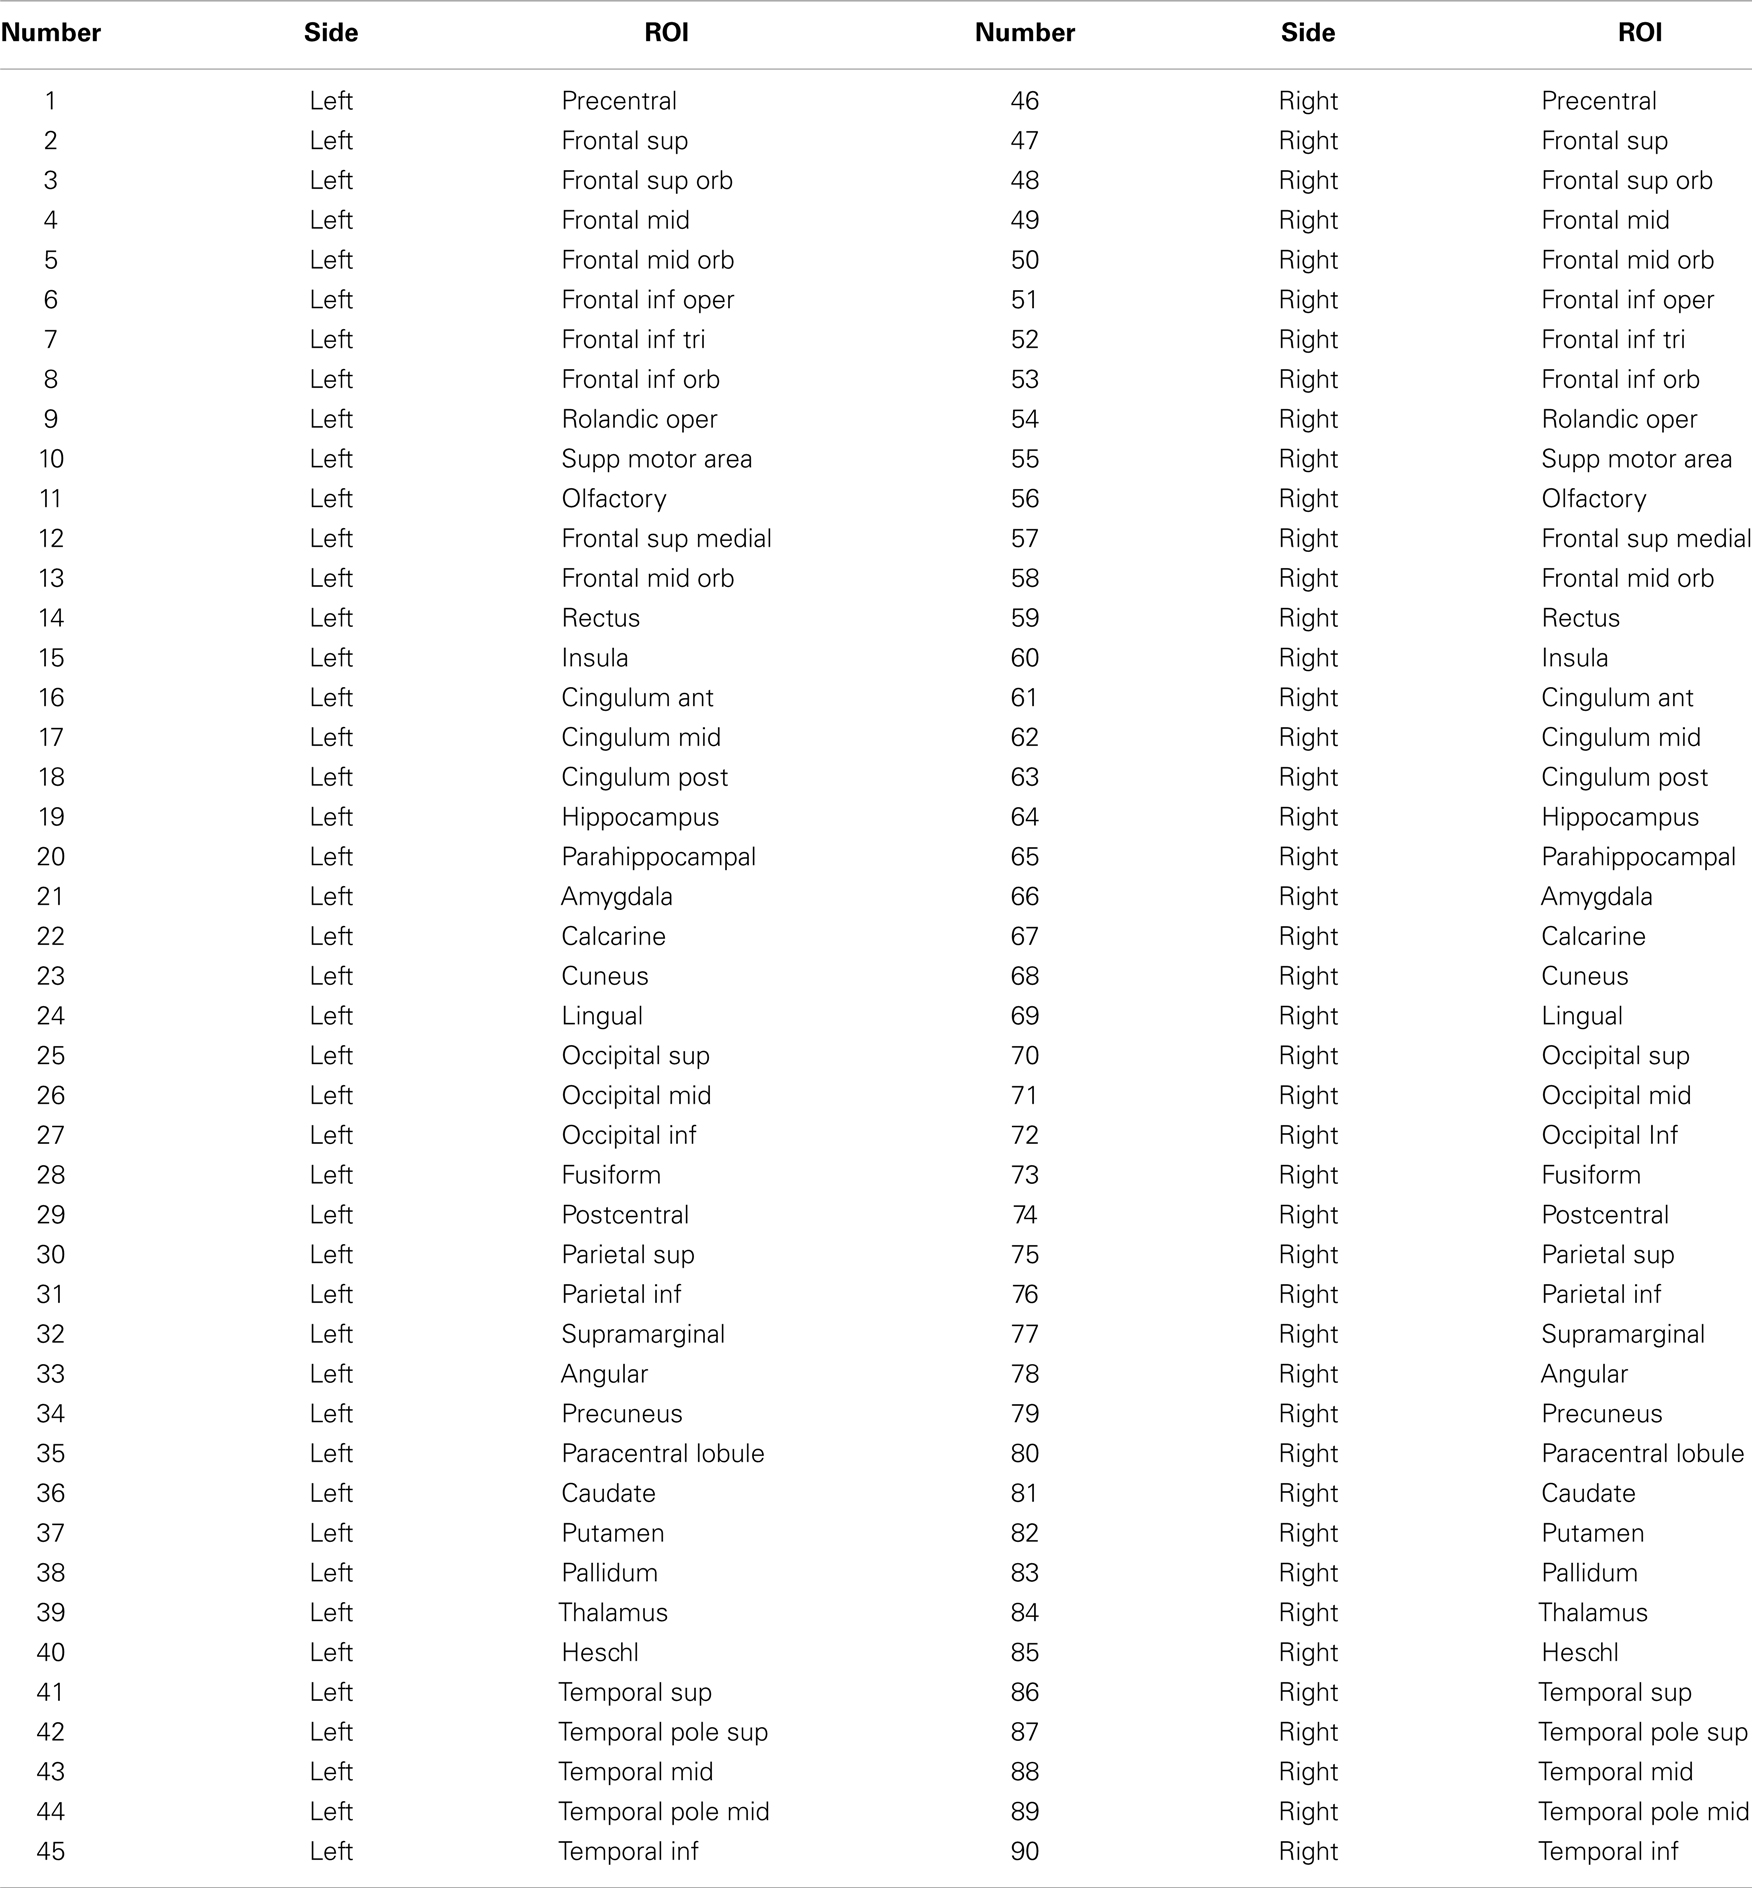
Table A1. Legends for ROI numbering.
Keywords: asymmetry, structural connectome, connectivity, diffusion tensor imaging, aging
Citation: Bonilha L, Nesland T, Rorden C and Fridriksson J (2014) Asymmetry of the structural brain connectome in healthy older adults. Front. Psychiatry 4:186. doi: 10.3389/fpsyt.2013.00186
Received: 01 October 2013; Accepted: 23 December 2013;
Published online: 09 January 2014.
Edited by:
Qiyong Gong, West China Hospital of Sichuan University, ChinaReviewed by:
James Gee, University of Pennsylvania, USASu Lui, West China Hospital of Sichuan University, China
Copyright: © 2014 Bonilha, Nesland, Rorden and Fridriksson. This is an open-access article distributed under the terms of the Creative Commons Attribution License (CC BY). The use, distribution or reproduction in other forums is permitted, provided the original author(s) or licensor are credited and that the original publication in this journal is cited, in accordance with accepted academic practice. No use, distribution or reproduction is permitted which does not comply with these terms.
*Correspondence: Leonardo Bonilha, Department of Neurology, Comprehensive Epilepsy Center, Medical University of South Carolina, 96 Jonathan Lucas Street, Suite 301 CSB, Charleston, SC 29425, USA e-mail:Ym9uaWxoYUBtdXNjLmVkdQ==