 Takuya Ishida
 Thomas Dierks3
 Yosuke Morishima
- 1Center for Evolutionary Cognitive Sciences, Graduate School of Arts and Sciences, The University of Tokyo, Meguro-ku, Japan
- 2Department of Neuropsychiatry, Graduate School of Wakayama Medical University, Kimiidera, Japan
- 3Division of Systems Neuroscience of Psychopathology, Translational Research Centre, University Hospital of Psychiatry, University of Bern, Bern, Switzerland
- 4University Hospital of Psychiatry, University of Bern, Bern, Switzerland
Despite being a commonly used protocol to treat major depressive disorder (MDD), the underlying mechanism of repetitive transcranial magnetic stimulation (rTMS) on dorsolateral prefrontal cortex (DLPFC) remains unclear. In the current study, we investigated the resting-state fMRI data of 100 healthy subjects by exploring three overlapping functional networks associated with the psychopathologically MDD-related areas (the nucleus accumbens, amygdala, and ventromedial prefrontal cortex). Our results showed that these networks converged at the bilateral DLPFC, which suggested that rTMS over DLPFC might improve MDD by remotely modulating the MDD-related areas synergistically. Additionally, they functionally converged at the DMPFC and bilateral insula which are known to be associated with MDD. These two areas could also be potential targets for rTMS treatment. Dynamic causal modelling (DCM) and Granger causality analysis (GCA) revealed that all pairwise connections among bilateral DLPFC, DMPFC, bilateral insula, and three psychopathologically MDD-related areas contained significant causality. The DCM results also suggested that most of the functional interactions between MDD-related areas and bilateral DLPFC, DMPFC, and bilateral insula can predominantly be explained by the effective connectivity from the psychopathologically MDD-related areas to the rTMS stimulation sites. Finally, we found the conventional functional connectivity to be a more representative measure to obtain connectivity parameters compared to GCA and DCM analysis. Our research helped inspecting the convergence of the functional networks related to a psychiatry disorder. The results identified potential targets for brain stimulation treatment and contributed to the optimization of patient-specific brain stimulation protocols.
Introduction
Repetitive transcranial magnetic stimulation (rTMS) is a non-invasive brain stimulation technique to modulate the neural plasticity of the brain. Recent systematic reviews and meta-analyses revealed that rTMS, with high frequency (HF) on left dorsolateral prefrontal cortex (DLPFC) or low frequency (LF) on right DLPFC, is an effective method to treat major depressive disorder (MDD) (1–7). It is frequently recommended that MDD patients who fail their antidepressant treatment be switched to rTMS treatment. However, despite the increasing recognition of rTMS as a potent treatment for MDD, the neural mechanism underlying such success is still elusive.
MDD is a chronic mental illness characterised by multiple cognitive, behavioral and psychological symptoms associated with emotional, cogitative, and motivational impairments, with anhedonia (e.g., loss of energy and motivation, inhibition of thought process) being one of the key symptoms (8, 9). It is also well known that MDD has a high comorbidity with anxiety disorders (10). Traditionally, the symptomatology of MDD is associated with dysfunction of the neural circuits which mediate reward, emotion, and decision making, involving the ventral tegmental area, nucleus accumbens (NAC), amygdala (AMY), and ventromedial prefrontal cortex (VMPFC) (11, 12), an idea supported by neuroimaging findings. The known functions of the DLPFC, however, are not directly related to the core cognitive impairments found in MDD patients such as anhedonia, anxiety, and agitation (13–15). Therefore, despite the associations found between hypoactivity of the DLPFC and MDD (16–18) and between bilateral lesion of the DLPFC and an increased vulnerability to MDD (19), it is premature to argue that DLPFC abnormalities directly leads to MDD symptoms. Considered the absence of direct linkage between the DLPFC and core features of MDD, the positive influence of rTMS treatment on MDD patients is unlikely to be solely explained by modulations in DLPFC activities.
The neurophysiological effects of rTMS are not restricted to the site of stimulation but can be spread to its functionally connected brain areas (20–26). This suggests that the treatment effects of rTMS can also be explained by remote effects, which are also known as network effects. Therefore, the analysis of functional brain networks may unveil the underlying mechanism of rTMS treatment for MDD (21, 27–30). Several studies proposed that the resting-state functional magnetic resonance imaging (fMRI) data of the healthy control (HC) can be used to determine the optimal stimulation site of rTMS treatment for MDD (31, 32). Furthermore, linking the psychopathological characteristics to certain brain regions, which are identified by their known functions or associated neural circuits, have been considered as an important approach to redefine the diagnostic system of psychiatry disorders (33–36). Therefore, we have investigated the functional interactions of HC subjects between rTMS stimulation sites and regions associated with MDD symptoms, aiming to capture clues of the potential mechanisms of rTMS treatment for MDD. To be more specific, we have focused on the NAC, AMY and VMPFC because the functional specializations of these areas are associated with the core clinical symptoms of MDD, lack of motivation, anxiety, and retardation to make decision, respectively. Recent popular approaches to study the directional interactions of brain regions include dynamic causal modeling (DCM) and Granger causality analysis (GCA). DCM, a technique designed to investigate the causal inter-regional interactions among brain networks, has been used to study both normal and aberrant brain network interactions among HC (37–39) and patients suffered from psychiatric disorder (40–42). DCM provides us more detailed information about the functional interactions of brain networks that could not be obtained by the functional connectivity (FC) or conventional regional activation analysis (43, 44). GCA focuses on identifying the directed causal interactions based on time series analysis of precedence and predictability (45) and has been widely applied to fMRI data (46–48).
In the current study, we investigated the intrinsic brain interactions aiming to understand the neurophysiological mechanism of rTMS treatment for MDD. More specifically, we examined whether the mechanism of rTMS treatment effects for MDD could be explained by the inferred remote effects using FC analysis. To this end, we used resting-state fMRI data of a healthy population to study the FC of the brain areas implicated in MDD. We first investigated how the brain areas associated with symptomatology of MDD, namely, the NAC, AMY, and VMPFC, were functionally connected to the bilateral DLPFC—the widely accepted stimulation sites of rTMS treatment for MDD. Next, we performed conjunction analysis and found these three areas converged at the DLPFC as well as at the dorsomedial prefrontal cortex (DMPFC) and bilateral insula, which are considered as potential target for rTMS treatment of MDD. Further, we performed the DCM analysis (49, 50) and GCA (45, 47) to investigate the direction of interactions among the psychopathologically MDD-related areas and the bilateral DLPFC, DMPFC and bilateral insula across the subjects. Finally, we compared the connectivity parameters obtained from FC analysis, DCM, and GCA.
Materials and Methods
Data and Image Preprocessing
The resting-state fMRI data of 100 healthy unrelated subjects from the Human Connectome Project (HCP) were used in the current study (51). All data were acquired by customized Siemens 3.0 Tesla Skyra scanners, using a multiband accelerated pulse sequence [number of volume, 1200 (14.33 min); TR, 720 ms; TE, 33.1ms; FOV, 208 × 180 mm; Matrix, 104 × 90; Slice thickness, 2.0 mm; Multiband factor, 8; phase encoding direction R/L].
The “extensively artifact removed” data set pre-processed by HCP were selected. The pipeline of pre-processing included the correction of spatial distortions due to magnetic inhomogeneity, the realignment of head motion, the coregistration to structural MRI data, and reduction of the bias field, normalization to the MNI space, and resampling into 2-mm isotropic voxels. Then global intensity of the entire 4D data set was normalized by a single scaling factor, and non-brain voxels were masked out. The data were further de-noised using the FIX approach (52, 53). Using independent component analysis, components representing the effects of motion, non-neuronal physiological, scanner-related artifacts and other nuisance sources, were subtracted from the original data. Additionally, the head motion-related components [the six rigid-body parameter timeseries, their backward-looking temporal derivatives, plus all 12 resulting regressors squared, as suggested by (54)] were regressed out from the data. More details of the data acquisition protocol and pre-processing pipelines of the current data set can be found in previous studies (55, 56).
Next, we applied spatial smoothing to the “extensively artifact removed” data with a 6-mm full width at half maximum Gaussian kernel using SPM12 (http://www.fil.ion.ucl.ac.uk/spm/software/). After extracting the BOLD time series from the spatially smoothed data for each voxel, temporal band-pass filter (0.009–0.08 Hz) was applied to reduce the LF drift and HF noise (57). Signals correlated with the cerebrospinal fluid (CSF), white matter (WM), and gray matter (GM) were removed from the data by linear regression.
ROI Specification for Seed-Based FC Analyses
The seed mask for the bilateral AMY was created from the computational anatomy toolbox (CAT12: http://www.neuro.uni-jena.de/cat/) for SPM. To ensure that the seed region of AMY did not include the anterior hippocampus region, we used the probabilistic atlas and created the masks for AMY and anterior hippocampus, with the threshold of both masks set as 0.3. Regions with a larger probability values for anterior hippocampus than for AMY were removed from the AMY mask. Based on previous studies (58–63), the ROI for the bilateral NAC comprised of 8-mm radius of spherical ROIs centered at [x y z] = [14, 10, 0] and [−14, 10, 0] (mm in the MNI coordinate). For the VMPFC, the ROI was specified as 10-mm radius of a spherical ROI centered at [x y z] = [0, 46, −6], which was defined based on previous reports about VMPFC’s involvement in decision making (60–62, 64, 65).
Seed-Based FC Analysis and Conjunction Analysis for Group Statistics
First, for each ROI, we extracted time course of all voxels included in the ROI, and averaged across all voxels in the ROI. To create a whole-brain voxel-wise correlation map, we calculated the Person’s correlation coefficients between the time course of a ROI and that of all voxels in GM. These correlation coefficient maps were transformed into z score maps using Fisher’s r-to-z transformation. Finally, the z-transformed correlation maps were subjected to group-level analysis. One-sample t-tests for each seed ROI was performed by setting a threshold at p < (0.05/3) with Bonferroni correction, voxel-wise family-wise error (FWE) corrected.
To study the convergence of psychopathologically relevant brain networks, positive correlation map of the NAC, negative correlation map of the AMY, and negative correlation map of the VMPFC were used. Conjunction analysis was conducted to identify the overlap of the three networks and found that they converged at the bilateral DLPFC, dorsomedial prefrontal cortex (DMPFC) and bilateral insula. The overlap regions were considered to be statistically significant at a threshold of p < 0.05, voxel-wise FWE corrected.
To evaluate the effect of global signal scaling on the correlational relationships among the brain regions of our interests, the average time courses of the eight ROIs (the AMY, NAC, VMPFC, bilateral DLPFC, DMPFC, and bilateral insula) were calculated for each subject with or without regressing out of the whole GM signal time series, and pairwise correlation coefficients were calculated.
Granger Causality Analysis
Furthermore, we performed GCA to investigate the effective connectivity among the bilateral DLPFC, DMPFC, bilateral insula, and the three psychopathologically MDD-related areas using the multivariate Granger causality (MVGC) MATLAB toolbox (64). In GCA, a variable X is considered to “Granger cause” a variable Y if the information of the past X helps predicting the future of Y with better accuracy than the predictability of Y itself (45).
The ROIs for the AMY, NAC, and VMPFC were the same as those used in the FC analysis while the ROIs for the DLPFC, DMPFC, and insula were specified by the 8-mm radius of a spherical ROI centered at the peak coordinate adopted from the conjunction analysis (right DLPFC [x, y, z] = [40, 36, 34]; left DLPFC [−36, 44, 28]; DMPFC [4, 18, 46]; right insula [46, 18, 2]; left insula [−40, 16, 4]).
We extracted the average time courses of the eight ROIs for each subject after regressing out the signals related to WM and CSF without band-pass filtering. The MVGC toolbox fit a vector autoregressive (VAR) model to 20 model orders and selected the minimum model order (temporal lag) of two points according to Akaike information criteria. We adopted the model selection rather than fixed length of lag (i.e., 1TR) approach because while TR could vary among data sets, the expected time lag of neural interactions between brain areas remained stable. By using the MVGC toolbox, a corresponding VAR model was estimated, and the autocovariance sequence and time-domain conditional Granger causality were calculated. The causalities for significance were also tested using the mvgc_pval function implemented in this toolbox with the alpha set at 0.05, corrected for false discovery rate (FDR). It should be noted that the Granger causality values must be zero or greater than zero since they are defined by the log-likelihood ratio between the residuals covariance matrix of the VAR models (64).
The mean values of each connectivity parameter across the subjects were calculated (Table 4). As the ability to handle large numbers of sources for regions is facilitated by GCA, these results were used to narrow down model space for DCM (65).
Dynamic Causal Modeling
Dynamic causal modeling (DCM) (66) was applied to examine the influences of the bilateral DLPFC, DMPFC, and bilateral insula on the three depression-related areas. DCM is a Bayesian framework to infer effective connectivity between brain regions in a neural system of interest. Effective connectivity quantifies the directional causal relationship from one area to another (67). We employed the spectral DCM implemented in SPM12 for resting-state fMRI data. Spectral DCM models the cross correlation function of the time series of neuronal fluctuations (spectral densities over frequencies), which makes it more computationally efficient as the estimation of neuronal hidden states is not needed (68). Furthermore, it is more sensitive to group differences for the estimation of effective connectivity parameters (68).
The ROIs of the AMY, NAC, VMPFC, DLPFC, DMPFC, and insula were set as the same as the GCA analysis. To extract the BOLD time series of the eight ROIs for the DCM analysis, we first estimated a GLM including WM and CSF signal time series with a high-pass filter (cut-off frequency = 128 s), then regressed out the nuisance covariates and calculated the eigenvariate time courses.
We specified a fully connected model that has bidirectional connections between any pair of ROIs for each subject because the GCA showed significant Granger causalities for all connections. As the fully connected model contained 8 ROIs, we estimated 64 free parameters which included all possible 56 pairwise connections and 8 self-connections. Then, we performed Bayesian model selection (BMS) using a post hoc optimization method to determine the best-fitting model with the best balance between accuracy and complexity (69–71). The corresponding effective connectivity parameters for the best fitting model were then estimated. We also estimated the pairwise FC parameters among the 8 ROIs by calculating the z-transformed correlation coefficients to compare the effective connectivity patterns with those obtained from FC analysis.
Both the significance of effective connectivity parameters and the FC parameters for the optimal model were evaluated by one-sample t-test. Correction for FDR was applied to the results with the threshold setting at p < 0.05. We further calculated the mean value and standard deviation of the distribution of each effective connectivity parameter across the subjects, as well as of each FC parameter to evaluate the distribution pattern for each connectivity parameter.
Relationship Among the Connectivity Parameters for All the Pairwise Connections Among the Eight ROIs From FC Analysis, DCM, and GCA
Pairwise correlation coefficients among all the connectivity parameters of the FC analysis, DCM, and GCA at the eight ROIs (the AMY, NAC, VMPFC, bilateral DLPFC, DMPFC, and bilateral insula) were calculated (see Table 6).
Results
Functional Connections With Brain Areas
We found the DLPFC to be functionally connected with MDD-related brain areas in distinct ways. The NAC was positively correlated with the bilateral DLPFC, while the AMY and VMPFC were negatively correlated with the bilateral DLPFC (p < 0.05/3, voxel-wise FWE-corrected) (Figure 1).
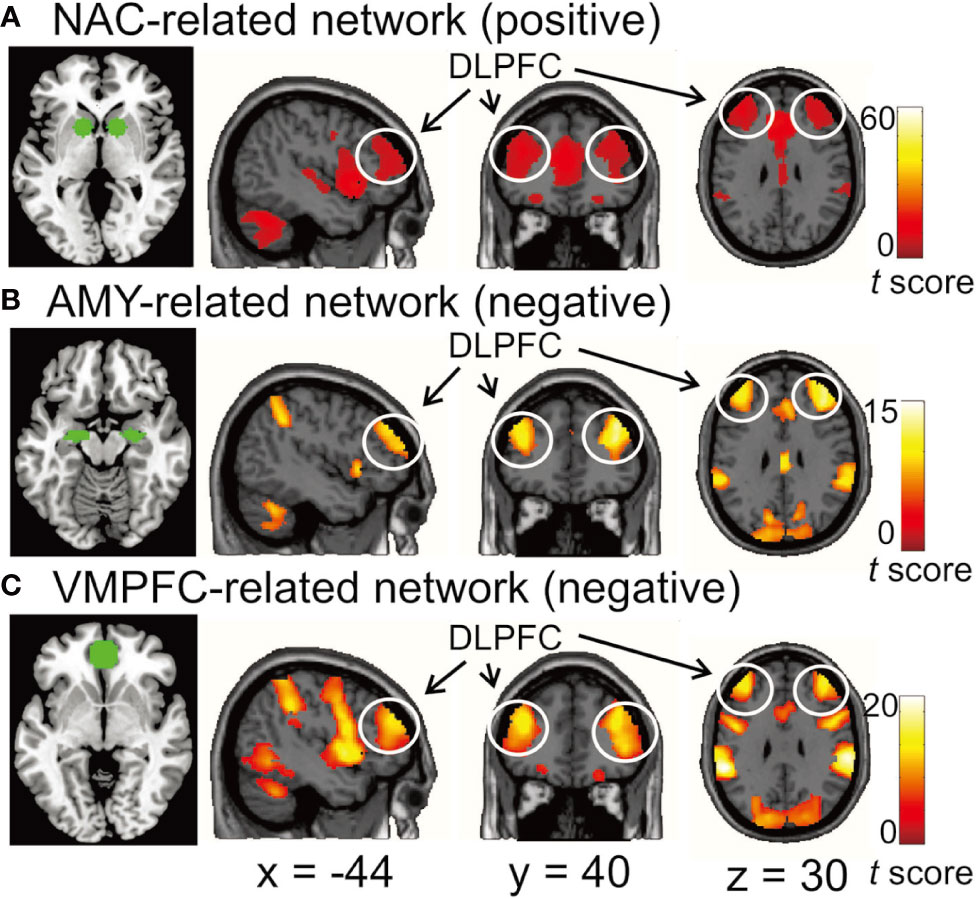
Figure 1 (A) the functional network positively correlated with the nucleus accumbens (NAC). (B, C) the functional networks negatively correlated with the amygdala (AMY) and ventromedial prefrontal cortex (VMPFC), respectively. The bilateral dorsolateral prefrontal cortex (DLPFC) was functionally connected with all three seed regions. In the left image of each row, the seed regions for functional connectivity analysis are depicted by green. Each network was identified by performing one-sample t-test with a threshold at p < 0.05/3 voxel-wise FWE corrected. Color bars represent t-values.
We also found that these three functionally connected networks overlapped in the bilateral DLPFC (Conjunction analysis: p < 0.05, voxel-wise FWE-corrected) (Figure 2), and that the bilateral DMPFC, bilateral anterior insula, bilateral IPL and left cerebellum exhibited significant overlap with the three networks (Table 1).
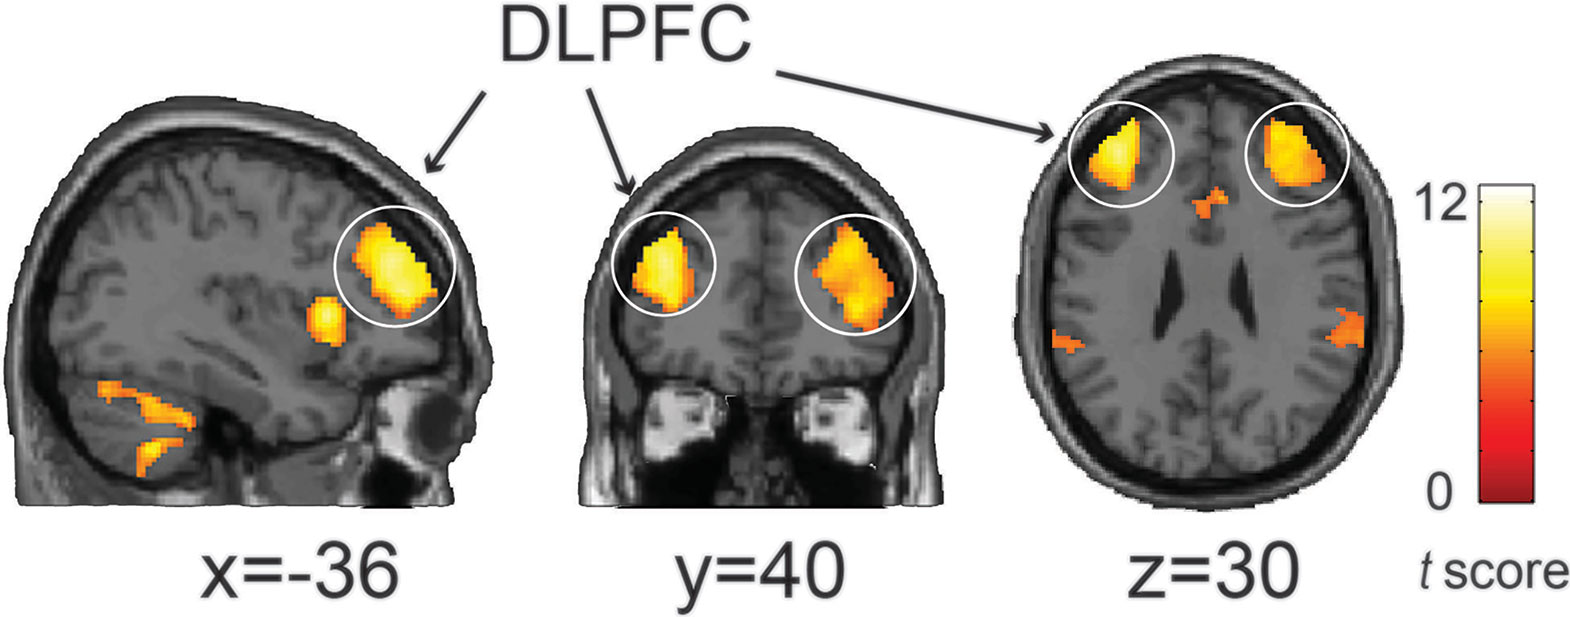
Figure 2 The conjunction analysis showed that the NAC-related network (positive), AMY-related network (negative), and VMPFC-related network (negative) converged on the bilateral DLPFC. Statistical significant threshold was set at p < 0.05 voxel-wise FWE corrected. The color bar represents t-values.
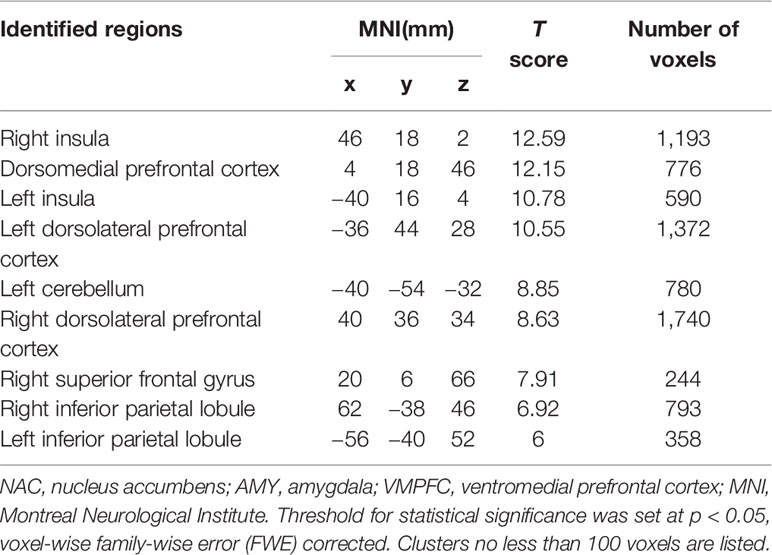
Table 1 Regions identified by the conjunction analysis of NAC-related network (positive), AMY-related network (negative), and VMPFC-related network (negative).
The GM signal scaling shifted the mean values of the correlation coefficients across subjects mostly toward the negative direction (Tables 2 and 3). Although most of the negative correlations were already apparent prior to global signal scaling, the correlation coefficients between the DLPFC and amygdala without global signal scaling were still negative but close to zero (Table 3).
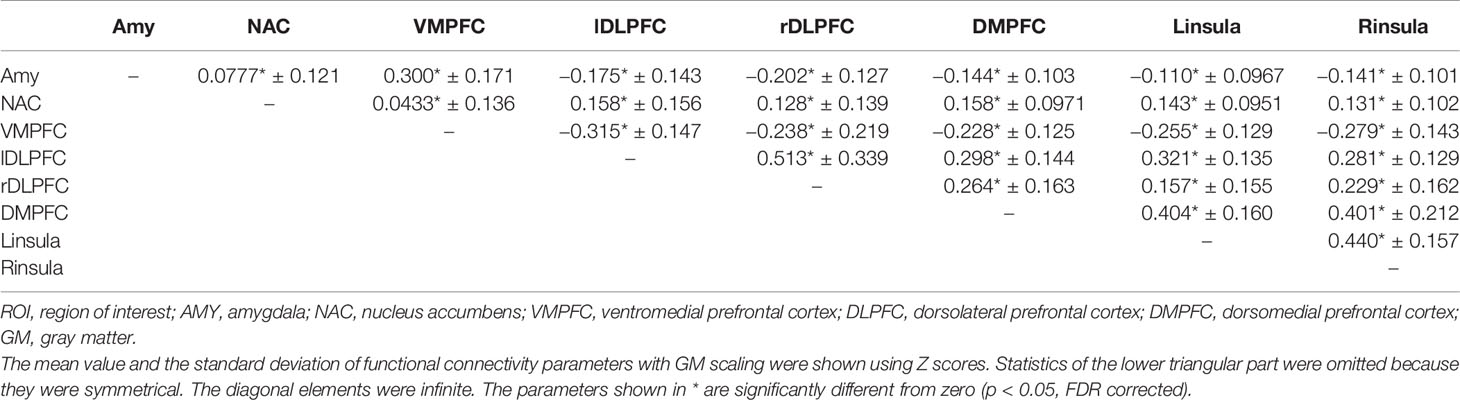
Table 2 Descriptive statistics of pairwise correlation coefficients among the BOLD time series of the eight ROIs (the AMY, NAC, VMPFC, bilateral DLPFC, DMPFC, and bilateral insula) with GM scaling.
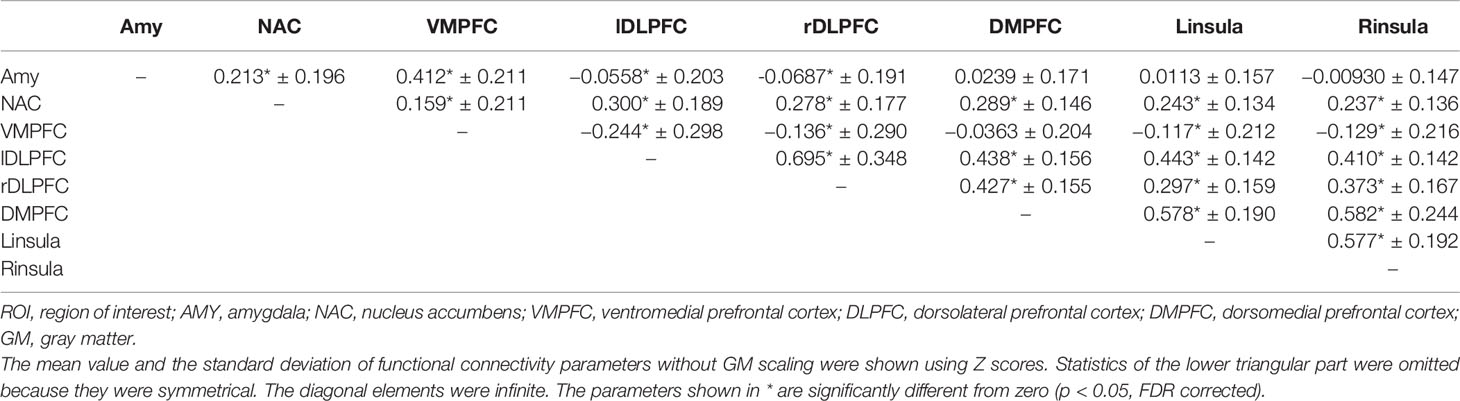
Table 3 Descriptive statistics of pairwise correlation coefficients among the BOLD time series of the eight ROIs (the AMY, NAC, VMPFC, bilateral DLPFC, DMPFC, and bilateral insula) without GM scaling.
The GCA
As shown in Table 4, at least more than 73% and 80% of all subjects have significant “Granger causality” for all the pairwise connections and significant causalities in 52 out of the 56 total connections, respectively (Table 4).
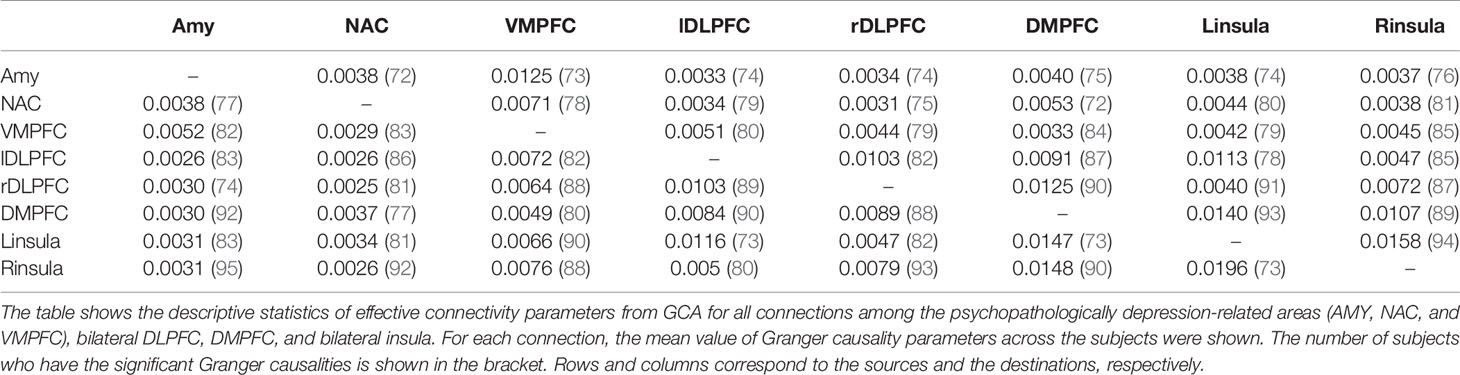
Table 4 Descriptive statistics of pairwise effective connectivity from GCA among the eight ROIs (the AMY, NAC, VMPFC, bilateral DLPFC, DMPFC, and bilateral insula).
The DCM Analysis
Post hoc selection revealed that the fully connected model was the best fitting model. Consistent with GCA, all pairwise connections showed significant “Granger causality”. The distribution of each effective connectivity parameter of the fully connected model across subjects and the FC parameter were shown in Table 5. The parameter values were significantly different from zero for most of the pairwise FC parameters within the interested networks (Tables 2 and 3), and for 42 out of 64 effective connectivity parameters (p < 0.05, FDR corrected) (Table 5). For the effective connectivity parameters between the rTMS stimulation sites (left/right DLPFC, DMPFC, and left/right insula) and the psychopathologically MDD-related areas (AMY, NAC, and VMPFC), most of the parameter values were significantly different from zero from the latter to the former, but not from the former to the latter. These results suggest that the information flows between the two sites may primarily be explained by the effective connectivity from the MDD-related areas to the rTMS stimulation sites. However, while the information flows from the NAC to the bilateral DLPFC and DMPFC were not significantly different from zero, it was significantly different from zero from the left insula to AMY and NAC (Table 5).
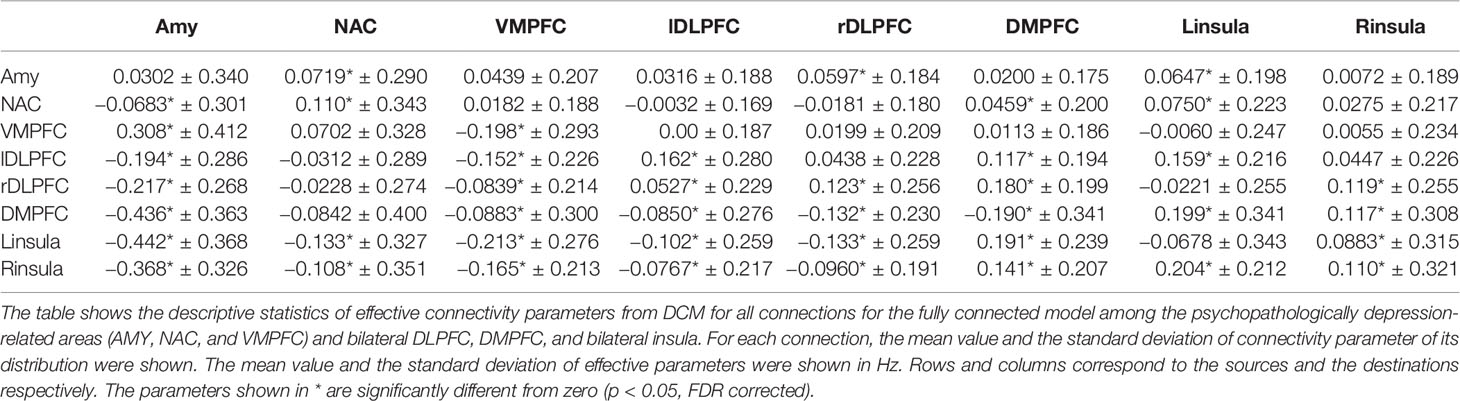
Table 5 Descriptive statistics of pairwise effective connectivity from DCM among the eight ROIs (the AMY, NAC, VMPFC, bilateral DLPFC, DMPFC, and bilateral insula).
Relationship Among the Connectivity Among the Eight ROIs From FC Analysis, DCM, and GCA
Lastly, we examined similarity among functional and effective connectivity parameters. For each connectivity parameter, we first calculated across-subject mean value, then the pairwise correlation coefficients between across-subject means of connectivity parameters derived from the FC analysis, DCM and GCA. As shown in Table 6, the correlation coefficients between the FC analysis and GCA and that between the FC analysis and DCM were both larger than that between GCA and DCM. With these results, FC parameters rather than DCM and GCA may be seen as more representative measures to assess the connectivity among the eight ROIs.

Table 6 Relationship among the connectivity among the eight ROIs from FC analysis, DCM and GCA.
Discussion
In the current study, we investigated the functional interactions of MDD-related brain areas using resting-state fMRI data to give a new insight into the underlying neural mechanisms of rTMS treatment for MDD. Three psychopathologically MDD-related brain areas, namely, nucleus accumbens, amygdala, VMPFC, were our main focuses. We found that these three networks converged at one of the effective sites of rTMS treatment for MDD, specifically the bilateral DLPFC (86, 96). Other overlapping brain areas discovered included the DMPFC, bilateral insula and left cerebellum, which could potentially be the new targets for rTMS treatment. The DCM analysis and GCA revealed that there were significant pairwise connections among all psychopathologically MDD-related regions, bilateral DLPFC, DMPFC, and bilateral insula, which implied causal information flow between these areas. The DCM also showed that the psychopathologically MDD-related regions were predominantly feeding information to the rTMS stimulation sites.
Functional Networks Between Psychopathologically MDD-Related Regions and the rTMS Stimulation Sites
The hypothesis that rTMS-induced neural activities would propagate to other functionally connected distal locations, possibly mediated by polysynaptic neural transmission, has been supported by the findings from studies of MRI (91, 92, 95, 97, 98), electronic stimulation (74, 83, 99), and rTMS applications on patients with MDD (29, 30, 76, 81). For instance, changes of brain activity in MDD patients were observed not only at the site where TMS was applied, but also in distal areas (29, 30, 76, 81). Furthermore, Fox and colleagues have demonstrated that FC predicts effective sites of deep brain stimulation for the treatment of a vast spectrum of psychiatric and neurological disorders (31, 32, 77). Therefore, analysis of FC could be of help in understanding the mechanism of rTMS treatment for MDD. In addition, it could also be used to identify potential new targets of rTMS treatment for various psychiatric disorders.
The idea of the current study is inspired by the findings reported by previous researchers who attempted to link psychiatric illness with brain functions and circuits (33, 34). For instance, the activity of the NAC, highly associated with reward processing, was found to decrease in MDD subjects (17, 58, 75). Other studies found that normalization of AMY-related activities, related to emotion and anxiety, lead to successful interventions for depression (79, 84, 85). It has also been shown that the lesion of the VMPFC, associated with decision making, has the protective effects against depressed mood (19, 80).
The convergence of the FC map suggested that rTMS at the DLPFC would influence the brain areas associated with MDD. Presumably, we could speculate that rTMS treatment improves MDD by normalising the imbalance of regional activity within the MDD symptoms–related regions, as well as the abnormal FC between these brain regions in a synergetic way. Taken together, we proposed that the combination of remote effects on MDD-related networks may explain the treatment mechanism of rTMS on the DLPFC for MDD. Furthermore, the three FC maps also converged on the DMPFC and bilateral insula, suggesting these two sites as potential new targets for rTMS in MDD. For the DMPFC, several studies have already shown that rTMS application over it was effective in improving MDD symptoms (13, 72, 82, 88). With regard to insula, the potential of it as the target for rTMS in MDD had also been confirmed by Philip et al., who found that changes of insula connectivity pattern estimated by multivoxel pattern analysis (78, 87) were associated with clinical improvement of MDD (29). These studies reported findings consistent with our results, which support the notion that the DMPFC and bilateral insula could be new potential targets for rTMS treatment in MDD.
Previous studies have reported that the response rates of rTMS treatments for MDD are moderate (3, 90, 93). We could assume that the rTMS treatment is only effective in certain subtypes of MDD but not the others. This claim is supported by several studies which found abberant brain connectivity patterns associated with the treatment response to rTMS in MDD patients (30, 73, 89, 94). In addition, one recent resting-state fMRI study found that certain subtypes of MDD were more responsive to the rTMS treatment than the others (88).
As DCM and GCA could capture the directional connectivity information that cannot be identified by FC analysis (43, 44, 100, 101), combining these three techniques could better predict the subject-specific responsiveness to rTMS treatment. Since GCA is advantageous to handle a model that constitutes large numbers of sources for regions, we used GCA to narrow down the model space for DCM (65). GCA showed most subjects had significant Granger causality for all of the pairwise connections among the ROIs, and then, we estimated the fully connected model by DCM. DCM also revealed that the fully connected model was the best-fitting model using the post hoc BMS, consistent with GCA results. DCM analysis applied to the fully connected model showed that most of the interactions between the psychopathologically MDD-related areas and the rTMS stimulation sites tended to be predominantly explained by the effective connectivity from the former to the latter. This suggested that rTMS treatment could be more effective for patients who have both stronger FC between—and stronger effective connectivity from—the psychopathologically MDD-related areas and to the rTMS stimulation sites than those who have the weaker connectivity for both. However, while there was significant effective connectivity from the NAC to the bilateral insula, no significant information flow from the NAC to bilateral DLPFC or to the DMPFC was found. This suggested that rTMS treatment over insula might be more effective than over the DLPFC or DMPFC for NAC-related symptoms (loss of interest, lack of energy, etc.). Similarly, the significant effective connectivity from the right DLPFC to the AMY and that from the DMPFC to the NAC also implied that rTMS over the right DLPFC and DMPFC might be more effective for AMY-related symptoms (anxiety) and NAC-related symptoms (loss of interest, lack of energy), respectively. Interestingly, only the left insula showed such significant bidirectional effective connectivity with the AMY and NAC. Therefore, the left insula could be a more potent stimulation site for treating the above symtpoms. In addition, the FC analysis revealed that the VMPFC was more strongly connected with the right than left DLPFC. Thus, rTMS treatment on the right DLPFC could be more effective for VMPFC-related symptoms, such as the inhibition of thought process. All considered, we believed that the interaction patterns predict the patient-specific responsiveness to rTMS treatment, which could be the key to optimize a patient-specific rTMS treatment in the future.
In the current practice of rTMS treatment for MDD, the DLPFC is the most widely used target with support on its efficacy to reduce MDD symptoms. It makes sense to believe that the remote effects of rTMS are spread from the DLPFC to the psychopathologically MDD-related areas. Unexpectedly, the causal information we found was quite the opposite. One possible explanation for our finding is that TMS increases the sensitivity of DLPFC in receiving input from the psychopathologically MDD-related areas. Another possibility is that TMS induces both orthodromic and antidromic neural transmissions: One directs impulse to the axon terminals while another one moves the oppositee way toward the somas. The former neural signal could transmit to the psychopathologically MDD-related areas along the connectivity pathway predicted by the DCM model, and strengthen the information flows from the pcyshophysiologically MDD-related areas to the DLPFC, resulting in the remote effects which improve MDD symptoms.
The Representative Measure Among FC, GCA, and DCM Analysis
The correlations between FC analysis with GCA and DCM are greater than GCA with DCM (Table 6). This suggested that FC is the most representative measure among FC analysis, DCM analysis, and GCA. On the other hand, the patterns of the effective connectivity parameters estimated by GCA and by the DCM are different. For example, the ratio of NAC-left DLPFC to left DLPFC-NAC in DCM was relatively large (9.75), while the ratio in GCA analysis was close to 1 (0.76), which suggested that the DCM is more capable of capturing the asymmetric flow of effective connectivity. Furthermore, the number of subjects who had statistically significant effective connectivity originating from the NAC was on average the lowest among all the ROIs of GCA, while most of the effective connectivities projecting to the VMPFC were not statistically different from zero. These results appeared to show that GCA and DCM are not only convergent but complementary to each other (65, 102). This could be caused by the different basic assumptions of the two methods (102). While DCM assesses the change of hidden neural activity from the observed BOLD time series, GCA directly evaluates how the present state of one region statistically relies on the past state of another region (65). In contrast, FC does not require any additional assumptions of effective connectivity. Thus, a FC measure would be a more representative measure than the effective connectivity measures, although effective connectivity can provide additional information flow within the neural networks.
Convergence of Psychopathologically MDD-Related Networks at DMPFC, Insula, IPL, and Left Cerebellum
In addition to the bilateral DLPFC, we found that the three MDD-related networks converged at the bilateral DMPFC, bilateral insula, bilateral IPL, and left cerebellum. The bilateral DMPFC and insula have been proposed as the new potential targets for rTMS treatment of MDD (13, 29). Sheline and colleagues found that patients with MDD had stronger FC between the DMPFC and the three MDD-related networks, compared to HCs (103). Practically speaking, several studies have shown that rTMS over the DMPFC is an effective method for the treatment of MDD (72, 82). DMPFC is connected to the subgenual cingulate gyrus (SCG) (104), which can be used for predicting rTMS treatment response (30, 105) and is involved in emotion regulation (106, 107). These literatures implied that DMPFC rTMS might be more potent to improve the emotion-regulating network and its related symptoms than DLPFC rTMS. Additionally, Drysdale and colleagues have shown that MDD patients with particular patterns of FC responded to the DMPFC rTMS treatment effectively (88). Previous studies together with our findings of FC convergence appeared to support the usefulness of rTMS treatment on the DMPFC.
The FC convergence can be used as a tool to identify new potential targets of rTMS for other psychiatric disorders, as conceptualized by the previous research linking FC to brain stimulation sites across diverse psychiatric disorders (77). Philip and colleagues found that insula connectivity changes between pre- and post- TMS treatment over left DLPFC were associated with MDD improvement (29). This suggested that rTMS over left DLPFC might improve MDD via insula. Anterior insula plays an important role in processing social and affective information (108) and its dysfunction can be commonly seen on MDD patients (109, 110). The anterior insula also constituted the salience network (SN), involved in switching between the DMN and central executive network (CEN) (111, 112). Patients with MDD are impaired in switching between the DMN and CEN, perhaps due to the DMN hyperactivity, and such impairment has been suggested as a key mechanism of the preoccupation with self-referential processes of MDD (110, 113, 114). Thus, direct stimulation of the insula might improve such impairment of MDD.
In our current study, we also found that the three networks converged at the IPL. Several studies have reported abnormalities of IPL for MDD such as decreased metabolism (115), increased regional homogeneity using resting-state fMRI (116), and decreased magnetization transfer ratio (117). The dysregulation of IPL is known to associate with MDD (118).
The convergence also appeared at the left cerebellum. The cerebellum is functionally connected with the frontal and limbic regions with a critical role in emotional and cognitive processing (119, 120). It has been shown that the MDD patients had hypoactive cerebellum in response to emotional stimuli and decreased FC (121, 122). Collectively, our current findings give additional accounts for the roles of the insula, IPL, and cerebellum for MDD.
Time Scales of the rTMS Effects
While several weeks were necessary to achieve the effect of rTMS treatment, most of the existing TMS-fMRI studies only addressed the immediate response of TMS on brain activity on a time scale between several seconds and an hour. Dowdle and colleagues found that there were immediate increase of neural activities at the ACC, caudate, and thalamus after applying the single-pulse TMS on the left DLPFC (123). Vink and colleagues also found that TMS at the left DLPFC could trigger a strong signal at the connected brain regions, including subgenual ACC, in a concurrent TMS-fMRI experiment (124). Several studies demonstrated functional changes several minutes after 10-Hz rTMS was applied on the left DLPFC. Findings from these studies included an increased cerebral blood flow at the ACC (125), a modulation of dopamine release at the ACC and orbitofrontal cortex (126), and increased connectivity between the left DLPFC and the ACC (27). With such coherent findings, we believed that the hour-long rTMS effects can indeed be extrapolated from the immediate effects. With an even longer time scale, Liston et al. showed that a 5-week course of 10-Hz rTMS over the left DLPFC could modulate several functional interactions. For example, it decreased the hyperconnectivity between the subgenial cingulate cortex and default mode network (DMN) and increases the anticorrelation between the DLPFC and DMN (30). With difficulties to justify the research ethic on applying rTMS intervention to healthy subjects, most long scale data is limited to patients with MDD. However, we are still able to spot some discrepancies between short-term rTMS effects (up to an hour) and long-term rTMS effects (more than several weeks). For example, while rTMS increased the connectivity between the left DLPFC and DMN after 15 min (27), it decreased their connectivity after a 5-week course (30). Although the effect of rTMS on FC is well-supported, how it would lead to either enhancement or suppression remains unclear.
Limitation
There are several limitations in the present study. First, our current results were derived from the fMRI data of HC instead of MDD patients. The alteration in MDD associated networks was not addressed. Second, instead of directly investigating the rTMS effects on resting-state FC, we inferred their influences from intrinsic functional interactions of brain networks. However, previous studies have demonstrated that FC analysis of resting-state fMRI data without TMS application is adequate to determine an optimal stimulation site of rTMS treatment for MDD (31, 32). In line with these studies, the current study provides extra insights into the potential mechanism of rTMS treatment for MDD. Third, it is still under debate whether regressing out of global signal to calculate the FC is an appropriate practice (127, 128). As shown in Table 2, most of the negative correlations from the data with global signal regression would still exist without global signal scaling. We did regress out the average bold signal of GM to perform the FC analysis which was similar to what Fox and colleagues did to calculate the anti-correlated FC between the left DLPFC and the subgenual cingulate (31). In addition, Power and colleagues have shown that global signal regression is necessary if we wished to fully remove the residual artefacts associated with head motion (129). Therefore, the global signal regression would provide a less contaminated estimation of the FC.
Conclusion
Our FC analysis revealed that psychopathologically MDD-related brain areas converged at the bilateral DLPFC as well as the DMPFC, bilateral insula, and other potential treatment targets. The DCM revealed that most of functional interactions between the psychopathologically MDD-related areas and the DLPFC, DMPFC, and bilateral insula could be primarily explained by effective connectivity from the psychopathologically MDD-related areas to the rTMS stimulation sites, which was not able to be identified by correlation-based FC analysis. The combination of functional and effective connectivity in the MDD-related networks would benefit the prediction of the subject-specific response to rTMS treatment.
In addition, FC parameter is the most robust connectivity parameter among other connectivity parameters from FC, GCA, and DCM. We argued that the convergence of the functional brain networks related to a psychiatric disorder could underpin the potential targets of the brain stimulation treatment and its mechanism through remote modulatory effects.
Data Availability Statement
The original contributions presented in the study are included in the article/supplementary material; further inquiries can be directed to the corresponding author.
Author Contributions
Conceived and designed the study: YM. Analyzed the data: TI and YM. Wrote the paper: TI, TD, WS, and YM.
Funding
This study was supported by JSPS KAKENHI (Grant Number JP18K15491; TI) and by the Japan Science and Technology Agency PRESTO program (10238; YM).
Conflict of Interest
The authors declare that the research was conducted in the absence of any commercial or financial relationships that could be construed as a potential conflict of interest.
The handling editor declared a shared affiliation with one of the authors, TI, at time of review.
References
1. Berlim MT, van den Eynde F, Tovar-Perdomo S, Daskalakis ZJ. Response, remission and drop-out rates following high-frequency repetitive transcranial magnetic stimulation (rTMS) for treating major depression: a systematic review and meta-analysis of randomized, double-blind and sham-controlled trials. Psychol Med (2014) 44:225–39. doi: 10.1017/S0033291713000512
2. Gaynes BN, Lloyd SW, Lux L, Gartlehner G, Hansen RA, Brode S, et al. Repetitive transcranial magnetic stimulation for treatment-resistant depression: a systematic review and meta-analysis. J Clin Psychiatry (2014) 75:477–89. doi: 10.4088/JCP.13r08815
3. O’Reardon JP, Solvason HB, Janicak PG, Sampson S, Isenberg KE, Nahas Z, et al. Efficacy and safety of transcranial magnetic stimulation in the acute treatment of major depression: a multisite randomized controlled trial. Biol Psychiatry (2007) 62:1208–16. doi: 10.1016/j.biopsych.2007.01.018
4. Avery DH, Holtzheimer PE3, Fawaz W, Russo J, Neumaier J, Dunner DL, et al. A controlled study of repetitive transcranial magnetic stimulation in medication-resistant major depression. Biol Psychiatry (2006) 59:187–94. doi: 10.1016/j.biopsych.2005.07.003
5. Fitzgerald PB, Brown TL, Marston NAU, Daskalakis ZJ, De Castella A, Kulkarni J. Transcranial magnetic stimulation in the treatment of depression: a double-blind, placebo-controlled trial. Arch Gen Psychiatry (2003) 60:1002–8. doi: 10.1001/archpsyc.60.9.1002
6. Hovington CL, McGirr A, Lepage M, Berlim MT. Repetitive transcranial magnetic stimulation (rTMS) for treating major depression and schizophrenia: a systematic review of recent meta-analyses. Ann Med (2013) 45:308–21. doi: 10.3109/07853890.2013.783993
7. Leggett LE, Soril LJJ, Coward S, Lorenzetti DL, MacKean G, Clement FM. Repetitive Transcranial Magnetic Stimulation for Treatment-Resistant Depression in Adult and Youth Populations: A Systematic Literature Review and Meta-Analysis. Prim Care Companion CNS Disord (2015) 17. doi: 10.4088/PCC.15r01807
8. Treadway MT, Zald DH. Reconsidering anhedonia in depression: lessons from translational neuroscience. Neurosci Biobehav Rev (2011) 35:537–55. doi: 10.1016/j.neubiorev.2010.06.006
9. Der-Avakian A, Markou A. The neurobiology of anhedonia and other reward-related deficits. Trends Neurosci (2012) 35:68–77. doi: 10.1016/j.tins.2011.11.005
10. Conway KP, Compton W, Stinson FS, Grant BF. Lifetime comorbidity of DSM-IV mood and anxiety disorders and specific drug use disorders: results from the National Epidemiologic Survey on Alcohol and Related Conditions. J Clin Psychiatry (2006) 67:247–57. doi: 10.4088/JCP.v67n0211
11. Russo SJ, Nestler EJ. The Brain Reward Circuitry in Mood Disorders. Nat Rev Neurosci (2013) 14:609–25. doi: 10.1038/nrn3381
12. Nestler EJ, Carlezon WA. The Mesolimbic Dopamine Reward Circuit in Depression. Biol Psychiatry (2006) 59:1151–9. doi: 10.1016/j.biopsych.2005.09.018
13. Downar J, Daskalakis ZJ. New Targets for rTMS in Depression: A Review of Convergent Evidence. Brain Stimul (2013) 6:231–40. doi: 10.1016/j.brs.2012.08.006
14. Blasi G, Goldberg TE, Weickert T, Das S, Kohn P, Zoltick B, et al. Brain regions underlying response inhibition and interference monitoring and suppression. Eur J Neurosci (2006) 23:1658–64. doi: 10.1111/j.1460-9568.2006.04680.x
15. Bunge SA, Ochsner KN, Desmond JE, Glover GH, Gabrieli JD. Prefrontal regions involved in keeping information in and out of mind. Brain (2001) 124:2074–86. doi: 10.1093/brain/124.10.2074
16. Austin MP, Dougall N, Ross M, Murray C, O’Carroll RE, Moffoot A, et al. Single photon emission tomography with 99mTc-exametazime in major depression and the pattern of brain activity underlying the psychotic/neurotic continuum. J Affect Disord (1992) 26:31–43. doi: 10.1016/0165-0327(92)90032-2
17. Drevets WC, Videen TO, Price JL, Preskorn SH, Carmichael ST, Raichle ME. A functional anatomical study of unipolar depression. J Neurosci (1992) 12:3628–41. doi: 10.1523/JNEUROSCI.12-09-03628.1992
18. Hamilton JP, Etkin A, Furman DJ, Lemus MG, Johnson RF, Gotlib IH. Functional neuroimaging of major depressive disorder: a meta-analysis and new integration of base line activation and neural response data. Am J Psychiatry (2012) 169:693–703. doi: 10.1176/appi.ajp.2012.11071105
19. Koenigs M, Huey ED, Calamia M, Raymont V, Tranel D, Grafman J. Distinct regions of prefrontal cortex mediate resistance and vulnerability to depression. J Neurosci (2008) 28:12341–8. doi: 10.1523/JNEUROSCI.2324-08.2008
20. Eldaief MC, Halko MA, Buckner RL, Pascual-Leone A. Transcranial magnetic stimulation modulates the brain’s intrinsic activity in a frequency-dependent manner. Proc Natl Acad Sci U S A (2011) 108:21229–34. doi: 10.1073/pnas.1113103109
21. van der Werf YD, Sanz-Arigita EJ, Menning S, van den Heuvel OA. Modulating spontaneous brain activity using repetitive transcranial magnetic stimulation. BMC Neurosci (2010) 11:145. doi: 10.1186/1471-2202-11-145
22. Vercammen A, Knegtering H, Liemburg EJ, den Boer JA, Aleman A. Functional connectivity of the temporo-parietal region in schizophrenia: effects of rTMS treatment of auditory hallucinations. J Psychiatr Res (2010) 44:725–31. doi: 10.1016/j.jpsychires.2009.12.011
23. Shafi MM, Westover MB, Fox MD, Pascual-Leone A. Exploration and modulation of brain network interactions with noninvasive brain stimulation in combination with neuroimaging. Eur J Neurosci (2012) 35:805–25. doi: 10.1111/j.1460-9568.2012.08035.x
24. Reithler J, Peters JC, Sack AT. Multimodal transcranial magnetic stimulation: using concurrent neuroimaging to reveal the neural network dynamics of noninvasive brain stimulation. Prog Neurobiol (2011) 94:149–65. doi: 10.1016/j.pneurobio.2011.04.004
25. Bestmann S, Baudewig J, Siebner HR, Rothwell JC, Frahm J. Subthreshold high-frequency TMS of human primary motor cortex modulates interconnected frontal motor areas as detected by interleaved fMRI-TMS. Neuroimage (2003) 20:1685–96. doi: 10.1016/j.neuroimage.2003.07.028
26. Chouinard PA, Van Der Werf YD, Leonard G, Paus T. Modulating neural networks with transcranial magnetic stimulation applied over the dorsal premotor and primary motor cortices. J Neurophysiol (2003) 90:1071–83. doi: 10.1152/jn.01105.2002
27. Tik M, Hoffmann A, Sladky R, Tomova L, Hummer A, Navarro de Lara L, et al. Towards understanding rTMS mechanism of action: Stimulation of the DLPFC causes network-specific increase in functional connectivity. Neuroimage (2017) 162:289–96. doi: 10.1016/j.neuroimage.2017.09.022
28. Fox MD, Halko MA, Eldaief MC, Pascual-Leone A. Measuring and manipulating brain connectivity with resting state functional connectivity magnetic resonance imaging (fcMRI) and transcranial magnetic stimulation (TMS). Neuroimage (2012) 62:2232–43. doi: 10.1016/j.neuroimage.2012.03.035
29. Philip NS, Barredo J, van ‘t Wout-Frank M, Tyrka AR, Price LH, Carpenter LL. Network Mechanisms of Clinical Response to Transcranial Magnetic Stimulation in Posttraumatic Stress Disorder and Major Depressive Disorder. Biol Psychiatry (2018) 83:263–72. doi: 10.1016/j.biopsych.2017.07.021
30. Liston C, Chen AC, Zebley BD, Drysdale AT, Gordon R, Leuchter B, et al. Default mode network mechanisms of transcranial magnetic stimulation in depression. Biol Psychiatry (2014) 76:517–26. doi: 10.1016/j.biopsych.2014.01.023
31. Fox MD, Buckner RL, White MP, Greicius MD, Pascual-Leone A. Efficacy of transcranial magnetic stimulation targets for depression is related to intrinsic functional connectivity with the subgenual cingulate. Biol Psychiatry (2012) 72:595–603. doi: 10.1016/j.biopsych.2012.04.028
32. Weigand A, Horn A, Caballero R, Cooke D, Stern AP, Taylor SF, et al. Prospective Validation That Subgenual Connectivity Predicts Antidepressant Efficacy of Transcranial Magnetic Stimulation Sites. Biol Psychiatry (2018) 84(1):28–37. doi: 10.1016/j.biopsych.2017.10.028
34. Strik W, Stegmayer K, Walther S, Dierks T. SyNoPsis: Response to the Commentators. Neuropsychobiology (2017) 75:129–31. doi: 10.1159/000485218
35. Brady ROJ, Gonsalvez I, Lee I, Öngür D, Seidman LJ, Schmahmann JD, et al. Cerebellar-Prefrontal Network Connectivity and Negative Symptoms in Schizophrenia. Am J Psychiatry (2019) 176:512–20. doi: 10.1176/appi.ajp.2018.18040429
36. Stegmayer K, Bohlhalter S, Vanbellingen T, Federspiel A, Wiest R, Müri RM, et al. Limbic Interference During Social Action Planning in Schizophrenia. Schizophr Bull (2018) 44:359–68. doi: 10.1093/schbul/sbx059
37. Xu J, Yin X, Ge H, Han Y, Pang Z, Liu B, et al. Heritability of the Effective Connectivity in the Resting-State Default Mode Network. Cereb Cortex (2017) 27:5626–34. doi: 10.1093/cercor/bhw332
38. Razi A, Kahan J, Rees G, Friston KJ. Construct validation of a DCM for resting state fMRI. Neuroimage (2015) 106:1–14. doi: 10.1016/j.neuroimage.2014.11.027
39. Di X, Biswal BB. Identifying the default mode network structure using dynamic causal modeling on resting-state functional magnetic resonance imaging. Neuroimage (2014) 86:53–9. doi: 10.1016/j.neuroimage.2013.07.071
40. Bastos-Leite AJ, Ridgway GR, Silveira C, Norton A, Reis S, Friston KJ. Dysconnectivity within the default mode in first-episode schizophrenia: a stochastic dynamic causal modeling study with functional magnetic resonance imaging. Schizophr Bull (2015) 41:144–53. doi: 10.1093/schbul/sbu080
41. Li L, Li B, Bai Y, Liu W, Wang H, Leung H-C, et al. Abnormal resting state effective connectivity within the default mode network in major depressive disorder: A spectral dynamic causal modeling study. Brain Behav (2017) 7:e00732. doi: 10.1002/brb3.732
42. Chahine G, Richter A, Wolter S, Goya-Maldonado R, Gruber O. Disruptions in the left frontoparietal network underlie resting state endophenotypic markers in schizophrenia. Hum Brain Mapp (2017) 38:1741–50. doi: 10.1002/hbm.23477
43. Hein G, Morishima Y, Leiberg S, Sul S, Fehr E. The brain’s functional network architecture reveals human motives. Science (2016) 351:1074–8. doi: 10.1126/science.aac7992
44. Nakataki M, Soravia LM, Schwab S, Horn H, Dierks T, Strik W, et al. Glucocorticoid Administration Improves Aberrant Fear-Processing Networks in Spider Phobia. Neuropsychopharmacology (2017) 42:485–94. doi: 10.1038/npp.2016.207
45. Granger CWJ. Investigating Causal Relations by Econometric Models and Cross-spectral Methods. Econometrica (1969) 37:424–38. doi: 10.2307/1912791
46. Roebroeck A, Formisano E, Goebel R. Mapping directed influence over the brain using Granger causality and fMRI. Neuroimage (2005) 25:230–42. doi: 10.1016/j.neuroimage.2004.11.017
47. Seth AK, Chorley P, Barnett LC. Granger causality analysis of fMRI BOLD signals is invariant to hemodynamic convolution but not downsampling. Neuroimage (2013) 65:540–55. doi: 10.1016/j.neuroimage.2012.09.049
48. Frank DW, Costa VD, Averbeck BB, Sabatinelli D. Directional interconnectivity of the human amygdala, fusiform gyrus, and orbitofrontal cortex in emotional scene perception. J Neurophysiol (2019) 122:1530–7. doi: 10.1152/jn.00780.2018
49. Lu J, Liu H, Zhang M, Wang D, Cao Y, Ma Q, et al. Focal pontine lesions provide evidence that intrinsic functional connectivity reflects polysynaptic anatomical pathways. J Neurosci (2011) 31:15065–71. doi: 10.1523/JNEUROSCI.2364-11.2011
50. Friston KJ, Harrison L, Penny W. Dynamic causal modelling. Neuroimage (2003) 19:1273–302. doi: 10.1016/S1053-8119(03)00202-7
51. Glasser MF, Sotiropoulos SN, Wilson JA, Coalson TS, Fischl B, Andersson JL, et al. The minimal preprocessing pipelines for the Human Connectome Project. Neuroimage (2013) 80:105–24. doi: 10.1016/j.neuroimage.2013.04.127
52. Griffanti L, Salimi-Khorshidi G, Beckmann CF, Auerbach EJ, Douaud G, Sexton CE, et al. ICA-based artefact removal and accelerated fMRI acquisition for improved resting state network imaging. Neuroimage (2014) 95:232–47. doi: 10.1016/j.neuroimage.2014.03.034
53. Salimi-Khorshidi G, Douaud G, Beckmann CF, Glasser MF, Griffanti L, Smith SM. Automatic denoising of functional MRI data: Combining independent component analysis and hierarchical fusion of classifiers. Neuroimage (2014) 90:449–68. doi: 10.1016/j.neuroimage.2013.11.046
54. Satterthwaite TD, Elliott MA, Gerraty RT, Ruparel K, Loughead J, Calkins ME, et al. An improved framework for confound regression and filtering for control of motion artifact in the preprocessing of resting-state functional connectivity data. Neuroimage (2013) 64:240–56. doi: 10.1016/j.neuroimage.2012.08.052
55. Van Essen DC, Smith SM, Barch DM, Behrens TEJ, Yacoub E, Ugurbil K. The WU-Minn Human Connectome Project: An overview. Neuroimage (2013) 80:62–79. doi: 10.1016/j.neuroimage.2013.05.041
56. Smith SM, Beckmann CF, Andersson J, Auerbach EJ, Bijsterbosch J, Douaud G, et al. Resting-state fMRI in the Human Connectome Project. Neuroimage (2013) 80:144–68. doi: 10.1016/j.neuroimage.2013.05.039
57. Lowe MJ, Mock BJ, Sorenson JA. Functional Connectivity in Single and Multislice Echoplanar Imaging Using Resting-State Fluctuations. Neuroimage (1998) 7:119–32. doi: 10.1006/nimg.1997.0315
58. Pizzagalli DA, Holmes AJ, Dillon DG, Goetz EL, Birk JL, Bogdan R, et al. Reduced caudate and nucleus accumbens response to rewards in unmedicated individuals with major depressive disorder. Am J Psychiatry (2009) 166:702–10. doi: 10.1176/appi.ajp.2008.08081201
59. Monk CS, Klein RG, Telzer EH, Schroth EA, Mannuzza S, Moulton JL3, et al. Amygdala and nucleus accumbens activation to emotional facial expressions in children and adolescents at risk for major depression. Am J Psychiatry (2008) 165:90–8. doi: 10.1176/appi.ajp.2007.06111917
60. Keedwell PA, Andrew C, Williams SCR, Brammer MJ, Phillips ML. A double dissociation of ventromedial prefrontal cortical responses to sad and happy stimuli in depressed and healthy individuals. Biol Psychiatry (2005) 58:495–503. doi: 10.1016/j.biopsych.2005.04.035
61. Greicius MD, Krasnow B, Reiss AL, Menon V. Functional connectivity in the resting brain: a network analysis of the default mode hypothesis. Proc Natl Acad Sci U S A (2003) 100:253–8. doi: 10.1073/pnas.0135058100
62. Knutson B, Bhanji JP, Cooney RE, Atlas LY, Gotlib IH. Neural responses to monetary incentives in major depression. Biol Psychiatry (2008) 63:686–92. doi: 10.1016/j.biopsych.2007.07.023
63. Zhang W-N, Chang S-H, Guo L-Y, Zhang K-L, Wang J. The neural correlates of reward-related processing in major depressive disorder: a meta-analysis of functional magnetic resonance imaging studies. J Affect Disord (2013) 151:531–9. doi: 10.1016/j.jad.2013.06.039
64. Barnett L, Seth AK. The MVGC multivariate Granger causality toolbox: a new approach to Granger-causal inference. J Neurosci Methods (2014) 223:50–68. doi: 10.1016/j.jneumeth.2013.10.018
65. Friston K, Moran R, Seth AK. Analysing connectivity with Granger causality and dynamic causal modelling. Curr Opin Neurobiol (2013) 23:172–8. doi: 10.1016/j.conb.2012.11.010
66. Mechelli A, Price CJ, Noppeney U, Friston KJ. A dynamic causal modeling study on category effects: bottom-up or top-down mediation? J Cognit Neurosci (2003) 15:925–34. doi: 10.1162/089892903770007317
67. Daunizeau J, David O, Stephan KE. Dynamic causal modelling: a critical review of the biophysical and statistical foundations. Neuroimage (2011) 58:312–22. doi: 10.1016/j.neuroimage.2009.11.062
68. Friston KJ, Kahan J, Biswal B. Razi A. A DCM for resting state fMRI. Neuroimage (2014) 94:396–407. doi: 10.1016/j.neuroimage.2013.12.009
69. Stephan KE, Penny WD, Daunizeau J, Moran RJ, Friston KJ. Bayesian model selection for group studies. Neuroimage (2009) 46:1004–17. doi: 10.1016/j.neuroimage.2009.03.025
70. Rigoux L, Stephan KE, Friston KJ, Daunizeau J. Bayesian model selection for group studies - revisited. Neuroimage (2014) 84:971–85. doi: 10.1016/j.neuroimage.2013.08.065
71. Friston K, Penny W. Post hoc Bayesian model selection. Neuroimage (2011) 56:2089–99. doi: 10.1016/j.neuroimage.2011.03.062
72. Bakker N, Shahab S, Giacobbe P, Blumberger DM, Daskalakis ZJ, Kennedy SH, et al. rTMS of the dorsomedial prefrontal cortex for major depression: safety, tolerability, effectiveness, and outcome predictors for 10 Hz versus intermittent theta-burst stimulation. Brain Stimul (2015) 8:208–15. doi: 10.1016/j.brs.2014.11.002
73. Salomons TV, Dunlop K, Kennedy SH, Flint A, Geraci J, Giacobbe P, et al. Resting-state cortico-thalamic-striatal connectivity predicts response to dorsomedial prefrontal rTMS in major depressive disorder. Neuropsychopharmacology (2014) 39:488–98. doi: 10.1038/npp.2013.222
74. Matsui T, Tamura K, Koyano KW, Takeuchi D, Adachi Y, Osada T, et al. Direct comparison of spontaneous functional connectivity and effective connectivity measured by intracortical microstimulation: an fMRI study in macaque monkeys. Cereb Cortex (2011) 21:2348–56. doi: 10.1093/cercor/bhr019
75. Mayberg HS, Brannan SK, Tekell JL, Silva JA, Mahurin RK, McGinnis S, et al. Regional metabolic effects of fluoxetine in major depression: serial changes and relationship to clinical response. Biol Psychiatry (2000) 48:830–43. doi: 10.1016/S0006-3223(00)01036-2
76. Kito S, Hasegawa T, Koga Y. Neuroanatomical correlates of therapeutic efficacy of low-frequency right prefrontal transcranial magnetic stimulation in treatment-resistant depression. Psychiatry Clin Neurosci (2011) 65:175–82. doi: 10.1111/j.1440-1819.2010.02183.x
77. Fox MD, Buckner RL, Liu H, Chakravarty MM, Lozano AM, Pascual-Leone A. Resting-state networks link invasive and noninvasive brain stimulation across diverse psychiatric and neurological diseases. Proc Natl Acad Sci U S A (2014) 111:E4367–75. doi: 10.1073/pnas.1405003111
78. Whitfield-Gabrieli S, Ghosh SS, Nieto-Castanon A, Saygin Z, Doehrmann O, Chai XJ, et al. Brain connectomics predict response to treatment in social anxiety disorder. Mol Psychiatry (2016) 21:680–5. doi: 10.1038/mp.2015.109
79. Arnone D, McKie S, Elliott R, Thomas EJ, Downey D, Juhasz G, et al. Increased amygdala responses to sad but not fearful faces in major depression: relation to mood state and pharmacological treatment. Am J Psychiatry (2012) 169:841–50. doi: 10.1176/appi.ajp.2012.11121774
80. Ellenbogen JM, Hurford MO, Liebeskind DS, Neimark GB, Weiss D. Ventromedial frontal lobe trauma. Neurology (2005) 64:757. doi: 10.1212/WNL.64.4.757
81. Baeken C, Marinazzo D, Everaert H, Wu G-R, Van Hove C, Audenaert K, et al. The Impact of Accelerated HF-rTMS on the Subgenual Anterior Cingulate Cortex in Refractory Unipolar Major Depression: Insights From 18FDG PET Brain Imaging. Brain Stimul (2015) 8:808–15. doi: 10.1016/j.brs.2015.01.415
82. Schulze L, Feffer K, Lozano C, Giacobbe P, Daskalakis ZJ, Blumberger DM, et al. Number of pulses or number of sessions? An open-label study of trajectories of improvement for once-vs. twice-daily dorsomedial prefrontal rTMS in major depression. Brain Stimul (2018) 11(2):327–36. doi: 10.1016/j.brs.2017.11.002
83. Koch G, Bozzali M, Bonni S, Giacobbe V, Caltagirone C, Cercignani M. FMRI resting slow fluctuations correlate with the activity of fast cortico-cortical physiological connections. PLoS One (2012) 7:e52660. doi: 10.1371/journal.pone.0052660
84. Young KD, Misaki M, Harmer CJ, Victor T, Zotev V, Phillips R, et al. Real-Time Functional Magnetic Resonance Imaging Amygdala Neurofeedback Changes Positive Information Processing in Major Depressive Disorder. Biol Psychiatry (2017) 82:578–86. doi: 10.1016/j.biopsych.2017.03.013
85. Godlewska BR, Norbury R, Selvaraj S, Cowen PJ, Harmer CJ. Short-term SSRI treatment normalises amygdala hyperactivity in depressed patients. Psychol Med (2012) 42:2609–17. doi: 10.1017/S0033291712000591
86. Milev RV, Giacobbe P, Kennedy SH, Blumberger DM, Daskalakis ZJ, Downar J, et al. Canadian Network for Mood and Anxiety Treatments (CANMAT) 2016 Clinical Guidelines for the Management of Adults with Major Depressive Disorder: Section 4. Neurostimulation Treatments. Can J Psychiatry (2016) 61:561–75. doi: 10.1177/0706743716660033
87. Whitfield-Gabrieli S, Nieto-Castanon A. Conn: A Functional Connectivity Toolbox for Correlated and Anticorrelated Brain Networks. Brain Connect (2012) 2:125–41. doi: 10.1089/brain.2012.0073
88. Drysdale AT, Grosenick L, Downar J, Dunlop K, Mansouri F, Meng Y, et al. Resting-state connectivity biomarkers define neurophysiological subtypes of depression. Nat Med (2017) 23:28–38. doi: 10.1038/nm.4246
89. Downar J, Geraci J, Salomons TV, Dunlop K, Wheeler S, McAndrews MP, et al. Anhedonia and reward-circuit connectivity distinguish nonresponders from responders to dorsomedial prefrontal repetitive transcranial magnetic stimulation in major depression. Biol Psychiatry (2014) 76:176–85. doi: 10.1016/j.biopsych.2013.10.026
90. Lam RW, Chan P, Wilkins-Ho M, Yatham LN. Repetitive transcranial magnetic stimulation for treatment-resistant depression: a systematic review and metaanalysis. Can J Psychiatry (2008) 53:621–31. doi: 10.1177/070674370805300909
91. Valero-Cabre A, Payne BR, Rushmore J, Lomber SG, Pascual-Leone A. Impact of repetitive transcranial magnetic stimulation of the parietal cortex on metabolic brain activity: a 14C-2DG tracing study in the cat. Exp Brain Res (2005) 163:1–12. doi: 10.1007/s00221-004-2140-6
92. Valero-Cabre A, Payne BR, Pascual-Leone A. Opposite impact on 14C-2-deoxyglucose brain metabolism following patterns of high and low frequency repetitive transcranial magnetic stimulation in the posterior parietal cortex. Exp Brain Res (2007) 176:603–15. doi: 10.1007/s00221-006-0639-8
93. Pascual-Leone A, Rubio B, Pallardo F, Catala MD. Rapid-rate transcranial magnetic stimulation of left dorsolateral prefrontal cortex in drug-resistant depression. Lancet (Lond Engl) (1996) 348:233–7. doi: 10.1016/S0140-6736(96)01219-6
94. Taylor SF, Ho SS, Abagis T, Angstadt M, Maixner DF, Welsh RC, et al. Changes in brain connectivity during a sham-controlled, transcranial magnetic stimulation trial for depression. J Affect Disord (2018) 232:143–51. doi: 10.1016/j.jad.2018.02.019
95. Ferreri F, Pasqualetti P, Maatta S, Ponzo D, Ferrarelli F, Tononi G, et al. Human brain connectivity during single and paired pulse transcranial magnetic stimulation. Neuroimage (2011) 54:90–102. doi: 10.1016/j.neuroimage.2010.07.056
96. Perera T, George MS, Grammer G, Janicak PG, Pascual-Leone A, Wirecki TS. The Clinical TMS Society Consensus Review and Treatment Recommendations for TMS Therapy for Major Depressive Disorder. Brain Stimul (2016) 9:336–46. doi: 10.1016/j.brs.2016.03.010
97. Ruff CC, Bestmann S, Blankenburg F, Bjoertomt O, Josephs O, Weiskopf N, et al. Distinct causal influences of parietal versus frontal areas on human visual cortex: evidence from concurrent TMS-fMRI. Cereb Cortex (2008) 18:817–27. doi: 10.1093/cercor/bhm128
98. Bestmann S, Baudewig J, Siebner HR, Rothwell JC, Frahm J. BOLD MRI responses to repetitive TMS over human dorsal premotor cortex. Neuroimage (2005) 28:22–9. doi: 10.1016/j.neuroimage.2005.05.027
99. Keller CJ, Bickel S, Entz L, Ulbert I, Milham MP, Kelly C, et al. Intrinsic functional architecture predicts electrically evoked responses in the human brain. Proc Natl Acad Sci U S A (2011) 108:10308–13. doi: 10.1073/pnas.1019750108
100. Shi Y, Liu W, Liu R, Zeng Y, Wu L, Huang S, et al. Investigation of the emotional network in depression after stroke: A study of multivariate Granger causality analysis of fMRI data. J Affect Disord (2019) 249:35–44. doi: 10.1016/j.jad.2019.02.020
101. Duggento A, Passamonti L, Valenza G, Barbieri R, Guerrisi M, Toschi N. Multivariate Granger causality unveils directed parietal to prefrontal cortex connectivity during task-free MRI. Sci Rep (2018) 8:5571. doi: 10.1038/s41598-018-23996-x
102. Bajaj S, Adhikari BM, Friston KJ, Dhamala M. Bridging the Gap: Dynamic Causal Modeling and Granger Causality Analysis of Resting State Functional Magnetic Resonance Imaging. Brain Connect (2016) 6:652–61. doi: 10.1089/brain.2016.0422
103. Sheline YI, Price JL, Yan Z, Mintun MA. Resting-state functional MRI in depression unmasks increased connectivity between networks via the dorsal nexus. Proc Natl Acad Sci (2010) 107:11020–5. doi: 10.1073/pnas.1000446107
104. Croxson PL, Johansen-Berg H, Behrens TEJ, Robson MD, Pinsk MA, Gross CG, et al. Quantitative investigation of connections of the prefrontal cortex in the human and macaque using probabilistic diffusion tractography. J Neurosci (2005) 25:8854–66. doi: 10.1523/JNEUROSCI.1311-05.2005
105. Baeken C, Marinazzo D, Wu G-R, Van Schuerbeek P, De Mey J, Marchetti I, et al. Accelerated HF-rTMS in treatment-resistant unipolar depression: Insights from subgenual anterior cingulate functional connectivity. World J Biol Psychiatry Off J World Fed Soc Biol Psychiatry (2014) 15:286–97. doi: 10.3109/15622975.2013.872295
106. Mayberg HS, Liotti M, Brannan SK, McGinnis S, Mahurin RK, Jerabek PA, et al. Reciprocal limbic-cortical function and negative mood: converging PET findings in depression and normal sadness. Am J Psychiatry (1999) 156:675–82. doi: 10.1176/ajp.156.5.675
107. Phillips ML, Drevets WC, Rauch SL, Lane R. Neurobiology of emotion perception I: The neural basis of normal emotion perception. Biol Psychiatry (2003) 54:504–14. doi: 10.1016/s0006-3223(03)00168-9
108. Singer T, Critchley HD, Preuschoff K. A common role of insula in feelings, empathy and uncertainty. Trends Cognit Sci (2009) 13:334–40. doi: 10.1016/j.tics.2009.05.001
109. Diener C, Kuehner C, Brusniak W, Ubl B, Wessa M. Flor H. A meta-analysis of neurofunctional imaging studies of emotion and cognition in major depression. Neuroimage (2012) 61:677–85. doi: 10.1016/j.neuroimage.2012.04.005
110. Kaiser RH, Andrews-Hanna JR, Wager TD, Pizzagalli DA. Large-Scale Network Dysfunction in Major Depressive Disorder: A Meta-analysis of Resting-State Functional Connectivity. JAMA Psychiatry (2015) 72:603–11. doi: 10.1001/jamapsychiatry.2015.0071
111. Menon V, Uddin LQ. Saliency, switching, attention and control: a network model of insula function. Brain Struct Funct (2010) 214:655–67. doi: 10.1007/s00429-010-0262-0
112. Goulden N, Khusnulina A, Davis NJ, Bracewell RM, Bokde AL, McNulty JP, et al. The salience network is responsible for switching between the default mode network and the central executive network: replication from DCM. Neuroimage (2014) 99:180–90. doi: 10.1016/j.neuroimage.2014.05.052
113. Menon V. Large-scale brain networks and psychopathology: a unifying triple network model. Trends Cognit Sci (2011) 15:483–506. doi: 10.1016/j.tics.2011.08.003
114. Manoliu A, Meng C, Brandl F, Doll A, Tahmasian M, Scherr M, et al. Insular dysfunction within the salience network is associated with severity of symptoms and aberrant inter-network connectivity in major depressive disorder. Front Hum Neurosci (2013) 7:930. doi: 10.3389/fnhum.2013.00930
115. Mayberg HS, Starkstein SE, Sadzot B, Preziosi T, Andrezejewski PL, Dannals RF, et al. Selective hypometabolism in the inferior frontal lobe in depressed patients with Parkinson’s disease. Ann Neurol (1990) 28:57–64. doi: 10.1002/ana.410280111
116. Liang M-J, Zhou Q, Yang K-R, Yang X-L, Fang J, Chen W-L, et al. Identify changes of brain regional homogeneity in bipolar disorder and unipolar depression using resting-state FMRI. PLoS One (2013) 8:e79999. doi: 10.1371/journal.pone.0079999
117. Chen Z, Zhang H, Jia Z, Zhong J, Huang X, Du M, et al. Magnetization transfer imaging of suicidal patients with major depressive disorder. Sci Rep (2015) 5:9670. doi: 10.1038/srep09670
118. Muller VI, Cieslik EC, Laird AR, Fox PT, Eickhoff SB. Dysregulated left inferior parietal activity in schizophrenia and depression: functional connectivity and characterization. Front Hum Neurosci (2013) 7:268. doi: 10.3389/fnhum.2013.00268
119. Schmahmann JD, Caplan D. Cognition, emotion and the cerebellum. Brain (2006) 129:290–2. doi: 10.1093/brain/awh729
120. Bermpohl F, Pascual-Leone A, Amedi A, Merabet LB, Fregni F, Gaab N, et al. Dissociable networks for the expectancy and perception of emotional stimuli in the human brain. Neuroimage (2006) 30:588–600. doi: 10.1016/j.neuroimage.2005.09.040
121. Fitzgerald PB, Laird AR, Maller J. Daskalakis ZJ. A meta-analytic study of changes in brain activation in depression. Hum Brain Mapp (2008) 29:683–95. doi: 10.1002/hbm.20426
122. Dutta A, McKie S, Deakin JFW. Resting state networks in major depressive disorder. Psychiatry Res (2014) 224:139–51. doi: 10.1016/j.pscychresns.2014.10.003
123. Dowdle LT, Brown TR, George MS, Hanlon CA. Single pulse TMS to the DLPFC, compared to a matched sham control, induces a direct, causal increase in caudate, cingulate, and thalamic BOLD signal. Brain Stimul (2018) 11(4):789–96. doi: 10.1016/j.brs.2018.02.014
124. Vink JJT, Mandija S, Petrov PI, van den Berg CAT, Sommer IEC, Neggers SFW. A novel concurrent TMS-fMRI method to reveal propagation patterns of prefrontal magnetic brain stimulation. Hum Brain Mapp (2018) 39:4580–92. doi: 10.1002/hbm.24307
125. Paus T, Castro-Alamancos MA, Petrides M. Cortico-cortical connectivity of the human mid-dorsolateral frontal cortex and its modulation by repetitive transcranial magnetic stimulation. Eur J Neurosci (2001) 14:1405–11. doi: 10.1046/j.0953-816x.2001.01757.x
126. Cho SS, Strafella AP. rTMS of the left dorsolateral prefrontal cortex modulates dopamine release in the ipsilateral anterior cingulate cortex and orbitofrontal cortex. PLoS One (2009) 4:e6725. doi: 10.1371/journal.pone.0006725
127. Fox MD, Zhang D, Snyder AZ, Raichle ME. The global signal and observed anticorrelated resting state brain networks. J Neurophysiol (2009) 101:3270–83. doi: 10.1152/jn.90777.2008
128. Murphy K, Birn RM, Handwerker DA, Jones TB, Bandettini PA. The impact of global signal regression on resting state correlations: are anti-correlated networks introduced? Neuroimage (2009) 44:893–905. doi: 10.1016/j.neuroimage.2008.09.036
Keywords: major depressive disorder, resting-state functional magnetic resonance imaging (fMRI), functional connectivity, repetitive transcranial magnetic stimulation (rTMS), dynamic causal modeling (DCM), Granger causality analysis (GCA)
Citation: Ishida T, Dierks T, Strik W and Morishima Y (2020) Converging Resting State Networks Unravels Potential Remote Effects of Transcranial Magnetic Stimulation for Major Depression. Front. Psychiatry 11:836. doi: 10.3389/fpsyt.2020.00836
Received: 03 April 2020; Accepted: 31 July 2020;
Published: 20 August 2020.
Edited by:
Teppei Matsui, The University of Tokyo, JapanReviewed by:
Junichi Chikazoe, National Institute for Physiological Sciences (NIPS), JapanKatharine Dunlop, University of Toronto, Canada
Copyright © 2020 Ishida, Dierks, Strik and Morishima. This is an open-access article distributed under the terms of the Creative Commons Attribution License (CC BY). The use, distribution or reproduction in other forums is permitted, provided the original author(s) and the copyright owner(s) are credited and that the original publication in this journal is cited, in accordance with accepted academic practice. No use, distribution or reproduction is permitted which does not comply with these terms.
*Correspondence: Takuya Ishida, aXNoaWRhZmluZUBnbWFpbC5jb20=