 Yan-Jie Zhao1,2,3†
 Yu Jin4†
 Wen-Wang Rao1,2,3†Qing-E Zhang5†
 Ling Zhang5†Todd Jackson6
 Zhao-Hui Su7Mi Xiang8Zhen Yuan1,2,3
 Yu-Tao Xiang1,2,3*
- 1Unit of Psychiatry, Department of Public Health and Medicinal Administration, Institute of Translational Medicine, Faculty of Health Sciences, University of Macau, Macao, China
- 2Centre for Cognitive and Brain Sciences, University of Macau, Macao, China
- 3Institute of Advanced Studies in Humanities and Social Sciences, University of Macau, Macao, China
- 4College of Education for the Future, Beijing Normal University, Zhuhai, China
- 5The National Clinical Research Center for Mental Disorders & Beijing Key Laboratory of Mental Disorders, The Advanced Innovation Center for Human Brain Protection, Beijing Anding Hospital, Capital Medical University, Beijing, China
- 6Department of Psychology, Faculty of Social Sciences, University of Macau, Macao, China
- 7Center on Smart and Connected Health Technologies, Mays Cancer Center, School of Nursing, UT Health San Antonio, San Antonio, TX, United States
- 8School of Public Health, Shanghai Jiao Tong University, Shanghai, China
Background: Prevalence estimates of major depressive disorder (MDD) among adults in China have varied widely between studies. In this systematic review and meta-analysis, the overall prevalence of MDD in the Chinese population was estimated from published epidemiological studies and potential moderators that account for variability in estimates were assessed.
Methods: A systematic literature search was conducted in PubMed, EMBASE, Web of Science, PsycINFO, China National Knowledge Internet (CNKI), and WanFang databases to identify relevant studies. Data analyses were conducted using the Comprehensive Meta-Analysis Version 2.0.
Results: Forty studies comprising 1,024,087 subjects were included. The pooled point, 12-month, and lifetime prevalence rates of MDD in China were 1.1% (95% CI: 0.9–1.4%), 1.6% (95% CI: 1.0–2.5%), and 1.8% (95% CI: 1.5–2.2%), respectively. Subgroup and meta-regression analyses revealed gender, marital status, survey year, being published in English language, use of the Diagnostic and Statistical Manual of Mental Disorders (DSM) diagnostic systems and age as significant moderators of MDD prevalence.
Conclusion: The overall prevalence of MDD in the Chinese population appears to be lower than that of most countries, but the rates have been increasing over time and are elevated in particular demographic subgroups. Due to the negative consequences of MDD, effective preventive measures, early identification, and timely treatments are still important and should be offered to those in need.
Introduction
Major depressive disorder (MDD) is a potentially severe psychiatric disorder associated with great personal suffering (1, 2) and enormous economic burdens on families and societies (3). During the past several decades, the epidemiology of MDD has been widely studied. For example, the Global Burden of Diseases, Injuries, and Risk Factors Study 2017 (GBD 2017) (4) found that 2% of the global population (approximately 163 million people) is affected by MDD.
MDD prevalence is also influenced by socio-cultural and economic factors (5). For example, in the World Mental Health (WMH) survey, the lifetime prevalence of MDD was 6.6% in Japan while the corresponding figure was 21.0% in France (5). Furthermore, the average lifetime prevalence of MDD (14.6%) in high income countries was elevated compared to the rate in low-middle income countries (11.1%) (5). Compared to men, women usually have a higher risk of MDD (5, 6). Older age (7) and unstable marital status (5, 8, 9) are also associated with higher likelihood of MDD. Because the epidemiology of MDD is strongly influenced by the particular socioeconomic context under examination (10–12), its epidemiology should be evaluated separately in different countries and regions or during different time periods relative to global estimates.
The prevalence of MDD has been studied in numerous China-based studies (13–17), but estimates have been highly inconsistent, varying from 0.2% (18) to 6.9% (19). Discrepancies between studies could be due to differences in survey periods, sampling, study sites, diagnostic criteria, and sample demographic characteristics. In order to reduce the negative outcomes of MDD, develop effective preventive measures, and allocate health resources for those at higher risk, it is necessary to understand the overall prevalence of MDD as well as changes in its rate over time and factors that contribute to variable rates. Evidence-based strategies such as systematic reviews and meta-analyses are efficient, timely approaches to addressing these issues.
One past meta-analysis (20) of 17 studies (total sample N = 176,435) found that the pooled 1-month, 12-month, and lifetime prevalence rates of MDD in mainland China were 1.6%, 2.3%, and 3.3%, respectively. Unfortunately, however, this review had important limitations including the failure to consider moderating factors (e.g., survey year, publication language, sample demographics), a lack of study quality assessment, and the exclusion of publication bias tests, all of which could affect the specificity or validity of findings. Therefore, we conducted this updated meta-analysis to examine the prevalence of MDD in the Chinese general population as well as potential methodological factors and demographic characteristics that contribute to variability in rates between studies and population subgroups.
Methods
This meta-analysis was conducted according to the Preferred Reporting Items for Systematic Reviews and Meta-Analyses (PRISMA) (21), with the registration number of CRD42020184099 on PROSPERO.
Literature Search and Selection
Three researchers (YJZ, YJ, WWR) independently and systematically conducted literature searches in PubMed, EMBASE, Web of Science, PsycINFO, China National Knowledge Internet (CNKI), and WanFang databases from their inception to September 26, 2019. The search strategy was developed based on the PICOS principle. Population (P): Chinese population; Intervention (I): not applicable; Comparators (C): not applicable; Outcome (O): lifetime, 1-year, and 1-month prevalence of MDD; Study design (S): epidemiological, cross-sectional surveys. The following search terms were used: “major depressi*,” “epidemiology,” “survey,” “prevalence,” “rate,” “percentage,” “China,” and “Chinese.” Manual search was also conducted by reviewing reference lists of retrieved articles for additional studies. The same three researchers independently screened titles and abstracts to identify potentially relevant articles, and then the full texts of potentially relevant articles were read for eligibility. If multiple papers were published based on the same dataset, only the one with the most complete data was included. Any disagreement was resolved by consensus.
Study inclusion criteria were: (1) reported prevalence of MDD, or relevant data that could generate prevalence of MDD. The diagnosis of MDD was made based on international or local diagnostic criteria, such as the Diagnostic and Statistical Manual of Mental Disorders (DSM), International Classification of Diseases (ICD), or Chinese Classification and Diagnostic Criteria of Mental Disorders (CCMD) system; (2) studies were conducted in mainland China; (3) reported prevalence timeframe, such as 1-year or 1-month prevalence. Exclusion criteria were: (1) case studies, reviews, systematic reviews, meta-analyses, commentaries; (2) studies conducted in special populations, such as adolescents, the elderly, women, or patients with chronic diseases.
Data Extraction
Two researchers (YJZ and YJ) independently extracted data on participant and study characteristics, such as the first author, publication year, study location, survey period, sample size, sampling method, and prevalence of MDD. Any disagreement was resolved by consensus.
Quality Assessment
Following other studies (22, 23), study quality was evaluated by Loney's 8-item scale (24) which includes the following domains: definition of the target population, sampling method, response rate, non-responder description, representativeness of samples, data collection method, diagnostic criteria, and precision of prevalence estimates. The total score ranged from 0 to 8. A total score of 7–8 was defined as “high quality,” while 4–6 scores were coded as “moderate quality” and 0–3 scores were rated as “low quality.” Two researchers (YJZ and YJ) independently evaluated study quality, and any disagreement was resolved by consensus or in consultation with the corresponding author (YTX).
Data Analysis
Data analyses were performed with Comprehensive Meta-Analysis Version 2.0 (CMA V2.0, Biostat Inc., Englewood, New Jersey, USA). Percentage with MDD (%) represented individual effect sizes of included studies. I2 test was used to evaluate heterogeneity between studies. An I2> 50% indicates significant heterogeneity. Random-effects models were used in all analyses due to different basic demographic and clinical variables between studies. Subgroup analyses were conducted to explore moderating effects of categorical variables (i.e., publication language, diagnostic criteria, urban vs. rural living area, sex, education level, marital status) on prevalence rates. Sensitivity analyses were performed by removing each study one by one to explore potential sources of heterogeneity. Meta-regression analyses were performed to examine moderating effects of continuous variables (i.e., survey year, male percentage per sample, mean age, study quality rating score). Publication bias was examined via Egger's test and funnel plot inspection. Trim-and-fill analyses were performed to further assess the potential publication biases and generate adjusted overall rates after accounting for publication biases (25). Two-tailed p-values lower than 0.05 were considered as statistically significant.
Results
Study Characteristics
Of the 5,983 articles identified in the literature search, 40 studies from 41 articles involving 1,024,087 subjects were included in this meta-analysis. Two articles (26, 27) were based on one study, but one article reported subgroup details of lifetime prevalence (26) while the other reported subgroup details of 1-month prevalence (27). Therefore, both of them were included though analyses were conducted separately for lifetime, 1-year, and 1-month prevalence. Literature search, screening, and selection processes are displayed in Figure 1.
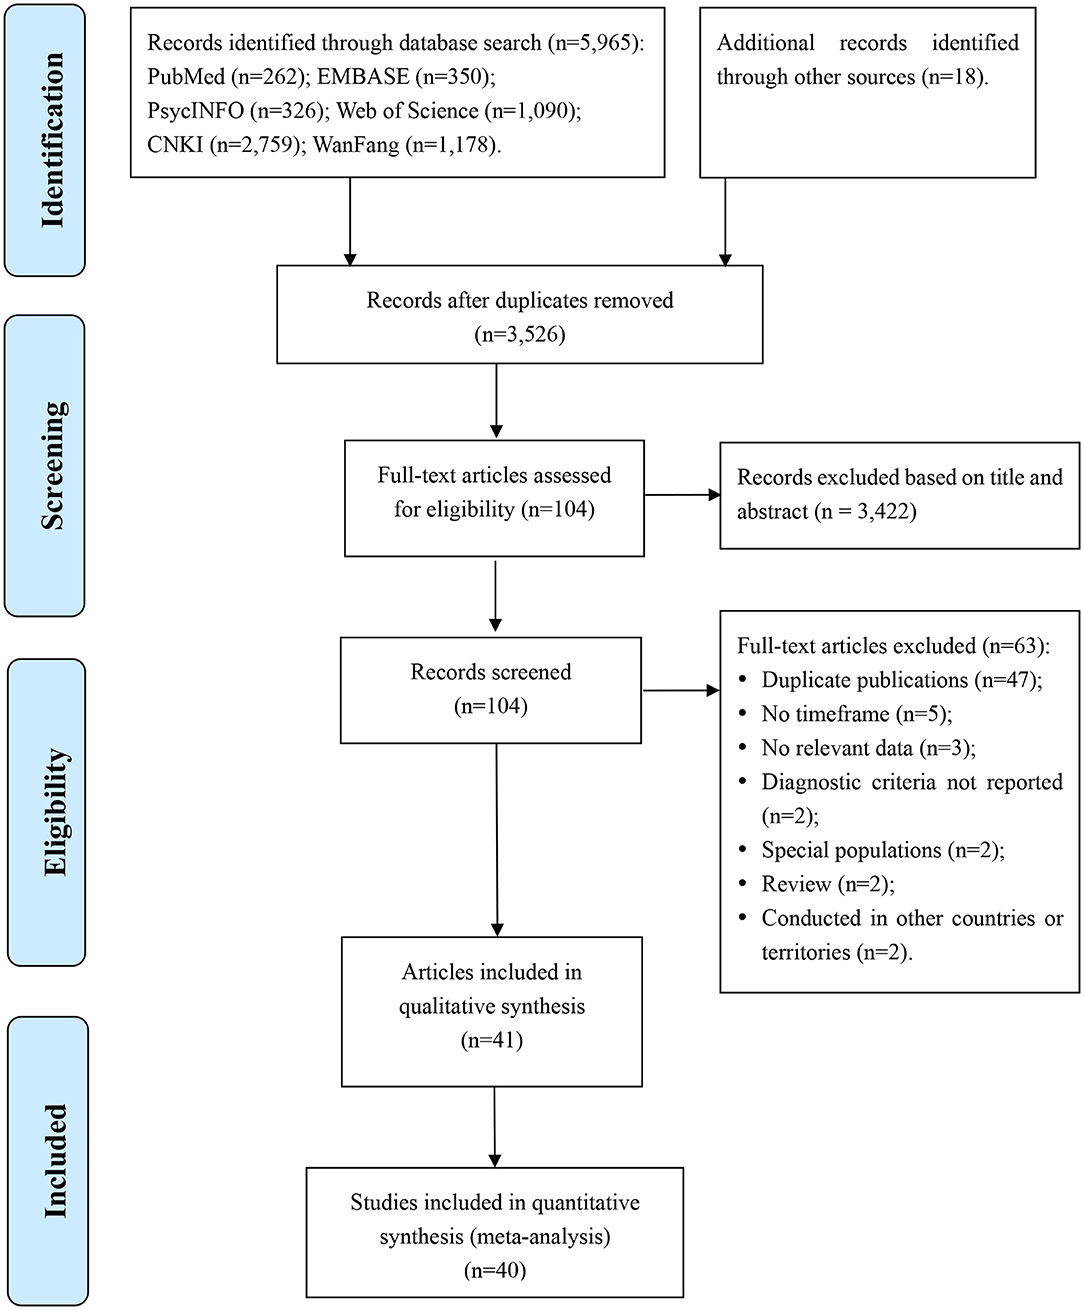
Figure 1. Flow diagram.
Study characteristics are presented in Table 1. Seven studies were published in English-language journals while the other 33 studies were published in Chinese-language journals. Twenty-nine studies used the DSM, 4 studies used the ICD, and 5 studies used the CCMD criteria while two studies used both ICD and CCMD criteria. Studies were conducted between 1982 and 2016 in 27 provinces or municipalities of China. The mean age of participants ranged from 32 to 55 years.
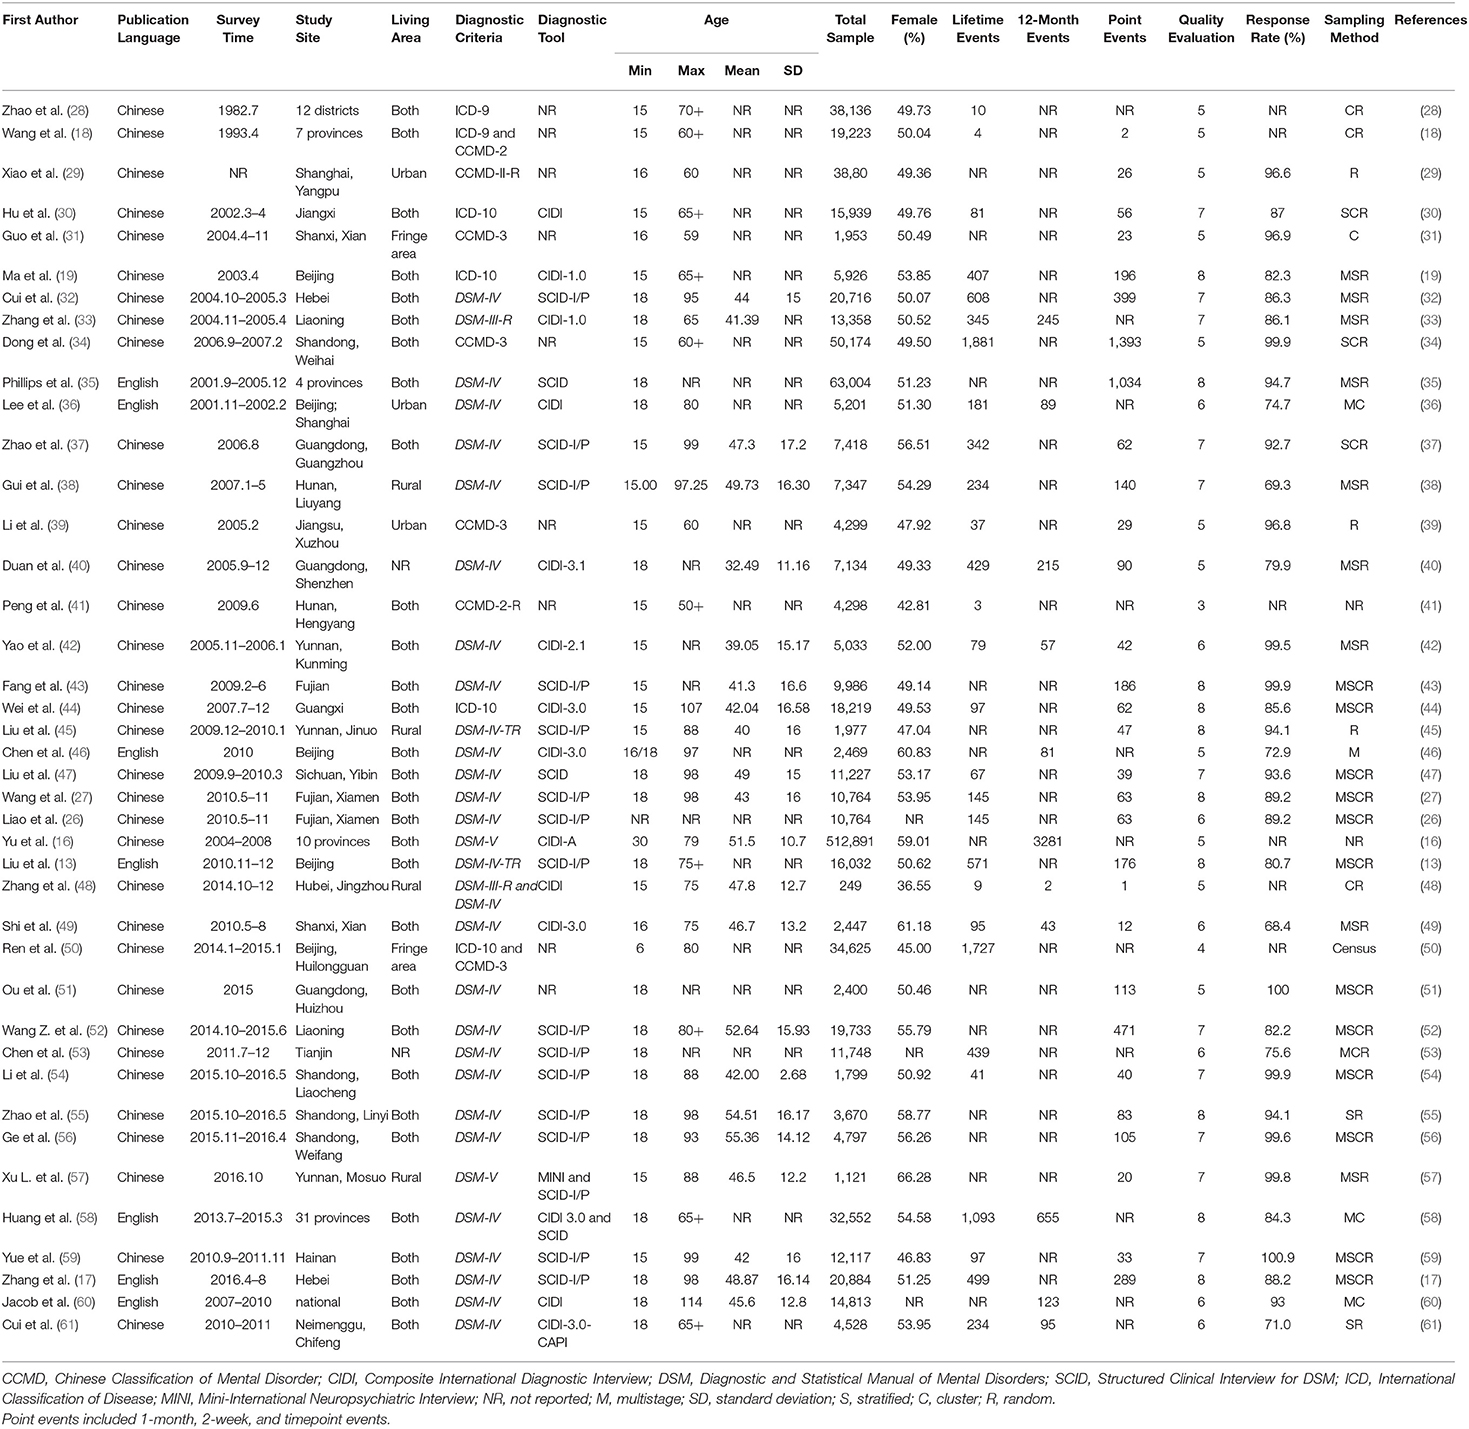
Table 1. Characteristics of studies included in this meta-analysis.
Pooled Prevalence of MDD in China
Of the 40 studies, 27 reported lifetime prevalence of MDD; based on this subset, the pooled lifetime prevalence of MDD was 1.8% (95% CI: 1.5–2.2%, I2 = 98.97%, p < 0.001; Figure 2). Based on 11 studies that reported the 12-month prevalence of MDD, the pooled 12-month prevalence rate was 1.6% (95% CI: 1.0–2.5%, I2= 99.34%, p < 0.001; Figure 3). Finally, based on 29 studies that reported point prevalence of MDD, the pooled point prevalence rate was 1.1% (95% CI: 0.9–1.4%, I2 = 98.01%, p < 0.001; Figure 4). In sensitivity analyses, no significant changes were found after included studies were removed individually.
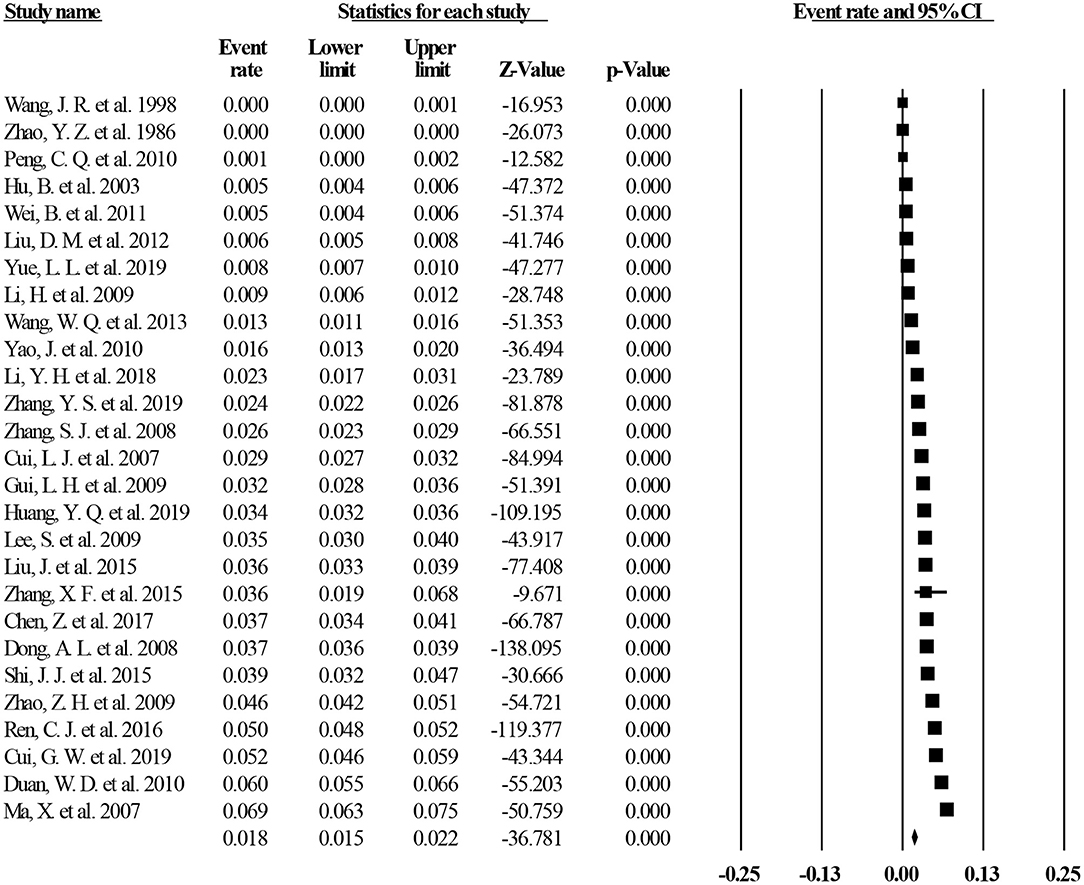
Figure 2. Lifetime prevalence of MDD in China.
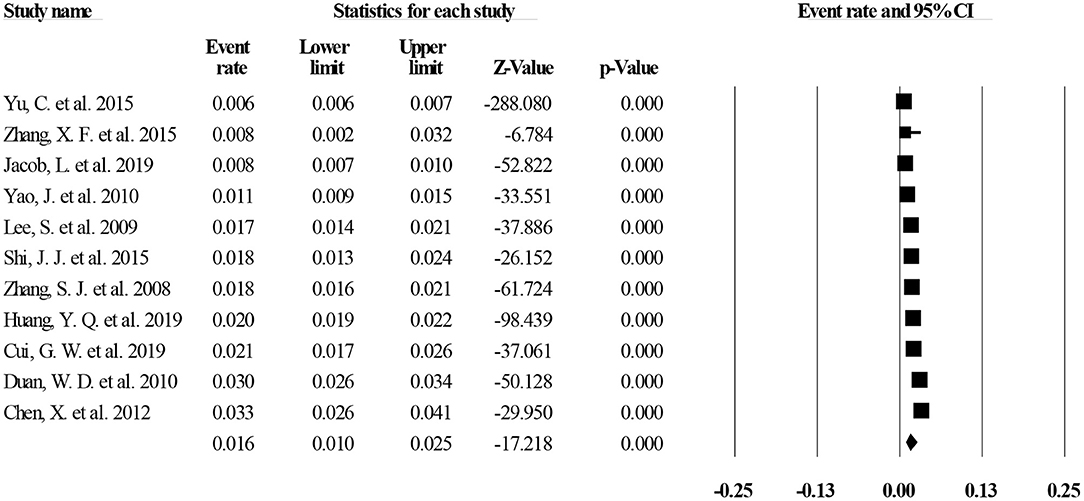
Figure 3. Twelve-month prevalence of MDD in China.
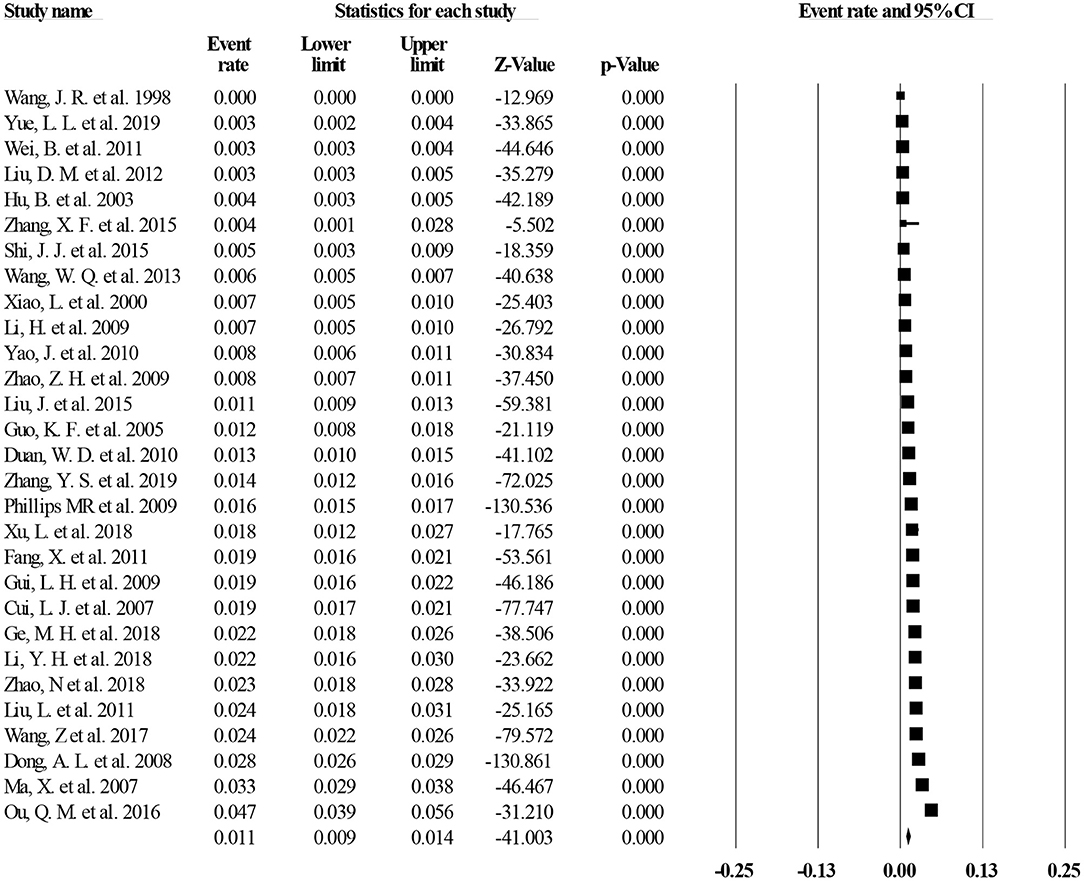
Figure 4. Point prevalence of MDD in China.
Subgroup Analyses
Subgroup analyses revealed that a higher lifetime prevalence of MDD was associated with studies published in English language and studies using DSM diagnostic systems (both p < 0.001). For sex, women had a higher point prevalence of MDD (p = 0.001) though sex differences were not significant for 1-year or lifetime prevalence. Marital status was significantly associated with both lifetime and point prevalence of MDD (both p < 0.001). Divorced and remarried participants had the highest MDD prevalence (10.0% for lifetime and 5.4% for point prevalence), followed by widowed participants (5.7% for lifetime and 2.5% for point prevalence), married participants (2.3% for lifetime and 1.1% for point prevalence), and never-married cohorts (1.4% for lifetime and 0.7% for point prevalence) (Tables 2, 3). There were no significant moderating effects for rural vs. urban residence or education level on the primary results (Tables 2–4).
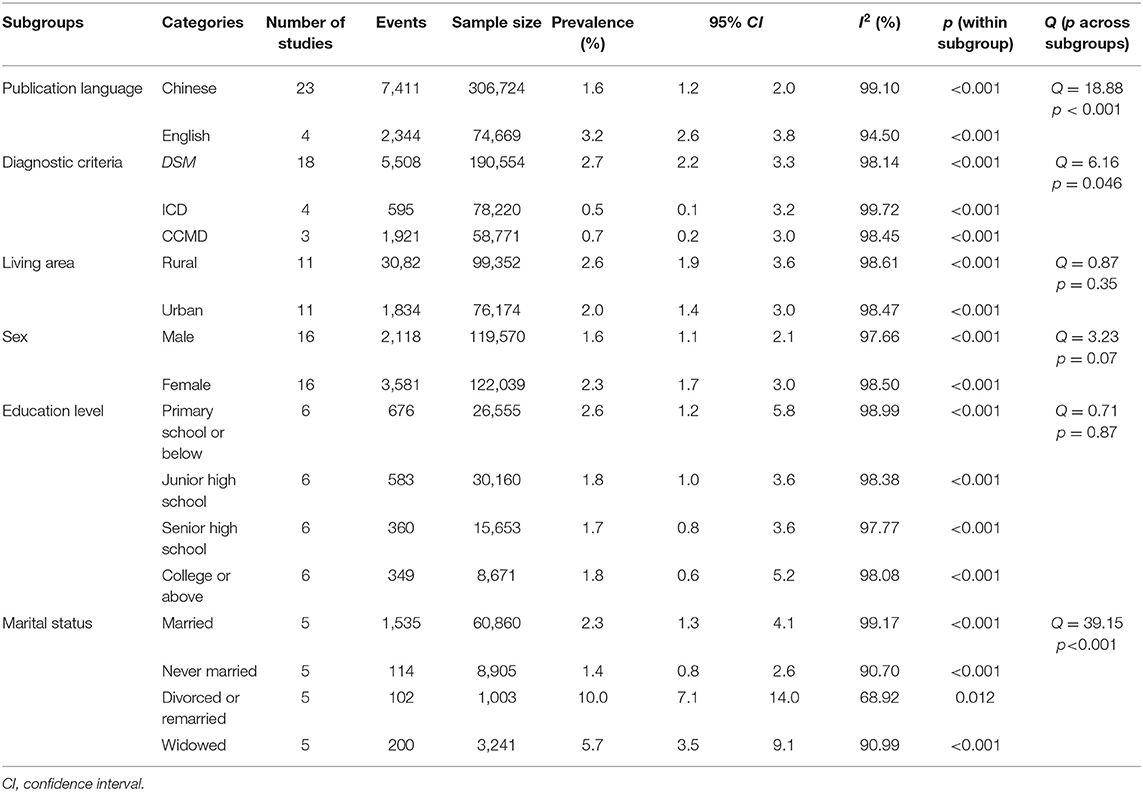
Table 2. Subgroup analyses of lifetime prevalence of MDD in China.

Table 3. Subgroup analyses of point prevalence of MDD in China.
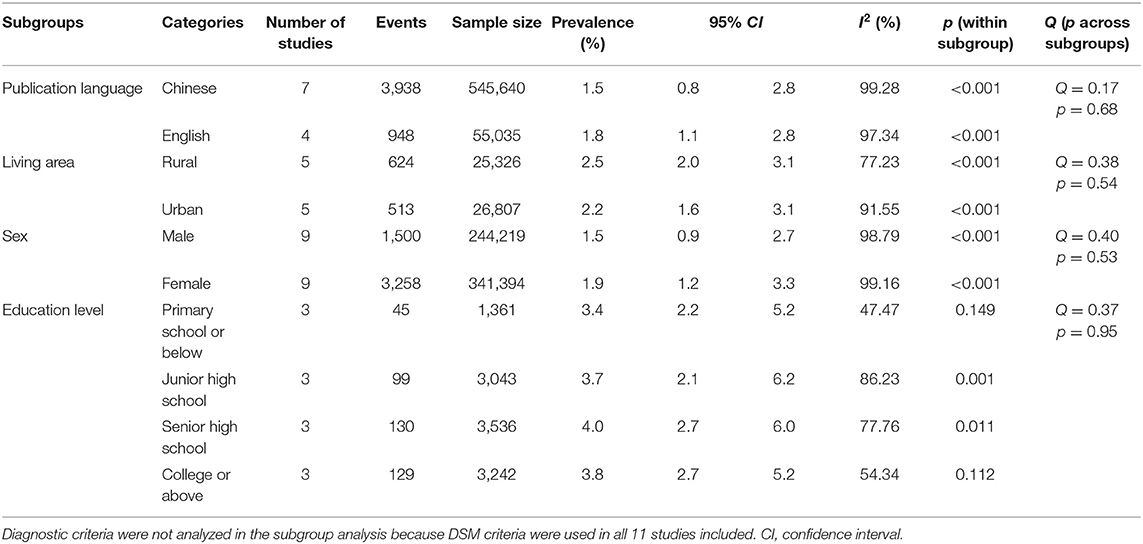
Table 4. Subgroup analyses of 12-month prevalence of MDD in China.
Meta-Regression Analyses
In meta-regression analyses both lifetime and point prevalence of MDD had significant positive associations with more recent survey dates (r = 0.125 for lifetime, p <0.001; r = 0.09 for point prevalence, p <0.001), while lifetime prevalence of MDD was negatively associated with percentage of males per sample (r = −7.16, p = 0.01). Studies with higher quality reported higher lifetime prevalence of MDD (r = 0.23, p = 0.009). Finally, mean age of the participants was negatively related with the 12-month prevalence of MDD (r = −0.07, p <0.001; Supplementary Table 2). Moderating effects of other continuous demographics on MDD prevalence were not significant.
Quality Assessment and Publication Bias
The mean quality assessment score was 6.4 and ranged from 3 to 8. Of the 41 articles, 21 (51.2%) were rated high quality, 19 (46.3%) were rated moderate quality, and 1 (2.4%) was rated low quality (Supplementary Table 1). Egger's tests found that publication bias existed in studies on lifetime, 12-month, and point prevalence of MDD (all p < 0.05), as shown in Table 5. The Duval and Tweedie trim-and-fill analyses suggested that 10, 6, and 11 studies with higher or lower than average prevalence estimates might be missing from effect size distributions and would need to be imputed to achieve approximately symmetrical funnel plots of lifetime, 12-month, and point prevalence of MDD, respectively. Using trim-and-fill analyses, imputed estimates for lifetime, 12-month, and point prevalence of MDD would change to 3.8% (95% CI: 3.0–4.8%), 0.7% (95% CI: 0.5–1.2%), and 2.0% (95% CI: 1.6–2.5%), respectively. Funnel plots and imputed funnel plots were shown in Supplementary Figures 1–6.
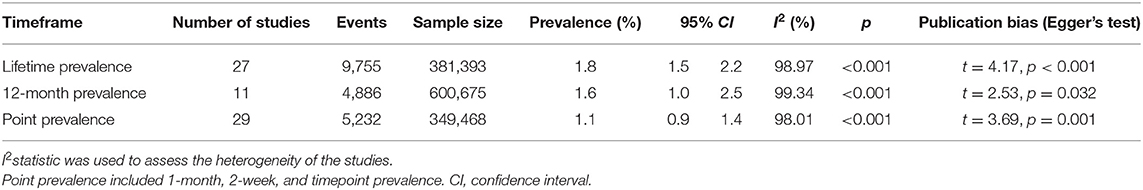
Table 5. Pooled prevalence of MDD in China.
Discussion
To the best of our knowledge, this systematic review and meta-analysis included the largest number of studies and largest overall sample size estimating MDD prevalence in the Chinese population to date. The point prevalence in this meta-analysis was 1.1% (95% CI: 0.9–1.4%), which is significantly lower than the corresponding findings of previous meta-analyses in other countries; for instance, the point prevalence was 4.1% (95% CI: 3.1–5.5%) in a meta-analysis of MDD in Iran (62). Similarly, the overall 12-month prevalence (1.6%; 95% CI: 1.0–2.5%) and lifetime prevalence (1.8%; 95% CI: 1.5–2.2%) estimates of MDD in this meta-analysis were noticeably lower than rates from previous studies; for instance, in the World Mental Health Survey (WMH) the mean 12-month prevalence of MDD was 5.9% and ranged from 3.8% to 10.4% while the mean lifetime prevalence of MDD was 11.1%, and ranged from 6.5% to 18.4% in low-middle income countries (5).
Several factors might be responsible for the lower prevalence of MDD in this meta-analysis. In general, patients with psychiatric disorders including depression in China are ashamed of reporting their symptoms or feelings to others due to the stigma of mental illness and the fear of discrimination (63, 64). In addition, several authors have argued that Chinese patients with depression are more likely to somatize their distressing symptoms, which could lead to underestimated prevalence of psychiatric disorders (65–68).
Notably, however, MDD estimates from this meta-analysis were also lower than those generated from a previous meta-analysis on MDD in China (point prevalence: 1.6%, 95% CI: 1.2–1.9%; 12-month prevalence: 2.3%, 95% CI: 1.8–3.4%; lifetime prevalence: 3.3%, 95% CI: 2.4–4.1%) (20). Several epidemiological studies reporting very low MDD prevalence (18, 28, 41) were overlooked in Gu et al.'s meta-analysis and may have biased their findings, though, unfortunately, effects of publication biases were not evaluated in that review. In addition, compared to Gu et al.'s meta-analysis, 23 additional studies were included in this meta-analysis, increasing the statistical power of the findings. Finally, publication bias analyses from this review suggested that the number of studies with higher point and lifetime prevalence estimates may be underrepresented in the updated literature on MDD rates in Chinese samples. Trim and fill analyses suggested that point and lifetime prevalence estimates increase substantially when missing studies are considered in analyses and converge more closely with estimates from other countries and preliminary data from China.
Similar to previous studies (6, 69), both subgroup and meta-regression analyses revealed that women were more likely to suffer from MDD, a finding that may be attributed, in part, to hormonal influences in women (70, 71) and/or culturally sanctioned norms that encourage women to express depressive feelings and to seek professional help for distress (72–75). Associations between prevalence of MDD and age have been mixed in past work. Some researchers have proposed a U-shaped relationship between age and MDD prevalence, wherein adolescents and the elderly are high-risk populations for depression (76, 77). In other studies, such as the WHO World Mental Health Survey, elderly populations had a lower 12-month prevalence than did younger populations in developed countries (7). In this meta-analysis, older mean age of the participants was associated with lower 12-month prevalence of MDD. Due to their sometimes poor health status and more frequent negative life events such as retirement and increased risk of physical diseases, the elderly might be expected to have a higher risk of depression. However, the elderly are usually psychologically protected by social support systems and social welfare policies and often live with their families, all of which may reduce the risk of depression (36, 78, 79).
We found that rural residents had a higher lifetime, 12-month, and point prevalence of MDD than those living in urban areas, although differences were not statistically significant. This is consistent with results from the previous meta-analysis of MDD prevalence in China (point prevalence: 2.0% [95% CI: 1.2–2.9%] in rural areas, and 1.7% [95% CI: 0.8–2.7%] in urban areas) (20). Epidemiological studies have consistently found that urbanization level is negatively associated with the risk of depression (80, 81). However, some studies in other countries such as in the United States (82), Canada (83), the Netherlands (84), and Malaysia (85) found that urban residents had a higher risk developing depression compared to their rural counterparts. These discrepancies might be attributed to different cultural environments and sample differences in socioeconomic status (86–88). For instance, unlike in developed countries, primary care services in rural areas of China are greatly underdeveloped in rural areas, which could increase the likelihood of depression in rural regions.
For marital status, divorced or remarried subgroups had the highest prevalence of MDD compared with other marital status subgroups in this meta-analysis, in line with previous studies (89–91). We also found that the never married had the lowest point and lifetime prevalence of MDD of any marital status subgroups. However, this latter finding contrasts with evidence from data from the United States, Canada, and Japan, wherein the prevalence of depression among the never married has been higher than the rate among those who are married (92–95), potentially because the depressed are less likely to get married (96, 97). Variability between countries in associations between marital status and depression prevalence underscore culture as a potent influence on patterns of variability (5). We speculate that marriage-related conflicts and family-supporting pressure may increase risk for depression in married rather than never-married subgroups in Chinese samples.
Meta-regression analyses revealed that survey year was positively associated with lifetime and point prevalence of MDD; this is a novel finding that was not reported in the previous meta-analysis from China (20). Traditionally, Chinese people with depression tend to somatize their depressive symptoms due to perceived stigma and social discrimination related to mental illness (66, 98–100). With recent social developments and public education to increase awareness of psychiatric disorders, particularly depression, in China, prejudice to mental illness has been decreasing; thus, people with MDD may be more willing to express their depressive feelings and to seek help, which could result in increased prevalence of MDD (101, 102).
Higher study quality was also associated with higher lifetime prevalence of MDD. Stringent methodologies that include random sampling, large sample sizes, and, especially, strict training of interviewers in the appropriate conduct of diagnostic assessments are more typically used in high quality studies (103) and potentially increase the capacity to identify depressed patients, hence increasing reported MDD prevalence rates. Similarly, in this meta-analysis studies published in English-language journals reported a higher lifetime prevalence of MDD compared to those published in Chinese journals. Given that studies published in English language journals also had higher study quality assessment scores (mean score of 7) than those in Chinese journals (mean score of 6.2), it is possible that increased methodological rigor in studies from the former group facilitated the capacity to identify participants with MDD.
Previous meta-analyses of MDD prevalence have found that the ICD is the most sensitive diagnostic tool in identifying MDD in Chinese older adults or adolescents (104, 105), though the prevalence of MDD based on DSM, ICD, and CCMD criteria is often similar in the general population (106–108). In this meta-analysis, studies using the DSM diagnostic criteria reported significantly higher lifetime prevalence of MDD than those using the ICD or CCMD criteria. The larger proportion of included studies using the DSM (n = 18) vs. the ICD (n = 4) or CCMD (n = 3) suggests rates generated from the latter two systems may be less reliable because they are based on disproportionately fewer studies. In addition, most studies using the ICD or CCMD were conducted before 2010, while most studies using the DSM were conducted after 2010. As such, the above-mentioned positive relationship between prevalence of MDD and survey year may have also contributed to the moderating effect of diagnostic criteria on lifetime prevalence of MDD.
Strengths of this meta-analysis included the large number of studies and very large overall sample size as well as the inclusion of additional analyses designed to evaluate potential moderating influences on MDD rates, study quality assessment, and publication biases. Several methodological limitations should be noted. First, there was significant heterogeneity in results between studies. Such variability is often unavoidable in meta-analyses of epidemiological studies based on different participant characteristics, sampling methods, and assessment instruments found between studies (109, 110). Fortunately, moderator analyses were useful in identifying sociodemographic factors that contributed to heterogeneity in addition to at-risk subgroups (e.g., divorced, remarried, widowed, younger) that can benefit potentially from targeted outreach efforts. Second, certain factors associated with epidemiology of MDD, such as occupational status, family history of MDD, and social support, were not analyzed due to insufficient data. Third, all the included studies were based on cross-sectional designs so within sample changes in MDD rates over time and causal effects of other factors on MDD rates could not be determined. Fourth, only published data were synthesized. Unpublished data that were not included in the target databases were inaccessible and therefore were not included.
In conclusion, the prevalence of MDD in the general populations in China appeared to be lower than rates from meta-analyses from other countries though there was a trend toward increasing rates over time. Moderator analyses suggested that certain demographic subgroups including women and divorced, remarried, or widowed persons have comparatively higher levels of MDD and could benefit from targeted interventions. However, despite the low prevalence of MDD in China, considering the negative health impact and adverse consequences of MDD on quality of life and other outcomes, effective preventive measures, early identification, and timely treatments, particularly within at risk demographic groups, remain important and should be offered to those in need.
Data Availability Statement
The original contributions presented in the study are included in the article/Supplementary Material, further inquiries can be directed to the corresponding author/s.
Author Contributions
Y-TX: study design. Y-JZ, YJ, W-WR, Q-EZ, and LZ: collection, analysis, and interpretation of data. Y-JZ, YJ, and Y-TX: drafting of the manuscript. TJ and Z-HS: critical revision of the manuscript. All authors approved the final version for publication.
Funding
This study was supported by the National Science and Technology Major Project for investigational new drug (2018ZX09201-014), the Beijing Municipal Science & Technology Commission (No. Z181100001518005), and the University of Macau(MYRG2019-00066-FHS).
Conflict of Interest
The authors declare that the research was conducted in the absence of any commercial or financial relationships that could be construed as a potential conflict of interest.
Acknowledgments
The authors would like to thank the mental health professionals and subjects who were involved in the project.
Supplementary Material
The Supplementary Material for this article can be found online at: https://www.frontiersin.org/articles/10.3389/fpsyt.2021.659470/full#supplementary-material
References
1. American Psychiatric Association. Diagnostic and Statistical Manual of Mental Disorders, 5th ed. American Psychiatric Publishing Inc., Arlington, VA. (2013).
2. National Institute of Mental Health. Depression. (2018). Available online at: https://www.nimh.nih.gov/health/topics/depression/index.shtml (accessed May 22, 2020).
3. Global Burden of Disease Study 2013 Collaborators. Global, regional, and national incidence, prevalence, and years lived with disability for 301 acute and chronic diseases and injuries in 188 countries, 1990-2013: a systematic analysis for the Global Burden of Disease Study 2013. Lancet. (2015) 386:743–800. doi: 10.1016/S0140-6736(15)60692-4
4. GBD 2017 Disease and Injury Incidence and Prevalence Collaborators. Global, regional, and national incidence, prevalence, and years lived with disability for 354 diseases and injuries for 195 countries and territories, 1990–2017: a systematic analysis for the Global Burden of Disease Study 2017. Lancet. (2018) 392:1789–858. doi: 10.1016/S0140-6736(18)32279-7
5. Kessler RC, Bromet EJ. The epidemiology of depression across cultures. Annu Rev Public Health. (2013) 34:119–38. doi: 10.1146/annurev-publhealth-031912-114409
6. Van de Velde S, Bracke P, Levecque K. Gender differences in depression in 23 European countries. Cross-national variation in the gender gap in depression. Soc Sci Med. (2010) 71:305–13. doi: 10.1016/j.socscimed.2010.03.035
7. Kessler RC, Birnbaum HG, Shahly V, Bromet E, Hwang I, McLaughlin KA, et al. Age differences in the prevalence and co-morbidity of DSM-IV major depressive episodes: results from the WHO World Mental Health Survey Initiative. Depress Anxiety. (2010) 27:351–64. doi: 10.1002/da.20634
8. Cavanaugh CE, Petras H, Martins SS. Gender-specific profiles of adverse childhood experiences, past year mental and substance use disorders, and their associations among a national sample of adults in the United States. Soc Psychiatry Psychiatr Epidemiol. (2015) 50:1257–66. doi: 10.1007/s00127-015-1024-3
9. Ebert DD, Buntrock C, Mortier P, Auerbach R, Weisel KK, Kessler RC, et al. Prediction of major depressive disorder onset in college students. Depress Anxiety. (2019) 36:294–304. doi: 10.1002/da.22867
10. Compton WM, Conway KP, Stinson FS, Grant BF. Changes in the prevalence of major depression and comorbid substance use disorders in the United States between 1991-1992 and 2001-2002. Am J Psychiatry. (2006) 163:2141–7. doi: 10.1176/ajp.2006.163.12.2141
11. Holden G, Corter AL, Hatters-Friedman S, Soosay I. Brief report. A qualitative study of maternal mental health services in New Zealand: perspectives of Maori and Pacific mothers and midwives. Asia Pac Psychiatry. (2019) 12:e12369. doi: 10.1111/appy.12369
13. Liu J, Yan F, Ma X, Guo HL, Tang YL, Rakofsky JJ, et al. Prevalence of major depressive disorder and socio-demographic correlates: results of a representative household epidemiological survey in Beijing, China. J Affect Disord. (2015) 179:74–81. doi: 10.1016/j.jad.2015.03.009
14. Ma X, Xiang YT, Cai ZJ, Li SR, Xiang YQ, Guo HL, et al. Prevalence and socio-demographic correlates of major depressive episode in rural and urban areas of Beijing, China. J Affect Disord. (2009) 115:323–30. doi: 10.1016/j.jad.2008.09.010
15. Shi QC, Zhang JM, Xu FZ, Phillips MR, Xu Y, Fu YL, et al. Epidemiological survey of mental illnesses in the people aged 15 and older in Zhejiang Province, China (in Chinese). Chin J Prev Med. (2005) 39:229–36. doi: 10.3760/j:issn:0253-9624.2005.04.003
16. Yu C, Lyu J, Chen Y, Guo Y, Paul S, Bian Z, et al. Epidemiology of major depressive episodes among Chinese adults aged 30-79 years: data from the China Kadoorie Biobank (in Chinese). Chinese J Epidemiol. (2015) 36:52–6. doi: 10.3760/cma.j.issn.0254-6450.2015.01.013
17. Zhang YS, Rao WW, Cui LJ, Li JF, Li L, Ng CH, et al. Prevalence of major depressive disorder and its socio-demographic correlates in the general adult population in Hebei province, China. J Affect Disord. (2019) 252:92–8. doi: 10.1016/j.jad.2019.01.049
18. Wang J-R, Wang D-P, Shen Y-C, Zhang W-X, Li S-R, Chen C-H, et al. Epidemiological survey on affective disorder in 7 areas of China (in Chinese). Chin J Psychiatry. (1998) 31:75–7.
19. Ma X, Li S-R, Xiang Y-Q, Guo H-L, Hou Y-Z, Cai Z-J, et al. An epidemiological survey on depressive disorder in Beijing area (in Chinese). Chin J Psychiatry. (2007) 40:100–3. doi: 10.3760/j.issn:1006-7884.2007.02.009
20. Gu L, Xie J, Long J, Chen Q, Chen Q, Pan R, et al. Epidemiology of major depressive disorder in mainland china: a systematic review. PLoS ONE. (2013) 8:e65356. doi: 10.1371/journal.pone.0065356
21. Moher D, Liberati A, Tetzlaff J, Altman DG. Preferred reporting items for systematic reviews and meta-analyses: the PRISMA statement. BMJ. (2009) 339:b2535. doi: 10.1136/bmj.b2535
22. Boyle MH. Guidelines for evaluating prevalence studies. Evid Based Ment Health. (1998) 1:37–9. doi: 10.1136/ebmh.1.2.37
23. Yang C, Zhang L, Zhu P, Zhu C, Guo Q. The prevalence of tic disorders for children in China: a systematic review and meta-analysis. Medicine. (2016) 95:e4354. doi: 10.1097/MD.0000000000004354
24. Loney PL, Chambers LW, Bennett KJ, Roberts JG, Stratford PW. Critical appraisal of the health research literature: prevalence or incidence of a health problem. Chronic Dis Can. (1998) 19:170–6.
25. Duval S, Tweedie R. Trim and fill: a simple funnel-plot-based method of testing and adjusting for publication bias in meta-analysis. Biometrics. (2000) 56:455–63. doi: 10.1111/j.0006-341X.2000.00455.x
26. Liao Z-H, Wang W-Q, Ding L-J, Hong X, Ji S-J, Wang Y-Z, et al. Suicide related characteristics and influencing factors of community patients with major depressive disorder (in Chinese). Chinese Gen Pract. (2014) 17:2300–5. doi: 10.3969/j.issn.1007-9572.2014.20.003
27. Wang W-Q, Ding L-J, Wen C, Liao Z-H, Hong X, Chen Y, et al. Epidemiological survey of mental disorders in people aged 18 years and older in Xiamen city (in Chinese). Chin J Psychiatry. (2013) 46:43–8. doi: 10.3760/cma.j.issn.1006-7884.2013.01.013
28. Zhao YZ. The epidemic survey program of mental disorders in 12 areas. The epidemiological survey of affective disorders (in Chinese). Chin J Psychiatry. (1986) 19:97–8.
29. Xiao L, Ji J, Zhang S, Wang W, Wu Y, Cheng Y, et al. A pilot survey of depressive symptons and depression in a community of shanghai (in Chinese). Chin J Behav Med Sci. (2000) 9:44–5. doi: 10.3760/cma.j.issn.1674-6554.2000.03.016
30. Hu B, Lu X-Y, Wei B, Chen X-S, Tu Y-L, Yu X-H, et al. Epidemiological survey of depression prevalence in Jiangxi Province (in Chinese). Chin J Psychiatry. (2003) 36:53–6. doi: 10.3760/j:issn:1006-7884.2003.04.014
31. Guo K-F, Guo S, Guan J-X, Yang W-Q, Zhu Y-X, Wu Q-Q, et al. Incidence rate of depressive symptoms and the prevalence rate of depression in the crowds living in the fringe area of Xi'an city (in Chinese). Chin J Clin Rehabil. (2005) 9:4–5. doi: 10.3321/j.issn:1673-8225.2005.16.002
32. Cui LJ, Li KQ, Jiang QP, Cui Z, Gao LH, Zhang Y, et al. The prevalence of major depression disorders in Hebei Province from 2004 to 2005 (in Chinese). Chin J Psychiatry. (2007) 40:140–3. doi: 10.3760/j.issn:1006-7884.2007.03.004
33. Zhang S-J, Jiang C, Wang P, Liu M-J, Liu H, Yu C-Y, et al. Epidemiological survey of mood disorders among urban and rural residents in Liaoning province (in Chinese). Chin J Prev Control Chr Non Commun Dis. (2008) 16:378–81. doi: 10.3969/j.issn.1004-6194.2008.04.016
34. Dong A-L, Zhang K, Wang S-S, Sun J-G, Zhang L-X, Zhang C-H, et al. Epidemiological survey of mental disorders in Weihai (in Chinese). J Clin Psychol Med. (2008) 18:241–3.
35. Phillips MR, Zhang J, Shi Q, Song Z, Ding Z, Pang S, et al. Prevalence, treatment, and associated disability of mental disorders in four provinces in China during 2001-05: an epidemiological survey. Lancet. (2009) 373:2041–53. doi: 10.1016/S0140-6736(09)60660-7
36. Lee S, Tsang A, Huang YQ, He YL, Liu ZR, Zhang MY, et al. The epidemiology of depression in metropolitan China. Psychol Med. (2009) 39:735–47. doi: 10.1017/S0033291708004091
37. Zhao Z, Huang Y, Li J, Deng H, Huang X, Su J, et al. An epidemiological survey of mental disorders in Guangzhou area (in Chinese). Chin J Nerv Ment Dis. (2009) 35:530–4. doi: 10.3969/j.issn.1002-0152.2009.09.005
38. Gui LH, Xiao SY, Fang L, Zhang DX. Prevalence and distribution of depression in rural residents of Liuyang (in Chinese). Chin J Clin Psychol. (2009) 17:459–61.
39. Li H, Zhang J, Zhao H, Ma S, Liang L, Chen F, et al. An epidemiological survey of depression in urban population of Xuzhou (in Chinese). J Clin Psychosom Dis. (2009) 15:133–4.
40. Duan W-D, Liu T-B, Hu C-Y, Gao H, Hu J-Z, Zhang X, et al. Cross-sectional survey of depressive disorder in Shenzhen City in 2005 (in Chinese). Chin J Psychiatry. (2010) 43:211–6. doi: 10.3760/cma.j.issn.1006-7884.2010.04.007
41. Peng C-Q, Liu J-H, Cao S-Y. An epidemiological survey of affective disorders in Hengyang city (in Chinese). J Commun Med. (2010) 8:63–5.
42. Yao J, Huang Y-Q, Ruan Y, Lu J, Gao C-Q, Dang W-M, et al. Epidemiological survey of affective disorder in Kunming City (in Chinese). Chin Ment Health J. (2010) 24:110–5.
43. Fang X, Chen Y-S, Chen X-X, Xiong D-H, Ji J-W, Shi G-Q, et al. Epidemiological survey of mental disorder in Fujian province (in Chinese). Chin J Psychiatry. (2011) 44:103–7. doi: 10.3760/cma.j.issn.1006-7884.2011.02.011
44. Wei B, Chen Q, Pan R-D, Feng Q-M, Chen Q-M, Huang G-G, et al. Prevalence of major depression disorders in urban and rural residents of Guangxi Zhuang Autonomous Region, China (in Chinese). Chin J Public Health. (2011) 27:399–401. doi: 10.11847/zgggws2011-27-04-08
45. Liu L, Zu-Xin Z, Yang J-Z, Geng H-C, Xie L-Q, Li Q-Y, et al. Prevalence and related factors of depression disorder in Jino ethnic minority (in Chinese). Chin Ment Health J. (2011) 25:500–5. doi: 10.3969/j.issn.1000-6729.2011.07.006
46. Chen X, Cheng HG, Huang Y, Liu Z, Luo X. Depression symptoms and chronic pain in the community population in Beijing, China. Psychiatry Res. (2012) 200:313–17. doi: 10.1016/j.psychres.2012.04.013
47. Liu D-M, Yang Y-H, Wang Z-Q, Xiang D-H, Wang S-Y, Yang C-M, et al. Epidemiological survey of severe depression among adults in Yibin city (in Chinese). Chin J Prev Med. (2012) 13:507–10. doi: 10.16506/j.1009-6639.2012.07.022
48. Zhang X, Luo M. An epidemiological survey on mental disorders in rural residents of Jingzhou city (in Chinese). J Yangtze Univ. (2015) 12:67–9. doi: 10.16772/j.cnki.1673-1409.2015.30.030
49. Shi J, Chen X, Wang B, Huang Y, Liu Z, Yan Y. Epidemiological survey of affective disorder in Xi'an community (in Chinese). China J Health Psychol. (2015) 23:481–4. doi: 10.13342/j.cnki.cjhp.2015.04.001
50. Ren C-J, Tian L, Han J-X. Survey on epidemiology of mental diseases in the rural-urban fringe zone (in Chinese). China Health Industry. (2016) 13:91–3. doi: 10.16659/j.cnki.1672-5654.2016.20.091
51. Ou Q-M, Deng S-L, Zhai W-G. Epidemiological investigation on influence factors of urban and rural depression and effective analysis in Huizhou, Guangdong in 2015 (in Chinese). Modern Diagn Treat. (2016) 27:2066–8.
52. Wang Z, Meng XF, Ren JT, Wang JH, Wang MT, Gong J, et al. Prevalence of mental disorders among adult residents in Liaoning prov ince, China (in Chinese). Chin J Public Health. (2017) 33:1677–84. doi: 10.11847/zgggws2017-33-12-02
53. Chen Z, Ma J, Xu G-M, Yin H-F. The relationship between traumatic event exposure rate and major depressive disorder prevalence in community population in Tianjin (in Chinese). Tianjin Medical J. (2017) 45:1320–3. doi: 10.11958/20170627
54. Li YH, Wang YM. Analysis of the fourth mental disorder epidemiological investigation in Liaocheng city (in Chinese). J Psychiatry. (2018) 31:279–82. doi: 10.3969/j.issn.2095-9346.2018.04.011
55. Zhao N, Tian X, Sun B, Zheng S-Q, Cui Y-C, Sun Z-X, et al. An epidemiological survey of mental disorders in people aged 18 and above in Linyi (in Chinese). J Shandong Med Coll. (2018) 40:104–9. doi: 10.3969/j.issn.1674-0947.2018.02.009
56. Ge M-H, Gao W-B, Dong L, Xu A-P, Lin Y, Wang C-H, et al. Epidemiological survey of mental disorders in persons aged 18 years and older in Weifang (in Chinese). Chin J Nerv Ment Dis. (2018) 44:589–93. doi: 10.3969/j.issn.1002-0152.2018.10.003
57. Xu L, Wang Q, Yang J, Lin Y, Zhang H, Feng G, et al. The epidemiological investigation of major depressive disorder and dysthymia in Mosuo ethnic minority of Ninglang area, Yunan province (in Chinese). Chin J Behav Med Brain Sci. (2018) 27:758–62. doi: 10.3760/cma.j.issn.1674-6554.2018.08.017
58. Huang Y, Wang Y, Wang H, Liu Z, Yu X, Yan J, et al. Prevalence of mental disorders in China: a cross-sectional epidemiological study. Lancet Psychiatry. (2019) 6:211–24. doi: 10.1016/S2215-0366(18)30511-X
59. Yue L, Yu X, Chen D, Zhan D, He Y, Chen W, et al. Prevalence and correlates of depression among residents (more than 15 years old) in Hainan Province (in Chinese). Chin J Psychiatry. (2019) 52:212–8. doi: 10.3760/cma.j.issn.1006-7884.2019.03.008
60. Jacob L, Pizzol D, Veronese N, Stubbs B, Koyanagi A. Physical injury and depression in six low- and middle-income countries: a nationally representative study. J Affect Disord. (2019) 248:99–107. doi: 10.1016/j.jad.2019.01.023
61. Cui G, Huang Y, Li G, Liu Z, Geng H, Li Y. A cross-sectional study of major depressive disorder in people aged 18 and over in Chifeng City (in Chinese). Chin Ment Health J. (2019) 33:15–20. doi: 10.3969/j.issn.1000-6729.2019.01.003
62. Gharraee B, Zahedi Tajrishi K, Sheybani F, Tahmasbi N, Mirzaei M, Farahani H, et al. Prevalence of major depressive disorder in the general population of Iran: a systematic review and meta-analysis. Med J Islam Repub Iran. (2019) 33:151. doi: 10.47176/mjiri.33.151
63. Chen JA, Hung GC, Parkin S, Fava M, Yeung AS. Illness beliefs of Chinese American immigrants with major depressive disorder in a primary care setting. Asian J Psychiatr. (2015) 13:16–22. doi: 10.1016/j.ajp.2014.12.005
64. Sun Y, Chen G, Wang L, Li N, Srisurapanont M, Hong JP, et al. Perception of stigma and its associated factors among patients with major depressive disorder: a multicenter survey from an asian population. Front Psychiatry. (2019) 10:321. doi: 10.3389/fpsyt.2019.00321
65. Hanson K. Social origins of distress and disease: depression, neurasthenia, and pain in modern china. Arthur Kleinman Med Anthropol Q. (1987) 1:343–5. doi: 10.1525/maq.1987.1.3.02a00110
66. Kleinman A, Anderson J, Finkler K, Frankenberg R, Young A. Social origins of distress and disease: depression, neurasthenia, and pain in modern China. Curr Anthropol. (1986) 24:499–509. doi: 10.1086/203474
67. Ryder AG, Yang J, Zhu X, Yao S, Yi J, Heine SJ, et al. The cultural shaping of depression: somatic symptoms in China, psychological symptoms in North America? J Abnorm Psychol. (2008) 117:300. doi: 10.1037/0021-843X.117.2.300
68. Wang YC, Lin YT, Liu CM, Hwang TJ, Hsieh MH, Chien YL, et al. Stigmas toward psychosis-related clinical features among the general public in Taiwan. Asia Pac Psychiatry. (2020) 12:e12370. doi: 10.1111/appy.12370
69. Kessler RC, Berglund P, Demler O, Jin R, Koretz D, Merikangas KR, et al. The epidemiology of major depressive disorder: results from the National Comorbidity Survey Replication (NCS-R). JAMA. (2003) 289:3095–105. doi: 10.1001/jama.289.23.3095
70. Kuehner C. Why is depression more common among women than among men? Lancet Psychiatry. (2017) 4:146–58. doi: 10.1016/S2215-0366(16)30263-2
71. Landhuis E. Why Women May Be More Susceptible to Mood Disorders. (2020). Available online at: https://www.scientificamerican.com/article/why-women-may-be-more-susceptible-to-mood-disorders/ (accessed April 14, 2020).
72. Albert PR. Why is depression more prevalent in women? J Psychiatry Neurosci. (2015) 40:219–21. doi: 10.1503/jpn.150205
73. Barsky AJ, Peekna HM, Borus JF. Somatic symptom reporting in women and men. J Gen Intern Med. (2001) 16:266–75. doi: 10.1046/j.1525-1497.2001.016004266.x
74. Burt VK, Stein K. Epidemiology of depression throughout the female life cycle. J Clin Psychiatry. (2002) 63 Suppl 7:9–15.
75. Chang H. Depressive symptom manifestation and help-seeking among Chinese college students in Taiwan. Int J Psychol. (2007) 42:200–6. doi: 10.1080/00207590600878665
76. Mirowsky J, Ross CE. Age and depression. J Health Soc Behav. (1992) 187–205. doi: 10.2307/2137349
77. Tampubolon G., and Maharani, A. (2017). When did old age stop being depressing? Depression trajectories of older Americans and Britons 2002–2012. Am J Geriatr Psychiatry 25, 1187–1195. doi: 10.1016/j.jagp.2017.06.006
78. Blazer DG II, Hybels CF. Origins of depression in later life. Psychol Med. (2005) 35:1241–52. doi: 10.1017/S0033291705004411
79. Nguyen TT, Lee EE, Daly RE, Wu TC, Tang Y, Tu X, et al. Predictors of loneliness by age decade: study of psychological and environmental factors in 2,843 community-dwelling americans aged 20-69 years. J Clin Psychiatry. (2020) 81:20m13378. doi: 10.4088/JCP.20m13378
80. He S, Song D, Jian WY. The Association between Urbanization and Depression among the Middle-Aged and Elderly: a longitudinal study in China. INQUIRY J Health Care Organ Provis Financing. (2020) 57:0046958020965470. doi: 10.1177/0046958020965470
81. Wang R, Xue D, Liu Y, Chen H, Qiu Y. The relationship between urbanization and depression in China: the mediating role of neighborhood social capital. Int J Equity Health. (2018) 17:105. doi: 10.1186/s12939-018-0825-x
82. Weaver A, Himle JA, Taylor RJ, Matusko NN, Abelson JM. Urban vs rural residence and the prevalence of depression and mood disorder among African American women and Non-Hispanic white women. JAMA Psychiatry. (2015) 72:576–83. doi: 10.1001/jamapsychiatry.2015.10
83. Wiens K, Williams JV, Lavorato DH, Bulloch AG, Patten SB. The prevalence of major depressive episodes is higher in urban regions of Canada. Can J Psychiatry. (2017) 62:57–61. doi: 10.1177/0706743716659246
84. Zijlema WL, Klijs B, Stolk RP, Rosmalen JG. (Un)Healthy in the city: respiratory, cardiometabolic and mental health associated with urbanity. PLoS ONE. (2015) 10:e0143910. doi: 10.1371/journal.pone.0143910
85. Din MO, Noor NM. Prevalence and factors associated with depressive symptoms in Malay women. Women Health. (2009) 49:573–91. doi: 10.1080/03630240903495897
86. Gada M. A cross cultural study of symptomatology of depression–eastern versus western patients. Int J Soc Psychiatry. (1982) 28:195–202. doi: 10.1177/002076408202800305
87. Tsai JL, Chentsova-Dutton Y. Understanding depression across cultures. In: Handjournal of Depression. New York, NY: The Guilford Press (2002). p. 467–91.
88. Wang JL. Rural-urban differences in the prevalence of major depression and associated impairment. Soc Psychiatry Psychiatr Epidemiol. (2004) 39:19–25. doi: 10.1007/s00127-004-0698-8
89. Andrade L, Caraveo-Anduaga JJ, Berglund P, Bijl RV, De Graaf R, Vollebergh W, et al. The epidemiology of major depressive episodes: results from the International Consortium of Psychiatric Epidemiology (ICPE) Surveys. Int J Methods Psychiatr Res. (2003) 12:3–21. doi: 10.1002/mpr.138
90. Kessler RC, Walters EE, Forthofer MS. The social consequences of psychiatric disorders, III: probability of marital stability. Am J Psychiatry. (1998) 155:1092–6. doi: 10.1176/ajp.155.8.1092
91. Weissman MM, Bland RC, Canino GJ, Faravelli C, Greenwald S, Hwu HG, et al. Cross-national epidemiology of major depression and bipolar disorder. JAMA. (1996) 276:293–9. doi: 10.1001/jama.1996.03540040037030
92. Inaba A, Thoits PA, Ueno K, Gove WR, Evenson RJ, Sloan M. Depression in the United States and Japan: gender, marital status, and SES patterns. Soc Sci Med. (2005) 61:2280–92. doi: 10.1016/j.socscimed.2005.07.014
93. Patten SB, Wang JL, Williams JV, Currie S, Beck CA, Maxwell CJ, et al. Descriptive epidemiology of major depression in Canada. Can J Psychiatry. (2006) 51:84–90. doi: 10.1177/070674370605100204
94. Pearlin LI, Johnson JS. Marital status, life-strains and depression. Am Sociol Rev. (1977) 704–15. doi: 10.2307/2094860
95. Wu X, DeMaris A. Gender and marital status differences in depression: the effects of chronic strains. Sex Roles. (1996) 34:299–319. doi: 10.1007/BF01547804
96. Lamb KA, Lee GR, DeMaris A. Union formation and depression: selection and relationship effects. J Marr Fam. (2003) 65:953–62. doi: 10.1111/j.1741-3737.2003.00953.x
97. Murray JE. Marital protection and marital selection: evidence from a historical-prospective sample of American men. Demography. (2000) 37:511–21. doi: 10.1353/dem.2000.0010
98. Kleinman A. Neurasthenia and depression: a study of somatization and culture in China. Cult Med Psychiatry. (1982) 6:117–90. doi: 10.1007/BF00051427
99. Parker G, Gladstone G, Chee KT. Depression in the planet's largest ethnic group: the Chinese. Am J Psychiatry. (2001) 158:857–64. doi: 10.1176/appi.ajp.158.6.857
100. Yen S, Robins CJ, Lin N. A cross-cultural comparison of depressive symptom manifestation: China and the United States. J Consult Clin Psychol. (2000) 68:993. doi: 10.1037/0022-006X.68.6.993
101. Xu Z, Huang F, Kosters M, Rusch N. Challenging mental health related stigma in China: systematic review and meta-analysis. II. Interventions among people with mental illness. Psychiatry Res. (2017) 255:457–64. doi: 10.1016/j.psychres.2017.05.002
102. Xu Z, Rusch N, Huang F, Kosters M. Challenging mental health related stigma in China: systematic review and meta-analysis. I. Interventions among the general public. Psychiatry Res. (2017) 255:449–56. doi: 10.1016/j.psychres.2017.01.008
103. Rao WW, Zhu XM, Zong QQ, Zhang Q, Hall BJ, Ungvari GS, et al. Prevalence of prenatal and postpartum depression in fathers: a comprehensive meta-analysis of observational surveys. J Affect Disord. (2020) 263:491–9. doi: 10.1016/j.jad.2019.10.030
104. Wang F, Zhang QE, Zhang L, Ng CH, Ungvari GS, Yuan Z, et al. Prevalence of major depressive disorder in older adults in China: a systematic review and meta-analysis. J Affect Disord. (2018) 241:297–304. doi: 10.1016/j.jad.2018.07.061
105. Xu DD, Rao WW, Cao XL, Wen SY, Che WI, Ng CH, et al. Prevalence of major depressive disorder in children and adolescents in China: a systematic review and meta-analysis. J Affect Disord. (2018) 241:592–8. doi: 10.1016/j.jad.2018.07.083
106. Gruenberg AM, Goldstein RD, Pincus HA. Classification of depression: research and diagnostic criteria: DSM-IV and ICD-10. Biol Depress. (2005) 11:43. doi: 10.1002/9783527619672.ch1
107. Xiao Q, Zhang D-L. Similarities and differences between the diagnostic criteria of ICD-11 and DSM-5 for depression disorder (in Chinese). Sichuan Mental Health. (2019) 32:543–7. doi: 10.11886/scjsws20191106001
108. Zheng Y-P, Lin K-M, Zhao J-P, Zhang M-Y, Yong D. Comparative study of diagnostic systems: Chinese classification of mental disorders-versus DSM-III-R. Compr Psychiatry. (1994) 35:441–9. doi: 10.1016/0010-440X(94)90227-5
109. Rotenstein LS, Ramos MA, Torre M, Segal JB, Peluso MJ, Guille C, et al. Prevalence of depression, depressive symptoms, and suicidal ideation among medical students: a systematic review and meta-analysis. JAMA. (2016) 316:2214–36. doi: 10.1001/jama.2016.17324
Keywords: depression, Chinese, epidemiology, meta-analysis, prevalence
Citation: Zhao Y-J, Jin Y, Rao W-W, Zhang Q-E, Zhang L, Jackson T, Su Z-H, Xiang M, Yuan Z and Xiang Y-T (2021) Prevalence of Major Depressive Disorder Among Adults in China: A Systematic Review and Meta-Analysis. Front. Psychiatry 12:659470. doi: 10.3389/fpsyt.2021.659470
Received: 27 January 2021; Accepted: 29 March 2021;
Published: 08 June 2021.
Edited by:
Liye Zou, Shenzhen University, ChinaCopyright © 2021 Zhao, Jin, Rao, Zhang, Zhang, Jackson, Su, Xiang, Yuan and Xiang. This is an open-access article distributed under the terms of the Creative Commons Attribution License (CC BY). The use, distribution or reproduction in other forums is permitted, provided the original author(s) and the copyright owner(s) are credited and that the original publication in this journal is cited, in accordance with accepted academic practice. No use, distribution or reproduction is permitted which does not comply with these terms.
*Correspondence: Yu-Tao Xiang, eHl1dGx5QGdtYWlsLmNvbQ==
†These authors have contributed equally to this work