 Guoqing Chen1
 Hao Yu
- 1Department of Psychiatry, Jining Medical University, Jining, China
- 2Department of Psychiatry, Shandong Daizhuang Hospital, Jining, China
Background: Observational studies that have supported the role of the leptin level in schizophrenia (SCZ) risk are conflicting. Therefore, we performed a two-sample Mendelian randomization (MR) analysis to investigate whether the circulating leptin and soluble plasma leptin receptor (sOB-R) levels play a causal role in SCZ risk.
Methods: We first selected five independent single-nucleotide polymorphisms (SNPs) associated with the circulating leptin level and three independent SNPs associated with the sOB-R level from two genome-wide association studies (GWASs) of European individuals. Then, we extracted their associations with SCZ using a large-scale GWAS that consisted of 40,675 patients with SCZ and 64,643 controls of European ancestry. We performed an MR analysis using the inverse variance-weighted (IVW) method to examine the causal effect of leptin on SCZ risk. Moreover, we performed sensitivity analyses to verify our MR results using the weighted median and MR-Egger methods.
Results: According to the IVW method, genetically predicted circulating leptin levels were not associated with SCZ risk (OR = 1.98, for per 1-SD unit increase in leptin level; 95% CI, 0.87–4.53; p = 0.10). In addition, the sOB-R level showed no causal effect on the SCZ risk using IVW (OR = 0.98 for per 1-SD unit increase in sOB-R level; 95% CI, 0.97–1.00; p = 0.06). Our sensitivity analysis results confirmed our MR findings.
Conclusions: By estimating the causal effect of leptin on SCZ risk using the MR methods, we identified no effect of genetically predicted circulating leptin or the sOB-R level on SCZ. As such, our study suggests that leptin might not be a risk factor for SCZ.
Introduction
Schizophrenia (SCZ) is a major mental disease that represents a leading cause of impairment and burden worldwide (1). Cardiovascular diseases (CVDs) and metabolic syndrome (MetS) are highly prevalent in patients with SCZ, contributing a large extent to dramatically increased mortality (2–4). The high prevalence of CVDs in patients with SCZ may be partially attributed to unhealthy behaviors, including smoking, lack of physical activities, and dietary habits (5). More specifically, drug-naïve patients with SCZ are susceptible to metabolic disturbances (6). The underlying mechanisms of metabolic abnormalities in patients with SCZ are complicated and still not fully understood. Therefore, there is a great need to understand the mechanisms associated with metabolic abnormalities in SCZ patients.
Previous studies have revealed that SCZ patients showed a significantly increased level of excess adipose tissue (2). Among the adipokines, accumulating evidence has indicated that leptin may play a crucial role in both metabolic dysregulation and SCZ risk (7, 8). Leptin is known to act through the leptin receptor, and it is expressed in a variety of brain regions such as the cortex, hypothalamus, midbrain, and hindbrain (9). Leptin and its receptor are involved in the neuroendocrine and neurodevelopmental processes (10) and could modulate reward, mood, and neurological health (9). Several prospective studies have suggested that leptin and the sOB-R are associated with metabolic risk factors and might be able to predict adiposity and MetS (11, 12). Animal studies have suggested that leptin could modulate the activity of the dopaminergic and serotonergic systems, which are closely related to the pathogenesis of SCZ (13, 14). Several observational studies have indicated that leptin levels are altered in individuals with SCZ (15–18). However, the results of these observational studies have been conflicting, with reports of reduced (15) and increased leptin levels in patients with SCZ (16–18). However, the causal relationship between leptin and SCZ remains unclear. Moreover, these observational studies might have been affected by unmeasured confounding factors. Given the potential bias, observational studies cannot solely be relied upon for evidence (19). Generally, randomized controlled trials reduce potential bias in observational studies. To the best of our knowledge, no randomized controlled trials of leptin/sOB-R have been reported for SCZ. Given the high prevalence of metabolic abnormalities in patients with SCZ, it seems prudent to investigate whether leptin shows a causal role in SCZ risk.
Mendelian randomization (MR) was developed to investigate the causal relationship between exposure and the outcome of interest. This method overcomes the limitations of confounding factors and reverse causation in traditional studies (20). By using genetic variants as instrumental variables for a trait or disease, MR enables an investigation of associations independent of the conventional biases that accompany observational studies (20). MR approaches are particularly suitable for clarifying causal effects when observational studies are conflicting, and they provide useful intervention targets in randomized controlled trials. Recent genome-wide association studies (GWASs) have identified several common genetic variants that influence circulating leptin and sOB-R levels (21, 22), thus providing comprehensive data on the genetic determinants of leptin biomarkers. However, no MR analysis has been conducted to assess the casual relationship between leptin and SCZ risk.
In this study, by utilizing large-scale and GWAS datasets, we perform a two-sample MR study to examine the causal relationship between circulating leptin and sOB-R levels and SCZ.
Materials and Methods
Study Design
Our MR analysis was based on three core assumptions (Figure 1). First, the genetic variants used as instrumental variables for the leptin or sOB-R levels are associated with SCZ risk. Second, the genetic variants are not associated with any confounders. Third, the genetic variants are associated with SCZ through the leptin pathway and no other pathway.
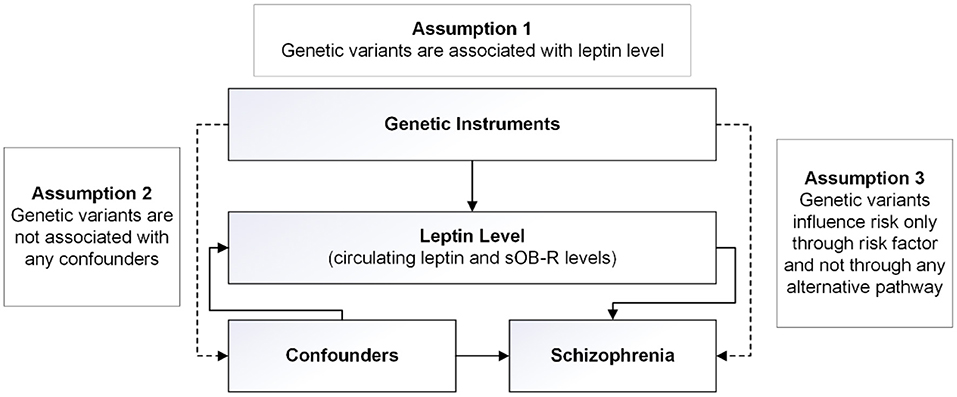
Figure 1. Design of the two-sample Mendelian randomization study. Three basic assumptions were as follows: (1) the single-nucleotide polymorphisms (SNPs) should be strongly associated with leptin level; (2) the SNPs should not be associated with confounders; and (3) the SNPs should not be directly associated with schizophrenia.
Data Source
We first obtained summary association results for two sets of genetic instruments: circulating leptin and sOB-R levels. For the leptin level, we derived summary data using a large-scale GWAS consisting of 32,161 individuals of European ancestry (22). Either plasma or serum leptin was measured in the morning or from fasting samples. Associations between genetic variants and the leptin level were investigated using a linear regression model, adjusting for age, age2, sex, body mass index (BMI), and any necessary study-specific covariates (22). For the sOB-R level, we identified genome-wide significant SNPs from a GWAS consisting of 1,504 individuals of European ancestry (21). The associations between the SNPs and the sOB-R level were adjusted for age and BMI in the original study (21). We then extracted summary associations between each genetic instrument and SCZ risk using large-scale SCZ GWAS data that consisted of 40,675 patients with SCZ and 64,643 healthy controls of European ancestry (23). More details regarding these GWAS can be found in the original studies (21–23).
Instrumental Variable Selection
For the instrumental variables, we selected five single-nucleotide polymorphisms (SNPs) associated with the circulating leptin level and four SNPs associated with the sOB-R level at the genome-wide significance level (p < 5 × 10⁻⁸) (21, 22). We used linkage disequilibrium (LD) clumping to exclude the SNPs that had an r2 ≥ 0.01 with another SNP with a more significantly associated p-value in a 1-Mb window. The palindromic SNPs with ambiguous allele frequencies were removed from our MR analyses to eliminate potential biases (24). We then calculated the F-statistic that reflects the magnitude and the precision of the cumulative genetic effect for each SNP to estimate the strength for each SNP used in our MR analyses. The F-statistic was computed as follows: F = beta2/se2, where “beta” is the per-allele genetic effect on the SNP, and “se” represents the standard error of GX. To reduce the potential for weak instrument bias in the MR, we removed SNPs with F-statistics < 10 (25). We calculated the variance explained for a specific SNP using the following equation: variance explained = β2 × 2f × (1 – f), where β and f denote the effect of the SNP on the FT4 level and the minor allele frequency (MAF), respectively. The variance explained for a specific SNP is listed in Table 1. We then performed power calculations using the mRnd (https://shiny.cnsgenomics.com/mRnd/) (26) to test whether our study was adequately powered to detect clinically relevant changes in the SCZ risk.
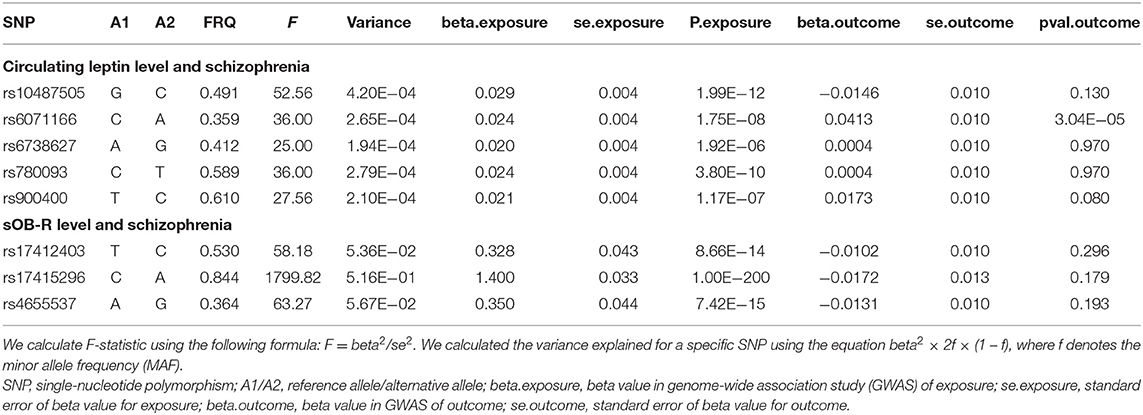
Table 1. The characteristics of SNPs and their genetic associations with circulating leptin/sOB-R levels and schizophrenia.
Mendelian Randomization Analysis
For the SNP, we calculated the MR estimate using the Wald estimator of exposure and outcome summary statistics with the standard error using the delta method (27). We then combined the MR estimates of individual SNPs using the inverse-variance-weighted fixed-effect (IVW_FE) model (28). We considered a two-sided p < 0.05 to be significant. Because the MR results might be confounded when the genetic instruments show horizontal pleiotropy, we compared the IVW results with the weighed median (29) and the MR-Egger (24) tests, whose estimates are known to be relatively robust to horizontal pleiotropy (30). Using Cochran's Q-test, we examined the heterogeneity produced by multiple genetic variants in the IVW analyses (31). If Cochran's Q-test suggested potential heterogeneity, we used the IVW random-effects model (IVW_RE) to assess the association between leptin and SCZ (31). By removing one genetic instrument at a time, we performed the leave-one-out analysis to identify genetic variants with exaggerated effects on the overall estimate (32). We used the MR-Pleiotropy RESidual Sum and Outlier (MR-PRESSO) method to detect the SNP outliers (33). If the SNP outliers were identified, we removed them to correct for possible pleiotropic effects and repeated the MR analysis. All of the MR analyses were performed using the R package “TwoSampleMR” (32).
Results
Circulating Leptin Level and Schizophrenia
After LD-based clumping, five independent SNPs were not in the LD (defined as r2 < 0.2, windows 100 kb) with other genetic variants for the circulating leptin level. The associations between each SNP with the circulating leptin level and the SCZ risk are listed in Table 1. For the five SNPs associated with the circulating leptin level, we removed the SNP (rs10487505) for being palindromic with intermediate allele frequencies. Using the four retained SNPs, we found that the genetically predicted leptin level had a significant effect on the SCZ risk (IVW_FE: OR = 1.98, for per 1-SD unit increase in leptin level; 95% CI, 1.29–3.06; p = 1.97E−03; Figure 2; Table 2). Our sensitivity analysis suggested that the weighed median (OR = 1.69, p = 0.11) and MR-Egger (OR = 5.33, p = 0.78) provided consistent results with the IVW analysis, but with less precision (Figure 2). However, we detected significant heterogeneity using Cochran's Q-test (Q = 10.87, p = 0.01). Therefore, we moved to the IVW random model and found no significant effect on the SCZ risk (IVW_RE: OR = 1.98, for per 1-SD unit increase in leptin level; 95% CI, 0.87–4.53; p = 0.10; Figure 2; Table 2). Additionally, we detected no SNP outlier using the MR-PRESSO test (p > 0.05) and no pleiotropy when using the MR-Egger method (intercept = −0.07, se = 0.14, p = 0.66). We plotted the leave-one-out plots in the MR analyses (Supplementary Figure S1). Based on a sample size of 105,318 individuals (40,675 patients with SCZ and 64,643 healthy controls) and setting alpha to 0.05 and the variance explained to 0.1%, our study had a power of 89% power to detect effects on SCZ as an OR of 1.98 per 1-SD change in the leptin level on the log scale.
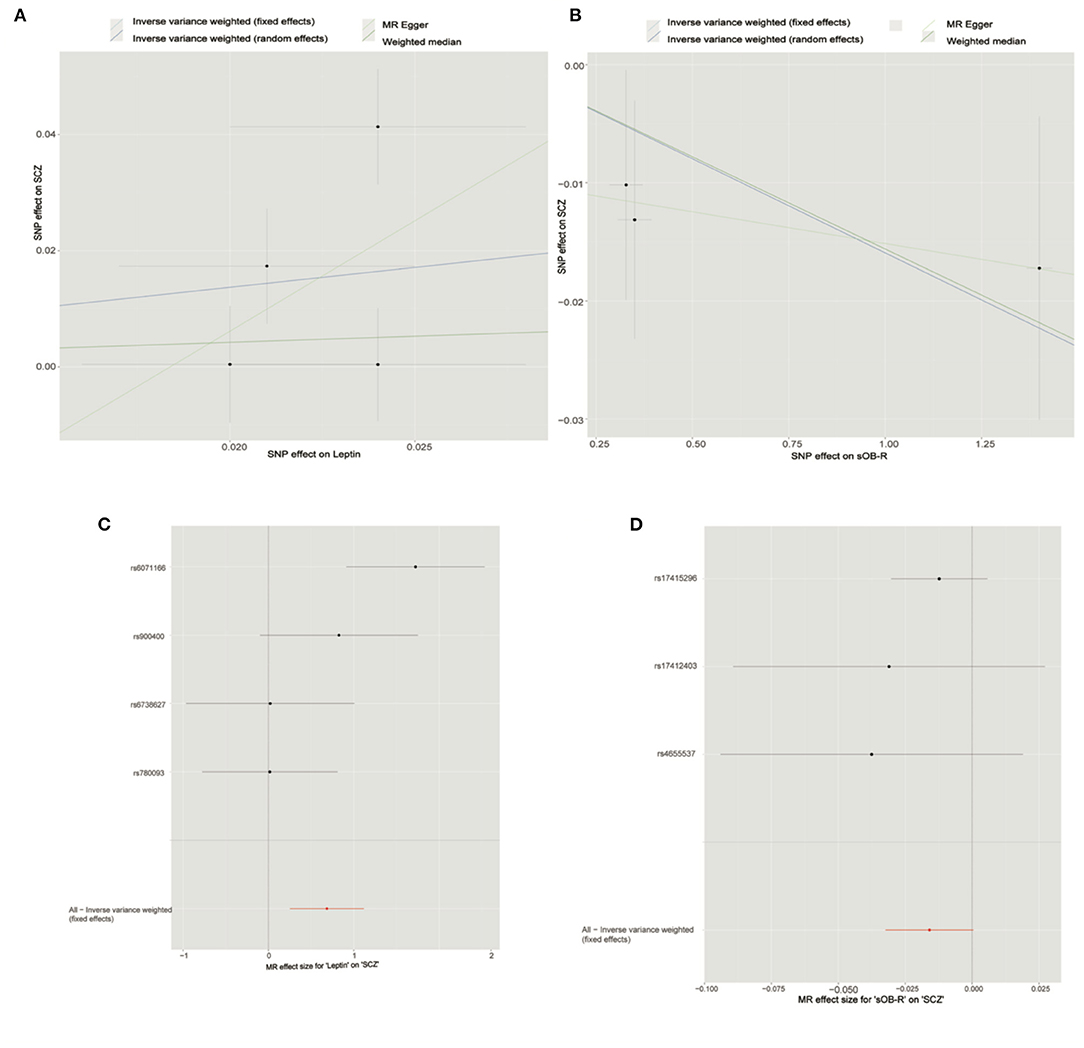
Figure 2. Mendelian randomization analysis showing the effects of circulating leptin and soluble leptin receptor (sOB-R) levels on schizophrenia (SCZ) risk. (A) Mendelian randomization (MR) analyses of circulating leptin and SCZ. (B) MR analyses of sOB-R level and SCZ. (C) Forest plot for MR analyses of circulating leptin and SCZ. (D) Forest plot for MR analyses of sOB-R level and SCZ.

Table 2. Two-sample MR estimates of relationship between genetically predicted circulating leptin/sOB-R levels and SCZ.
The Soluble Leptin Receptor Level and Schizophrenia
By using LD-based clumping, we removed the SNP (rs1137100) that was in the LD with other genetic variants for the sOB-R level. We list the associations between each SNP with the sOB-R level and SCZ risk in Table 1. By using the three retained SNPs, we found that the genetically predicted sOB-R level had no significant effect on the SCZ risk (IVW_FE: OR = 0.98 for per 1-SD unit increase in sOB-R level; 95% CI, 0.97–1.00; p = 0.06; Figure 2; Table 2). Our sensitivity analysis suggested that the weighed median (OR = 0.98, p = 0.08) and MR-Egger (OR = 0.99, p = 0.76) methods provided consistent results with the IVW analysis, but with less precision (Figure 2). For the four SNPs associated with the circulating leptin level, we detected no pleiotropy or heterogeneity using Cochran's Q-test (Q = 0.98, p = 0.61) and MR-Egger (intercept = −0.01; se = 0.01; p = 0.51). We detected no SNP outlier using the MR-PRESSO test (p > 0.05). The leave-one-out plot is shown in the MR analyses (Supplementary Figure S2). By using mRnd software, we calculated that our study had a power of 71% power to detect effects on SCZ as an OR of 0.98 per 1-SD change in leptin level on the log scale.
Discussion
This MR study investigated the causal relationship between leptin and SCZ, and no causal relationship between the circulating leptin level and SCZ was identified. This was consistent with a previous observational study (34). In addition, we found no causal effect of the sOB-R level on SCZ risk. Given that sOB-R is a leptin binding protein, the sOB-R had an inverse relationship with the circulating leptin levels. Therefore, these consistent findings further supported a lack of a causal effect of leptin on SCZ. Our results from the weighted median and MR-Egger methods confirmed the robustness of this lack of causal effect, as the results were generally similar to the primary analysis that utilized IVW methods. Therefore, our study suggests that leptin and sOB-R levels are unlikely to affect SCZ risk.
Our study provided new clues for the relationship between leptin levels and SCZ risk. The accumulated evidence suggested that leptin levels may be involved in SCZ risk. Observational studies and meta-analysis have suggested that leptin levels are elevated in patients with SCZ (35, 36). A longitudinal study found that antipsychotic-naïve patients with SCZ had decreased leptin levels than healthy controls at baseline (15). In addition, there are few observational studies that have reported no significant association between leptin and SCZ (34). However, whether these observed associations are causal is still unclear because the results in observational studies are susceptible to reverse causality and unknown confounding factors. For example, some studies have shown that leptin levels are elevated, not only in patients taking atypical antipsychotics (37) but also in drug-free (38) and drug-naïve subjects (39). Unfortunately, few studies have examined the association between the sOB-R level and SCZ. Therefore, new methods are needed to assess the causal relationship between leptin and SCZ. By utilizing genetic variants as proxies for exposure, MR analyses can provide an unbiased estimate of association with the outcome of interest. In this study, we detected no evidence using the MR approach that leptin and the sOB-R levels are associated with SCZ risk. To our best knowledge, this is the first study with a sufficient sample size under the MR assumptions to examine whether there is a causal association between the leptin/sOB-R level and SCZ risk.
Our study is subject to several limitations. First, leptin levels might be affected by many factors. Recent observational studies have suggested that leptin levels are associated with demographic (age, sex, and ethnicity), anthropometric measures (body mass index, skinfold thicknesses, waist and hip circumferences, waist/hip ratio, total body water, fat-free mass, and fat mass) (40, 41), and medication history. The GWAS summary data of the leptin levels used in our MR analysis were adjusted for age, age2, sex, BMI, and any necessary study-specific covariates (22); and the selected significant SNPs for the sOB-R levels were adjusted for BMI (21). This might have reduced the potential bias. Moreover, our sensitivity analysis resulted in effect estimates with similar patterns and corroborated the primary MR results. However, the GWAS samples of the circulating leptin and the sOB-R level consisted of a large proportion of middle-aged individuals (21, 22). Thus, it is still unknown to what extent these data accounted for early life exposures that might be involved in the development of SCZ. Additionally, we performed the MR analysis using the GWAS summary data and could not conduct stratified analyses with covariates, such as medication history, physical/dietary habits, and substance use. Therefore, future GWAS or MR analyses should consider these factors when assessing the role of leptin and sOB-R levels. Second, our MR analyses focusing on the European population and generalizability could not be assumed. Third, the sample size and the number of variants for analysis were relatively small. We found no evidence for a causal relationship between leptin and sOB-R levels and SCZ risk. Further research is necessary to understand the pathways underlying the association and resolve whether the leptin level is a useful predictor of SCZ risk that can help guide therapeutic interventions.
In conclusion, we found no significant causal relationship for circulating leptin or sOB-R level on SCZ risk. Overall, our results did not support the hypothesis that increased leptin or sOB-R level is a risk factor for SCZ.
Data Availability Statement
The original contributions presented in the study are included in the article/Supplementary Material, further inquiries can be directed to the corresponding author.
Author Contributions
HY designed the study and contributed to the analysis and interpretation of data. GC, RX, QW, and HY did the statistical analyses and prepared the tables and figures. GC and HY wrote the first draft of the manuscript. GC provided further data interpretation. All authors contributed to drafting the work or revising it critically for important intellectual content, made substantial contributions to the concept and design of the study and acquisition, analysis, and interpretation of data.
Funding
This study was funded by the National Natural Science Foundation of China (81901358), Medical and Health Science and Technology Development Plan of Shandong Province (2014WS0278 and 2018WS457), and Young Taishan Scholars of Shandong Province (tsqn201909146). The funders had no role in the design and conduction of this study.
Conflict of Interest
The authors declare that the research was conducted in the absence of any commercial or financial relationships that could be construed as a potential conflict of interest.
Publisher's Note
All claims expressed in this article are solely those of the authors and do not necessarily represent those of their affiliated organizations, or those of the publisher, the editors and the reviewers. Any product that may be evaluated in this article, or claim that may be made by its manufacturer, is not guaranteed or endorsed by the publisher.
Acknowledgments
We gratefully acknowledge all the studies and databases that made GWAS summary data available.
Supplementary Material
The Supplementary Material for this article can be found online at: https://www.frontiersin.org/articles/10.3389/fpsyt.2021.753224/full#supplementary-material
References
1. Charlson FJ, Ferrari AJ, Santomauro DF, Diminic S, Stockings E, Scott JG, et al. Global epidemiology and burden of schizophrenia: findings from the global burden of disease study 2016. Schizophr Bull. (2018) 44:1195–203. doi: 10.1093/schbul/sby058
2. Mitchell AJ, Vancampfort D, De Herdt A, Yu W, De Hert M. Is the prevalence of metabolic syndrome and metabolic abnormalities increased in early schizophrenia? A comparative meta-analysis of first episode, untreated and treated patients. Schizophr Bull. (2013) 39:295–305. doi: 10.1093/schbul/sbs082
3. Stubbs B, Vancampfort D, De Hert M, Mitchell AJ. The prevalence and predictors of type two diabetes mellitus in people with schizophrenia: a systematic review and comparative meta-analysis. Acta Psychiatr Scand. (2015) 132:144–57. doi: 10.1111/acps.12439
4. Oakley P, Kisely S, Baxter A, Harris M, Desoe J, Dziouba A, et al. Increased mortality among people with schizophrenia and other non-affective psychotic disorders in the community: a systematic review and meta-analysis. J Psychiatr Res. (2018) 102:245–53. doi: 10.1016/j.jpsychires.2018.04.019
5. De Hert M, Schreurs V, Vancampfort D, Van Winkel R. Metabolic syndrome in people with schizophrenia: a review. World Psychiatry. (2009) 8:15–22. doi: 10.1002/j.2051-5545.2009.tb00199.x
6. Enez Darcin A, Yalcin Cavus S, Dilbaz N, Kaya H, Dogan E. Metabolic syndrome in drug-naïve and drug-free patients with schizophrenia and in their siblings. Schizophr Res. (2015) 166:201–6. doi: 10.1016/j.schres.2015.05.004
7. Chen CY, Goh KK, Chen CH, Lu ML. The role of adiponectin in the pathogenesis of metabolic disturbances in patients with schizophrenia. Front Psychiatry. (2020) 11:605124. doi: 10.3389/fpsyt.2020.605124
8. Reponen EJ, Tesli M, Dieset I, Steen NE, Vedal TSJ, Szabo A, et al. Adiponectin is related to cardiovascular risk in severe mental illness independent of antipsychotic treatment. Front Psychiatry. (2021) 12:623192. doi: 10.3389/fpsyt.2021.623192
9. Farr OM, Tsoukas MA, Mantzoros CS. Leptin and the brain: influences on brain development, cognitive functioning and psychiatric disorders. Metabolism. (2015) 64:114–30. doi: 10.1016/j.metabol.2014.07.004
10. Bouret SG. Neurodevelopmental actions of leptin. Brain Res. (2010) 1350:2–9. doi: 10.1016/j.brainres.2010.04.011
11. Hamnvik OP, Liu X, Petrou M, Gong H, Chamberland JP, Kim EH, et al. Soluble leptin receptor and leptin are associated with baseline adiposity and metabolic risk factors, and predict adiposity, metabolic syndrome, and glucose levels at 2-year follow-up: the Cyprus Metabolism Prospective Cohort Study. Metabolism. (2011) 60:987–93. doi: 10.1016/j.metabol.2010.09.009
12. Li WC, Hsiao KY, Chen IC, Chang YC, Wang SH, Wu KH. Serum leptin is associated with cardiometabolic risk and predicts metabolic syndrome in Taiwanese adults. Cardiovasc Diabetol. (2011) 10:36. doi: 10.1186/1475-2840-10-36
13. Yadav VK, Oury F, Suda N, Liu ZW, Gao XB, Confavreux C, et al. A serotonin-dependent mechanism explains the leptin regulation of bone mass, appetite, and energy expenditure. Cell. (2009) 138:976–89. doi: 10.1016/j.cell.2009.06.051
14. Burghardt PR, Love TM, Stohler CS, Hodgkinson C, Shen PH, Enoch MA, et al. Leptin regulates dopamine responses to sustained stress in humans. J Neurosci. (2012) 32:15369–76. doi: 10.1523/JNEUROSCI.2521-12.2012
15. Venkatasubramanian G, Chittiprol S, Neelakantachar N, Shetty TK, Gangadhar BN. A longitudinal study on the impact of antipsychotic treatment on serum leptin in schizophrenia. Clin Neuropharmacol. (2010) 33:288–92. doi: 10.1097/WNF.0b013e3181fa2a6f
16. Çakici N, Bot M, Lamers F, Janssen T, Van Der Spek PJ, De Haan L, et al. Increased serum levels of leptin and insulin in both schizophrenia and major depressive disorder: a cross-disorder proteomics analysis. Eur Neuropsychopharmacol. (2019) 29:835–46. doi: 10.1016/j.euroneuro.2019.05.010
17. Gohar SM, Dieset I, Steen NE, Mørch RH, Vedal TSJ, Reponen EJ, et al. Association between leptin levels and severity of suicidal behaviour in schizophrenia spectrum disorders. Acta Psychiatr Scand. (2019) 139:464–71. doi: 10.1111/acps.13019
18. Martorell L, Muntané G, Porta-López S, Moreno I, Ortega L, Montalvo I, et al. Increased levels of serum leptin in the early stages of psychosis. J Psychiatr Res. (2019) 111:24–9. doi: 10.1016/j.jpsychires.2019.01.006
19. Prasad V, Jorgenson J, Ioannidis JP, Cifu A. Observational studies often make clinical practice recommendations: an empirical evaluation of authors' attitudes. J Clin Epidemiol. (2013) 66:361–6.e364. doi: 10.1016/j.jclinepi.2012.11.005
20. Emdin CA, Khera AV, Kathiresan S. Mendelian randomization. JAMA. (2017) 318:1925–6. doi: 10.1001/jama.2017.17219
21. Sun Q, Cornelis MC, Kraft P, Qi L, Van Dam RM, Girman CJ, et al. Genome-wide association study identifies polymorphisms in LEPR as determinants of plasma soluble leptin receptor levels. Hum Mol Genet. (2010) 19:1846–55. doi: 10.1093/hmg/ddq056
22. Kilpeläinen TO, Carli JF, Skowronski AA, Sun Q, Kriebel J, Feitosa MF, et al. Genome-wide meta-analysis uncovers novel loci influencing circulating leptin levels. Nat Commun. (2016) 7:10494. doi: 10.1038/ncomms10494
23. Pardiñas AF, Holmans P, Pocklington AJ, Escott-Price V, Ripke S, Carrera N, et al. Common schizophrenia alleles are enriched in mutation-intolerant genes and in regions under strong background selection. Nat Genet. (2018) 50:381–9. doi: 10.1038/s41588-018-0059-2
24. Bowden J, Davey Smith G, Burgess S. Mendelian randomization with invalid instruments: effect estimation and bias detection through Egger regression. Int J Epidemiol. (2015) 44:512–25. doi: 10.1093/ije/dyv080
25. Palmer TM, Lawlor DA, Harbord RM, Sheehan NA, Tobias JH, Timpson NJ, et al. Using multiple genetic variants as instrumental variables for modifiable risk factors. Stat Methods Med Res. (2012) 21:223–42. doi: 10.1177/0962280210394459
26. Brion M-JA, Shakhbazov K, Visscher PM. Calculating statistical power in Mendelian randomization studies. Int J Epidemiol. (2012) 42:1497–501. doi: 10.1093/ije/dyt179
27. Thompson JR, Minelli C, Del Greco MF. Mendelian randomization using public data from genetic consortia. Int J Biostat. (2016) 12. doi: 10.1515/ijb-2015-0074
28. Stephen B, Adam B, Thompson SG. Mendelian randomization analysis with multiple genetic variants using summarized data. Genet Epidemiol. (2013) 37:658–65. doi: 10.1002/gepi.21758
29. Bowden J, Davey Smith G, Haycock PC, Burgess S. Consistent estimation in Mendelian randomization with some invalid instruments using a weighted median estimator. Genet Epidemiol. (2016) 40:304–14. doi: 10.1002/gepi.21965
30. Hemani G, Bowden J, Davey Smith G. Evaluating the potential role of pleiotropy in Mendelian randomization studies. Hum Mol Genet. (2018) 27:R195–208. doi: 10.1093/hmg/ddy163
31. Bowden J, Del Greco MF, Minelli C, Davey Smith G, Sheehan N, Thompson J. A framework for the investigation of pleiotropy in two-sample summary data Mendelian randomization. Stat Med. (2017) 36:1783–802. doi: 10.1002/sim.7221
32. Hemani G, Zheng J, Elsworth B, Wade KH, Haberland V, Baird D, et al. The MR-Base platform supports systematic causal inference across the human phenome. Elife. (2018) 7:e34408. doi: 10.7554/eLife.34408
33. Verbanck M, Chen CY, Neale B, Do R. Detection of widespread horizontal pleiotropy in causal relationships inferred from Mendelian randomization between complex traits and diseases. Nat Genet. (2018) 50:1196. doi: 10.1038/s41588-018-0099-7
34. Erzin G, Topcuoglu C, Kotan VO, Bayram S, Fountoulakis K. Assessment of Irisin, adiponectin and leptin levels in patients with schizophrenia. Endocr Metab Immune Disord Drug Targets. (2018) 18:163–9. doi: 10.2174/1871530318666171207142901
35. Stubbs B, Wang AK, Vancampfort D, Miller BJ. Are leptin levels increased among people with schizophrenia versus controls? A systematic review and comparative meta-analysis. Psychoneuroendocrinology. (2016) 63:144–54. doi: 10.1016/j.psyneuen.2015.09.026
36. Chen VC, Chen CH, Chiu YH, Lin TY, Li FC, Lu ML. Leptin/adiponectin ratio as a potential biomarker for metabolic syndrome in patients with schizophrenia. Psychoneuroendocrinology. (2018) 92:34–40. doi: 10.1016/j.psyneuen.2018.03.021
37. Sentissi O, Epelbaum J, Olié JP, Poirier MF. Leptin and ghrelin levels in patients with schizophrenia during different antipsychotics treatment: a review. Schizophr Bull. (2008) 34:1189–99. doi: 10.1093/schbul/sbm141
38. Arranz B, Rosel P, Ramírez N, Dueñas R, Fernández P, Sanchez JM, et al. Insulin resistance and increased leptin concentrations in noncompliant schizophrenia patients but not in antipsychotic-naive first-episode schizophrenia patients. J Clin Psychiatry. (2004) 65:1335–42. doi: 10.4088/JCP.v65n1007
39. Wang HC, Yang YK, Chen PS, Lee IH, Yeh TL, Lu RB. Increased plasma leptin in antipsychotic-naïve females with schizophrenia, but not in males. Neuropsychobiology. (2007) 56:213–5. doi: 10.1159/000122267
40. Ruhl CE, Everhart JE. Leptin concentrations in the United States: relations with demographic and anthropometric measures. Am J Clin Nutr. (2001) 74:295–301. doi: 10.1093/ajcn/74.3.295
41. Gómez JM, Maravall FJ, Gómez N, Navarro MA, Casamitjana R, Soler J. Interactions between serum leptin, the insulin-like growth factor-I system, and sex, age, anthropometric and body composition variables in a healthy population randomly selected. Clin Endocrinol (Oxf). (2003) 58:213–9. doi: 10.1046/j.1365-2265.2003.01698.x
Keywords: schizophrenia, leptin, soluble plasma leptin receptor, genome-wide association study (GWAS), Mendelian randomization
Citation: Chen G, Wang Q, Xue R, Liu X and Yu H (2021) Examining the Causal Inference of Leptin and Soluble Plasma Leptin Receptor Levels on Schizophrenia: A Mendelian Randomization Study. Front. Psychiatry 12:753224. doi: 10.3389/fpsyt.2021.753224
Received: 04 August 2021; Accepted: 27 September 2021;
Published: 27 October 2021.
Edited by:
Błazej Misiak, Wroclaw Medical University, PolandCopyright © 2021 Chen, Wang, Xue, Liu and Yu. This is an open-access article distributed under the terms of the Creative Commons Attribution License (CC BY). The use, distribution or reproduction in other forums is permitted, provided the original author(s) and the copyright owner(s) are credited and that the original publication in this journal is cited, in accordance with accepted academic practice. No use, distribution or reproduction is permitted which does not comply with these terms.
*Correspondence: Hao Yu, eXVoYW9AbWFpbC5qbm1jLmVkdS5jbg==