 Agnieszka Olszewska-Guizzo1,2*
 Anna Fogel3
 Nicolas Escoffier2
 Angelia Sia4,5
 Kenta Nakazawa6
 Akihiro Kumagai6
 Ippeita Dan6
 Roger Ho5
- 1Institute for Health Innovation & Technology (iHealthtech), National University of Singapore, Singapore, Singapore
- 2NeuroLandscape Foundation, Warsaw, Poland
- 3Singapore Institute for Clinical Sciences, Agency for Science, Technology and Research (A*STAR), Singapore, Singapore
- 4National Parks Board, Centre for Urban Greenery and Ecology, Singapore, Singapore
- 5Department of Psychological Medicine, Yong Loo Lin School of Medicine, National University of Singapore, Singapore, Singapore
- 6Applied Cognitive Neuroscience Laboratory, Faculty of Science and Engineering, Chuo University, Tokyo, Japan
The therapeutic values of contact with nature have been increasingly recognized. A growing body of evidence suggests that a unique subcategory of “contemplative landscapes” is particularly therapeutic. Previous studies predominantly focused on observational designs in non-clinical populations. It is not known if these effects can be extrapolated to populations suffering from depression, and experimental designs need to be utilized to establish causality. We examined the effects of in-situ passive exposure to three urban spaces on brain activity, namely a Therapeutic Garden with high Contemplative Landscape scores (TG), Residential Green (RG) and Busy Downtown (BD), and self-reported momentary mood in adults aged 21–74 (n = 92), including 24 clinically depressed and 68 healthy participants. Portable, multimodal electroencephalography (EEG) and functional near-infrared spectroscopy (fNIRS) systems were used to record brain activity, and a Profile of Mood States (POMS) questionnaire was used to record mood before and after exposure. We tested the interactions between the site, time and group for the mood, and between site and group for the neuroelectric oscillations and brain hemodynamics. Self-reported pre- post-mood was significant only at the TG (p = 0.032) in both groups. The lowest Total Mood Disturbance (TMD) was reported at TG and the highest in BD (p = 0.026). Results from fNIRS indicated marginally significant lower oxy-Hb in the frontal region at TG as compared to BD (p = 0.054) across both groups. The marginally significant effect of site and group was also observed (p = 0.062), with the Clinical group showing much lower oxy-Hb at TG than Healthy. The opposite pattern was observed at BD. EEG results showed differences between Healthy and Clinical groups in the Frontal Alpha Asymmetry (FAA) pattern across the sites (p = 0.04), with more frontal alpha right in the Clinical sample and more left lateralization in the Healthy sample at TG. Temporal Beta Asymmetry (TBA) analyses suggested that patients displayed lower bottom-up attention than Healthy participants across all sites (p = 0.039). The results suggest that both healthy and depressed adults benefitted from exposure to TG, with possibly different pathways of mood improvement. Visiting therapeutic nature with contemplative features may provide valuable support for the treatment of depression in clinical populations and a self-care intervention in non-clinical populations.
Introduction
There is a growing body of evidence supporting the broad spectrum of mental health benefits associated with exposure to specific natural environments (1, 2). In environmental psychology and landscape architecture research, these environments have been called salutogenic (3), contemplative (4), tranquil (5), restorative (6), sensory (7), and therapeutic (8), among other names. Despite this semiotic abundance, they are all designed to induce a positive health response through soothing contact with nature and are thus considered “therapeutic.” Landscape architecture research, however, pointed out specific physical attributes which may amplify the therapeutic effect of these spaces. These attributes have been grouped into seven key categories (Landscape Layers, Landform, Vegetation, Color and Light, Compatibility, Archetypal Elements, and Character of Peace and Silence) and incorporated into an expert-based tool for the visual assessment of urban green space, called a Contemplative Landscape Model (CLM) (9). Research findings showed that visiting therapeutic gardens (for simplicity, this term will be used to refer to therapeutic green spaces) can improve mood (10), regulate emotions (11), reduce stress (12), reduce body inflammation (13), and improve quality of life (14). Research also shows that the therapeutic garden scenes with high CLM scores could be superior in delivering health benefits than standard green space (15). This further suggests that exposure to therapeutic gardens with certain contemplative features can support the treatment of depressive disorders, the most common mental illness worldwide. Between 1990 and 2017, incidents of depression worldwide increased by 50% (16). This figure is expected to grow significantly due to the COVID-19 pandemic (17, 18). Additionally, it has been established that city living increases the risk of developing depression (19, 20). Given the limitations of treatment accessibility and a growing number of people suffering from depression, testing new self-care interventions, such as visiting therapeutic gardens, appears to be a feasible and justified approach to support traditional treatment methods.
There have been many observational and epidemiological studies that allude to the therapeutic effects of gardens on mental health, though advanced experimental designs with robust methods of measurement are required to establish causality and unravel mechanistic pathways. Methodological and technological advancements in brain imaging allow for running in-situ experiments with a high level of ecological validity, during the actual exposure to sites of interest, as opposed to observational or self-reported outcomes, or more traditional laboratory-based experiments. This is thanks to non-invasive, portable, and reliable devices such as functional near-infrared spectroscopy (fNIRS) and electroencephalography (EEG). They offer a signal quality while recording in the field that is comparable with that of a fully-controlled lab environment (21–23). This is an emerging field of research that offers an opportunity to identify the specific pathways between therapeutic effects of nature on mental health and individual differences in brain pattern activity in the general and clinical populations.
In our preliminary study we found a pattern of brain activity suggestive of positive emotions and relaxation during passive exposure to the Therapeutic Garden among 24 healthy adults (15). Our findings stimulated further research on a larger sample, including the comparison of brain activity between healthy and depressed adults. Our aim was to build on the earlier findings and explore the effects of exposure to three different sites (two green spaces, but with different landscape quality, and one control—a busy urban environment with no greenery) on self-reported and direct measures of mood, and to examine whether healthy participants differed in their response from the participants with depression. For direct measures of mood, we used EEG and fNIRS. We expected that the difference in the alpha oscillations between the sites would follow the preliminary study findings. In addition, we added beta power band and fNIRS analyses to explore the attention patterns and hemodynamic response in these spaces, respectively. We further expected to see significant differences in neuro-electrical and hemodynamic signatures of the beneficial effect of passive exposure to therapeutic nature between the Clinical group of depressed individuals and the Healthy group. We hypothesized that passive exposure to therapeutic gardens can significantly improve the mood of all visitors: healthy adults as well as those suffering from the mood disorders, such as depressive disorder. Furthermore, we expected that this effect would not be observed in green spaces where physical characteristics of the landscape design are different.
Materials and Methods
Participants
We recruited 92 right-handed adults aged between 21 and 75 years old, 52 of which were females. Healthy participants (n = 68, 37 female) were recruited through word of mouth. The Clinical group (n = 24, 15 female) consisted of 17 patients diagnosed and treated for depressive disorder, who were recruited at the National University Hospital's Department of Psychological Medicine. Seven participants initially recruited for the Healthy group, who reported previous treatment for depression and clinically concerning moderate or severe depression, were subsequently reclassified to the Clinical group by the expert psychiatrist, even though at the time of recruitment they were not patients of the clinic. All participants were reimbursed for their time.
Site Selection
To test the hypothesis, three locations with different composition of natural and built elements were selected in the highly urbanized city-state of Singapore: (1) a Therapeutic Garden (TG), (2) a residential green public space designed without special therapeutic considerations (RG), and (3) an urban space with negligible greenery in a Busy Downtown area (BD). At each of the three locations, three distinct points of view were selected to represent different vistas typical to that location. Selected views were blindly coded by four landscape architecture experts according to the Contemplative Landscape Model (CLM), and an average score was computed for each site, in line with the recommended practice (9). Landscapes with higher CLM score have more contemplative landscape characteristics aggregated within the view and are more likely to induce the positive changes in mood and stress reduction. The CLM scores range from one to six points, and previous research has suggested that a score of 4.45 points and above can induce positive changes in brain activity (24).
The first site, TG, is part of a larger park called HortPark. It is the first specialized garden to offer both an activity area for inclusive nature-based group programs and a healing space designed to foster restoration from stress and mental fatigue. This intimate green space was carefully curated with vegetation that comprises wide-canopy trees and groupings of plants to stimulate the senses. Benches are aptly spaced, with views toward softly fascinating landscapes in the surroundings, facilitating nature contemplation and relaxation. Calming features, such as a watermill and chimes, are installed to promote a sense of peace and wellbeing. TG was assigned a high Contemplative Landscape Model [CLM (9)] score−4.63 points on the 1–6 point scale.
The second site, RG, is a green roof area of a public housing residential estate. In Singapore, the majority of the population lives in public housing commonly called HDB (from the Housing and Development Board, which is the name of the government agency in charge of their development). The HDB estates consist of high-rise and high-density blocks with multiple common green spaces and facilities accessible to the public. The experimental site was selected to be at Casa Clementi HDB Estate, on the recreational green roof over the underground parking area, consisting of paths among lush greenery, garden shelters and pergolas, community farm, biking trail, and children's playground. This site received overall 2.7 points on the CLM.
The third site was selected to represent the fully urbanized landscape of a busy downtown area with little to no natural elements. It is located in the central district near Chinatown and the busy Mass Rapid Transit interchange station. The views selected for this site are dominated by crowds of people, streets with high traffic, and lots of infrastructure. This site was not assigned a CLM score, as it is not a green space.
Scenes, locations, and walking areas were selected in shaded areas to avoid excessive sun exposure. To avoid order bias, we randomized both the order of the location visits and the order of site exposure within each location. Randomization of the site and view order was based on the Latin square design (simple rotation) (25), so that an equal number of participants started the experiment at each site and each view. The randomization scheme is presented in Figure 1.
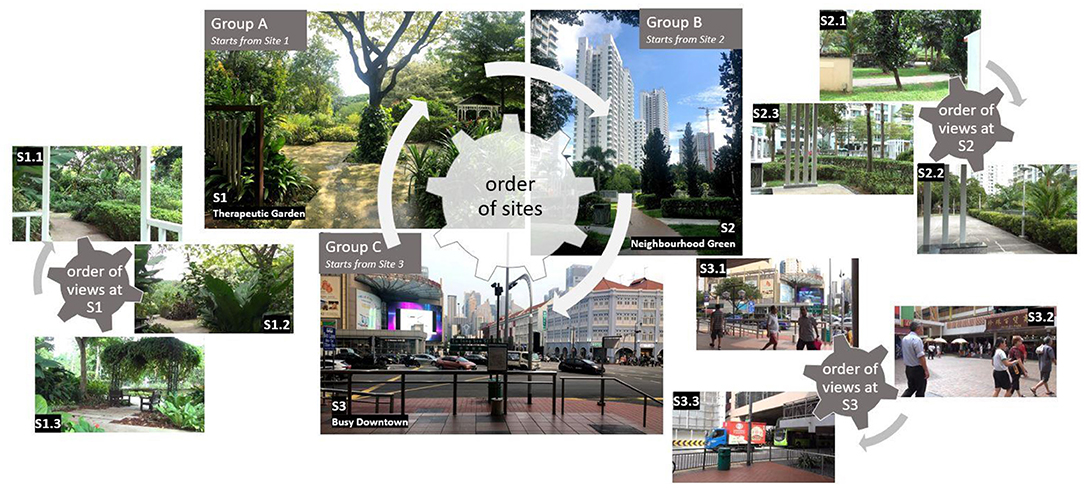
Figure 1. Selected sites and the order of visits.
Methods
To measure momentary mood changes we used a paper-based questionnaire, Profile of Mood States [POMS (26)], one of the most widely used affective psychometric instruments in environmental psychology (2). It consists of 40 adjectives that measure the Total Mood Disturbance (TMD) as well as subscales of mood states: tension, depression, fatigue, vigor, confusion, anger, and esteem-related affect. For each adjective the participant chooses a score on a 0–4 point scale from “Not at all” to “Extremely,” based on how they feel at the moment. POMS showed high reliability (Cronbach's alpha = 0.798) and good validity scores in the outdoor setting (26).
To measure the brain neuro-electrical activity and hemodynamics, we used a multimodal setup consisting of EEG, 16-channel V-amp amplifier (Brain Products GmbH, Munich, Germany) with dry active electrodes in modified 10/20 system (Figures 2A,B), and two portable NIRS SPORT devices by NIRx® (NIRx Medical Technologies, LLC, Berlin, Germany), with eight sources and eight detectors (Figures 2A,C) each, combined in tandem mode onto the same stretchable aniCAP supplied by NIRx® (Figure 2D), together with EEG, according to a pre-set prefrontal-occipital montage (Figures 2A,E).
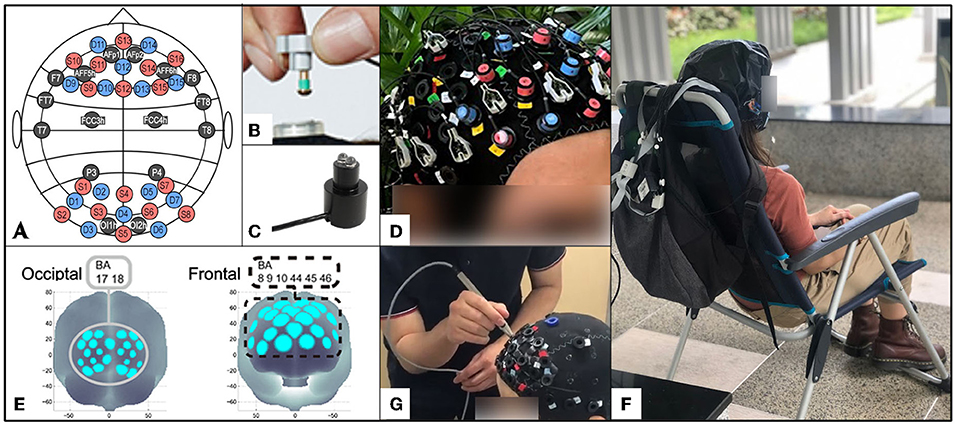
Figure 2. Experimental equipment and setup: (A) montage of the multi-modal system with EEG electrodes marked in black, fNIRS sources (S) with red and detectors (D) with blue; (B) NIRSport optode with a dual-tip; (C) EEG dry active electrode with an adjustable mushroom-head; (D) multi-modal NIRSport/EEG V-amp systems mounted onto one stretchable anti-cap, before the light-blocking over-cap placement; (E) regions of interest for fNIRS analysis according to Brodmanns Area (BA): occipital (BA: 17, 18) and frontal (BA: 8, 9, 10, 44, 45, 46); (F) participant with the brain scanning device mounted on her head, during the passive task; (G) digitization of the probe positions using a 3D-digitizer (Fastscan, Polhemus).
fNIRS is a relatively new brain-imaging technique providing a non-invasive and robust measurement of the light intensity changes (wavelengths between 650 and 1,000 nm) caused by the concentration of oxygenated hemoglobin (oxy-Hb) and deoxygenated hemoglobin (deoxy-Hb) in the brain vessels (27). The brain's neural activity in certain regions triggers an increase in blood flow and volume in those regions, which is disproportionately higher than the metabolic demand (28). Even passive exposure to landscape scenes requires cognitive resources, which can be reflected on the fNIRS scan. In this study, we are interested in observing the regional hemodynamics of the frontal and occipital regions in different sites and groups. The frontal region is one of the most important neuroanatomical structures and plays an important role in emotional processing (29), among other executive functions. The occipital lobe, on the other hand, is commonly associated with visual processing and spatial orientation (30, 31).
EEG records the electrical activity from the cortical regions of interest captured at the scalp, and divides the signal into several power-bands or brainwaves (32). The two most common brainwaves to signal the level of cortical alertness are alpha and beta waves. Alpha brainwaves are of lower frequency (8–13 Hz) and are most prominent during relaxation. Higher frequency beta waves (14–30 Hz) mark attentional processing and increase during task engagement. The first EEG marker examined in this study is Frontal Alpha Asymmetry (FAA). This marker is thought to capture attitudinal and behavioral tendencies toward a set of stimuli, so called approach-withdrawal mechanism (33, 34). A relative increase in alpha power in the right hemisphere (right-sided FAA) has been associated with a positive approach behavioral tendency and more generally reduced inhibition of behavioral and emotional responses (35). Right-hemispheric FAA is observed when the right frontal cortex has greater alpha power than the left frontal cortex, which corresponds to reduced activity in the right and larger cortical resource allocation in the left frontal cortex (36). Conversely, left-hemispheric FAA is characterized by greater alpha power and reduced activity in the left frontal cortex as compared to the right. Notably, previous studies have consistently reported left-hemispheric FAA in patients diagnosed with depression (37–41). However, according to a recent meta-analysis, it is not suitable as a diagnostic measure for major depressive disorder (35). Nonetheless, some work suggests that FAA is relevant to depression treatment. A comparison of depressed participants before and after a 12-week antidepressant treatment highlighted right-sided FAA as a significant predictor of positive treatment outcome, while participants who did not respond to medication showed greater left-sided FAA analysis than participants who did (42). Furthermore, FAA has been shown to be a useful target for neurofeedback used as treatment for depression (43, 44).
The second EEG marker identified as relevant to this study is Temporal Beta Asymmetry (TBA). Right-hemispheric TBA corresponds to more beta power in the right temporal lobe. The temporal region of the right hemisphere is, among other functions, responsible for visual attention (45), interpreting visual information and memory of pictures, visual scenes, and familiar faces (46). Previous studies associated TBA with bottom-up, stimuli driven attention directed at the salient stimuli (47). This bottom-up type of attention is triggered by external stimuli and is opposite to goal-oriented attention. The latter is typical to task-related processing, which, when performed for too long, leads to mental fatigue (48). Bottom-up attention is the central concept of the Attention Restoration Theory (ART), according to which contact with the natural environment leads to the restoration of depleted attentional capacities and to recovery from mental fatigue. In previous studies TBA brain pattern was conceptually linked to “fascination” (24), a key component of a restorative environment according to ART (49, 50).
Experimental Protocol
The experiment was conducted in the tropical city-state of Singapore, with neither distinct seasonal nor vegetation changes throughout the year. Data was collected between March 2019 and September 2020, during the morning or late afternoon hours of the working week. Participants were blinded to the hypothesis. Experimental sessions were scheduled individually to view at least three scenes within one site. On average, there were 9.1 days between the scheduled sessions (SD = 7.6). After arriving to the scheduled location, participants completed the informed consent and socio-demographic questionnaire, and then POMS before the exposure to each site. Afterwards, they were seated on a chair facing the pre-selected scene and the multimodal EEG-fNIRS brain-scanning apparatus was installed on their head (Figure 2D). Participants were then instructed to put on the white glasses to block the view and then to relax, while the equipment was calibrated and the raw signal recording was initiated. For the EEG recording, the electrode impedance was kept under 100 kΩ throughout the experiment, which is considered an acceptable value for dry electrode systems (51). Signal was recorded at 500 Hz. Cortical hemodynamics were measured with two wavelengths of near-infrared light (760 and 850 nm) and the sampling rate was set at 3.47 Hz.
After 1 min recording of the resting state with the white, view-blocking glasses on, the participants were asked to remove the glasses and passively watch the landscape in front of them for another 1 min. Once this was completed, the 1 min resting state with glasses on and 1 min scene watching was repeated a second time for the same scene. This process was repeated for all three scenes in each location. After the recording for all three scenes was over, the participant completed the post-measurement POMS questionnaire.
Each session lasted from 30 to 45 min depending on the speed of participant's relocation between scenes and smoothness of the machine calibration. Participants were allowed to consume water between individual scans, but not food. Environmental variables [temperature (°C), humidity (%Rh), brightness (Lux), and noise (dBA)] were recorded with a 4-in-1 Environment Meter (CEM, DT-8820) at each scene for each participant to control for confounding variables. The experimental setup is illustrated in Figure 2F.
Data Processing
POMS scores were calculated by summing the numerical ratings for items contributing to the subscale. The TMD score was calculated by summing up the totals for the negative subscales and then subtracting the totals for the positive subscale, and the constant of 100 was added to the result in order to eliminate the negative values {TMD = [(Ten+Ang+Fat+Dep+Con)–(Era+Fat)]+100}. Air pollution data, more specifically the 24 h Pollutant Standards Index (24 h-PSI) scores, were derived retrospectively from the online resources available at the National Environment Agency website (haze.gov.sg). The brain recordings were processed according to specific steps presented below.
EEG Data Processing
The EEG raw data was processed offline in Brain Analyzer 2 software (Brain Products GmbH, Munich, Germany). The signal was filtered with a 50 Hz notch filter, a low-pass at 40 Hz and a high-pass at 0.5 Hz (all were zero phase shift Butterworth filters, order 2). Channels were referenced to an average reference of 16 electrodes and visually inspected for noisy or missing channels. Topographic interpolation of noisy or lost channels was performed where necessary. Ocular artifacts (eye blinks and eye movement) were captured by Independent Component Analysis (ICA) and removed from the data. The signal was epoch time-locked to the onset of the viewing period (1–60 s), and resting baseline data split into matching 59 s long epochs. Each epoch was then split into 1 s equal segments, and noisy segments were removed using an artifact rejection tool. All data underwent Fast Fourier Transformation and were output as power density (μV2/Hz). Power density values were then averaged over each condition and alpha (8–13 Hz) and beta (14–30 Hz) bands were extracted. Before further processing all data was baseline-corrected (viewing period–resting baseline) (52, 53).
To compute the FAA values the alpha power on the left frontal lobe (LF, sum of AFp1, AFF5h, F7) and on the right frontal lobe (RF, sum of AFp2, AFF6h, F8) was inserted into the standard equation: (RF–LF)/(RF+LF) (54, 55). Positive FAA values are indicative of greater alpha power on the right frontal lobe as compared to left and negative of greater alpha power on the left frontal lobe compared to the right.
To compute the TBA values, beta power on the left temporal lobe (LT, sum of FT7 and T7) and on the right temporal lobe (RT, sum of FT8 and T8) was inserted into the equation (RT-LT)/(RT+LT). Positive TBA values are indicative of greater beta power on the right temporal lobe as compared to the left. Conversely, the negative TBA values indicate more beta power on the left temporal lobe than on the right.
fNIRS Data Processing
Signals reflecting the oxygenated hemoglobin (oxy-Hb) and deoxygenated hemoglobin (deoxy-Hb) concentration changes were calculated in units of millimolar-millimeter (mM-mm) using Homer 3 software (56). We analyzed changes in oxy-Hb signal because of its higher sensitivity to changes in cerebral blood flow than that of deoxy-Hb and total-Hb signals (57–59), its higher signal-to-noise ratio (58), and its higher retest reliability (60). We performed all preprocessing procedures with Matlab 2007b.
Positional data of sources and detectors were obtained for two non-participants of fNIRS measurement (′1 male, ′1 female, both age 24) using a 3D digitizer supplied by NIRx® (Figure 2G). For spatial profiling of fNIRS data, we adopted the probabilistic registration method (61–63), to register the data to the Montreal Neurological Institute's (MNI) (Montreal, QC, Canada) standard brain space. The macro-anatomical labeling was based on Rorden and Brett (64). We divided the brain region following Brodmanns Area (BA) into 2 regions: the occipital area (BA: 17, 18) and the frontal area (BA: 8, 9, 10, 44, 45, 46) as shown in Figure 2E.
Oxy-Hb signals of all channels were corrected for motion artifacts using CBSI method (65). Moving average methods were applied to remove short-term physiological noises in the analyzed data (moving average window: 10 s). The baseline of the task block following was determined by the mean of the last 10 s of the baseline block. From the preprocessed time series data, we computed the oxy-Hb values by calculating the inter-trial mean of the oxy-Hb signals for all the target periods in each site (10–60 s).
Statistical Analyses
Initial group comparisons were conducted using t-tests and χ2 to identify the potential covariates for the main analyses. Participant age and highest attained education level were identified as the potential confounders and included as covariates in the main analyses. In addition, participant ethnic background was also included as a covariate. Although ethnicity was equally distributed between the groups, there was a trend for the participants with non-Chinese ethnic background to have slightly higher BDI scores (Δ = 4, t = 1.88, p = 0.072) so ethnicity was also included as a covariate in the main analyses. We looked at multiple potential environmental covariates including noise, temperature, humidity, brightness, and total mood disturbance (the average of the individual environmental confounders), as well as individual situational confounders (alcohol intake in the last 24 h, sleep quality and duration, medication). As these factors were not linked to the outcomes and were not more prevalent in either group, and to preserve the degrees of freedom and maximize the power in the analyses, they were not included as covariates in the analyses.
Linear mixed models (LMM) were fitted to examine the differences between the Healthy and Clinical samples in the self-reported mood disturbance (TMD), frontal and occipital hemodynamics (oxy-Hb), FAA, and TBA across the three exposure sites. LMM was deemed most appropriate due to large individual variations in the intercepts. All models tested the main effects of group and site, as well as the interaction between group*site. Restricted maximum likelihood estimation was used to fit the models, with identity matrix covariance structure (selected based on the AIC criterion). Random intercepts and slopes were fitted to account for the individual differences in the outcome variables. For the TMD analysis, we explored the main differences between the sites, main differences in change over time (before and after viewing), and group differences between the Healthy and Clinical samples. In addition, we looked at the interaction between the site and time to examine whether both samples showed improvement or worsening of TMD from before to after the viewing depending on the site, and a 3-way interaction between time*site*group to test whether these changes over time across the sites differed between the samples. Due to signal quality issues, data from 78 participants (55 Healthy and 23 Clinical) were included in the fNIRS analysis. All analyses were computed in IBM SPSS v.26.
Results
Descriptive Findings
Sample characteristics are described in Table 1. Participants with depression were younger (t = 2.76, p = 0.007) and had lower education level (χ2 = 5.45, p = 0.02). Gender distribution (χ2 = 0.18, p = 0.67) and ethnicity distribution (χ2 = 0, p = 1.0) did not differ across the groups. As was expected, the Clinical sample had higher BDI scores (t = 7.21, p < 0.001), were more likely to have a medical record (χ2 = 48.7, p < 0.001), and more likely to be medicated (χ2 = 52.9, p < 0.001).
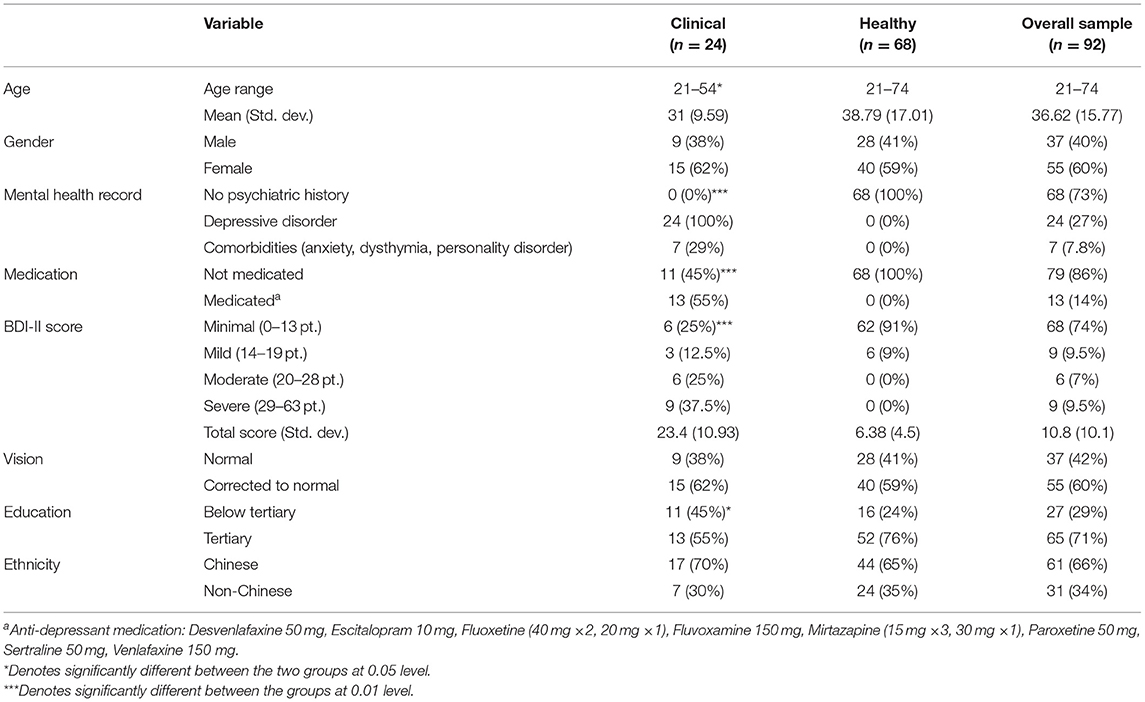
Table 1. Recruited sample characteristics within both Clinical and Healthy groups.
Profile of Mood States
Total Mood Disturbance
There was a significant main effect of site with the highest recorded TMD in the BD (M = 99.1, SE = 1.64), the lowest in the TG site (M = 91.6, SE = 1.64), and in-between recorded in the RG site [M = 92.3, SE = 1.64; F(2, 391.3) = 28.7, p < 0.001]. The Clinical sample had significantly higher TMD (M = 97.9, SE = 2.64) compared to the Healthy sample [M = 90.8, SE = 1.62; F(1, 75.7) = 5.13, p = 0.026]. Importantly, the change in TMD from before to after site exposure varied across the sites [F(2, 390.9) = 3.47, p = 0.32]. Only in the TG the TMD decreased (i.e., mood improved by 2%) after site exposure (Figure 3). In the BD, the TMD increased (mood worsened by ~7%) after site exposure, while in the RG there was no difference from before to after Both the Clinical and the Healthy sample showed similar improvements in TMD after viewing the TG [F(5, 391.0) = 0.99, p = 0.42].
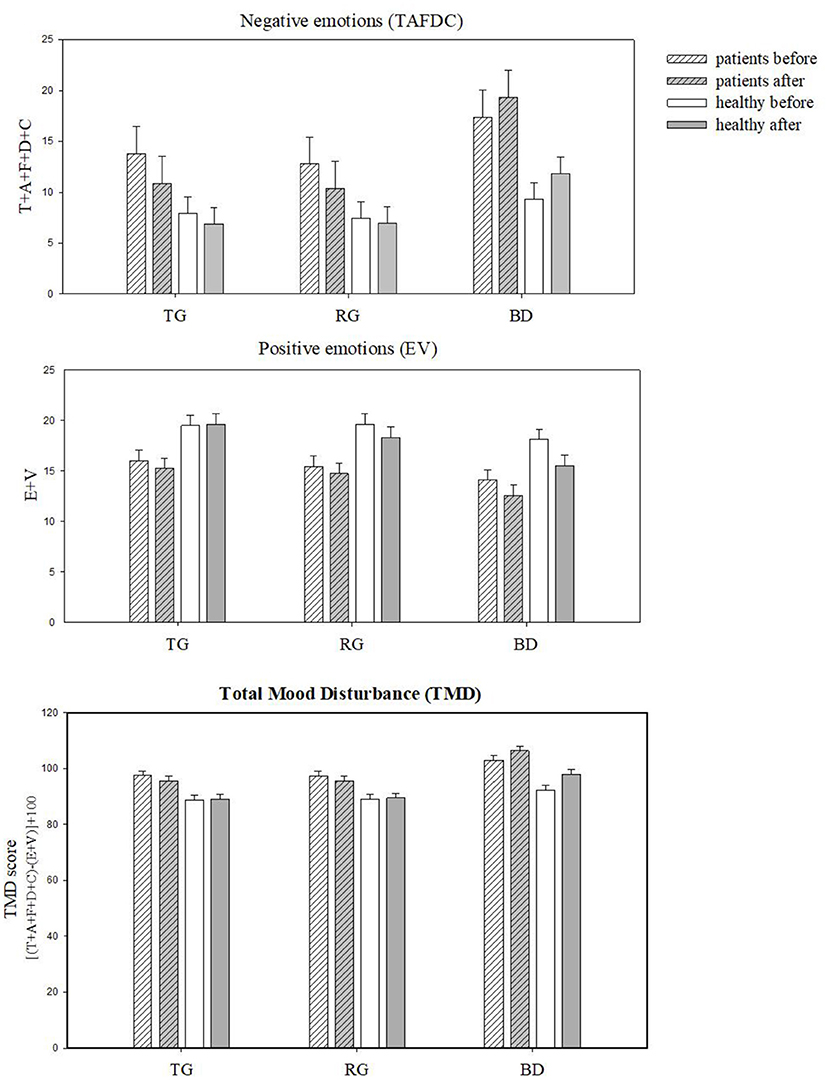
Figure 3. Profile of Mood States scores (±SE) grouped by subscales: negative (TAFDC) and positive (EV) and Total Mood Disturbance (TMD) before and after the exposure to three sites: TG, Therapeutic Garden; RG, Residential Green; BD, Busy Downtown.
Negative Emotions: Tension, Anger, Fatigue, Depression, and Confusion (TAFDC)
There was a significant main effect of site with the highest negative emotions score in BD [M = 14.472, SE = 1.39; F(2, 415) = 20.90, p < 0.001]. There was also main effect of group [F(1, 80) = 4.351, p = 0.04], with significantly higher scores in Clinical (M = 14.09, SE = 2.29) than in the Healthy group (M = 8.41, SE = 1.36). There was also a significant interaction between site and time [F(2, 415) = 3.45, p = 0.03] suggesting that both groups responded similarly to changes over time across the sites (see Figure 3). Clinical group had the highest negative emotion scores in BD site (M = 18.35, SE = 2.66), significantly higher than the Healthy (M = 21.20, SE = 1.59). Over time the negative emotions decreased significantly in both groups, particularly in the TG (by 22%).
Positive Emotions: Esteem-Related Affect and Vigor (EV)
There was a significant effect of time [F(1, 391.83) = 10.47, p < 0.001] and site [F(2, 392.12) = 22.02, p < 0.001], suggesting that EV was marginally higher before the viewing (M = 17.29, SE = 0.94) compared to after (M = 16.24, SE = 0.94). EV were the highest in TG (17.82, SE = 0.96) and the lowest in BD (M = 15.17, SE = 0.96). The groups did not differ in EV [F(1, 76.27) = 0.69, p = 0.41]. No significant interactions were found between group, site and time [F(5, 391.95) = 0.507, p = 0.771], suggesting that Clinical and Healthy groups did not show changes in positive emotions across the sites as a result of landscape viewing.
fNIRS Results
There was no effect of site observed [F(2, 134) = 2.063, p = 0.13, Figure 4A]. Pairwise comparisons revealed that oxy-Hb across all participants was lower at TG (M = −0.57, SE = 0.43) as compared to BD (M = 0.45, SE = 0.33), and the difference barely missed statistical significance (p = 0.054, Figure 4A). Clinical and Healthy samples did not generally differ in the frontal oxy-Hb [F(1, 63) = 0.58, p = 0.45]. There was a marginally significant interaction between the group and the site [F(2, 134) = 2.84, p = 0.06], suggesting that the Clinical and Healthy groups showed a trend toward different patterns of oxy-Hb depending on the site they were at. At TG, the Healthy sample had higher oxy-Hb (M = 0.34, SE = 0.47) as compared to the Clinical sample (M = −1.49, SE = 0.72), and the reverse pattern was observed in the BD, where the Clinical sample had a higher oxy-Hb value (M = 0.65, SE = 0.56) than the Healthy sample (M = 0.24, SE = 0.37, Figure 4B). We also examined oxy-Hb in the Occipital area; however, there were no differences in oxy-Hb across the sites [F(2, 247.98) = 0.40, p = 0.67], and no differences in the activation between the Healthy and the Clinical samples were observed [F(1, 11.49) = 0.82, p = 0.38]. There was also no interaction between the group and site [F(2, 247.98) = 0.72, 0.49].
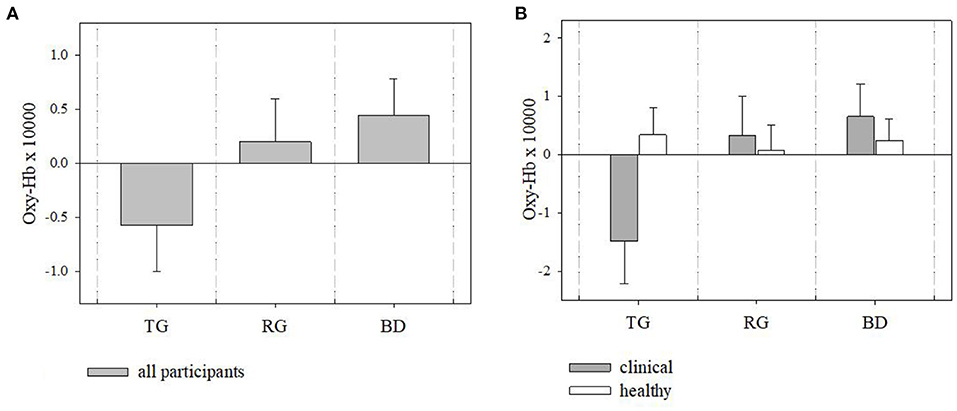
Figure 4. Frontal brain hemodynamics ±SE at different sites (TG, Therapeutic Garden; RG, Residential Green; BD, Busy Downtown); (A) differences in levels of oxy-Hb between sites across all participants, (B) differences in levels of oxy-Hb between sites and groups. All values multiplied by 10,000 to ease depiction and interpretation.
EEG Results
Frontal Alpha Asymmetry
The Healthy and Clinical samples did not differ in FAA values overall [F(1, 233) = 0.29, p = 0.59]. There was also non-significant difference in FAA between the sites [F(2, 233) = 0.89, p = 0.41]. However, there was a significant interaction between the groups and sites [F(2, 233) = 3.27, p = 0.040] suggesting that the Healthy and the Clinical samples had different patterns of FAA across the sites. Figure 5 shows mean FAA representing left- and right-sided asymmetry across the sites among the Healthy and the Clinical sample. In the TG the Clinical sample had right-sided FAA while the Healthy sample had left-sided FAA. This pattern was reversed in the BD, where the Clinical sample had left-sided while the Healthy sample had right-sided FAA, though the Confidence Intervals (C.I.) were overlapping. In the RG both samples showed similar patterns of right-sided FAA activation.
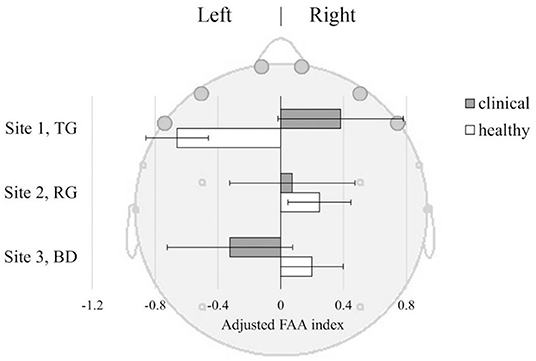
Figure 5. Frontal Alpha Asymmetry (FAA) index ±SE, in Clinical and Healthy samples at three sites: TG, Therapeutic Garden; RG, Residential Green; BD, Busy Downtown. FAA index [(R-L)/(R+L)] was derived from baseline-corrected power density values from the left (AFp1+AFF6h+F7) and right (AFp2+AFF6h+F8) frontal lobes.
Temporal Beta Asymmetry
TBA did not differ between the sites [F(2, 156) = 0.44], though the Healthy sample in general had a higher right-sided TBA compared to the Clinical sample [F(1, 75) = 4.41, p = 0.039]. This was observed irrespective of the viewing site [F(2, 156) = 0.24, p = 0.79] suggesting that decreased TBA may be inherent to depression (Figure 6). The Healthy sample demonstrated right-sided TBA across all sites, while the Clinical sample only had left-sided TBA in the BD.
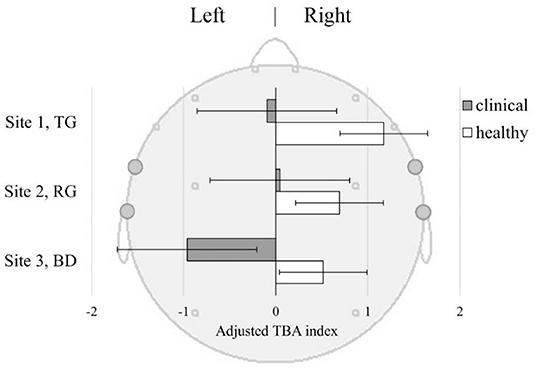
Figure 6. Temporal Beta Asymmetry (TBA) index ±SE in Clinical and Healthy samples at three sites: TG, Therapeutic Garden; RG, Residential Green; BD, Busy Downtown. TBA index [(R-L)/(R+L)] was derived from baseline-corrected power density values from the left (FT7+T7) and right (FT8+T8) temporal lobes.
Discussion
The aim of our study was to investigate the impact of a therapeutic garden on mental health, comparing it with exposure to other green and non-green urban spaces. Our second aim was to compare individual differences in the response of healthy and clinical populations suffering from depressive disorder. We expected to observe changes between the groups and between the exposure sites in terms of the brain activity marked with EEG and fNIRS signals as well as between the self-reported mood before and after the exposure. In the study design we used a multimodal brain imaging device measuring two different physiological phenomena EEG for brain electrical reactivity and fNIRS for levels of blood oxidation. Noteworthy, activation patterns must be interpreted with caution and supplemented with other measurements. For example, EEG low alpha activity pattern in one study can be associated with relaxation and creative ideation (66) while in another with boredom and mental fatigue (67, 68). An attempt to conceive meaningful interpretations of the results from two modalities is challenging in a system as complex as the human brain, but bringing us closer to interpret phenomena, specific to only one modality (69).
Findings From POMS
According to the results from the self-reported mood assessment POMS, exposure to the Therapeutic Garden improved mood (2% drop in the TMD). This effect occurred in both Healthy and Clinical groups, and only at TG and not at the other sites. Residential green did not have any significant effect on mood change, further confirming the hypothesis that not all types of green space exposure have the same therapeutic potential, or in other words, not all green space is the same. What is more, in Busy Downtown the self-reported mood significantly worsened (TMD increased by 7%) from before to after the exposure, suggesting that about 40-minute-long exposure to the busy downtown was a cause of greater mood disturbance in all participants. When looking at the grouped mood states only the negative subscale (TAFDC) showed a site*time interaction, with lowest negative emotions at TG and highest at BD site and the largest drop in negative emotions at TG. There were no significant findings in the positive mood subscales (Esteem-related affect and Vigor, EV). Overall, TG exposure significantly improved the general mood of participants in both groups, by reducing the negative affect, indicating its potential universal use as a self-care method.
Previous studies found similar reduction in mood disturbance after a 2-h forest walk in female students (70). Also, after a 30-min urban park exposure the TMD was found to decrease in a study conducted in the UK (71) and in Malaysia (72) among healthy adults. Our findings about TG are then not surprising when considering the healthy populations. However, there was no previous research on depressed people, and according to our findings the Clinical group responded in a similar way as the healthy group. In addition, like in previous studies, we observed increased mood disturbance in both groups in the urban environment, with the Clinical group having a significantly larger jump in negative mood (TAFDC) at that site as compared to a Healthy group. Notably, these negative mood scores were highest in the BD even before the experiment (Figure 3). This suggests that the mood was already disturbed before the experimental protocol has started, perhaps from the moment participants were present at this type of space. At RG, the mood decline or improvement was not observed, even though it is also a green space. Residential areas can be then considered a baseline, the environment from which the mood states can improve or decrease as the individual moves around the urban space along the day. These findings suggest that therapeutic gardens can offset the negative effects of living in the proximity of busy cosmopolitan areas, even in highly populated cities.
Findings From fNIRS
Considering the outcomes of the brain scanning, we first assessed the regional activity of the frontal and occipital cortex, measured with the levels of oxygenated hemoglobin in the brain vessels. We did not observe a significant effect of site in the frontal lobes (p = 0.13), but we observed very close to significant difference in oxy-HB between the TG and BD (p = 0.054) across all participants. Similar patterns were described in previous fNIRS studies comparing brain response to urban vs. natural scenes. They found that the natural views triggered lower levels of oxy-Hb concentration and increased oxy-Hb when viewing urban busy scenes in the healthy adult population and associated the lower oxy-Hb with restorative effect (11, 73) and reduced rumination (74). It has been shown that scenes of nature require less cognitive resources and less strenuous attention (75, 76) when compared to busy urban scenes abundant with elements of infrastructure, cars, buildings, and crowds, and our findings seem to support this general premise. When it comes to the differences between the groups, results indicated the marginally significant effect of site*group (p = 0.06), showing the trend of patterns of brain oxidation in Clinical being different to those observed in the Healthy group. At TG the Clinical sample had much lower frontal oxy-Hb compared to the Healthy sample, and the opposite pattern was observed in the BD. According to the systematic review, oxy-Hb concentration in the frontal cortex of depressed patients are usually significantly lower than in the healthy controls (29). Notably, previous studies with patients with depressive disorder were conducted only in the laboratory setting so it is not known how their brain reacted to different environments. Results of our experiment indicated that patients had more oxy-Hb in the Busy Downtown and lesser in the Therapeutic Garden. fNIRS findings together with the POMS results can then suggest that TG environment induced lowest levels of oxy-Hb in frontal cortex associated with the improved mood, but the effect was stronger for the patients who could also experience reduced rumination. Highest oxy-Hb was observed in patients in the BD, which seem to be associated with increased mood disturbance (Figure 4).
Findings From EEG
FAA. Regarding FAA findings, we did not observe significant difference between the experimental groups and sites considered in isolation. However, the site had a moderating effect on differences in FAA between the healthy and depressed group. The most contrasting difference was observed at the TG. There, we observed right-sided FAA in Clinical group, and left-sided in the Healthy group, suggesting that this environment induces significantly different affective reactivity in Healthy as compared to Clinical group (Figure 5).
Previous research suggests that greater left-hemispheric FAA was found in depressed patients, and we observed that pattern in the Clinical group at the BD location, but not in TG. Previous research also suggests that FAA training and neurofeedback aimed at inducing right-sided FAA in depressed patients has large therapeutic value in depression treatment, as a stimulation of the positive approach-related motivation (43). Furthermore, a comparison of depressed participants before and after a 12-week antidepressant treatment highlighted right-sided FAA as a significant predictor of positive treatment outcome, while participants who did not respond to medication showed greater left-sided FAA analysis than participants who did (42). The right-sided shift in FAA we observed in depressive participants at the TG site suggests that passive exposure to TG induced in our Clinical group a therapeutic pattern aligned with efficacious treatment and a general positive indicator of depression treatment outcome.
Interestingly, the mean FAA of Healthy individuals was left-sided during the TG exposure. While according to the “traditional” interpretation of FAA this could indicate a behavioral inhibition during the scene observation (35), the POMS findings showed that participants experienced mood improvement after spending time at TG. This indicates that FAA and mood measures may capture somewhat distinct mechanisms. This could also be an effect of high variability in FAA data in Healthy participants, unlike in the case of the case with the POMS measures. While mood improved consistently at the TG, behavioral tendencies captured by the FAA were highly variable. A similar dissociation between mood measures and FAA response was observed in the busy downtown environment. Here again, depressed participants showed consistent FAA and POMS indexes, while Healthy participants showed the opposite, a similarly higher variability was observed in their FAA responses. In this environment Healthy participants displayed more approach-related attitude, which suggests that Healthy individuals may be triggered to engage and interact with the social elements in the busy urban space. This may imply people adopt an approach-related attitude toward social interactions in public spaces. In comparison, the peaceful and quiet environment in the TG had lesser trigger for the group to adopt an approach behavior related to social interactions. There are large interindividual differences in the degree to which the environment affects behavioral tendencies in Healthy people, where personal preferences may be at play.
TBA. Temporal Beta Asymmetry is an index of how attention is deployed to stimuli. Of special interest here is the fact it can capture attentional patterns linked to the restoration of attention that can be induced by certain types of natural environments. Findings from the TBA analysis show that the Clinical group experienced significantly less of the pattern associated with attention restoration than their Healthy counterparts, regardless of the location (Figure 6). Moreover, in BD the attention restoration as indexed by TBA was significantly lower in the Clinical than in the Healthy group, suggesting that depressed individuals may have experienced extra mental fatigue from prolonged exposure to busy urban environments. Enhanced attention-restoration pattern was observed in the Healthy group at TG; however, the difference between TG and other sites was not significant. This may be related to specificity and duration of exposure as previous studies with self-reported measures of attention restoration, called Restorative Outcome Scale (ROS) (77), found effect on attention restoration after 30 min to 2 h of walking in the park or forest (78, 79), and not after passive exposure (80). Here we used passive exposure of short duration which might have been insufficient to induce the expected patterns.
In summary, the findings of this study provided neuro-psychophysiological evidence of benefits from passive exposure to the Therapeutic Garden for the mental health of individuals with clinically concerning depressive disorders. It further demonstrated that both depressed and non-depressed individuals can benefit from TG exposure, albeit through slightly different pathways. Notably, depressed individuals appeared to benefit consistently from TG exposure. In healthy people, other factors such as presence of social elements might be playing a role in the degree of engagement. Regardless of behavioral tendencies indexed by the frontal asymmetry, the passive exposure to the Therapeutic Garden improved mood in both groups. Moreover, the findings further confirmed that different designs of green spaces (measurable with visual quality assessment tools such as Contemplative Landscape Model) can induce different psychophysiological responses. The study contributed to advancing the knowledge in the field of environmental neuroscience through developing and testing in-situ experiment protocols with the use of multimodal EEG and fNIRS brain imaging tools and was an attempt to bridge the findings from the two techniques together.
One limitation of the study is an unbalanced sample. Even though the imbalance was relatively small (27–74%), ideally, there should be equal number of clinical and healthy participants, but the statistics modeling employed mixed effect models which are suited to imbalance datasets (81). Reflective of scientific studies in general, the sample of this study had higher educational attainment than the general population, which limits generalizability of the findings. Also, data collection in the naturalistic setting increases the risk of some unmeasured confounding factors which would be difficult to control for outside of the lab setting. Nonetheless, we controlled for various environmental confounders. fNIRS results must be interpreted with caution as they are highly variable, due to differences caused by the melatonin concentration in the skin (82) and a number of missing data due to low quality of signal. Finally, in this experiment only the momentary changes in mood and brain activity were examined, and only longitudinal data would allow us to determine how long the beneficial effects we observed here can be sustained over time.
Conclusions
Urban public space of everyday exposure can be seen quite differently by depressed people. Visiting therapeutic nature can constitute an effective and affordable supplement to depression treatment for patients as well as function as a self-care intervention for the healthy population to maintain their mental health. The provision of easily accessible therapeutic gardens to city residents can then be an important strategy for mental health promotion at the city scale and has a potential to offset the negative influence of the busy urban environments on mental health. Future research should focus on replicating the study in various locations and populations, as well as on the assessment of long-term mental health outcomes of exposure to different environments.
Data Availability Statement
The raw data supporting the conclusions of this article will be made available by the authors, without undue reservation.
Ethics Statement
The studies involving human participants were reviewed and approved by National University of Singapore Ethics Committee and obtained ethics approvals (NUS-IRB_S-20-12 for 111 healthy and NHG DSRB_2018/01036 for patients). All participants provided their written informed consent to participate in this study.
Author Contributions
AO-G: conceptualization and investigation. AO-G and NE: methodology. KN and AK: software. AO-G, AF, and NE: validation. AF: formal analysis. RH, AS, and ID: resources. AO-G, KN, and AK: data curation. AO-G and AF: writing—original draft preparation. AO-G, AF, NE, AS, KN, AK, and ID: writing—review and editing. AO-G and KN: visualization. RH and ID: supervision. RH and AS: project administration and funding acquisition. All authors have read and agreed to the published version of the manuscript.
Funding
This research was supported by the Ministry of National Development Research Fund. This article processing charge was funded by NUS Department of Psychological Medicine (R-177-000-100-001/R-177-000-003-001/R177000702733) and NUS iHeathtech Other Operating Expenses (R-722-000-004-731).
Conflict of Interest
The authors declare that the research was conducted in the absence of any commercial or financial relationships that could be construed as a potential conflict of interest.
Publisher's Note
All claims expressed in this article are solely those of the authors and do not necessarily represent those of their affiliated organizations, or those of the publisher, the editors and the reviewers. Any product that may be evaluated in this article, or claim that may be made by its manufacturer, is not guaranteed or endorsed by the publisher.
Acknowledgments
The authors want to thank all participants for their patience and willingness to participate in the brain scanning sessions as well as graduate and post-graduate student assistants: Radha Waykool, Manasi Prabhudesai, Estelle Mak, Zach Ow, Felix Lim, Kenneth Khoo, and Rahul Verma for their tremendous help with the outdoor data collection. We also want to acknowledge Dr. Rohit Tyagi for his advice on the equipment setup and data processing, and Raul Guizzo for proofreading of the manuscript.
References
1. Hung S-H, Chang C-Y. Health benefits of evidence-based biophilic-designed environments: a review. J People Plants Environ. (2021) 24:1–16. doi: 10.11628/ksppe.2021.24.1.1
2. Beute F, Andreucci MB, Lammel A, Davis ZG, Glanville J, Keune H, et al. Types characteristics of urban peri-urban green spaces having an impact on human mental health wellbeing: a systematic review. EKLIPSE Expert Working Group. UK Centre for Ecology & Hydrology, Wallingford, United Kingdom (2020). Available online at: https://eklipse.eu/wp-content/uploads/website_db/Request/Mental_Health/EKLIPSE_HealthReport-Green_Final-v2-Digital.pdf
3. Mengjia F, Jamaludin AA, Hussein H. Wellbeing in an Urban University: sensory perception for salutogenic landscape design. J ASIAN Behav Stud. (2020) 5:65–80. doi: 10.21834/jabs.v5i16.353
4. Olszewska-Guizzo A. Contemplative landscapes: towards healthier built environments. Environ Soc Psychol. (2018) 3. doi: 10.18063/esp.v3i2.742
5. Watts GR, Pheasant RJ. Identifying tranquil environments and quantifying impacts. Appl Acoustics. (2015) 89:122–7. doi: 10.1016/j.apacoust.2014.09.015
6. Joye Y, van den Berg AE. Restorative environments. Environ Psychol Introd. (2018) 65–75. doi: 10.1002/9781119241072.ch7
7. Souter-Brown G, Hinckson E, Duncan S. Effects of a sensory garden on workplace wellbeing: a randomised control trial. Landsc Urban Plan. (2021) 207:103997. doi: 10.1016/j.landurbplan.2020.103997
8. Bell SL, Foley R, Houghton F, Maddrell A, Williams AM. From therapeutic landscapes to healthy spaces, places and practices: a scoping review. Soc Sci Med. (2018) 196:123–30. doi: 10.1016/j.socscimed.2017.11.035
9. Olszewska A, Marques PF, Ryan RL, Barbosa F. What makes a landscape contemplative? Environ Plann B Urban Analyt City Sci. (2016) 45:7–25. doi: 10.1177/0265813516660716
10. Cordoza M, Ulrich RS, Manulik BJ, Gardiner SK, Fitzpatrick PS, Hazen TM. Impact of nurses taking daily work breaks in a hospital garden on burnout. Am J Crit Care. (2018) 27:508–12. doi: 10.4037/ajcc2018131
11. Lee J. Experimental study on the health benefits of garden landscape. Int J Environ Res Public Health. (2017) 14:829. doi: 10.3390/ijerph14070829
12. Goto S, Shen X, Sun M, Hamano Y, Herrup K. The positive effects of viewing gardens for persons with dementia. J Alzheimers Dis. (2018) 66:1705–20. doi: 10.3233/JAD-170510
13. Ng KST, Sia A, Ng MKW, Tan CTY, Chan HY, Tan CH. Effects of horticultural therapy on Asian older adults: a randomized controlled trial. Int J Environ Res Public Health. (2018) 15:1705. doi: 10.3390/ijerph15081705
14. Korn A, Bolton SM, Spencer B, Alarcon JA, Andrews L, Voss JG. Physical and mental health impacts of household gardens in an urban slum in Lima, Peru. Int J Environ Res Public Health. (2018) 15:1751. doi: 10.3390/ijerph15081751
15. Olszewska-Guizzo A, Sia A, Fogel A, Ho R. Can exposure to certain urban green spaces trigger frontal alpha asymmetry in the brain?—preliminary findings from a passive task EEG study. Int J Environ Res Public Health. (2020) 17:394. doi: 10.3390/ijerph17020394
16. Liu Q, He H, Yang J, Feng X, Zhao F, Lyu J. Changes in the global burden of depression from 1990 to 2017: findings from the Global Burden of Disease study. J Psychiatr Res. (2020) 126:134–40. doi: 10.1016/j.jpsychires.2019.08.002
17. Olszewska-Guizzo A, Fogel A, Escoffier N, Ho R. Effects of COVID-19-related stay-at-home order on neuropsychophysiological response to urban spaces: beneficial role of exposure to nature? J Environ Psychol. (2021) 75:101590. doi: 10.1016/j.jenvp.2021.101590
18. Ettman CK, Abdalla SM, Cohen GH, Sampson L, Vivier PM, Galea S. Prevalence of depression symptoms in US adults before and during the COVID-19 pandemic. JAMA Netw Open. (2020) 3:e2019686. doi: 10.1001/jamanetworkopen.2020.19686
19. Peen J, Schoevers RA, Beekman AT, Dekker J. The current status of urban-rural differences in psychiatric disorders. Acta Psychiatr Scand. (2010) 121:84–93. doi: 10.1111/j.1600-0447.2009.01438.x
20. Mueller DP. The current status of urban-rural differences in psychiatric disorder. An emerging trend for depression. J Nerv Mental Dis. (1981) 169:18–27. doi: 10.1097/00005053-198101000-00003
21. Mikkelsen KB, Tabar YR, Christensen CB, Kidmose P. EEGs vary less between lab and home locations than they do between people. Front Comput Neurosci. (2021) 15:5. doi: 10.3389/fncom.2021.565244
22. Pinti P, Aichelburg C, Gilbert S, Hamilton A, Hirsch J, Burgess P. A review on the use of wearable functional near-infrared spectroscopy in naturalistic environments. Jpn Psychol Res. (2018) 60:347–73. doi: 10.1111/jpr.12206
23. Baker JM, Rojas-Valverde D, Gutiérrez R, Winkler M, Fuhrimann S, Eskenazi B. Portable functional neuroimaging as an environmental epidemiology tool: a how-to guide for the use of fNIRS in field studies. Environ Health Perspect. (2017) 125:094502. doi: 10.1289/EHP2049
24. Olszewska-Guizzo A, Paiva TO, Barbosa F. Effects of 3D contemplative landscape videos on brain activity in a passive exposure EEG experiment. Front Psychiatry. (2018) 9:317. doi: 10.3389/fpsyt.2018.00317
25. Edwards AL. Balanced Latin-square designs in psychological research. Am J Psychol. (1951) 64:598–603. doi: 10.2307/1418200
26. Grove JR, Prapavessis H. Preliminary evidence for the reliability and validity of an abbreviated profile of mood states. Int J Sport Psychol. (1992).
27. Lai CYY, Ho CSH, Lim CR, Ho RCM. Functional near-infrared spectroscopy in psychiatry. BJPsych Adv. (2017) 23:324–30. doi: 10.1192/apt.bp.115.015610
28. Scholkmann F, Kleiser S, Metz AJ, Zimmermann R, Pavia JM, Wolf U. A review on continuous wave functional near-infrared spectroscopy and imaging instrumentation and methodology. Neuroimage. (2014) 85:6–27. doi: 10.1016/j.neuroimage.2013.05.004
29. Ho CSH, Lim LJH, Lim AQ, Chan NHC, Tan RS, Lee SH. Diagnostic and predictive applications of functional near-infrared spectroscopy for major depressive disorder: a systematic review. Front Psychiatry. (2020) 11:378. doi: 10.3389/fpsyt.2020.00378
30. Mangun GR, Hopfinger JB, Kussmaul CL, Fletcher EM, Heinze H-J. Covariations in ERP and PET measures of spatial selective attention in human extrastriate visual cortex. Hum Brain Mapp. (1997) 5:273–9.
31. Heinze HJ, Mangun GR, Burchert W, Hinrichs H, Scholz M, Münte TF. Combined spatial and temporal imaging of brain activity during visual selective attention in humans. Nature. (1994) 372:543–6. doi: 10.1038/372543a0
32. Luck SJ, Kappenman ES. “Electroencephalography and event-related brain potentials,” in Handbook of Psychophysiology, eds J. T. Cacioppo, L. G. Tassinary and G. G. Berntson (Cambridge University Press). (2017) pp. 74–100.
33. Harmon-Jones E, Gable PA, Peterson CK. The role of asymmetric frontal cortical activity in emotion-related phenomena: a review and update. Biol Psychol. (2010) 84:451–62. doi: 10.1016/j.biopsycho.2009.08.010
34. Rutherford HJV, Lindell AK. Thriving and surviving: approach and avoidance motivation and lateralization. Emot Rev. (2011) 3:333–43. doi: 10.1177/1754073911402392
35. van der Vinne N, Vollebregt MA, van Putten M, Arns M. Frontal alpha asymmetry as a diagnostic marker in depression: fact or fiction? A meta-analysis. Neuroimage Clin. (2017) 16:79–87. doi: 10.1016/j.nicl.2017.07.006
36. Briesemeister BB, Tamm S, Heine A, Jacobs AM. Approach the good, withdraw from the bad—a review on frontal alpha asymmetry measures in applied psychological research. Psychology. (2013) 4:261. doi: 10.4236/psych.2013.43A039
37. Henriques JB, Davidson RJ. Left frontal hypoactivation in depression. J Abnorm Psychol. (1991) 100:535. doi: 10.1037/0021-843X.100.4.535
38. Bell IR, Schwartz GE, Hardin EE, Baldwin CM, Kline JP. Differential resting quantitative electroencephalographic alpha patterns in women with environmental chemical intolerance, depressives, and normals. Biol Psychiatry. (1998) 43:376–88. doi: 10.1016/S0006-3223(97)00245-X
39. Gotlib IHEEG. alpha asymmetry, depression, and cognitive functioning. Cogn Emot. (1998) 12:449–78. doi: 10.1080/026999398379673
40. Debener S, Beauducel A, Nessler D, Brocke B, Heilemann H, Kayser J. Is resting anterior EEG alpha asymmetry a trait marker for depression? Neuropsychobiology. (2000) 41:31–7. doi: 10.1159/000026630
41. Pizzagalli DA, Nitschke JB, Oakes TR, Hendrick AM, Horras KA, Larson CL. Brain electrical tomography in depression: the importance of symptom severity, anxiety, and melancholic features. Biol Psychiatry. (2002) 52:73–85. doi: 10.1016/S0006-3223(02)01313-6
42. Bruder GE, Stewart JW, Tenke CE, McGrath PJ, Leite P, Bhattacharya N, et al. Electroencephalographic and perceptual asymmetry differences between responders and nonresponders to an SSRI antidepressant. Biol Psychiatry. (2001) 49:416–25. doi: 10.1016/s0006-3223(00)01016-7
43. Baehr E, Rosenfeld JP, Baehr R. Clinical use of an alpha asymmetry neurofeedback protocol in the treatment of mood disorders: follow-up study one to five years post therapy. J Neurother. (2001) 4:11–8. doi: 10.1300/J184v04n04_03
44. Rosenfeld JPA. biofeedback protocol for affective disorders. Clin Electroencephalogr. (2000) 31:7–12. doi: 10.1177/155005940003100106
46. Milner B. Visual recognition and recall after right temporal-lobe excision in man. Neuropsychologia. (1968) 6:191–209. doi: 10.1016/0028-3932(68)90019-5
47. Corbetta M, Shulman GL. Control of goal-directed and stimulus-driven attention in the brain. Nat Rev Neurosci. (2002) 3:201–15. doi: 10.1038/nrn755
48. Kaplan S. Meditation, restoration, and the management of mental fatigue. Environ Behav. (2001) 33:480–506. doi: 10.1177/00139160121973106
49. Chang C-Y, Chen P-K. Human response to window views and indoor plants in the workplace. Hortscience. (2005) 40:1354–9. doi: 10.21273/HORTSCI.40.5.1354
50. Herzog TR, Black AM, Fountaine KA, Knotts DJ. Reflection and attentional recovery as distinctive benefits of restorative environments. J Environ Psychol. (1997) 17:165–70. doi: 10.1006/jevp.1997.0051
51. Ferree TC, Luu P, Russell GS, Tucker DM. Scalp electrode impedance, infection risk, and EEG data quality. Clin Neurophysiol. (2001) 112:536–44. doi: 10.1016/S1388-2457(00)00533-2
52. Bailey AW, Allen G, Herndon J, Demastus C. Cognitive benefits of walking in natural versus built environments. World Leis J. (2018) 60:293–305. doi: 10.1080/16078055.2018.1445025
53. Coelli S, Sclocco R, Barbieri R, Reni G, Zucca C, Bianchi AM. EEG-based index for engagement level monitoring during sustained attention. In: 2015 37th Annual International Conference of the IEEE Engineering in Medicine and Biology Society. Milan: IEEE (2015). p. 1512–5.
54. Arns M, Bruder G, Hegerl U, Spooner C, Palmer DM, Etkin A. EEG alpha asymmetry as a gender-specific predictor of outcome to acute treatment with different antidepressant medications in the randomized iSPOT-D study. Clin Neurophysiol. (2016) 127:509–19. doi: 10.1016/j.clinph.2015.05.032
55. Keeser D, Karch S, Davis JR, Surmeli T, Engelbregt H, Länger A. Changes of resting-state EEG and functional connectivity in the sensor and source space of patients with major depression. Klin Neurophysiol. (2013) 44:142. doi: 10.1055/s-0033-1337283
56. Huppert TJ, Diamond SG, Franceschini MA, Boas DA. HomER: a review of time-series analysis methods for near-infrared spectroscopy of the brain. Appl Opt. (2009) 48:D280–98. doi: 10.1364/AO.48.00D280
57. Hoshi Y, Kobayashi N, Tamura M. Interpretation of near-infrared spectroscopy signals: a study with a newly developed perfused rat brain model. J Appl Physiol. (2001) 90:1657–62. doi: 10.1152/jappl.2001.90.5.1657
58. Strangman G, Culver JP, Thompson JH, Boas DAA. quantitative comparison of simultaneous BOLD fMRI and NIRS recordings during functional brain activation. Neuroimage. (2002) 17:719–31. doi: 10.1006/nimg.2002.1227
59. Hoshi Y. Functional near-infrared optical imaging: utility and limitations in human brain mapping. Psychophysiology. (2003) 40:511–20. doi: 10.1111/1469-8986.00053
60. Plichta MM, Herrmann MJ, Baehne CG, Ehlis AC, Richter MM, Pauli P. Event-related functional near-infrared spectroscopy (fNIRS): are the measurements reliable? Neuroimage. (2006) 31:116–24. doi: 10.1016/j.neuroimage.2005.12.008
61. Tsuzuki D, Jurcak V, Singh AK, Okamoto M, Watanabe E, Dan I. Virtual spatial registration of stand-alone fNIRS data to MNI space. Neuroimage. (2007) 34:1506–18. doi: 10.1016/j.neuroimage.2006.10.043
62. Tsuzuki D, Dan I. Spatial registration for functional near-infrared spectroscopy: from channel position on the scalp to cortical location in individual and group analyses. Neuroimage. (2014) 85:92–103. doi: 10.1016/j.neuroimage.2013.07.025
63. Tsuzuki D., Cai D-s, Dan H, Kyutoku Y, Fujita A, Watanabe E, et al. Stable and convenient spatial registration of stand-alone NIRS data through anchor-based probabilistic registration. Neurosci Res. (2012) 72:163–71. doi: 10.1016/j.neures.2011.10.008
64. Rorden C, Brett M. Stereotaxic display of brain lesions. Behav Neurol. (2000) 12:191–200. doi: 10.1155/2000/421719
65. Cui X, Bray S, Reiss AL. Functional near infrared spectroscopy (NIRS) signal improvement based on negative correlation between oxygenated and deoxygenated hemoglobin dynamics. Neuroimage. (2010) 49:3039–46. doi: 10.1016/j.neuroimage.2009.11.050
66. Fink A, Benedek M. EEG alpha power and creative ideation. Neurosci Biobehav Rev. (2014) 44:111–23. doi: 10.1016/j.neubiorev.2012.12.002
67. Elpidorou A. The bored mind is a guiding mind: toward a regulatory theory of boredom. Phenomenol Cogn Sci. (2018) 17:455–84. doi: 10.1007/s11097-017-9515-1
68. Fan X, Zhou Q, Liu Z, Xie F. Electroencephalogram assessment of mental fatigue in visual search. Biomed Mater Eng. (2015) 26:S1455–S63. doi: 10.3233/BME-151444
69. Villringer A, Mulert C, Lemieux L. Principles of multimodal functional imaging and data integration. In: EEG-fMRI. Berlin: Springer (2009). p. 3–17. doi: 10.1007/978-3-540-87919-0_1
70. Stigsdotter UK, Corazon SS, Sidenius U, Kristiansen J, Grahn P. It is not all bad for the grey city–A crossover study on physiological and psychological restoration in a forest and an urban environment. Health Place. (2017) 46:145–54. doi: 10.1016/j.healthplace.2017.05.007
71. Gidlow CJ, Jones MV, Hurst G, Masterson D, Clark-Carter D, Tarvainen MP. Where to put your best foot forward: psycho-physiological responses to walking in natural and urban environments. J Environ Psychol. (2016) 45:22–9. doi: 10.1016/j.jenvp.2015.11.003
72. Mokhtar D, Aziz NAA, Mariapan M. Physiological and psychological health benefits of urban green space in Kuala Lumpur: a comparison between Taman Botani Perdana and Jalan Bukit Bintang. Pertanika J Soc Sci Hum. (2018) 26. Available online at: https://www.researchgate.net/publication/327904617_Physiological_and_Psychological_Health_Benefits_of_Urban_Green_Space_in_Kuala_Lumpur_A_comparison_between_Taman_Botani_Perdana_and_Jalan_Bukit_Bintang/stats
73. Joung D, Kim G, Choi Y, Lim H, Park S, Woo J-M. The prefrontal cortex activity and psychological effects of viewing forest landscapes in autumn season. Int J Environ Res Public Health. (2015) 12:7235–43. doi: 10.3390/ijerph120707235
74. Bratman GN, Hamilton JP, Hahn KS, Daily GC, Gross JJ. Nature experience reduces rumination and subgenual prefrontal cortex activation. Proc Nat Acad Sci USA. (2015) 112:8567–72. doi: 10.1073/pnas.1510459112
75. Bratman GN, Hamilton JP, Daily GC. The impacts of nature experience on human cognitive function and mental health. Ann N Y Acad Sci. (2012) 1249:118–36. doi: 10.1111/j.1749-6632.2011.06400.x
76. Herman K, Ciechanowski L, Przegalińska A. emotional well-being in urban wilderness: assessing states of calmness and alertness in Informal Green Spaces (IGSs) with muse—portable EEG headband. Sustainability. (2021) 13:2212. doi: 10.3390/su13042212
77. Korpela KM, Ylén M, Tyrväinen L, Silvennoinen H. Determinants of restorative experiences in everyday favorite places. Health Place. (2008) 14:636–52. doi: 10.1016/j.healthplace.2007.10.008
78. Tyrväinen L, Ojala A, Korpela K, Lanki T, Tsunetsugu Y, Kagawa T. The influence of urban green environments on stress relief measures: a field experiment. J Environ Psychol. (2014) 38:1–9. doi: 10.1016/j.jenvp.2013.12.005
79. Ojala A, Korpela K, Tyrväinen L, Tiittanen P, Lanki T. Restorative effects of urban green environments and the role of urban-nature orientedness and noise sensitivity: A field experiment. Health Place. (2019) 55:59–70. doi: 10.1016/j.healthplace.2018.11.004
80. Takayama N, Korpela K, Lee J, Morikawa T, Tsunetsugu Y, Park B-J. Emotional, restorative and vitalizing effects of forest and urban environments at four sites in Japan. Int J Environ Res Public Health. (2014) 11:7207–30. doi: 10.3390/ijerph110707207
81. Littell RC. Analysis of unbalanced mixed model data: a case study comparison of ANOVA versus REML/GLS. J Agric Biol Environ Stat. (2002) 7:472–90. doi: 10.1198/108571102816
Keywords: depression, nature, brain activity, therapy, urban green space, therapeutic garden, major depressive disorder, contemplative landscape
Citation: Olszewska-Guizzo A, Fogel A, Escoffier N, Sia A, Nakazawa K, Kumagai A, Dan I and Ho R (2022) Therapeutic Garden With Contemplative Features Induces Desirable Changes in Mood and Brain Activity in Depressed Adults. Front. Psychiatry 13:757056. doi: 10.3389/fpsyt.2022.757056
Received: 11 August 2021; Accepted: 13 January 2022;
Published: 07 April 2022.
Edited by:
Jutta Lindert, University of Applied Sciences Emden Leer, GermanyReviewed by:
Richard Olmstead, University of California, Los Angeles, United StatesZhen Yuan, University of Macau, China
Copyright © 2022 Olszewska-Guizzo, Fogel, Escoffier, Sia, Nakazawa, Kumagai, Dan and Ho. This is an open-access article distributed under the terms of the Creative Commons Attribution License (CC BY). The use, distribution or reproduction in other forums is permitted, provided the original author(s) and the copyright owner(s) are credited and that the original publication in this journal is cited, in accordance with accepted academic practice. No use, distribution or reproduction is permitted which does not comply with these terms.
*Correspondence: Agnieszka Olszewska-Guizzo, b2xzemV3c2thLmFnbkBnbWFpbC5jb20=