 Tingwei Feng1†
 Lei Ren1†
 Chang Liu2†
 Kuiliang Li3
 Lin Wu1
 Xinyi Wei4Shangqing Yuan5
 Long-Biao Cui1Xi Yang6Danyang Li7Wei Yang8Ye Li8Buyao Wang9
 Hui Wang1*Xufeng Liu1*
- 1Military Medical Psychology School, Fourth Military Medical University, Xi'an, China
- 2BrainPark, Turner Institute for Brain and Mental Health and School of Psychological Sciences, Monash University, Clayton, VIC, Australia
- 3School of Psychology, Army Medical University, Chongqing, China
- 4Department of Psychology, Renmin University of China, Beijing, China
- 5School of Psychology, Capital Normal University, Beijing, China
- 6Department of Health Economy Management, Xijing Hospital, Fourth Military Medical University, Xi'an, China
- 7College of Education Science, Changji University, Changji, China
- 8Psychological Counseling Center, Xijing University, Xi'an, China
- 9Clinical and Psychological Counseling, DongFang College, Beijing University of Chinese Medicine, Langfang, China
Background: The relations between depression and intolerance of uncertainty (IU) have been extensively investigated during the COVID-19 pandemic. However, there is a lack of understanding on how each component of IU may differentially affect depression symptoms and vice versa. The current study used a network approach to reveal the component-to-symptom interplay between IU and depression and identify intervention targets for depression during the COVID-19 pandemic.
Methods: A total of 624 college students participated in the current study. An IU-Depression network was estimated using items from the 12-item Intolerance of Uncertainty Scale and the Patient Health Questionnaire-9. We examined the network structure, node centrality, and node bridge centrality to identify component-to-symptom pathways, central nodes, and bridge nodes within the IU-Depression network.
Results: Several distinct pathways (e.g., “Frustration when facing uncertainty” and “Feelings of worthlessness”) emerged between IU and Depression. “Fatigue” and “Frustration when facing uncertainty” were identified as the central nodes in the estimated network. “Frustration when facing uncertainty,” “Psychomotor agitation/retardation,” and “Depressed or sad mood” were identified as bridging nodes between the IU and Depression communities.
Conclusion: By delineating specific pathways between IU and depression and highlighting the influential role of “Frustration when facing uncertainty” in maintaining the IU-Depression co-occurrence, current findings may inform targeted prevention and interventions for depression during the COVID-19 pandemic.
Introduction
The COVID-19 pandemic has developed into a global public health emergency (1). The pandemic has brought serious psychosocial stressors (e.g., lockdowns, keeping social distance, loss of livelihood, and decreases in economic activity), which could be dangerous for public mental health (2, 3). Specifically, these stressors may drive risks for the onset and development of depression symptoms (4). A recent meta-analysis found that depression was prevalent during the COVID-19 pandemic, with a prevalence rate of 33.7% (5). Owing to the COVID-19 pandemic, the global prevalence of the major depressive disorder has increased by about 27.6% (6). The COVID-19 pandemic has led to significant uncertainty for the general public (7). The detrimental effects of pandemic-related uncertainties may be particularly relevant to individuals with high levels of intolerance of uncertainty (IU), who are prone to present negative cognitions, emotions, and behaviors when facing unpredictable events (8, 9). This mental health inequality is well-documented in the literature, with IU being consistently identified as a predictor of depression severity during the COVID-19 pandemic (7, 10–12).
Despite the robust associations between IU and depression (9), there are limited insights into how specific components of IU are related to individual depression symptoms. Specifically, prior research tends to use the latent variable approach when estimating the relationships between IU and depression. The approach treated both IU and depression as unitary constructs (indexed by sum scores of IU instruments and depression instruments) and either compared differences in IU between depressed and non-depressed groups (based on the cut-off value of depression symptom sum scores) or examined IU in relation to depression severity (7, 9–12). Concerns have been raised over treating IU and depression as unitary constructs. Specifically, depression is a heterogeneous syndrome consisting of various symptoms (e.g., fatigue, sad mood, and appetite changes), which differ from each other in important domains [e.g., predisposing factors, (13, 14)]. Individual depression symptoms have shown different connections with insomnia (15), internet addictions (16), traumatic stress (17), abuse (18), negative life events (19), and emotion regulation difficulties (20, 21). Similarly, the heterogeneity of components that constitute IU has been observed in previous studies (22, 23). And individual IU components have shown different connections with different symptoms of anxiety (24) and problematic smartphone use (25). Hence, treating IU and depression as unitary constructs (using sum scores) may overlook their relationships at the component-to-symptom level, hindering conceptual understanding of mechanisms underlying the co-occurrence of IU and depression.
To address the aforementioned concerns, the current study adopted the network approach to explain the co-occurrence of IU and depression. From a network perspective, psychopathology may be viewed as a network consisting of interacting variables (nodes) and pathways (edges) among them (26, 27). Components of IU and symptoms of depression may directly interact with one another (via distinct symptom pathways) and result in the co-occurrence of IU and depression. By inspecting the network structure, researchers may delineate specific pathways through which constructs interact and reinforce each other. Further, network analysis provides novel indices to understand the role played by each node within the network (28). For instance, nodes with high “expected influence” are highly connected to the remaining nodes within the network, thus, may serve to maintain the network. Meanwhile, “bridge expected influence” quantifies nodes' cross-construct connectivity. Thus, nodes with high “bridge expected influence” are considered the key to the maintenance of co-occurrence (29).
To our knowledge, no study to date has examined how individual IU components may contribute to specific depression symptoms. To address this gap and extend previous research on the IU-Depression association, the current study modeled the component-to-symptom relationships between IU and depression via the network approach. In the present study, we incorporated different components of IU and symptoms of depression into one network. This study had three goals: (1) elucidate component-to-symptom pathways between IU and depression, (2) identify central nodes within the IU-Depression network, and (3) identify influential bridge nodes connecting IU and depression communities.
Methods
Study population and survey design
Due to the COVID-19 outbreak, we conducted this online survey between 16 and 18 December 2020 via Wenjuanxing (www.wjx.cn). A WeChat (one of the largest instant messaging applications in China) message with links to the online survey was sent to all participants. Permission was gathered before the survey even began. The study only accepted participants who gave their consent. In the present network, we need to estimate 21 nodes (i.e., 12 components of IU and nine symptoms of depression) and 210 possible edges (i.e., each node has a connection with all other nodes). Although there are no definite guidelines yet as to how many participants we need per parameter, a rule of thumb put forward was the number of participants needed typically exceeds the possible parameters (30). Thus, the present network may need to recruit at least 231 participants. A total of 633 university students from Xijing University participated in our study. All of these participants were Chinese-speaking undergraduate students. Nine questionnaires were excluded due to their demographic information being incomplete. Finally, 624 questionnaires in all were collected. The First Affiliated Hospital of the Fourth Military Medical University's Ethics Committee authorized both this study and the format of the online survey (Project No. BWS16J012). The final sample consisted of 624 participants [57% female, mean age = 19.38, standard deviation (SD) = 1.12, range = 18–25 years].
Measures
Symptoms of depression
The Patient Health Questionnaire-9 (PHQ-9) is a self-assessment scale assessing depression symptoms over the past 2 weeks (31). This scale includes nine symptoms based on the diagnosis of DSM-IV depressive disorders and is widely used as a screening tool for clinical practice and research (31). Each item had responses ranging from 0 (not at all) to 3 (nearly every day). The PHQ-9 has been well-validated in Chinese college students (32). The scale showed good reliability in the current study (Cronbach's α = 0.89).
Components of IU
The 12-item Intolerance of Uncertainty Scale (IUS-12) is a short, efficient scale for assessing IU (33). This scale measures a variety of uncertainty-related beliefs, emotions, and behaviors, such as “Frustration when facing uncertainty” and “Smallest doubt can stop me from acting” (33). Responses to each item ranged from 1 (“not at all characteristic of me”) to 5 (“entirely characteristic of me”). In the present study, the Chinese version of IUS-12 was used to assess different components of IU (34). The Chinese version of IUS-12 has good reliability and validity. The scale used in the current study demonstrated good reliability (Cronbach's α = 0.84).
Network analysis
The IU-Depression network was estimated using the Gaussian graphical model (GGM) (35). The GGM was estimated on the basis of non-parametric Spearman rho correlation matrices (36, 37). Within a GGM, the edge represents the partial correlation between nodes after controlling for all other nodes in the network (36). By using the graphical LASSO (Least Absolute Shrinkage and Selection Operator) algorithm, a regularized GGM was obtained (38). In this regularization process, trivially small correlations were shrunk to zero. This regularization approach may reduce “false positive” edges and result in a network that is more stable and interpretable (36, 38). At the same time, the hyperparameter was set to 0.5 to balance the trade-off between sensitivity and specificity (36, 39). The final network was constructed and visualized [Fruchterman-Reingold algorithm, (40)] by conducting the R-package qgraph (41).
To calculate the node expected influence for each node within the final network, the R-package qgraph was used (41). Node expected influence is the sum of the edge weights linking to a specific node (42). A node with a higher expected influence is considered statistically more important within the network. The R-package networktools were used to compute the node bridge expected influence for each node within the final network (29). Node bridge expected influence is the sum of the edge weights linking a specific node to all nodes within the opposite community. A node with a higher bridge expected influence may be more likely to activate the opposite community (29). There were two communities of nodes in the current network, namely, the IU community (12 items from the IUS-12) and the depression community (9 items from the PHQ-9).
We tested the precision and robustness of the final network using the R package bootnet (30). The accuracy of edge weights was examined via 2,000 bootstrap samples in a non-parametric bootstrap technique. The correlation stability (CS)-coefficient was used to quantify the stability of node centralities (i.e., node expected to influence and bridge expected influence). Using 2,000 bootstrap samples, a case-dropping bootstrap methodology was used to get the CS coefficients for both metrics. The recommended value for CS-coefficient is above 0.5 and should not be lower than 0.25 (30). We also conducted bootstrapped difference tests to examine the difference between two edge weights or two node centralities.
Results
Descriptive statistics
The common age of the 624 college students (57% female) is 19.38 ± 1.12 years (mean ± SD, varying from 18 to 25 years). Moreover, 246 individuals are sole offspring and 378 individuals are non-sole offspring. The mean scores on the IUS-12 and PHQ-9 are 35.08 ± 7.44 (mean ± SD, range from 15 to 55) and 6.04 ± 4.74 (mean ± SD, range 0–27), respectively. Table 1 listed each variable's abbreviation, mean scores, and standard deviations.
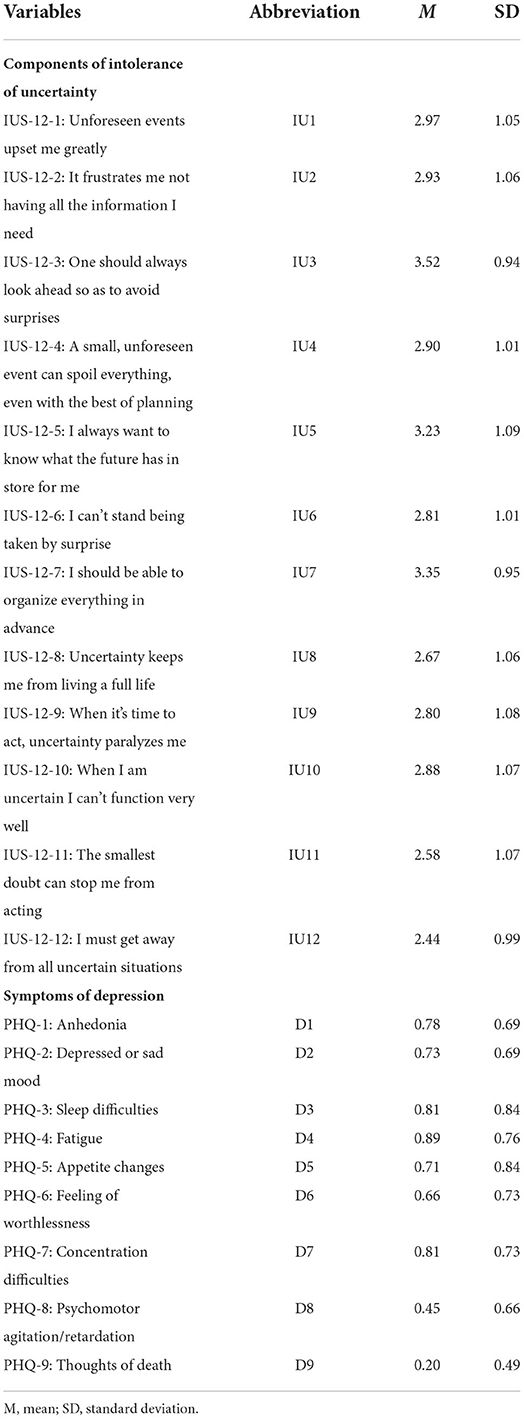
Table 1. Abbreviations, mean scores, and standard deviations for each variable selected in the present network.
Network structure
The final network was shown in Figure 1. There were several characteristics of this network. First, 127 edges were not zero (about 60%) among 210 possible edges and most of these edges were positive. And we found the six strongest edges in the final network. Among these six strongest edges, four edges were between IU's components IU1 and IU2 (weight = 0.40), IU11 and IU12 (weight = 0.30), IU9 and IU10 (weight = 0.27), IU10 and IU11 (weight = 0.26), and two edges were between D3 and D4 (weight = 0.28), D1 and D7 (weight = 0.24). It is worth noting that these six strongest edges had no one who connects IU's components and depression symptoms. Second, in the 108 possible edges between components of IU and symptoms of depression, 45 edges were not zero that ranged from −0.07 to 0.07. Four strongest edges were between IU2 and D6 (weight = 0.07), IU4 and D8 (weight = 0.07), IU12 and D2 (weight = 0.06), and IU2 and D4 (weight = 0.06). The two weakest edges were between IU7 and D1 (weight = −0.07) and IU7 and D6 (weight = −0.05). Supplementary material 2 showed the values of regularized partial correlation of all edges in the network. Supplementary Figure 1 showed the bootstrapped 95% confidence interval of edge weights and Supplementary Figure 2 showed the bootstrapped difference test for edge weights.
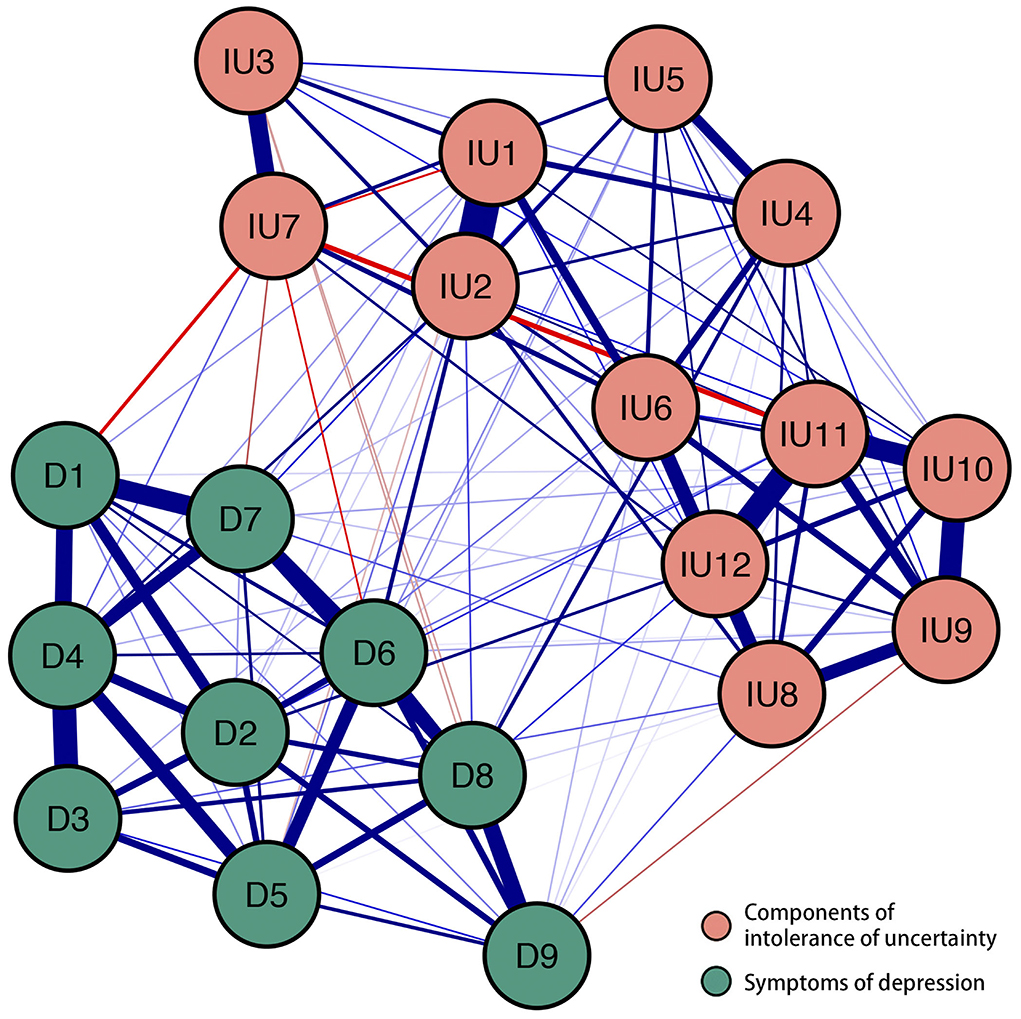
Figure 1. The network structure of different components of intolerance of uncertainty and symptoms of depression. Positive correlations were shown by blue borders, whereas negative correlations were represented by red edges. The size of the correlation was reflected in the thickness of the edge. Cut value = 0.05. The text of intolerance of uncertainty and depression can be seen in Table 1.
Node expected influence
Figure 2A showed the node expected influence. Two variables with the highest expected influence were D4 “Fatigue” and IU2 “Frustration when facing uncertainty.” Thus, from the perspective of statistics, these two variables had the strongest associations with other variables in the present network. The CS-coefficient of node expected influence was 0.67 which indicates that the estimation of node expected influences was adequately stable (Supplementary Figure 3). Supplementary Figure 4 showed the bootstrapped difference test for node expected influences.
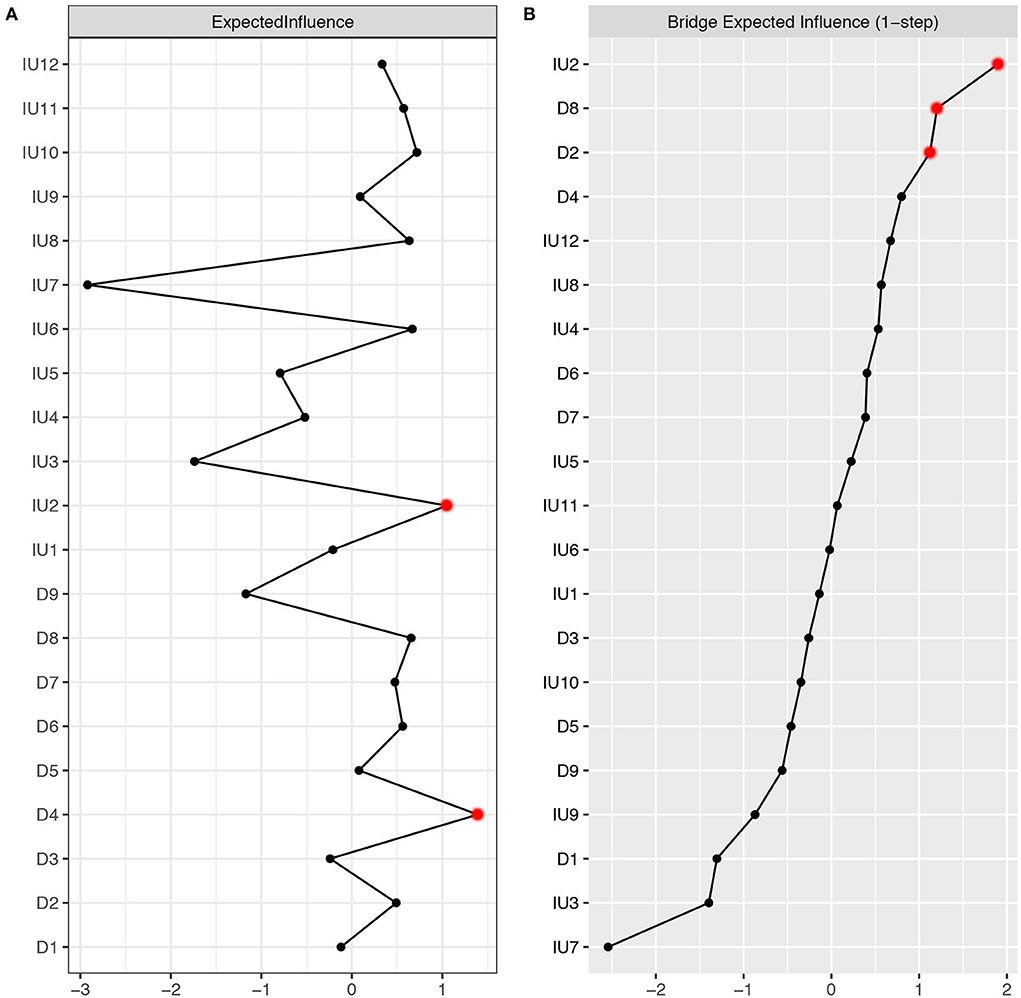
Figure 2. (A) Centrality plot depicted the expected influence (z-score) of each variable chosen in the final network. (B) Centrality plot depicted the bridge expected influence (z-score) of each variable chosen in the final network. The text of IU and depression can be seen in Table 1.
Node bridge expected influence
Figure 2B showed the node bridge's expected influence. In the community of depression, two variables with the highest bridge expected influence were D8 “Psychomotor agitation/retardation” and D2 “Depressed or sad mood.” In the community of IU, one variable with the highest bridge expected influence was IU2 “Frustration when facing uncertainty.” Thus, from the perspective of statistics, IU2 had the strongest association with depression symptoms. The CS-coefficient of node bridge expected influence was 0.44 (>0.25), indicating that the node bridge expected influence calculation fulfilled the criteria (Supplementary Figure 5). The bootstrapped difference test for node bridge expected influences were shown in Supplementary Figure 6.
Discussion
This was the first study to apply network analysis to examine the differential associations between symptoms of depression and components of IU during the COVID-19 pandemic. We found several pathways between IU and Depression, with the strongest emerging between IU2 “Frustration when facing uncertainty” and D6 “Feelings of worthlessness.” Our results also highlighted the important role of IU2, which was identified as both a central node and a bridge node within the estimated network. Other influential nodes were D4 “Fatigue” (with the highest node expected influence), D8 “Psychomotor agitation/retardation” (with high bridge expected influence), and D2 “Depressed or sad mood” (with high bridge expected influence).
In line with previous studies (24, 25, 43–46), the intra-community connections were generally denser and stronger than the inter-community connections within the estimated network. The strongest intra-community edge emerged between IU1 “Upset when facing unforeseen events” and IU2 “Frustration when facing uncertainty,” which was consistently reported in IU-related network analytic studies (24, 25). Within the depression community, we found that D3 “Sleep difficulties” and D4 “Fatigue” were closely related to each other, with “Sleep difficulties” may lead to “Fatigue” and vice versa. This finding is consistent with previous studies exploring the network structure of depression among college students (47, 48), the adult population (17, 49), domestic workers (50), and patients with epilepsy (51). These consistent findings addressed the concerns over the replicability of network analysis (52) and suggested that some specific symptoms pathway may exist across demographically different groups.
Regarding inter-community pathways, we found IU components may sustain distinct pathways leading to cognitive (e.g., D6 “Feeling of worthlessness”), emotional (e.g., D2 “Depressed or sad mood”), and somatic (e.g., D8 “Psychomotor agitation/retardation” and D4 “Fatigue”) symptoms of depression. The strongest pathway was observed between IU2 “Frustration when facing uncertainty” and D6 “Feelings of worthlessness.” This pathway may be particularly relevant when considering the cultural context. Specifically, emotional reactions to uncertainty (i.e., feeling frustrated) may be perceived as a lack of self-control or inability to restrain one's emotion, which is considered a major characteristic weakness of an individual and is against related social expectations (53–55). This may, in turn, promote self-hatred cognitions such as a “Feeling of worthlessness.” The finding supported the notion that cultural-specific factors should be considered when aiming to understand the maintenance of psychopathology. Specifically, it has been found that the “Feeling of worthlessness” is a uniquely important symptom among individuals from collectivistic cultural backgrounds (e.g., China and India) (56, 57), with unable to fulfill social expectations being proposed as a core mechanism underlying the maintenance of depression (56). Hence, it may be beneficial to replicate our findings among individuals from individualistic cultural backgrounds to ascertain whether cultural differences may impact the putative pathway between IU and depression.
Depression symptom D4 “Fatigue” and IU component IU2 “Frustration when facing uncertainty” showed the highest expected influence, indicating these two variables may be core to the maintenance of the IU-Depression network. The highest expected influence for IU2 is also consistent with our previous network study investigating IU-anxiety and IU-problematic smartphone use networks (24, 25). Depression symptom “Fatigue” is also a core symptom in previous network studies investigating the symptom network of depression-anxiety in college students and Filipino domestic workers (47, 48, 50).
When examining the bridge expected influence, we found that IU2 “Frustration when facing uncertainty,” D8 “Psychomotor agitation/retardation,” and D2 “Depressed or sad mood” emerged as bridging nodes between the IU and depression communities. As for IU, node bridge expected influence may reveal the unique effect of different components of IU on the various symptoms of depression. IU2 has the highest bridge expected influence. This indicates that IU2 has stronger connections with the depression community than other IU components. Therefore, from the perspective of the network system, targeting IU2 may be more effective at alleviating depression symptoms than targeting other components of IU. It should be noted that this is only a hypothesis, which needs to be tested experimentally and clinically. From the standpoint of concept, people are more likely to fear missing out and tend to get more information about the pandemic due to the uncertainty of the COVID-19 pandemic (58). However, it is almost impossible to obtain all the information about the COVID-9 pandemic. Under this condition, individuals may begin to generate negative emotions, which in turn increase the severity of depression symptoms. It is worth mentioning that IU7 “Organizing everything in advance” has four pathways linking to the depression community and three of them are negative. This leads to its lowest bridge centrality and may represent a protective ability for depression symptoms. In fact, organizing things in advance is a sign of maturity in Chinese culture, which might also symbolize the advantageous response as a substitute for intolerance when dealing with uncertainty (24). In the depression community, symptoms D8 and D2 have the greatest bridge expected influence. This implies that these two depression symptoms might be susceptible to the IU community.
We found that IU2 “Frustration when facing uncertainty” may act as both a central node and a bridge node within the IU-Depression network. This replicated previous findings from networks involving co-occurring anxiety (24) and problematic smartphone use (25). These consistent findings support the notion that IU may act as a transdiagnostic risk factor for various psychological conditions (e.g., emotional disorders, obsessive-compulsive disorder, addiction, and eating disorders) and add incremental value to current knowledge by teasing out the specific component that may underpin the association between IU and psychological conditions. This finding may have implications at the public health level. Specifically, by assessing individual differences in negative emotional reactions (i.e., frustrations) toward uncertainty, mental health providers may be able to identify the high-risk population for developing emotional and addiction-related symptoms. Further, interventions targeting this specific component may concurrently reduce various psychological conditions. This may be particularly relevant to reducing the public mental health burden during and after the pandemic.
Several limitations should be considered when interpreting current findings. First, the utilization of a student sample from a single Chinese university may limit the representativeness of current findings. Second, the current study used a cross-sectional approach. This means that no causal relationship can be established among study variables. Third, the network structure in the current study was examined at a group level and may not be replicable when examined at an individual level.
Conclusion
Notwithstanding the limitations above, the current study has some strengths. To the satisfaction of our knowledge, our study is the first to apply network analysis to explore the component-to-symptom connections between IU and depression during the COVID-19 pandemic. Findings identify some central and bridge variables (especially IU component IU2 “Frustration when facing uncertainty”) in the depression-IU network. These central and bridge variables may also provide some insights for related preventions and therapies to address the COVID-19 pandemic's mental health needs. Based on our results, “Frustration when facing uncertainty” may be a promising target when designing interventions for depression symptoms.
Data availability statement
The data analyzed in this study is subject to the following licenses/restrictions: In order to protect private information, the data cannot be made publicly available. The data may be available from the corresponding author for a reason, and requests to access these datasets should be directed to LR.
Ethics statement
The studies involving human participants were reviewed and approved by the Declaration of Helsinki and was approved by the Ethics Committee of the First Affiliated Hospital of the Fourth Military Medical University (Project No.BWS16J012). The questionnaire was completed online in the WeChat application after electronic informed consent was obtained.
Author contributions
TF, LR, HW, and XL developed the study idea and design. TF, LR, and CL wrote the original draft of this manuscript. All authors contributed to revising subsequent versions of the article.
Funding
XL's involvement in this research was funded by the Fourth Military Medical University (BWS16J012). L-BC's involvement in this research was funded by the Fourth Military Medical University (2021JSTS30).
Acknowledgments
We would like to thank all the individuals who participated in the study. We also thank all the administrative staff and teachers in the universities who helped us with the recruitment.
Conflict of interest
The authors declare that the research was conducted in the absence of any commercial or financial relationships that could be construed as a potential conflict of interest.
Publisher's note
All claims expressed in this article are solely those of the authors and do not necessarily represent those of their affiliated organizations, or those of the publisher, the editors and the reviewers. Any product that may be evaluated in this article, or claim that may be made by its manufacturer, is not guaranteed or endorsed by the publisher.
Supplementary material
The Supplementary Material for this article can be found online at: https://www.frontiersin.org/articles/10.3389/fpsyt.2022.993814/full#supplementary-material
References
1. World Health Organization. WHO Director-General's Opening Remarks at the Media Briefing on COVID-19. (2020). Retrieved from https://www.who.int/director-general/speeches/detail/who-director-general-s-opening-remarks-at-the-media-briefing-on-covid-19---11-march-2020(accessed March 11, 2020).
2. Cao W, Fang Z, Hou G, Han M, Xu X, Dong J, et al. The psychological impact of the COVID-19 epidemic on college students in China. Psychiatry Res. (2020) 287:112934. doi: 10.1016/j.psychres.2020.112934
3. Türközer HB, Öngür D. A projection for psychiatry in the post-COVID-19 era: potential trends, challenges, and directions. Mol Psychiatry. (2020) 25:2214–9. doi: 10.1038/s41380-020-0841-2
4. Holmes EA, O'Connor RC, Perry VH, Tracey I, Wessely S, Arseneault L, et al. Multidisciplinary research priorities for the COVID-19 pandemic: a call for action for mental health science. Lancet Psychiatry. (2020) 7:547–60. doi: 10.1016/S2215-0366(20)30168-1
5. Salari N, Hosseinian-Far A, Jalali R, Vaisi-Raygani A, Rasoulpoor S, Mohammadi M, et al. Prevalence of stress, anxiety, depression among the general population during the COVID-19 pandemic: a systematic review and meta-analysis. Global Health. (2020) 16:57. doi: 10.1186/s12992-020-00589-w
6. COVID-19 Mental Disorders Collaborators. Global prevalence and burden of depressive and anxiety disorders in 204 countries and territories in 2020 due to the COVID-19 pandemic. Lancet. (2021) 398:1700–12. doi: 10.1016/S0140-6736(21)02143-7
7. Rettie H, Daniels J. Coping and tolerance of uncertainty: predictors and mediators of mental health during the COVID-19 pandemic. Am Psychol. (2021) 76:427–37. doi: 10.1037/amp0000710
8. Carleton RN. Into the unknown: a review and synthesis of contemporary models involving uncertainty. J Anxiety Disord. (2016) 39:30–43. doi: 10.1016/j.janxdis.2016.02.007
9. McEvoy PM, Hyett MP, Shihata S, Price JE, Strachan L. The impact of methodological and measurement factors on transdiagnostic associations with intolerance of uncertainty: a meta-analysis. Clin Psychol Rev. (2019) 73:101778. doi: 10.1016/j.cpr.2019.101778
10. Voitsidis P, Nikopoulou VA, Holeva V, Parlapani E, Sereslis K, Tsipropoulou V, et al. The mediating role of fear of COVID-19 in the relationship between intolerance of uncertainty and depression. Psychol Psychother. (2021) 94:884–93. doi: 10.1111/papt.12315
11. Bakioglu F, Korkmaz O, Ercan H. Fear of COVID-19 and positivity: mediating role of intolerance of uncertainty, depression, anxiety, and stress. Int J Ment Health Addict. (2021) 19:2369–82. doi: 10.1007/s11469-020-00331-y
12. Korkmaz H, Güloglu B. The role of uncertainty tolerance and meaning in life on depression and anxiety throughout Covid-19 pandemic. Pers Individ Dif. (2021) 179:110952. doi: 10.1016/j.paid.2021.110952
13. Konac D, Young KS, Lau J, Barker ED. Comorbidity between depression and anxiety in adolescents: bridge symptoms and relevance of risk and protective factors. J Psychopathol Behav Assess. (2021) 43:583–96. doi: 10.1007/s10862-021-09880-5
14. Fried EI, Nesse RM. Depression sum-scores don't add up: why analyzing specific depression symptoms is essential. BMC Med. (2015) 13:72. doi: 10.1186/s12916-015-0325-4
15. Bai W, Zhao YJ, Cai H, Sha S, Zhang Q, Lei SM, et al. Network analysis of depression, anxiety, insomnia and quality of life among Macau residents during the COVID-19 pandemic. J Affect Disord. (2022) 311:181–8. doi: 10.1016/j.jad.2022.05.061
16. Cai H, Bai W, Sha S, Zhang L, Chow IHI, Lei SM, et al. Identification of central symptoms in Internet addictions and depression among adolescents in Macau: a network analysis. J Affect Disord. (2022) 302:415–23. doi: 10.1016/j.jad.2022.01.068
17. Zavlis O, Butter S, Bennett K, Hartman TK, Hyland P, Mason L, et al. How does the COVID-19 pandemic impact on population mental health? A network analysis of COVID influences on depression, anxiety and traumatic stress in the UK population. Psychol Med. (2021) 2021:1–9. doi: 10.1017/S0033291721000635
18. Li K, Zhan X, Ren L, Liu N, Zhang L, Li L, et al. The association of abuse and depression with suicidal ideation in Chinese adolescents: a network analysis. Front Psychiatry. (2022) 13:853951. doi: 10.3389/fpsyt.2022.853951
19. Li K, Guang Y, Ren L, Zhan X, Tan X, Luo X, et al. Network analysis of the relationship between negative life events and depressive symptoms in the left-behind children. BMC Psychiatry. (2021) 21:429. doi: 10.1186/s12888-021-03445-2
20. Everaert J, Joormann J. Emotion regulation difficulties related to depression and anxiety: a network approach to model relations among symptoms, positive reappraisal, and repetitive negative thinking. Clin Psychol Sci. (2019) 7:1–15. doi: 10.1177/2167702619859342
21. Zhang D, Liu S, Wu X, Tian Y. Network analysis of cognitive emotion regulation strategies and depressive symptoms in young adults after recent stressful events: the moderation of childhood maltreatment. J Affect Disord. (2022) 301:107–16. doi: 10.1016/j.jad.2022.01.044
22. Freeston MH, Rhéaume J, Letarte H, Dugas MJ, Ladouceur R. Why do people worry? Pers Indiv Differ. (1994) 17:791–802. doi: 10.1016/0191-8869(94)90048-5
23. Bottesi G, Marchetti I, Sica C, Ghisi M. What is the internal structure of intolerance of uncertainty? A network analysis approach. J Anxiety Disord. (2020) 75:102293. doi: 10.1016/j.janxdis.2020.102293
24. Ren L, Wei Z, Li Y, Cui LB, Wang Y, Wu L, et al. The relations between different components of intolerance of uncertainty and symptoms of generalized anxiety disorder: a network analysis. BMC Psychiatry. (2021) 21:448. doi: 10.1186/s12888-021-03455-0
25. Liu C, Ren L, Li K, Yang W, Li Y, Rotaru K. Understanding the association between intolerance of uncertainty and problematic smartphone use: a network analysis. Front Psychiatry. (2022) 13:917833. doi: 10.3389/fpsyt.2022.917833
26. Borsboom D. A network theory of mental disorders. World Psychiatry. (2017) 16:5–13. doi: 10.1002/wps.20375
27. McNally RJ. Network analysis of psychopathology: controversies and challenges. Annu Rev Clin Psychol. (2021) 17:31–53. doi: 10.1146/annurev-clinpsy-081219-092850
28. Contreras A, Nieto I, Valiente C, Espinosa R, Vazquez C. The study of psychopathology from the network analysis perspective: a systematic review. Psychother Psychosom. (2019) 88:71–83. doi: 10.1159/000497425
29. Jones PJ, Ma R, McNally RJ. Bridge centrality: a network approach to understanding comorbidity. Multivariate Behav Res. (2021) 56:353–67. doi: 10.1080/00273171.2019.1614898
30. Epskamp S, Borsboom D, Fried EI. Estimating psychological networks and their accuracy: a tutorial paper. Behav Res Methods. (2018) 50:195–212. doi: 10.3758/s13428-017-0862-1
31. Kroenke K, Spitzer RL, Williams JB. The PHQ-9: validity of a brief depression severity measure. Gen Intern Med. (2001) 16:606–13. doi: 10.1046/j.1525-1497.2001.016009606.x
32. Zhang YL, Liang W, Chen ZM, Zhang HM, Zhang JH, Weng XQ, et al. Validity and reliability of Patient Health Questionnaire-9 and Patient Health Questionnaire-2 to screen for depression among college students in China. Asia Pac Psychiatry. (2013) 5:268–75. doi: 10.1111/appy.12103
33. Carleton RN, Norton MA, Asmundson GJ. Fearing the unknown: a short version of the intolerance of uncertainty scale. J Anxiety Disord. (2007) 21:105–17. doi: 10.1016/j.janxdis.2006.03.014
34. Zhang YJ, Song JB, Gao YT, Wu SJ, Song L, Miao DM. Reliability and validity of the intolerance of uncertainty scale-short form in university students. Chin J Clin Psychol. (2017) 25:285–8. doi: 10.16128/j.cnki.1005-3611.2017.02.020
35. Epskamp S, Waldorp LJ, Mõttus R, Borsboom D. The Gaussian graphical model in cross-sectional and time-series data. Multivariate Behav Res. (2018) 53:453–80. doi: 10.1080/00273171.2018.1454823
36. Epskamp S, Fried EI. A tutorial on regularized partial correlation networks. Psychol Methods. (2018) 23:617–34. doi: 10.1037/met0000167
37. Isvoranu AM, Epskamp S. Which estimation method to choose in network psychometrics? Deriving guidelines for applied researchers. Psychol Meth. (2021) 3:439. doi: 10.1037/met0000439
38. Friedman J, Hastie T, Tibshirani R. Sparse inverse covariance estimation with the graphical lasso. Biostatistics. (2008) 9:432–41. doi: 10.1093/biostatistics/kxm045
39. Foygel R, Drton M. Extended Bayesian information criteria for Gaussian graphical models. Adv Neural Inform Process Syst. (2010) 23:2020–8. doi: 10.48550/arXiv.1011.6640
40. Fruchterman TMJ, Reingold EM. Graph drawing by force-directed placement. Software Pract Exper. (1991) 21:1129–64. doi: 10.1002/spe.4380211102
41. Epskam S, Cramer AOJ, Waldorp LJ, Schmittmann VD, Borsboom D. Qgraph: network visualizations of relationships in psychometric data. J Stat Softw. (2012) 48:1–18. doi: 10.18637/jss.v048.i04
42. Robinaugh DJ, Millner AJ, McNally RJ. Identifying highly influential nodes in the complicated grief network. J Abnorm Psychol. (2016) 125:747–57. doi: 10.1037/abn0000181
43. Chen C, Li F, Liu C, Li K, Yang Q, Ren L. The relations between mental well-being and burnout in medical staff during the COVID-19 pandemic: a network analysis. Front Public Health. (2022) 10:919692. doi: 10.3389/fpubh.2022.919692
44. Wei X, Jiang H, Wang H, Geng J, Gao T, Lei L, et al. The relationship between components of neuroticism and problematic smartphone use in adolescents: a network analysis. Pers Individ Dif. (2022) 186:111325. doi: 10.1016/j.paid.2021.111325
45. Yuan GF, Shi W, Elhai JD, Montag C, Chang K, Jackson T, et al. Gaming to cope: applying network analysis to understand the relationship between posttraumatic stress symptoms and internet gaming disorder symptoms among disaster-exposed Chinese young adults. Addict Behav. (2022) 124:107096. doi: 10.1016/j.addbeh.2021.107096
46. Haws JK, Brockdorf AN, Gratz KL, Messman TL, Tull MT, DiLillo D. Examining the associations between PTSD symptoms and aspects of emotion dysregulation through network analysis. J Anxiety Disord. (2022) 86:102536. doi: 10.1016/j.janxdis.2022.102536
47. Ren L, Wang Y, Wu L, Wei Z, Cui LB, Wei X, et al. Network structure of depression and anxiety symptoms in Chinese female nursing students. BMC Psychiatry. (2021) 21:1–12. doi: 10.1186/s12888-021-03276-1
48. Bai W, Cai H, Liu S, Chen X, Sha S, Cheung T, et al. Anxiety and depressive symptoms in college students during the late stage of the COVID-19 outbreak: a network approach. Transl Psychiatry. (2021) 11:638. doi: 10.1038/s41398-021-01738-4
49. Owczarek M, Nolan E, Shevlin M, Butter S, Karatzias T, McBride O, et al. How is loneliness related to anxiety and depression: a population-based network analysis in the early lockdown period. Int J Psychol. (2022) 2022:12851. doi: 10.1002/ijop.12851
50. Garabiles MR, Lao CK, Xiong Y, Hall BJ. Exploring comorbidity between anxiety and depression among migrant Filipino domestic workers: a network approach. J Affect Disord. (2019) 250:85–93. doi: 10.1016/j.jad.2019.02.062
51. Wei Z, Ren L, Wang X, Liu C, Cao M, Hu M, et al. Network of depression and anxiety symptoms in patients with epilepsy. Epilepsy Res. (2021) 175:106696. doi: 10.1016/j.eplepsyres.2021.106696
52. Borsboom D, Robinaugh DJ, Psychosystems Group, Rhemtulla M, Cramer AOJ. Robustness and replicability of psychopathology networks. World Psychiatry. (2018) 17:143–4. doi: 10.1002/wps.20515
53. Yang LH, Kleinman A. 'Face' and the embodiment of stigma in China: the cases of schizophrenia and AIDS. Soc Sci Med. (2008) 67:398–408. doi: 10.1016/j.socscimed.2008.03.011
54. Yang F, Yang BX, Stone TE, Wang XQ, Zhou Y, Zhang J, et al. Stigma towards depression in a community-based sample in China. Compr Psychiatry. (2020) 97:152152. doi: 10.1016/j.comppsych.2019.152152
55. Kuo CL, Kavanagh KH. Chinese perspectives on culture and mental health. Issues Ment Health Nurs. (1994) 15:551–67. doi: 10.3109/01612849409040533
56. Wasil AR, Venturo-Conerly KE, Shinde S, Patel V, Jones PJ. Applying network analysis to understand depression and substance use in Indian adolescents. J Affect Disord. (2020) 265:278–86. doi: 10.1016/j.jad.2020.01.025
57. Xie T, Wen J, Liu X, Wang J, Poppen PJ. Utilizing network analysis to understand the structure of depression in Chinese adolescents: replication with three depression scales. Curr Psychol. (2022) 22:1–12. doi: 10.1007/s12144-022-03201-z
Keywords: COVID-19, depression, intolerance of uncertainty, network analysis, central nodes, bridge nodes
Citation: Feng T, Ren L, Liu C, Li K, Wu L, Wei X, Yuan S, Cui L-B, Yang X, Li D, Yang W, Li Y, Wang B, Wang H and Liu X (2022) The relations between different components of intolerance of uncertainty and symptoms of depression during the COVID-19 pandemic: A network analysis. Front. Psychiatry 13:993814. doi: 10.3389/fpsyt.2022.993814
Received: 14 July 2022; Accepted: 09 September 2022;
Published: 13 October 2022.
Edited by:
Ravi Philip Rajkumar, Jawaharlal Institute of Postgraduate Medical Education and Research (JIPMER), IndiaReviewed by:
Jelena Blanuša, College for Vocational Education of Preschool Teachers and Coaches, SerbiaVesna Barzut, Educons University, Serbia
Copyright © 2022 Feng, Ren, Liu, Li, Wu, Wei, Yuan, Cui, Yang, Li, Yang, Li, Wang, Wang and Liu. This is an open-access article distributed under the terms of the Creative Commons Attribution License (CC BY). The use, distribution or reproduction in other forums is permitted, provided the original author(s) and the copyright owner(s) are credited and that the original publication in this journal is cited, in accordance with accepted academic practice. No use, distribution or reproduction is permitted which does not comply with these terms.
*Correspondence: Hui Wang, MzA3NzU4MTYzN0BxcS5jb20=; Xufeng Liu, bHhmX2ZtbXVAMTYzLmNvbQ==
†These authors have contributed equally to this work