 Zehui Liu1
 Yuxin Chen
 Mingyang Zou
 Caihong Sun
- 1Department of Children’s and Adolescent Health, Public Health College, Harbin Medical University, Harbin, China
- 2Department of Preventive Medicine, School of Public Health, Qiqihar Medical University, Qiqihar, China
- 3Faculty of Arts and Science, University of Toronto, Toronto, ON, Canada
Background: Autism spectrum disorder (ASD) is a heritable form of neurodevelopmental disorder that arises through synaptic dysfunction. Given the involvement of voltage-gated potassium (Kv) channels in the regulation of synaptic plasticity, we aimed to explore the relationship between the genetic variants in the KCNB1 and KCND2 genes (encoding Kv2.1 and Kv4.2, respectively) and the risk of developing ASD.
Methods: A total of 243 patients with ASD and 243 healthy controls were included in the present study. Sixty single nucleotide polymorphisms (SNPs) (35 in KCNB1 and 25 in KCND2) were genotyped using the Sequenom Mass Array.
Results: There were no significant differences in the distribution of allele frequencies and genotype frequencies in KCNB1 between cases and controls. However, the differences were significant in the allelic distribution of KCND2 rs1990429 (pBonferroni < 0.005) and rs7793864 (pBonferroni < 0.005) between the two groups. KCND2 rs7800545 (pFDR = 0.045) in the dominant model and rs1990429 (pFDR < 0.001) and rs7793864 (pFDR < 0.001) in the over-dominant model were associated with ASD risk. The G/A genotype of rs1990429 in the over-dominant model and the G/A–G/G genotype of rs7800545 in the dominant model were correlated with lower severity in the Autism Diagnostic Interview-Revised (ADI–R) restricted repetitive behavior (RRB) domain.
Conclusion: Our results provide evidence that KCND2 gene polymorphism is strongly associated with ASD susceptibility and the severity of RRB.
1. Introduction
Autism spectrum disorder (ASD) is a neurodevelopmental disease characterized by impaired social interaction and repetitive/stereotyped behaviors. It is reported that the overall prevalence of ASD is 23.0 per 1,000 children aged 8 years in the United States, and the estimated prevalence is 7.0 per 1,000 children aged 6–12 years in China (1, 2). This alarming situation implies that ASD is being increasingly recognized as a major health burden. Generally, it is assumed that ASD involves strong genetic components, whose heritability is estimated to be 83% (3). Our previous study found that 2,174 candidate genes were closely related to ASD, based on whole-genome sequencing. These genes included 14,310 single nucleotide polymorphisms (SNPs), the majority of which play important roles in the regulation of synaptic development and plasticity (4). Numerous studies have confirmed that alterations in synaptic plasticity and neuronal excitation/inhibition imbalance contribute to the major etiology of ASD.
Potassium channels, broadly distributed on neuronal cell membranes, are crucial determinants of synaptic plasticity and neuronal excitability. Accumulating evidence shows that genetic mutations in potassium channels inducing alterations of K+ current change the synaptic plasticity and information processing capacity of the brain, thus potentially impairing brain connectivity and function in the early life of individuals with ASD (5). Voltage-gated potassium (Kv) channels are important modulators involved in regulating neuronal excitability, mainly including transient outward potassium channels and delayed rectifier potassium channels. Recently, the strong genetic associations between Kv channels and ASD have been partially explained. The expression level of Kv10.2 was significantly reduced in the hippocampus of VPA-induced rats (a model of ASD), and autism-like behaviors, such as stereotypical behaviors and impaired social and exploratory abilities, were effectively ameliorated after upregulation of Kv10.2 expression by lentivirus injection in the hippocampus (6). KCNC1 (encoding Kv3.1) knockout mice show deficits in social interaction and hyperactivity (7). The Kv7 mutant has been proposed to be potentially pathogenic in autism, owing to altered action potential generation (8). The above-mentioned evidence shows that deleterious mutations in Kv channels impact ASD pathogenesis directly or indirectly, which may cause impairments in social interaction and cognitive function.
Kv2.1 (encoded by KCNB1) is the principal delayed rectifier potassium channel, which alters the action potential threshold and firing frequency (9). Kv4.2 (encoded by KCND2) is a major predominant transient outward potassium channel, which regulates neuronal signaling by regulating back-propagating action potentials, synaptic integration, and long-term potentiation (10). Kv2.1 and Kv4.2 are expressed at high levels throughout the various hippocampal subfields, especially in the CA1 dendritic field (9, 10). The hippocampus is an important brain region in ASD, which implies that these two Kv channels might be central nodes of dysfunction in ASD. Research has found that 7 of 19 mutants in KCNB1, including S202F, R306C, R312H, W370R, V378A, P385T, and F416L, altered the activity of the voltage-dependence channel, current density, and conductance, which caused epileptic spasms and autism-like developmental phenotypes (11). Zhang et al. (12) showed that strong gating impairment, associated with substitutions of V404L, or V404M in KCND2, increased susceptibility to autism and epileptic seizures. Numerous studies have shown that ASD and epilepsy often co-exist as parallel syndromes. Even in the absence of epileptic seizures, roughly 4–86% of individuals with autism presented abnormal electroencephalogram patterns (13). The frequent comorbidity between ASD and epilepsy implies shared underlying neurological abnormalities. It is widely recognized that KCNB1 and KCND2 are the main causes of developmental and epileptic encephalopathy and neurodevelopmental disability (12, 14). Therefore, we speculated that KCNB1 and KCND2 may be risk genes for autism.
To investigate whether KCNB1 and KCND2 gene polymorphisms are related to ASD risk in the Chinese Han population, we identified the SNPs in the KCNB1 and KCND2 genes between patients with autism and control individuals by allele frequencies, genotype frequencies, and haplotype analyses. Furthermore, we evaluated the relationship between the SNPs and the severity of ASD symptoms. Our results offer supporting evidence for the involvement of Kv channels in the etiology of ASD.
2. Materials and methods
2.1. Participants
The case-control study included 243 pairs of subjects: the ASD patients were recruited from the Child Development and Behavior Research Center of Harbin Medical University, Harbin, China, and the controls were selected from kindergartens, junior schools in Harbin, China. All the subjects were of Chinese Han ethnicity, aged between 2 and 10 years. The diagnosis was confirmed by two professional clinicians according to DSM–V. Most participants with autism were evaluated using Autism Diagnostic Observation Schedule (ADOS) or Autism Diagnostic Interview-Revised (ADI–R), which are currently the gold standard for assessing ASD severity. Participants were excluded if they had other neuropsychiatric disorders or known genetic disorders, such as epilepsy, tuberous sclerosis, intellectual disability, or fragile X syndrome.
The study received ethics approval from the Institutional Review Board of Harbin Medical University for Medical Sciences (Ethics approval number: HMUIRB2012007). The research was performed in accordance with the Declaration of Helsinki principles. All participants or their relatives provided written informed consent.
2.2. Clinical evaluation
The ADOS and ADI–R were assessed to obtain information about autism-specific behaviors and symptoms. Each patient was scored by trained examiners through structured clinical interview with their patients or guardians. Ultimately, of the 243 cases, 166 (68.3%) individuals completed the ADOS assessment and 162 (66.7%) individuals completed the ADI–R assessment. Sample characteristics are provided in Supplementary Table 1. ADOS is a semi-structured observational assessment, which is organized into four modules to assess participants’ social and communication abilities in a standardized context. The calibrated severity score (CSS) is a standardized score of the relative severity of autism-specific behaviors, less influenced by demographic and developmental factors (15). This diagnostic algorithm consists of social affect (SA) and restricted repetitive behavior (RRB) domains, which are consistent with DSM–V (16). A detailed description of procedures for deriving the ADOS–CSS, SA–CSS, and RRB–CSS can be found in the original study (15, 17). ADI–R is an anamnestic interview with ASD parents or caregivers, mainly providing information on early development. The interview encompasses three behavioral domains: social, communication, and RRB. Higher scores indicate greater impairment. The intelligence quotient (IQ) scores were derived from the Wechsler Intelligence Scale for Children or the Peabody Picture Vocabulary Test.
2.3. SNP selection and genotyping
Tag SNPs in KCNB1 and KCND2 genes were selected from the Chinese Han in the Beijing panel of HapMap Project Phase II, including 2,000–bp upstream regions at least. Tag SNP selection was performed using the Tagger program incorporated in Haploview v.4.2 software (Broad Institute of Massachusetts Institute of Technology and Harvard, Cambridge, MA, USA) according to the following criteria: minor allele frequency ≥ 0.05 and pairwise tagging (r2 ≥ 0.8). Finally, 57 tag SNPs (32 in KCNB1 and 25 in KCND2 that captured from more than 98 and 216 initially identified SNPs, respectively) were selected for genotyping along with three additional single nucleotide variants in KCNB1 (rs587777850, rs587777849, and rs587777848) that have been linked to autism phenotypes in the previous study (18). Mutation information and location for tag SNPs are shown in Supplementary Tables 2, 3.
All the blood samples were collected in venous blood collection tubes containing EDTA. Genomic DNA was extracted from blood cells by the Qiagen QIAamp DNA Mini kit (Qiagen, Hilden, Germany) following the manufacturer’s instructions. Quality assessment and concentration estimation of DNA were done using gel electrophoresis and NanoDrop 2000 spectrophotometer (Thermo Fisher Scientific, Waltham, MA, United States). SNP genotyping was done using the MassArray platform (Sequenom, San Diego, CA, United States) with primers listed in Supplementary Tables 4, 5. Genotyping quality control for all 60 SNPs was tested using blinded duplicate genotyping for 30 random samples, with reproducibility of 100%.
2.4. Statistical analyses
Hardy-Weinberg equilibrium (HWE) among controls, Linkage disequilibrium (LD) and haplotype construction were determined with Haploview v.4.2 software. Allelic associations were performed with logistic regression using SPSS v.21.0 software (SPSS Inc., Chicago, IL, United States). The odds ratio (OR) and 95% confidence interval (CI) were calculated in different genetic models using SNPstats software1. Genotype associations were estimated according to genetic models of codominant, dominant, recessive, over-dominant, and log-additive, with further adjustment for gender and age. The Akaike information criterion (AIC) and Bayesian information criterion (BIC) were used for model selection, with the lower AIC and BIC indicating the better models. To avoid false-positive results in multiple comparisons, p-values were obtained by either FDR corrected using the Benjamini-Hochberg procedure or Bonferroni correction. Potential associations between genotype and symptom phenotype were evaluated by one-way analysis of variance with adjustment for age, sex, and IQ. All p-values were two tailed, with the significance level set at α = 0.05.
3. Results
3.1. General demographics
There were 243 individuals (39 girls and 204 boys) in the ASD group and 243 (51 girls and 192 boys) in the control group; the mean ages were 5.19 ± 1.96 and 4.96 ± 0.97 years, respectively. The groups did not differ statistically in age (t = 1.643, p = 0.101) and gender (χ2 = 1.964, p = 0.161).
3.2. Links between SNPs and ASD risk
There were a total of 7 SNPs out of the 35 SNPs that were removed in KCNB1: the rs237454, rs490840, and rs802952 call rates were lower than 90%; rs587777850, rs58777749, and rs58777748 showed no dimorphism among participants; rs1961192 deviated from HWE in the control group (p < 0.01; Table 1). In total, 4 out of 25 SNPs were excluded in KCND2: the rs802359 and rs12673992 call rates were lower than 90%; rs2191736 and rs2189977 deviated from HWE in the control group (p < 0.01; Table 2).
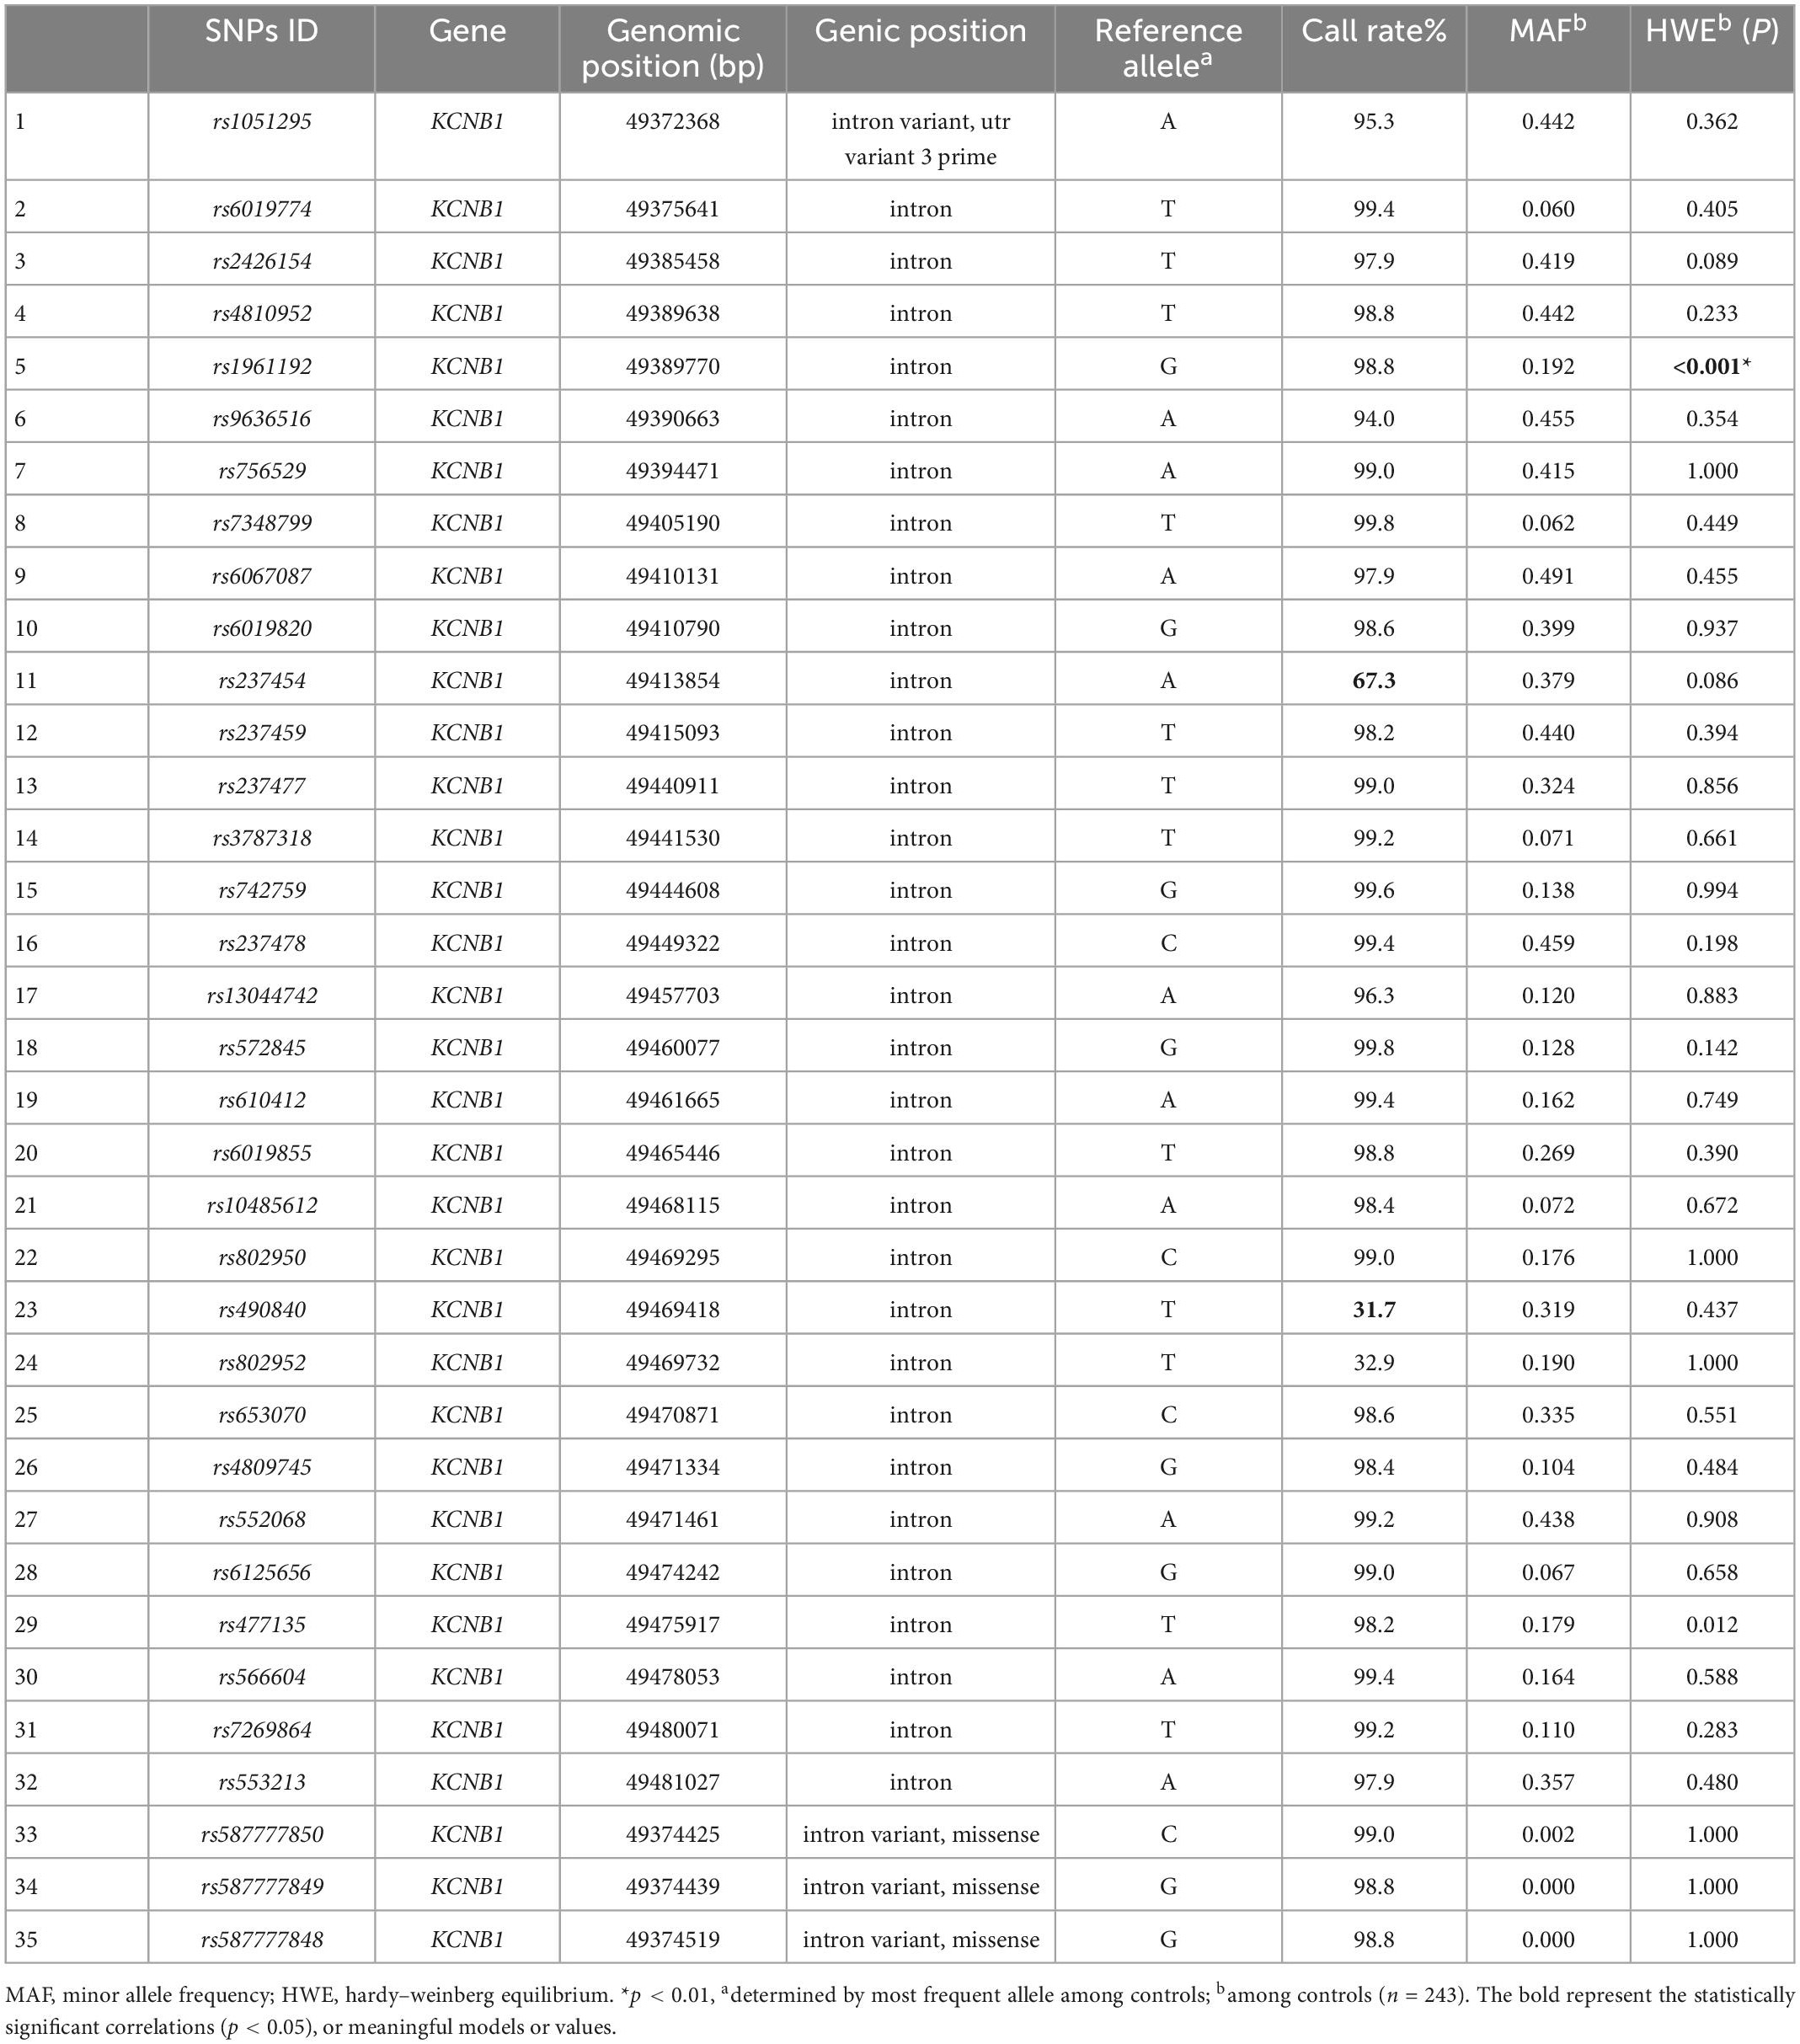
Table 1. Characteristics of KCNB1 single nucleotide polymorphisms (SNPs).
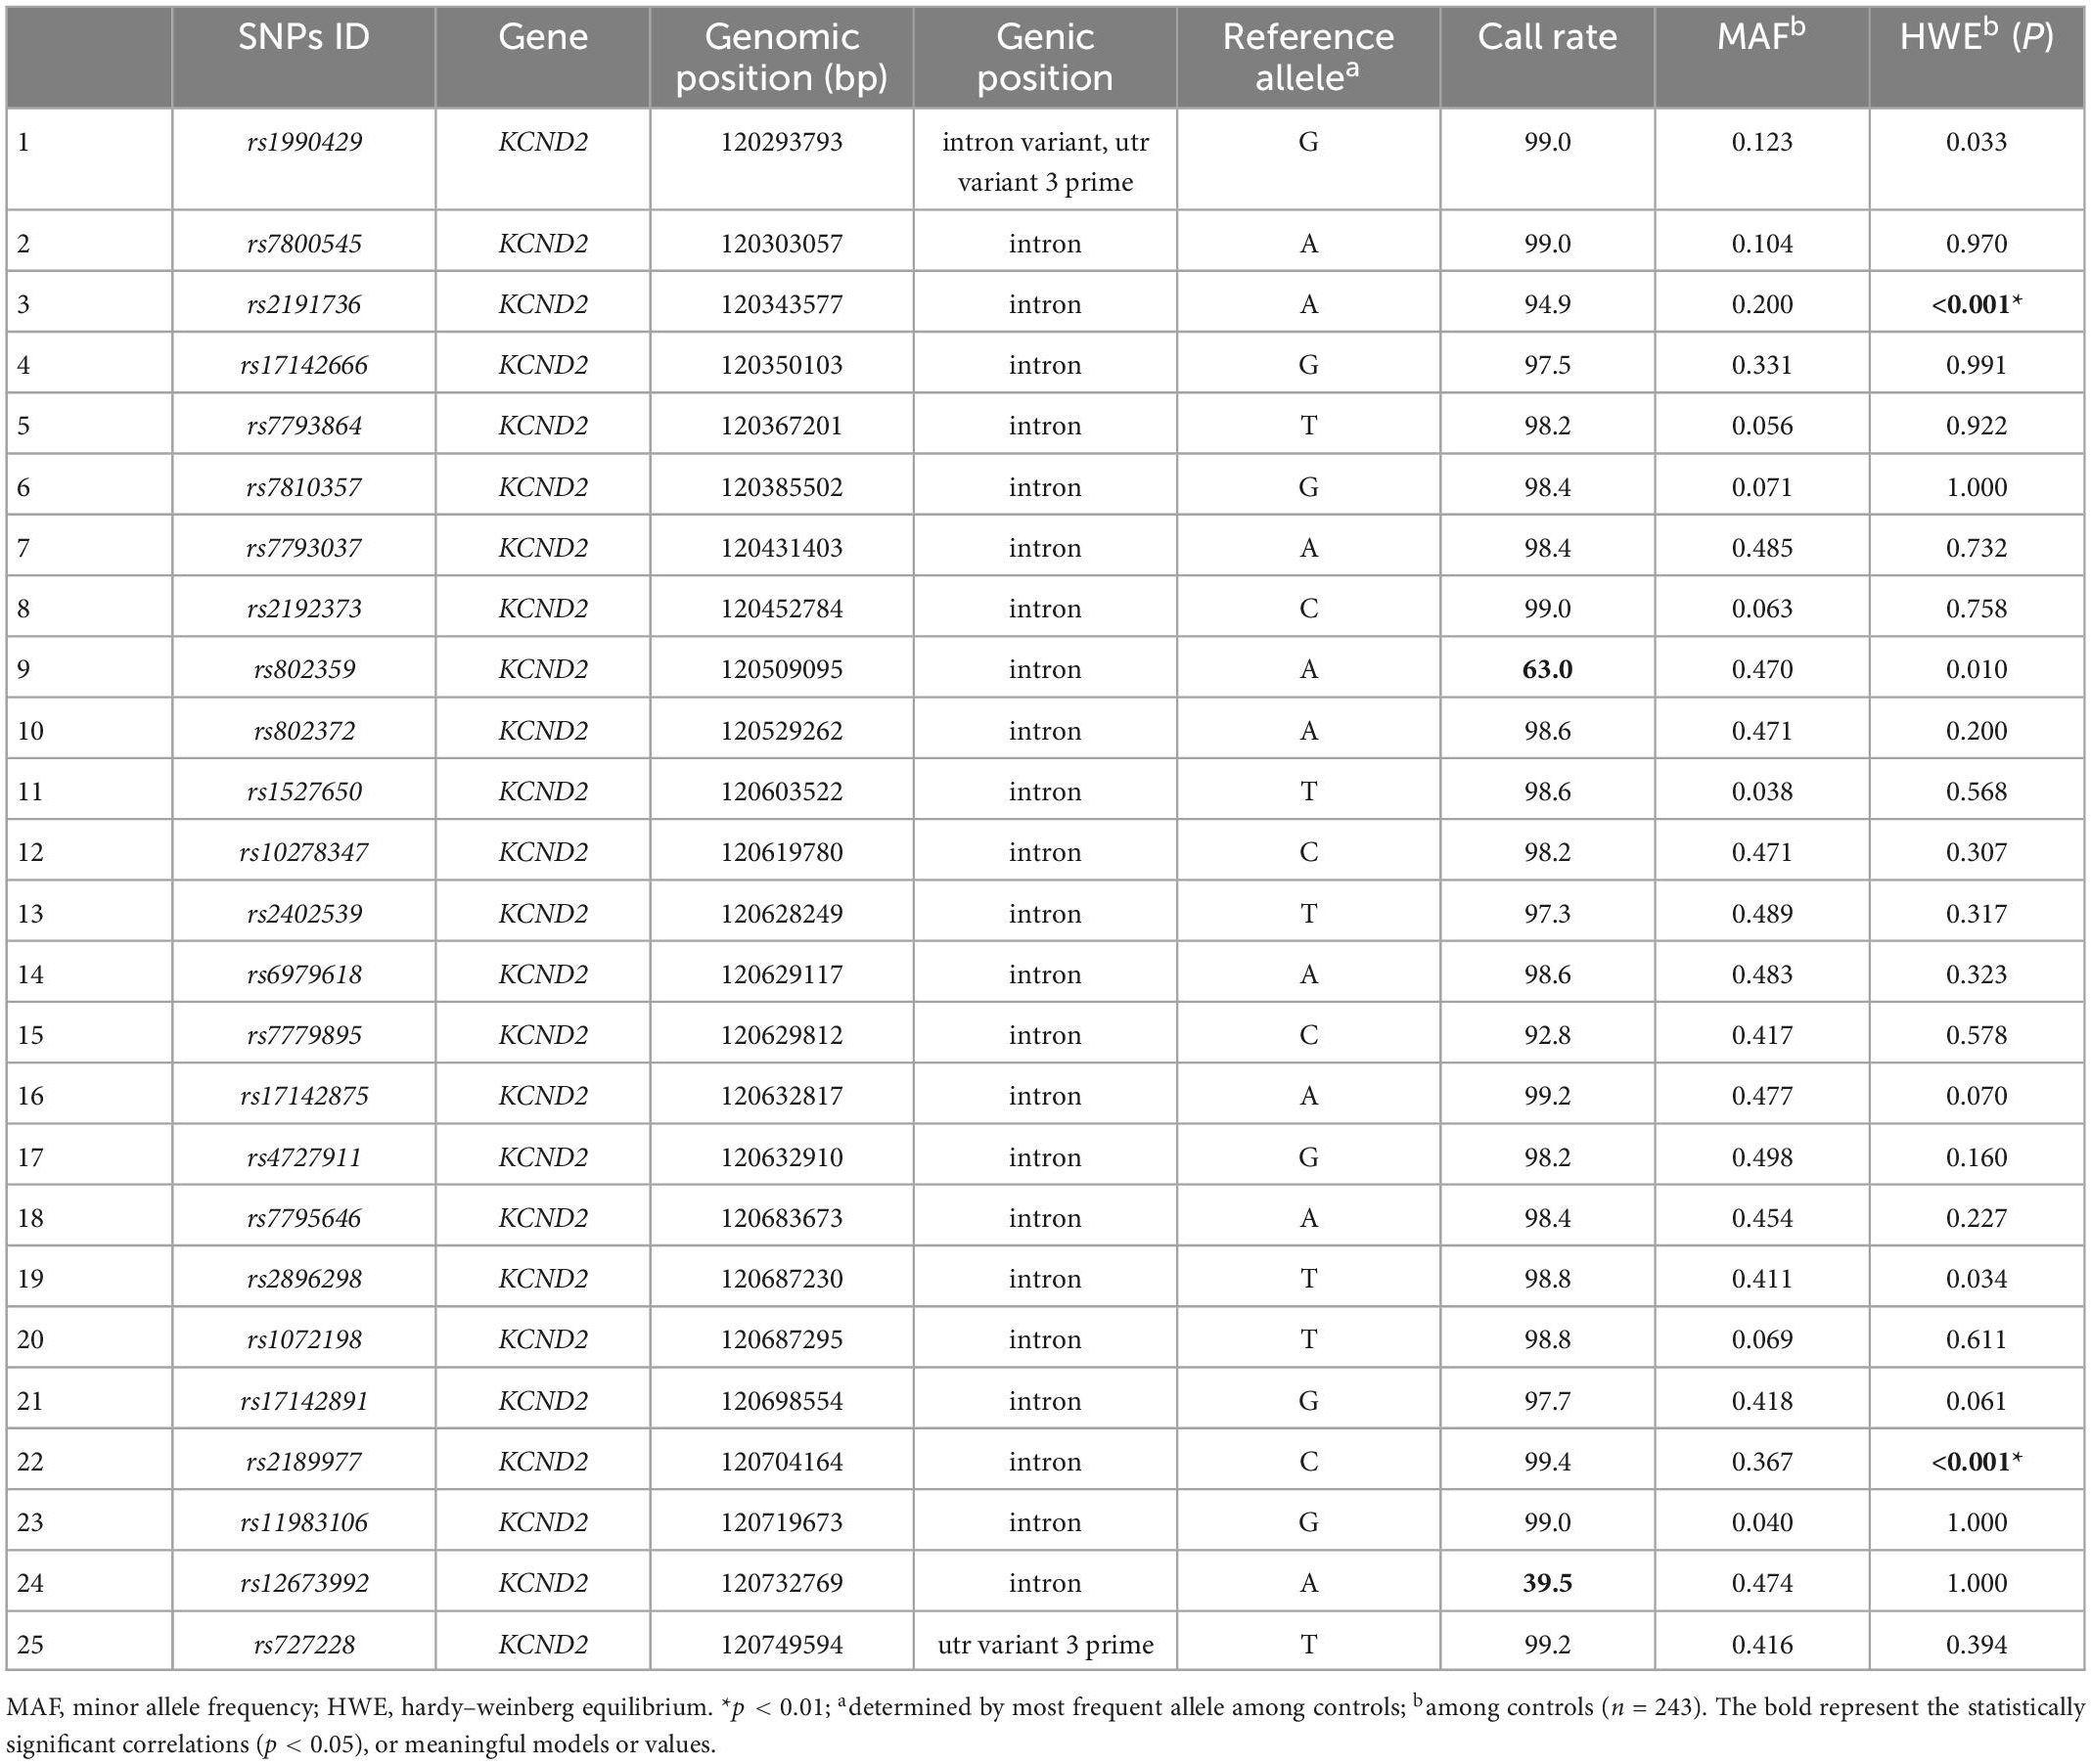
Table 2. Characteristics of KCND2 single nucleotide polymorphisms (SNPs).
Tables 3, 4 show the allele frequency distributions in cases and controls. Allele frequencies for KCNB1 were not significantly different between the two groups. Five tag SNPs showed statistically significant differences in KCND2 after adjusting for age and sex (p < 0.05). The rs1990429 A allele (OR = 0.53, 95% CI = 0.34–0.82, p = 0.004), rs7800545 G allele (OR = 0.53, 95% CI = 0.33–0.85, p = 0.009), rs7793864 A allele (OR = 0.23, 95% CI = 0.10–0.53, p = 0.001), rs7810357 A allele (OR = 0.50, 95% CI = 0.28–0.89, p = 0.019), and rs6979618 G allele (OR = 0.74, 95% CI = 0.58–0.96, p = 0.024) were associated with a lower risk of ASD. Of particular concern, rs1990429 and rs7793864 remained positive after Bonferroni correction (pBonferroni < 0.005).
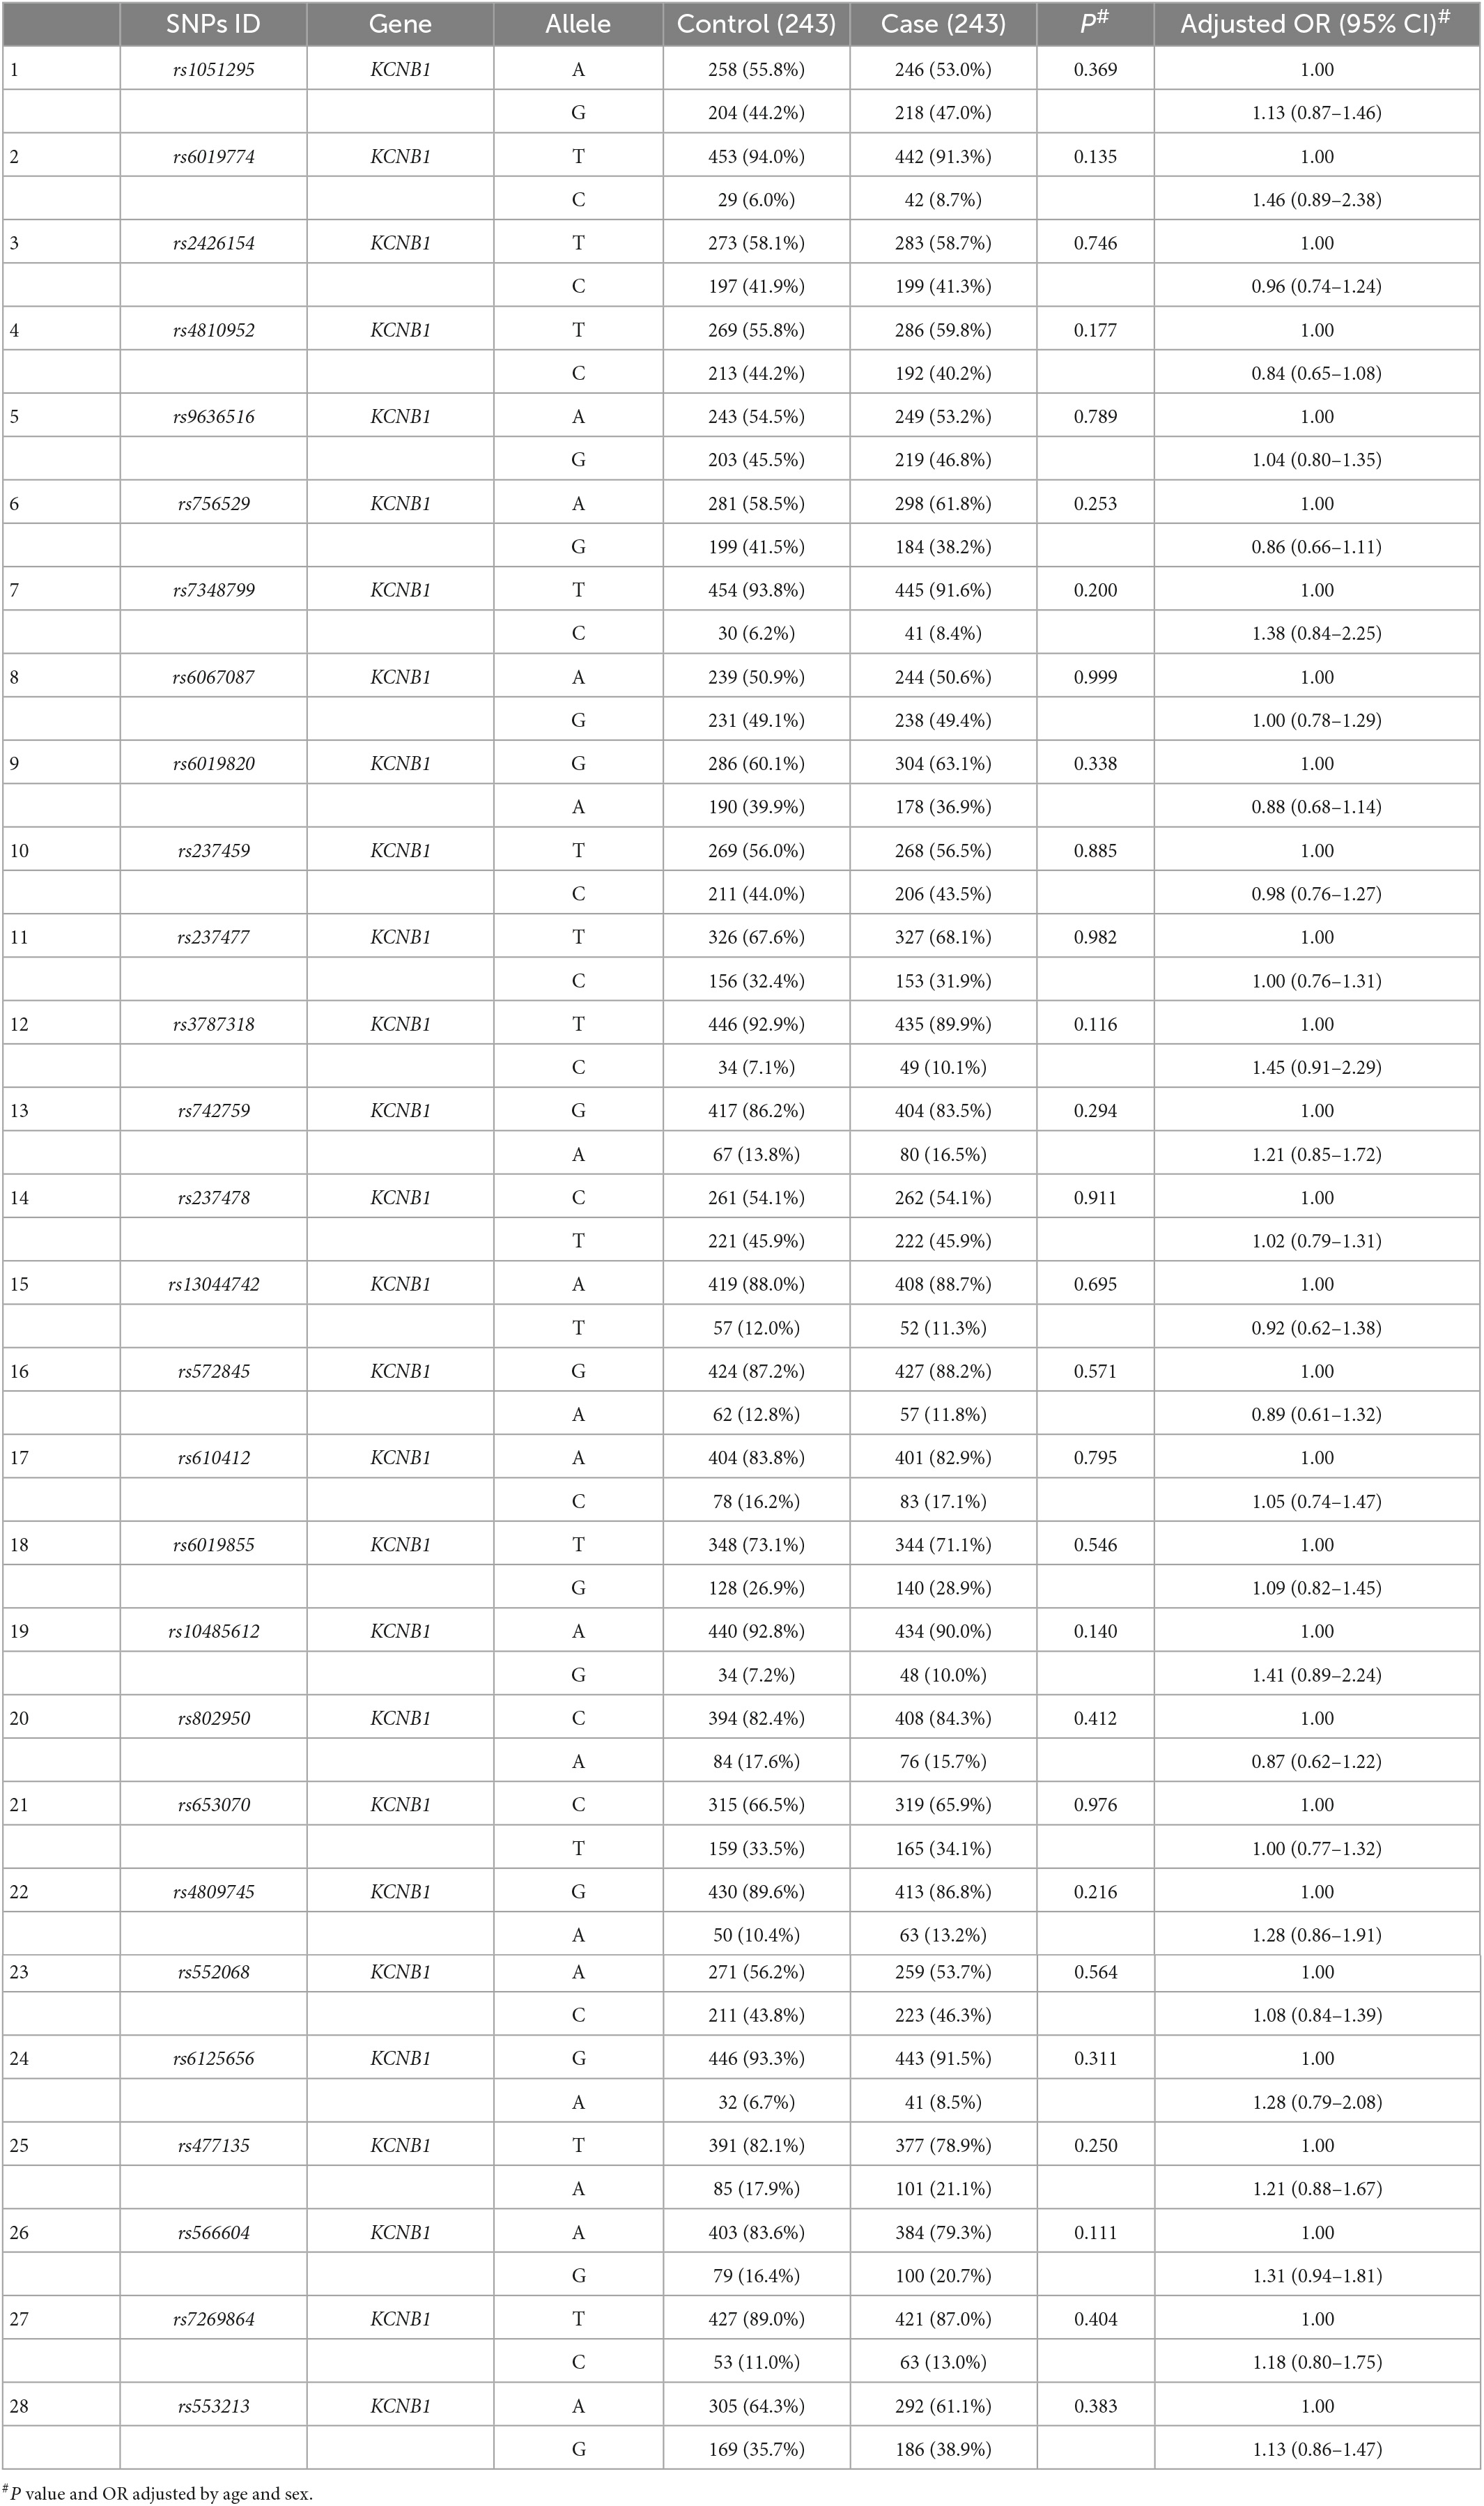
Table 3. Distribution of allele frequencies of KCNB1 single nucleotide polymorphisms (SNPs) in cases and controls (n, %).
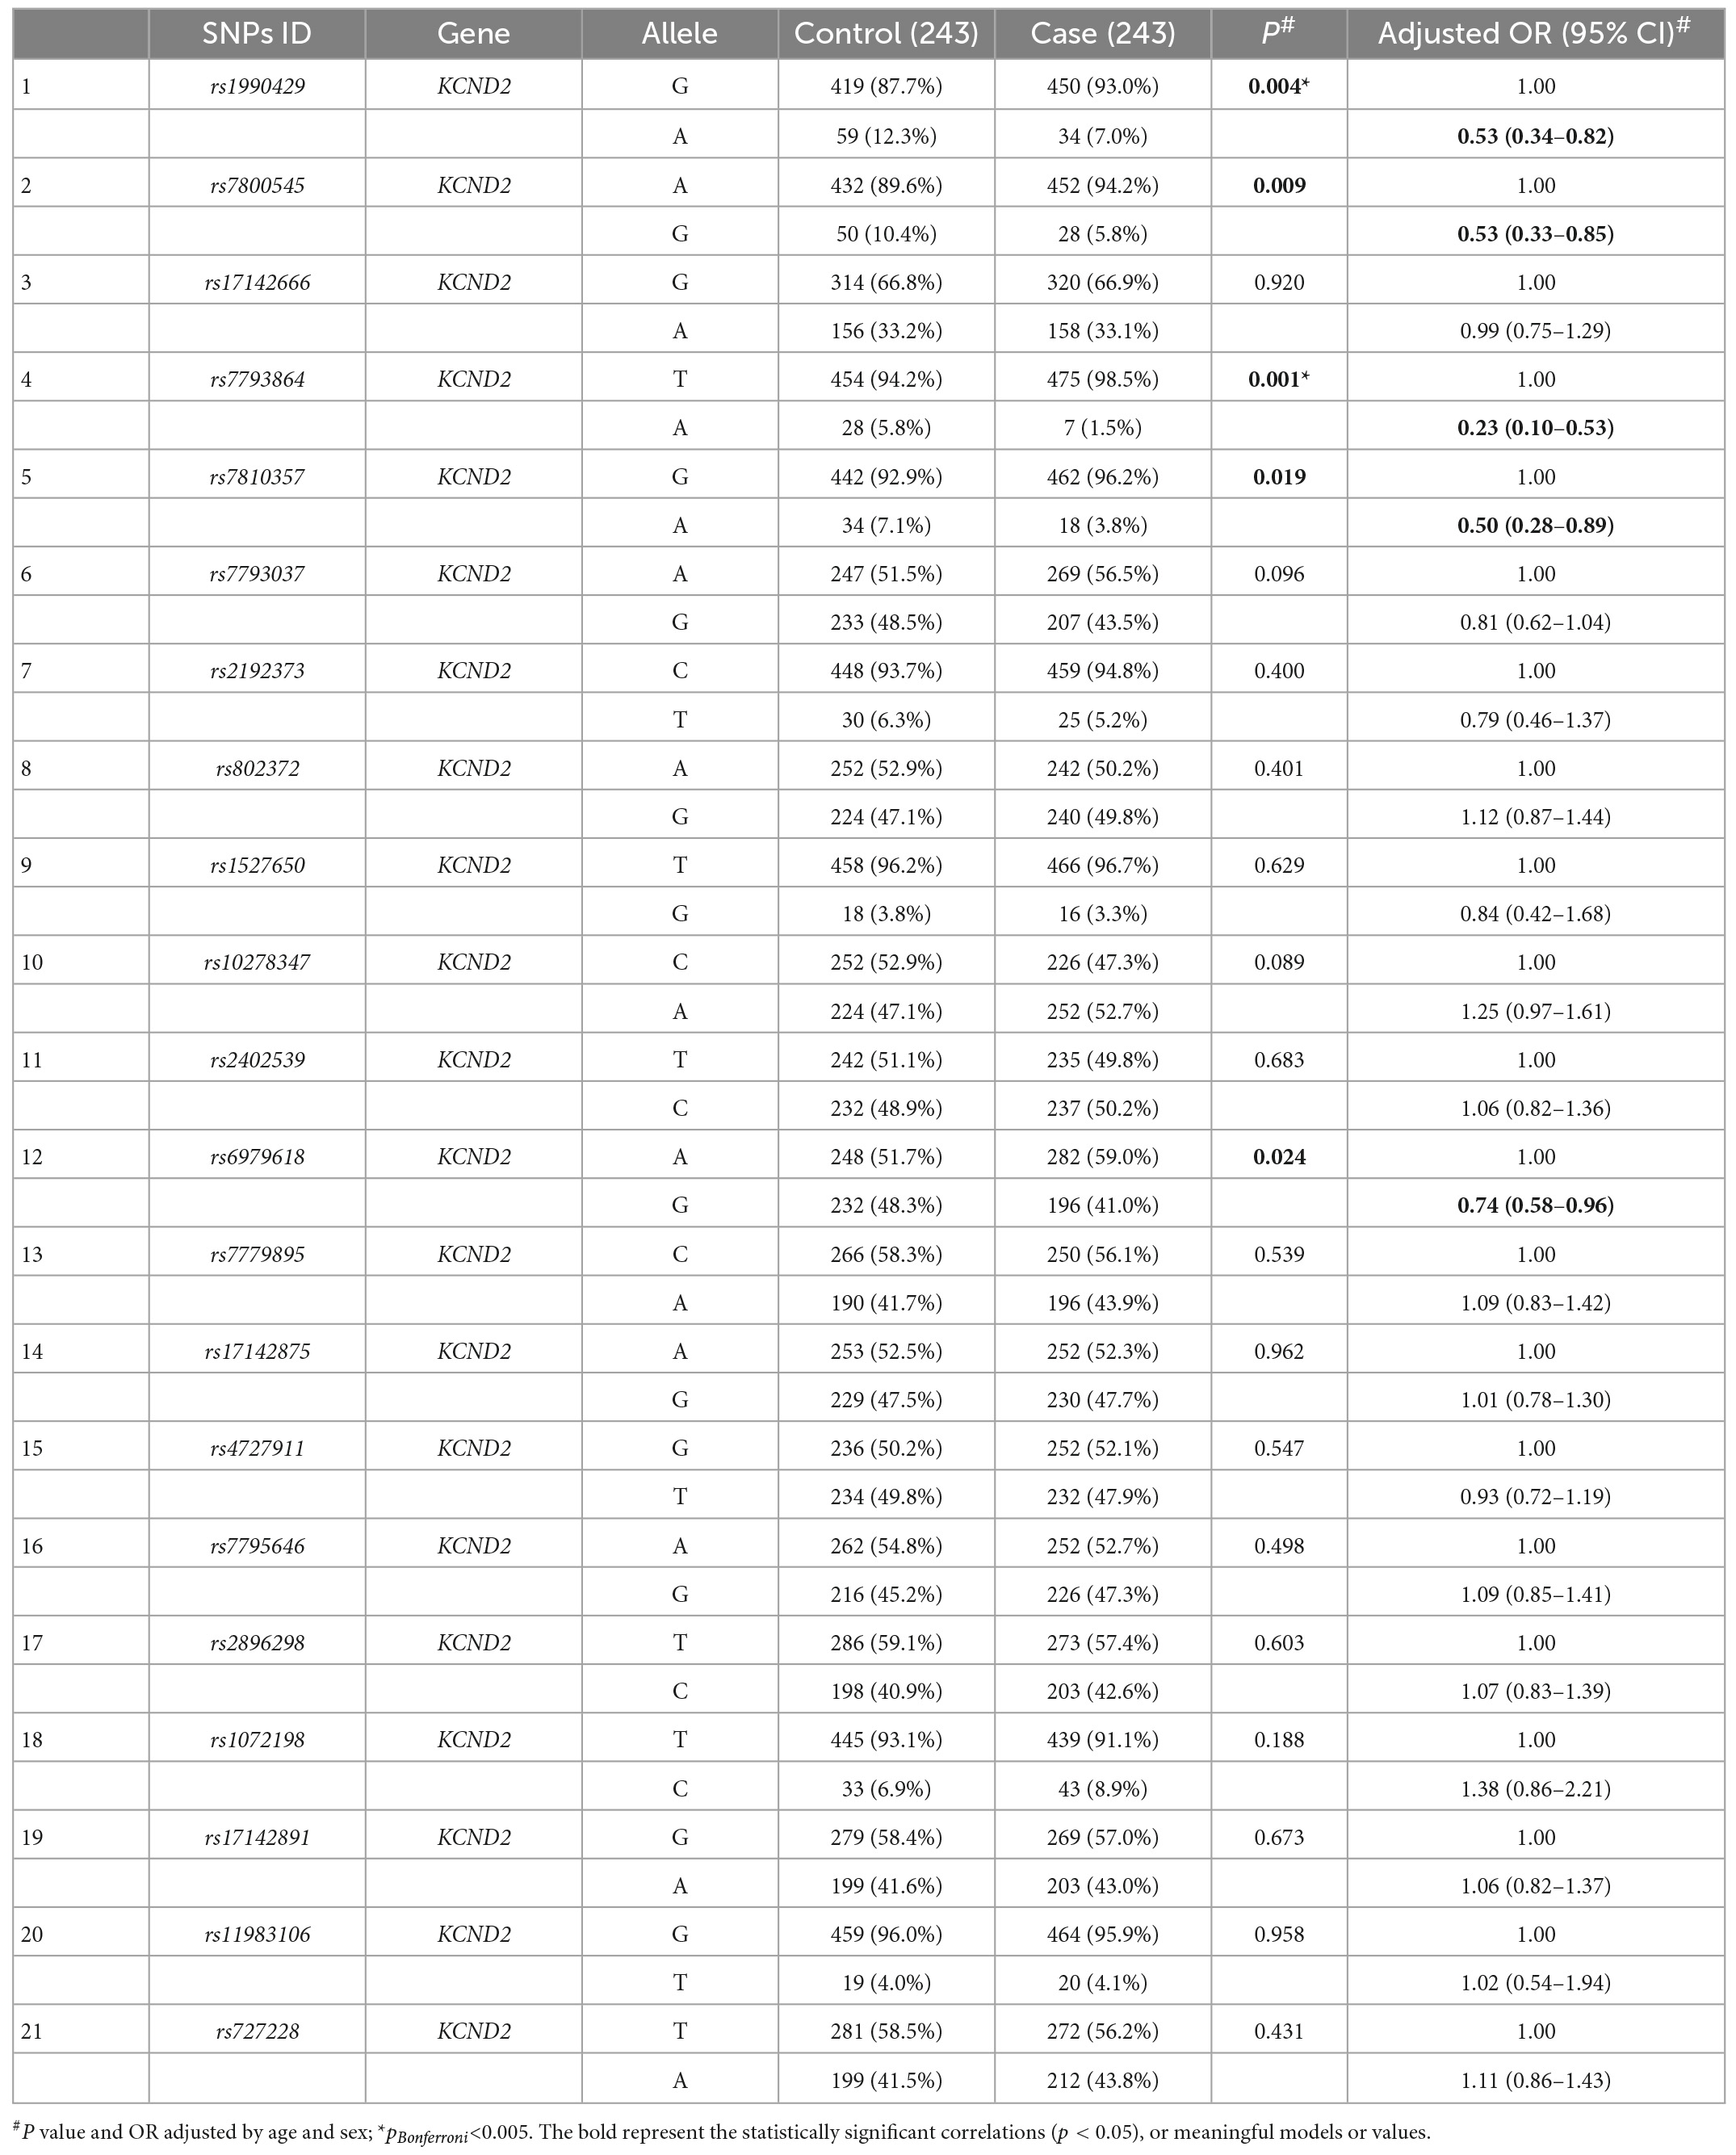
Table 4. Distribution of allele frequencies of KCND2 single nucleotide polymorphisms (SNPs) in cases and controls (n, %).
Further, we conducted analyses examining whether ASD risk differed according to SNPs in five genetic inheritance models. As shown in Table 5, the genotype frequency of rs477135 in KCNB1 differed significantly between case and control groups (p < 0.05), but it was statistically insignificant after being adjusted by FDR-based correction. In KCND2, there were statistically significant differences in the genotype frequencies of rs1990429, rs7800545, rs7793864, rs7810357, and rs6979618 between the two groups (p < 0.05). Notably, after the p-values were adjusted by FDR-based correction, rs7800545 (OR = 0.49, 95% CI = 0.29–0.83, pFDR = 0.045) in the dominant model and rs1990429 (OR = 0.36, 95% CI = 0.22–0.60, pFDR < 0.001) and rs7793864 (OR = 0.15, 95% CI = 0.06–0.41, pFDR < 0.001) in the over-dominant model were associated with a reduced risk of ASD (for further details see Supplementary Tables 6, 7).
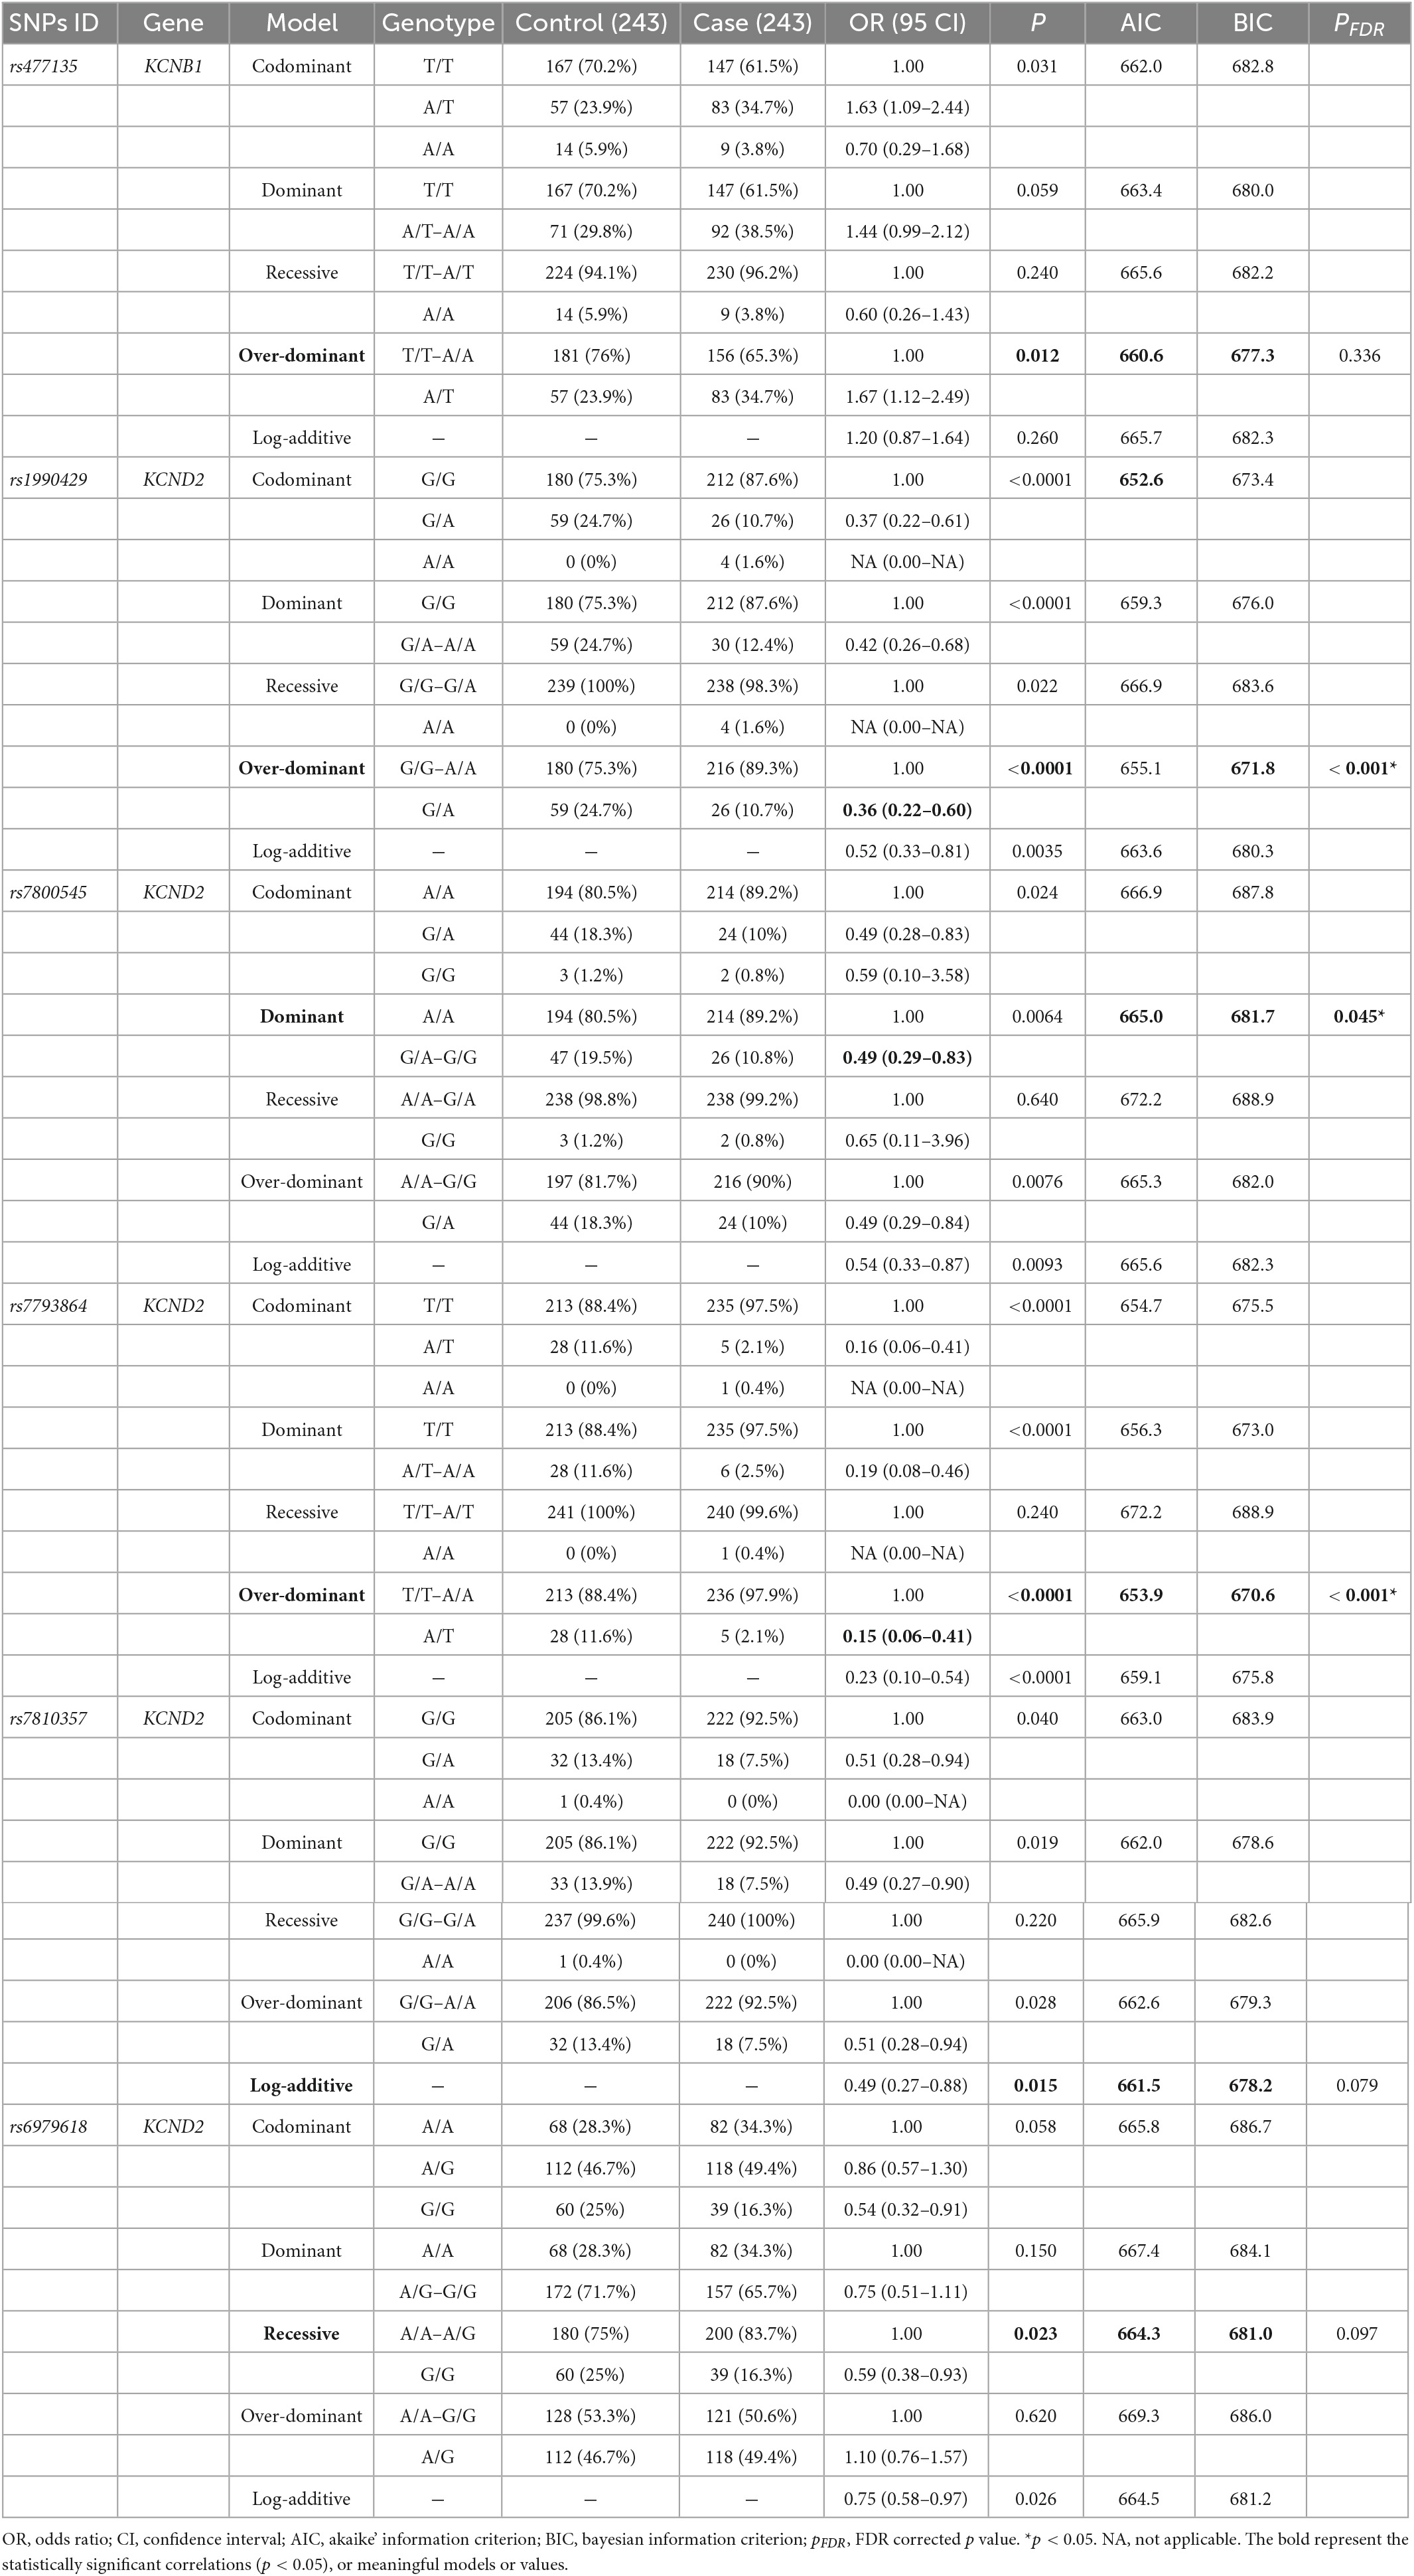
Table 5. KCNB1 and KCND2 single nucleotide polymorphisms (SNPs) in different genetic models associated with autism spectrum disorder (ASD) risk.
3.3. Haplotype analysis
The LD analysis revealed that among 28 tag SNPs in the KCNB1 gene, 20 SNPs were in high LD (r2 ≥ 0.8) and were arranged in seven haplotype blocks with frequencies > 5%. Further details for all blocks are shown in Figure 1A. There were no significant differences in the haplotype frequencies between patients and controls (see Table 6).
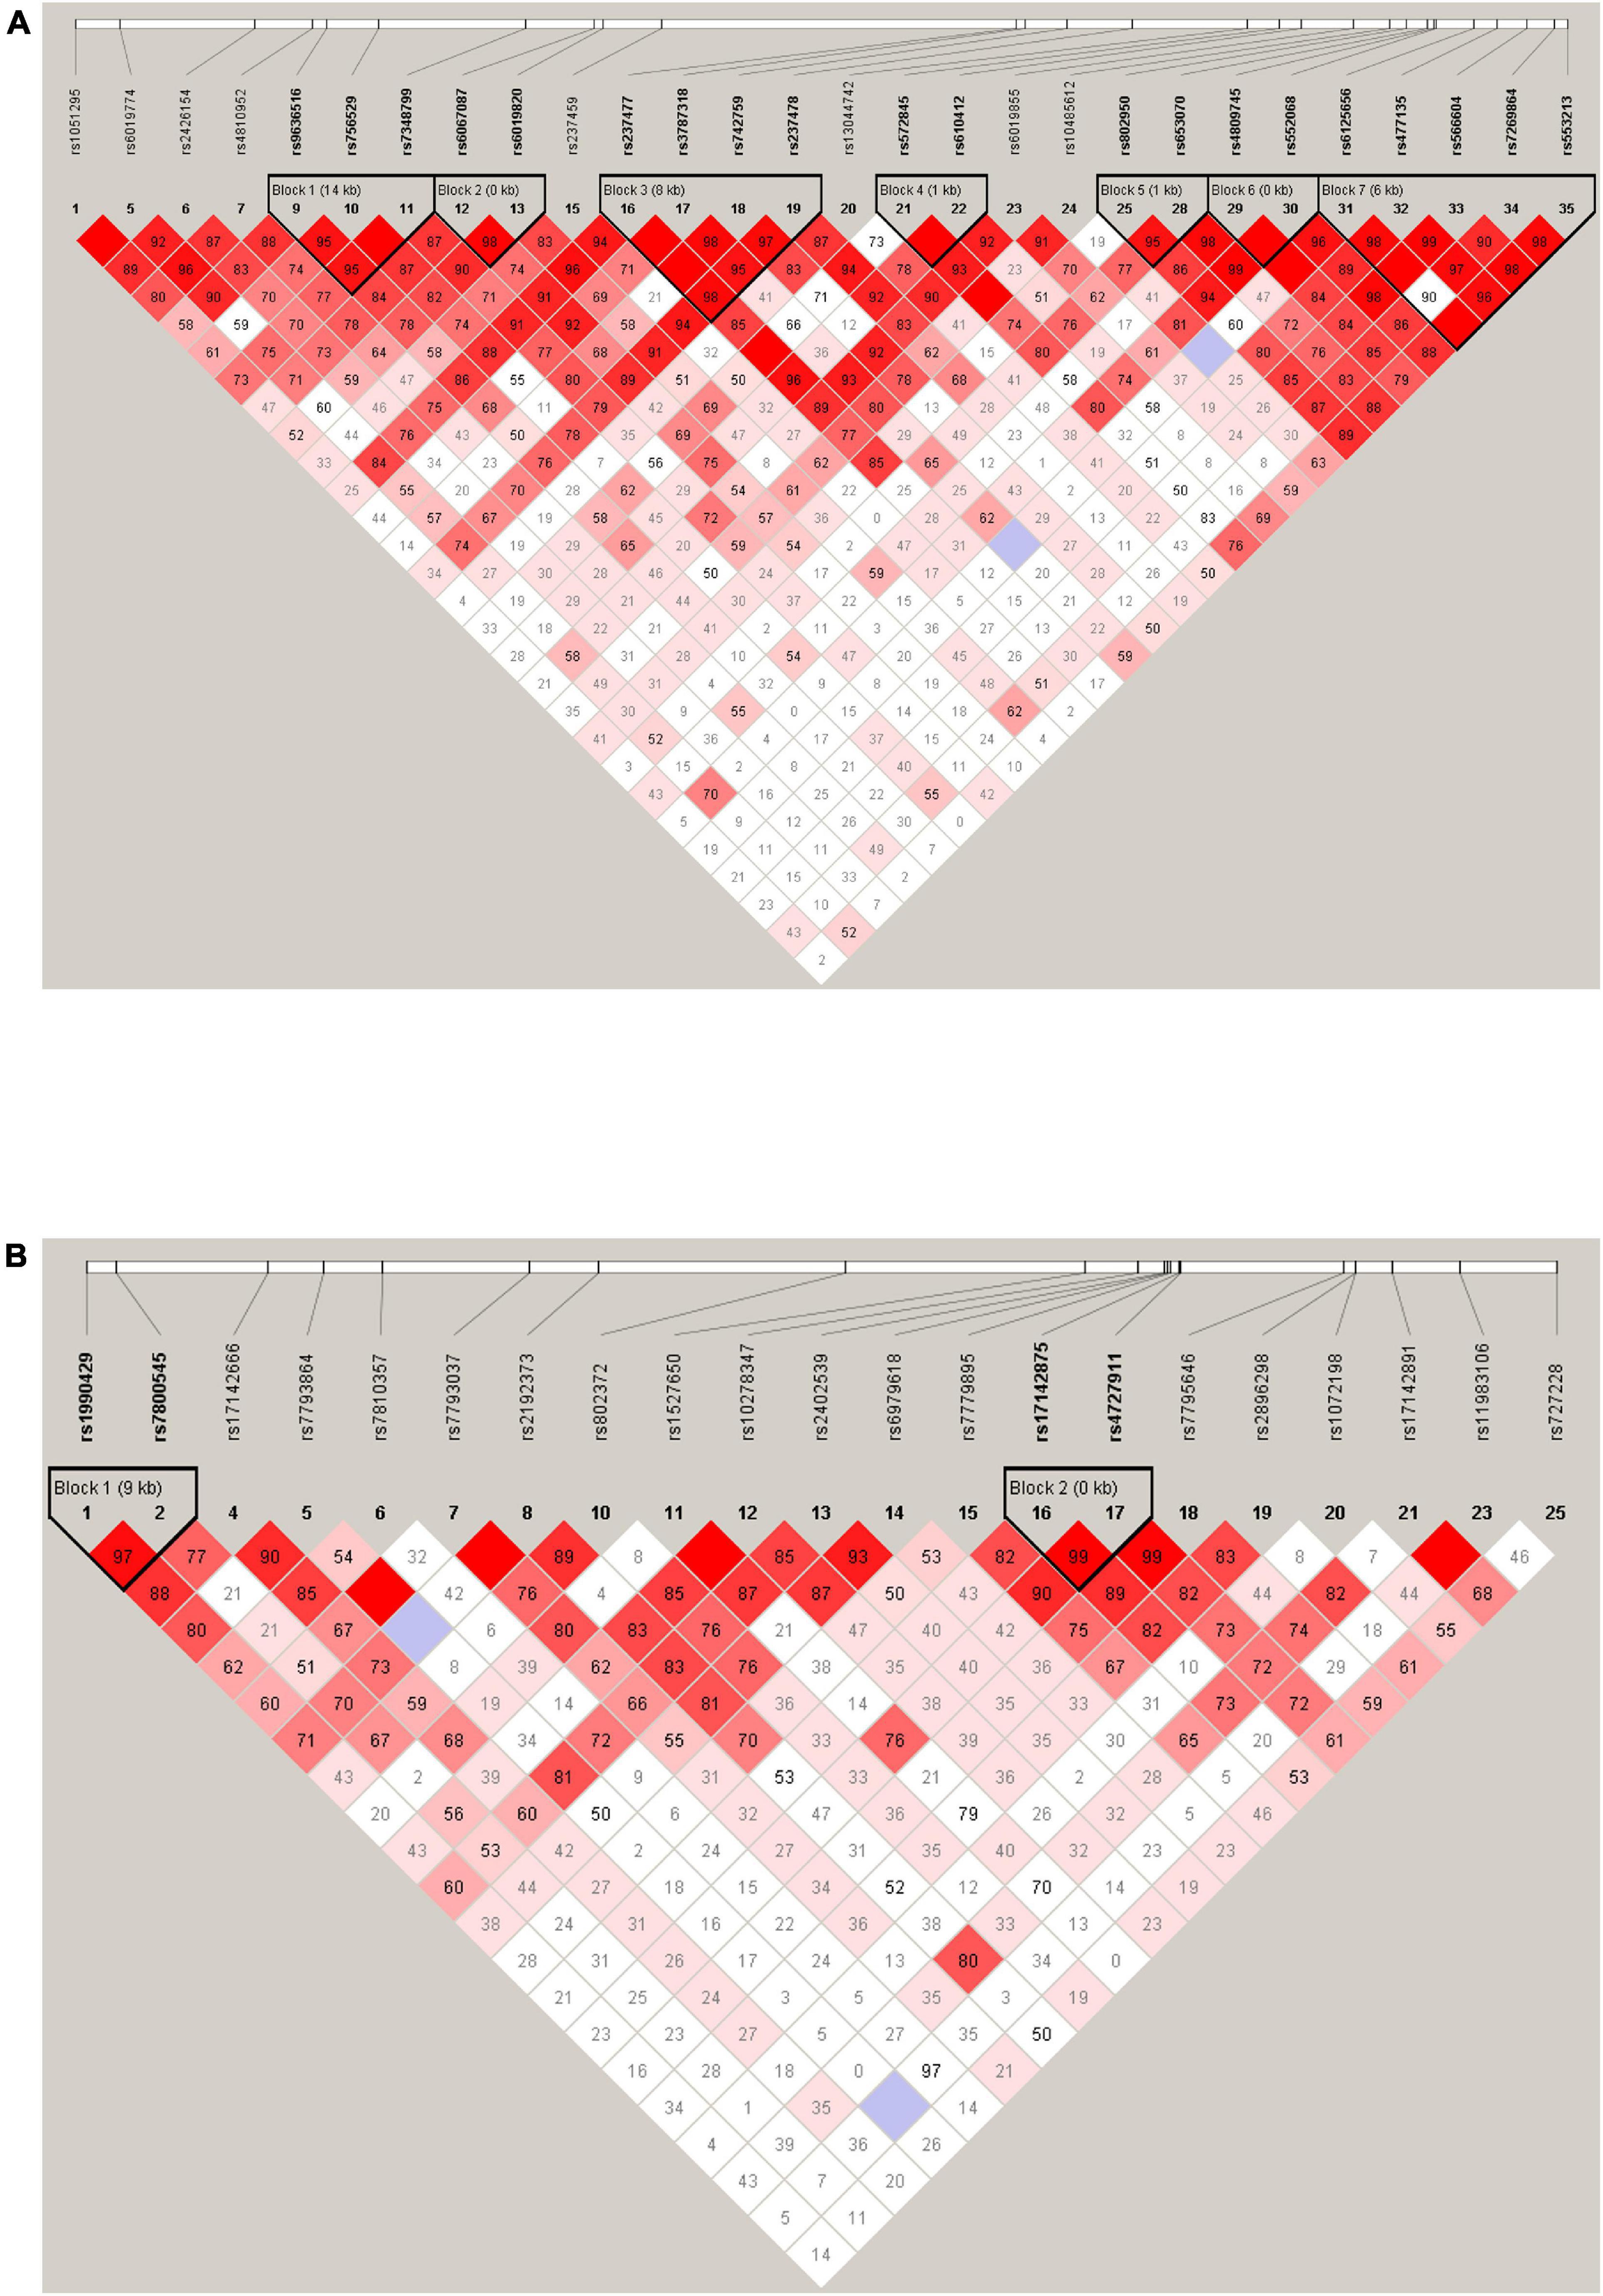
Figure 1. Haplotype block map for 28 tag SNPs of the KCNB1 gene (A). Haplotype block map for 21 tag SNPs of the KCND2 gene (B). Numbers in squares indicate D’ values.
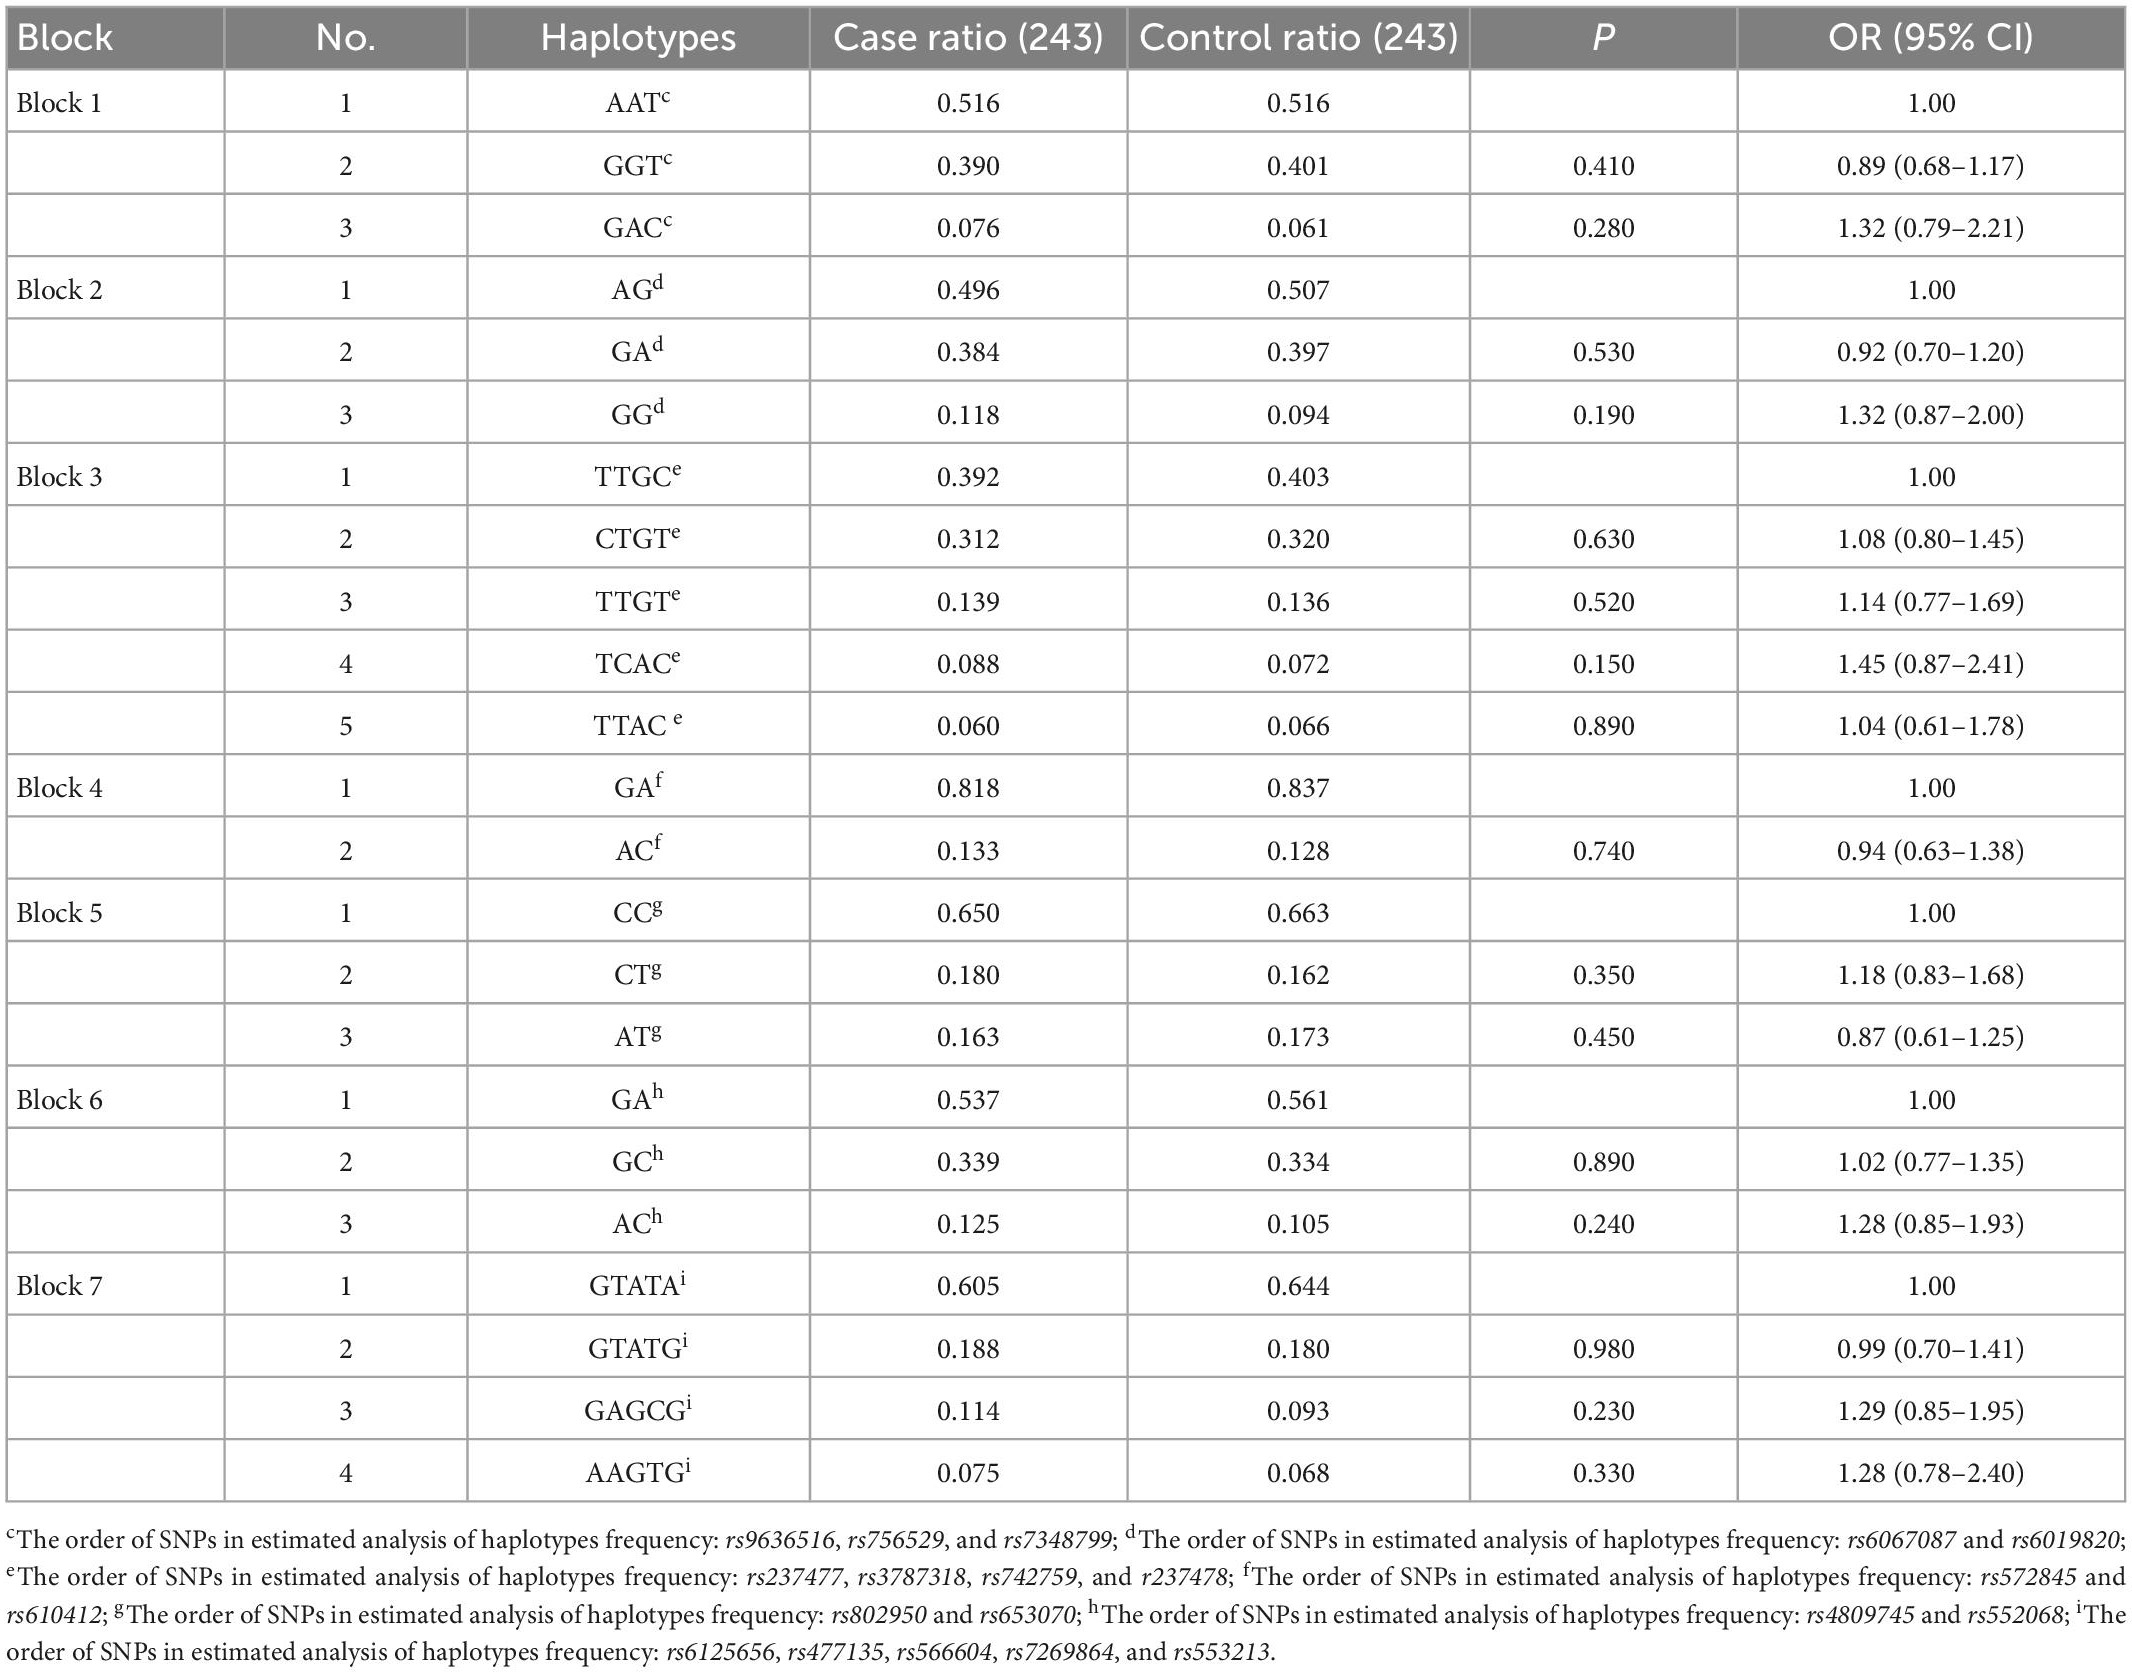
Table 6. Distribution of KCNB1 haplotypes in cases and controls adjusted by age and sex (frequency more than 5).
There were four tag SNPs in high LD (r2 ≥ 0.8) arranged in two haplotype blocks with frequencies > 5% among 21 studied SNPs in the KCND2 gene. Haplotype blocks were constructed by rs1990429/rs7800545 and rs17142875/rs4727911 (shown in Figure 1B). We found that the rs1990429 A–rs7800545 G haplotype carried a lower risk of ASD in Block 1. However, this was no longer statistically significant after Bonferroni correction. There were no statistically meaningful differences between the two groups in Block 2 (see Table 7).

Table 7. Distribution of KCND2 haplotypes in cases and controls adjusted by age and sex (frequency more than 5).
3.4. Association between genotype and phenotype in ASD
According to the above positive results, we selected three SNPs (rs1990429, rs7800545, and rs7793864) under the optimal genetic model, to evaluate the correlations between KCND2 genotype and ASD symptom severity, including the ADI–R and ADOS domains. The analysis of variance revealed that the scores on the ADOS did not significantly differ between the two groups. The results showed that the G/A genotype of rs1990429 in the over-dominant model and the G/A–G/G genotype of rs7800545 in the dominant model had lower scores for the ADI–R RRB domain after adjusting for age, sex, and IQ (p = 0.001). However, no significant associations were observed for rs7793864 in the over-dominant model (shown in Tables 8, 9).
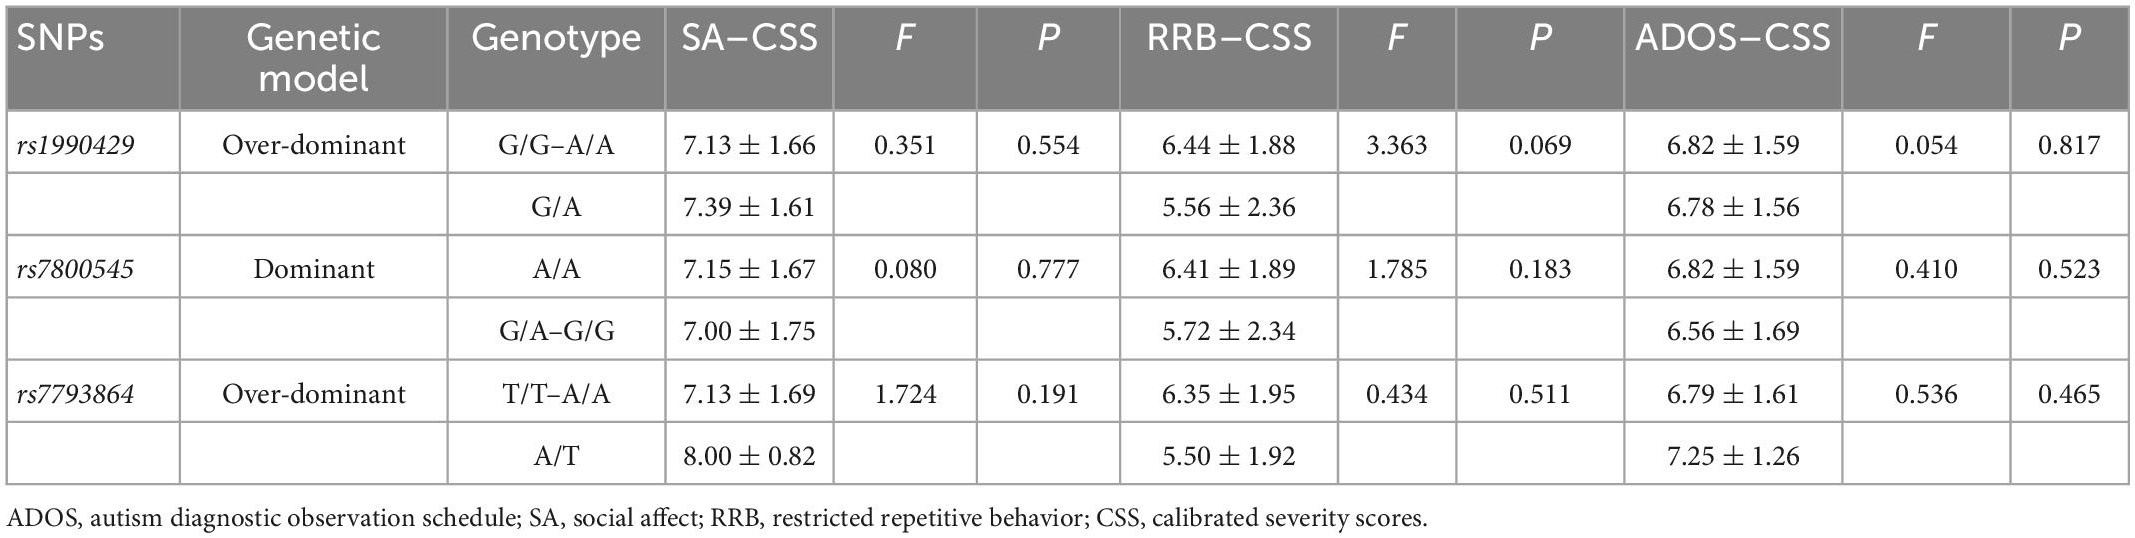
Table 8. The genotype association of KCND2 with ADOS–CSS adjusted by age, sex, and IQ.

Table 9. The genotype association of KCND2 with ADI–R adjusted by age, sex, and IQ.
4. Discussion
In this case-control study, we aimed to assess the linkage of polymorphisms of the KCNB1 and KCND2 genes (including tag SNPs and pathogenic SNPs) with the risk of ASD using allele frequencies, genotype frequencies, and haplotype analyses. We also explored the potential relationship between genetic polymorphism and ASD symptom severity. This study found that KCND2 rs1990429, rs7800545, and rs7793864 were associated with ASD risk, of which rs1990429 and rs7800545 were highly correlated with repetitive stereotyped behavior in ASD.
Our study did not find KCNB1 to be associated with ASD risk. Previous research has found that the V378A variant in KCNB1 influenced the expression and localization of Kv2.1 protein, thereby perturbing the voltage-activated current, the ionic selectivity, and the ability of the channel to repolarize (19). There was evidence that mutated KCNB1 caused “autism-like” features, including repetitive behaviors and impulsivity, and seizure susceptibility, by affecting the highly conserved structural function of Kv2.1 (20). Individuals with KCNB1 pathogenic variants (such as p.Glu43Gly, p.Arg312His, and p.Trp369Arg) were at high risk of ASD and exhibited impaired communication and socialization (21). In particular, the missense variants in KCNB1, including rs587777848 (S347R), rs587777849 (T374I), and rs587777850 (G379R), have been shown to be related to language and motor delays (similar to autistic behaviors). These three missense variants were located in the functionally important pore domain of the Kv2.1 protein and produced a loss-of-function effect, resulting in altered ion selectivity and reduced current density at depolarized voltages (18). Regrettably, we did not find that rs587777848, rs587777849, and rs587777850 were polymorphic loci or find any significant associations between mutations in KCNB1 and ASD in the Chinese Han population. There are several possible explanations for the apparent differences between our findings and prior studies. ASD is a disorder of great genetic complexity and heterogeneity, making it difficult to delineate the contribution of any single gene to the risk of this disease, where a single candidate gene might be accountable for various disease phenotypes. In addition, differences in the characteristics of participants may be the main reason for the different results. In previous research, patients had comorbid epilepsy, intellectual disability, or developmental delay, while our patients were confined to those with single-incidence ASD among the Chinese Han population. This implies that mutation in KCNB1 may be an etiological factor shared by epilepsy, intellectual disability, and ASD, rather than the specific pathogenic factor in ASD.
KCND2 is located on chromosome 7 (7q31.31). A clinical case report confirmed that genomic copy number loss in this region mediated the core clinical features of ASD, such as stereotypic movements, impairment of social interaction, and poor social skills (22, 23). This means that KCND2 is located on the most significant susceptibility locus in autism. A study has shown that Kv4.2 protein expression was downregulated in the hippocampal of Fmr1 knockout mice (a common model of ASD), resulting in excess neuronal excitability (24). KCND2 knockout mice exhibited delayed synaptic maturation and hippocampal-dependent learning and memory deficits, which suggested a critical role of Kv4.2 in cognition (25, 26). In addition, Mikhailov et al. (27) identified three substituted KCND2 variants (N544S, F538S, and R539L) in patients with ASD, which interfered with the expression of Kv4.2 protein. Recent research has also indicated that KCND2 rs10239799 allele C, which was positively selected as an ASD risk allele, was essential in impacting higher-order brain functions such as cognition, behavior, and memory (28). Lee et al. (29) found that the deleterious de novo variant V404M in KCND2 impaired potassium channel inactivation in monozygotic twins with ASD and epilepsy. In vitro studies found that the substitution variant of V404M is located in S6 transmembrane segment, which surrounds the central ion conduction pathway mediating closed state inactivation (30). In the Kv4.2 channel with V404M mutant, the inactivation is enhanced directly from preopen closed states, while the pore closure rate is dramatically slowed when the channel opens compared to Kv4.2 WT (12, 31). However, the pathogenic mutations in KCND2 (N544S, F538S, R539L, and V404M), which have been confirmed to be present in ASD in previous studies, were neither found in the dbSNP database nor detected by MassArray sequencing in this study. Overall, we and others have reported similar findings that KCND2 was crucial for the occurrence of ASD. This is the first time that we found the G/A genotype of rs1990429, G/A–G/G genotype of rs7800545, and A/T genotype of rs7793864 reduced the risk of ASD. To date, there are lack of studies related to biological functionality of these three gene loci. Further research will be required to explore the effects of rs1990429, rs7800545, and rs7793864 in KCND2 on Kv4.2 channel expression and function, and their impact on ASD at the cellular levels and animal models.
To improve the detection capability, haplotype analyses were conducted to estimate the combined influence of genetic variants on ASD risk. Regrettably, although we derived 7 haplotype blocks across 28 SNPs in KCNB1, they did not play a role in ASD. Of the two haplotype blocks detected in KCND2, the AG (rs1990429–rs7800545) was a protective factor for ASD, while this statistical difference disappeared after correction for multiple comparisons. In addition, we used ADOS and ADI–R to evaluate the core symptoms of ASD. We found that patients with the G/A genotype of rs1990429 and the G/A–G/G genotype of rs7800545 had lower severity of stereotyped behaviors. Connolly et al. (32) pointed out that KCND2 was significantly associated with overly serious facial expressions in patients with ASD, which is part of the communication subscale of the Social Responsiveness Scale. However, there is evidence to confirm that reduced Kv4.2 expression altered dendritic spine morphology and density, but did not induce perseverative or repetitive behavior in mice (33). In general, there is a lack of consistent association between KCND2 and ASD phenotype.
This study has several limitations that may influence the interpretation of the study results. First, the best model was selected based on the smallest AIC and BIC, which were estimated by maximum likelihood estimation. Given the principle of parsimony, this approach increases the risk of Type I errors. Moreover, this strategy yielded a specific but not very sensitive rule for model selection. Thus, it is necessary to explore the relationship between the risk genotype and the incidence of ASD in multiple models. Second, the results might be influenced by other confounding factors, such as early exposure factors, physical and chemical factors, and nutritional imbalance. Third, our study focused on the Chinese Han population, so further research should include a multi-ethnic population. Finally, studies of the altered function of mutated genes should be validated in animal models.
5. Conclusion
Given its role in synaptic function and plasticity, we examined the role of Kv channels in the ASD risk. Our results support KCND2 as a susceptibility gene for ASD and illustrate that three SNPs (rs1990429, rs7800545, and rs7793864) in the KCND2 gene reduce the risk of developing ASD, among which rs1990429 and rs7800545 alleviate the severity of RRB. These findings will provide important insights into ASD etiopathogenesis and genetic etiology.
Data availability statement
The datasets presented in this study can be found in dbSNP 156 database with ID 1063426 (https://www.ncbi.nlm.nih.gov/SNP/snp_viewBatch.cgi?sbid=1063426).
Ethics statement
The studies involving human participants were reviewed and approved by the Institutional Review Board of Harbin Medical University for Medical Sciences. Written informed consent to participate in this study was provided by the participants’ legal guardian/next of kin.
Author contributions
MZ provided financial support for the conduct of the research and preparation of the manuscript. MZ and CS designed the study. WX, PG, and FW performed the clinical assessment and experiments. ZL and XY collected the data. MZ and YC analyzed the data. ZL wrote the manuscript. All authors read, revised, and approved the final manuscript.
Funding
This work was supported by Post-doctoral Scientific Research Development Fund of Heilongjiang Province (Grant Number LBH–Z18216).
Acknowledgments
We deeply thank all patients and their parents for their support in this work.
Conflict of interest
The authors declare that the research was conducted in the absence of any commercial or financial relationships that could be construed as a potential conflict of interest.
Publisher’s note
All claims expressed in this article are solely those of the authors and do not necessarily represent those of their affiliated organizations, or those of the publisher, the editors and the reviewers. Any product that may be evaluated in this article, or claim that may be made by its manufacturer, is not guaranteed or endorsed by the publisher.
Supplementary material
The Supplementary Material for this article can be found online at: https://www.frontiersin.org/articles/10.3389/fpsyt.2022.994166/full#supplementary-material
Footnotes
References
1. Maenner MJ, Shaw KA, Bakian AV, Bilder DA, Durkin MS, Esler A, et al. Prevalence and characteristics of autism spectrum disorder among children aged 8 years – autism and developmental disabilities monitoring network, 11 sites, united states, 2018. MMWR Surveill Summ. (2021) 70:1–16. doi: 10.15585/mmwr.ss7011a1
2. Zhou H, Xu X, Yan W, Zou X, Wu L, Luo X, et al. Prevalence of autism spectrum disorder in china: a nationwide multi-center population-based study among children aged 6 to 12 years. Neurosci Bull. (2020) 36:961–71. doi: 10.1007/s12264-020-00530-6
3. Sandin S, Lichtenstein P, Kuja-Halkola R, Hultman C, Larsson H, Reichenberg A. The heritability of autism spectrum disorder. Jama. (2017) 318:1182–4. doi: 10.1001/jama.2017.12141
4. Huang Y, Zhao Y, Ren Y, Yi Y, Li X, Gao Z, et al. Identifying genomic variations in monozygotic twins discordant for autism spectrum disorder using whole-genome sequencing. Mol Ther Nucleic Acids. (2019) 14:204–11. doi: 10.1016/j.omtn.2018.11.015
5. Cheng P, Qiu Z, Du Y. Potassium channels and autism spectrum disorder: an overview. Int J Dev Neurosci. (2021) 81:479–91. doi: 10.1002/jdn.10123
6. Wang J, Feng S, Li M, Liu Y, Yan J, Tang Y, et al. Increased expression of Kv10.2 in the hippocampus attenuates valproic acid-induced autism-like behaviors in rats. Neurochem Res. (2019) 44:2796–808. doi: 10.1007/s11064-019-02903-4
7. Bee S, Ringland A, Coutellier L. Social impairments in mice lacking the voltage-gated potassium channel Kv3.1. Behav Brain Res. (2021) 413:113468. doi: 10.1016/j.bbr.2021.113468
8. Gamal El-Din TM, Lantin T, Tschumi CW, Juarez B, Quinlan M, Hayano JH, et al. Autism-associated mutations in Kv7 channels induce gating pore current. Proc Natl Acad Sci USA. (2021) 118:105092. doi: 10.1073/pnas.2112666118
9. Speca DJ, Ogata G, Mandikian D, Bishop HI, Wiler SW, Eum K, et al. Deletion of the Kv2.1 delayed rectifier potassium channel leads to neuronal and behavioral hyperexcitability. Genes Brain Behav. (2014) 13:394–408. doi: 10.1111/gbb.12120
10. Lee HY, Ge WP, Huang W, He Y, Wang GX, Rowson-Baldwin A, et al. Bidirectional regulation of dendritic voltage-gated potassium channels by the fragile X mental retardation protein. Neuron. (2011) 72:630–42. doi: 10.1016/j.neuron.2011.09.033
11. Kang SK, Vanoye CG, Misra SN, Echevarria DM, Calhoun JD, O’Connor JB, et al. Spectrum of Kv 2.1 dysfunction in Kcnb1-associated neurodevelopmental disorders. Ann Neurol. (2019) 86:899–912. doi: 10.1002/ana.25607
12. Zhang Y, Tachtsidis G, Schob C, Koko M, Hedrich UBS, Lerche H, et al. Kcnd2 variants associated with global developmental delay differentially impair Kv4.2 channel gating. Hum Mol Genet. (2021) 30:2300–14. doi: 10.1093/hmg/ddab192
13. Keller R, Basta R, Salerno L, Elia M. Autism, epilepsy, and synaptopathies: a not rare association. Neurol Sci. (2017) 38:1353–61. doi: 10.1007/s10072-017-2974-x
14. Bar C, Kuchenbuch M, Barcia G, Schneider A, Jennesson M, Le Guyader G, et al. Developmental and epilepsy spectrum of Kcnb1 encephalopathy with long-term outcome. Epilepsia. (2020) 61:2461–73. doi: 10.1111/epi.16679
15. Gotham K, Pickles A, Lord C. Standardizing ados scores for a measure of severity in autism spectrum disorders. J Autism Dev Disord. (2009) 39:693–705. doi: 10.1007/s10803-008-0674-3
16. Gotham K, Risi S, Pickles A, Lord C. The autism diagnostic observation schedule: revised algorithms for improved diagnostic validity. J Autism Dev Disord. (2007) 37:613–27. doi: 10.1007/s10803-006-0280-1
17. Hus V, Gotham K, Lord C. Standardizing ados domain scores: separating severity of social affect and restricted and repetitive behaviors. J Autism Dev Disord. (2014) 44:2400–12. doi: 10.1007/s10803-012-1719-1
18. Torkamani A, Bersell K, Jorge BS, Bjork RL Jr., Friedman JR, Bloss CS, et al. De Novo Kcnb1 mutations in epileptic encephalopathy. Ann Neurol. (2014) 76:529–40. doi: 10.1002/ana.24263
19. Thiffault I, Speca DJ, Austin DC, Cobb MM, Eum KS, Safina NP, et al. A novel epileptic encephalopathy mutation in kcnb1 disrupts Kv2.1 ion selectivity, expression, and localization. J Gen Physiol. (2015) 146:399–410. doi: 10.1085/jgp.201511444
20. Hawkins NA, Misra SN, Jurado M, Kang SK, Vierra NC, Nguyen K, et al. Epilepsy and neurobehavioral abnormalities in mice with a dominant-negative Kcnb1 pathogenic variant. Neurobiol Dis. (2021) 147:105141. doi: 10.1016/j.nbd.2020.105141
21. Bar C, Breuillard D, Kuchenbuch M, Jennesson M, Le Guyader G, Isnard H, et al. Adaptive behavior and psychiatric comorbidities in Kcnb1 encephalopathy. Epilepsy Behav. (2022) 126:108471. doi: 10.1016/j.yebeh.2021.108471
22. Bailey A, Hervas A, Matthews N, Palferman S, Wallace S, Aubin A, et al. A full genome screen for autism with evidence for linkage to a region on chromosome 7q. Hum Mol Genet. (1998) 7:571–8. doi: 10.1093/hmg/7.3.571
23. Okamoto N, Hatsukawa Y, Shimojima K, Yamamoto T. Submicroscopic deletion in 7q31 encompassing Cadps2 and Tspan12 in a child with autism spectrum disorder and Phpv. Am J Med Genet A. (2011) 155A:1568–73. doi: 10.1002/ajmg.a.34028
24. Gross C, Yao X, Pong DL, Jeromin A, Bassell GJ. Fragile X mental retardation protein regulates protein expression and mrna translation of the potassium channel Kv4.2. J Neurosci. (2011) 31:5693–8. doi: 10.1523/JNEUROSCI.6661-10.2011
25. Lugo JN, Brewster AL, Spencer CM, Anderson AE. Kv4.2 knockout mice have hippocampal-dependent learning and memory deficits. Learn Mem. (2012) 19:182–9. doi: 10.1101/lm.023614.111
26. Kim E, Hoffman DA. Dynamic regulation of synaptic maturation state by voltage-gated a-type K+ channels in Ca1 hippocampal pyramidal neurons. J Neurosci. (2012) 32:14427–32. doi: 10.1523/JNEUROSCI.2373-12.2012
27. Mikhailov A, Choufani S, Skaug J, Kolozsvari D, Marshall C, Scherer S, et al. (editors) “Chromosomal translocation T (5; 7)(Q14; Q31) and missense mutations implicate the voltage-gated potassium channel Kv4. 2 Gene, Kcnd2, on 7q31 in autism,” in Proceedings of the Annual Meeting of the American Society of Human Genetics, Philadelphia, PA (2008).
28. Prakash A, Banerjee M. Genomic selection signatures in autism spectrum disorder identifies cognitive genomic tradeoff and its relevance in paradoxical phenotypes of deficits versus potentialities. Sci Rep. (2021) 11:10245. doi: 10.1038/s41598-021-89798-w
29. Lee H, Lin MC, Kornblum HI, Papazian DM, Nelson SF. Exome sequencing identifies de novo gain of function missense mutation in Kcnd2 in identical twins with autism and seizures that slows potassium channel inactivation. Hum Mol Genet. (2014) 23:3481–9. doi: 10.1093/hmg/ddu056
30. Swartz KJ. Towards a structural view of gating in potassium channels. Nat Rev Neurosci. (2004) 5:905–16. doi: 10.1038/nrn1559
31. Lin MA, Cannon SC, Papazian DM. Kv4.2 autism and epilepsy mutation enhances inactivation of closed channels but impairs access to inactivated state after opening. Proc Natl Acad Sci USA. (2018) 115:E3559–68. doi: 10.1073/pnas.1717082115
32. Connolly JJ, Glessner JT, Hakonarson HA. Genome-wide association study of autism incorporating autism diagnostic interview-revised, autism diagnostic observation schedule, and social responsiveness scale. Child Dev. (2013) 84:17–33. doi: 10.1111/j.1467-8624.2012.01838.x
Keywords: autism spectrum disorder, Kv2.1, Kv4.2, single nucleotide polymorphisms, susceptibility
Citation: Liu Z, Yang X, Guo P, Wang F, Xia W, Chen Y, Zou M and Sun C (2023) The association between gene polymorphisms in voltage-gated potassium channels Kv2.1 and Kv4.2 and susceptibility to autism spectrum disorder. Front. Psychiatry 13:994166. doi: 10.3389/fpsyt.2022.994166
Received: 14 July 2022; Accepted: 30 December 2022;
Published: 23 January 2023.
Edited by:
Giulia Treccani, Johannes Gutenberg University Mainz, GermanyReviewed by:
Janith Heendeni Pathiranage Don, Translational Genomics Research Institute (TGen), United StatesAngela Caruso, National Institute of Health (ISS), Italy
Copyright © 2023 Liu, Yang, Guo, Wang, Xia, Chen, Zou and Sun. This is an open-access article distributed under the terms of the Creative Commons Attribution License (CC BY). The use, distribution or reproduction in other forums is permitted, provided the original author(s) and the copyright owner(s) are credited and that the original publication in this journal is cited, in accordance with accepted academic practice. No use, distribution or reproduction is permitted which does not comply with these terms.
*Correspondence: Mingyang Zou,  bWluZ3lhbmdzaGluZUBzaW5hLmNvbQ==; Caihong Sun, c3VuY2FpaG9uZzIwMDNAMTYzLmNvbQ==