 Chunyu Yan
 He Wang2
- 1First Clinical Medical College, Heilongjiang University of Traditional Chinese Medicine, Harbin, China
- 2Department of Cardiology, The First Hospital Affiliated to Heilongjiang University of Traditional Chinese Medicine, Harbin, China
Background: The ratio of non-high-density lipoprotein cholesterol to high-density lipoprotein cholesterol (NHHR) index is a relatively new composite lipid index, the relationship between NHHR and depression is unclear from the current study. The primary aim of our study was to examine the association between the prevalence of depression and NHHR in a US population.
Methods: The National Health and Nutrition Examination Survey (NHANES) provided the data for our investigation from 2005 to 2018. and primarily included participants who contained complete data on NHHR and depression in U.S. adults (age ≥20 years). Associations between NHHR and depression were assessed using multifactorial logistic regression analysis, subgroup analysis, and smoothed curve fitting.
Results: In our study, 29,561 subjects in total showed a mean NHHR index of 3.12± 1.58,A noteworthy positive correlation was observed between NHHR and depression in multifactorial logistic regression analysis. Subgroup analyses and tests of interaction showed that gender, age, ethnicity, PIR, smoking, alcohol consumption, coronary heart disease, diabetes mellitus, hypertension, and stroke did not influence the NHHR and the association between depression (P for interaction > 0.05), whereas two stratification factors, BMI and sleep disturbance, may be potential factors in the association between NHHR and depression (P for interaction < 0.05).
Conclusion: According to our present study, if the level of NHHR rises in American adults, their likelihood of developing depression also increases.
1 Introduction
With over 35 billion people affected globally, depression has emerged as a major public health concern. It is also one of the main causes of disability and low quality of life (1–3).
It’s worth noting that the frequency of adult depression in the U.S. is increasing each year, affecting about 8% of adults in the U.S., and is higher in women than in men (4). A high incidence, a high clinical cure rate but a low treatment acceptance rate and a high relapse rate are the hallmarks of depression as a mental illness. Along with cognitive abnormalities that could interfere with day-to-day learning and work, the patient may also experience hallucinations and, in extreme circumstances, suicidal thoughts (5, 6). Depressed moods may cause immune, endocrine and neurological dysfunction in the body, which can increase susceptibility to disease and lead to death (6). According to a recent meta-analysis, depression raised the probability of dying by 50% (7). In addition, depression not only reduces work efficiency and productivity, but also costs the global economy $1 trillion each year (8). Studies in the United States have found that the economic burden of depression is 1.6 percent of gross domestic product. However, current treatment regimens remain inadequate for some patients, and some may experience intolerable side effects, making the discovery of new depression-related bioindicators crucial for the prevention and treatment of depression. Many studies have shown that the pathogenesis of depression is closely associated with inflammation, neuroimmune dysfunction, and abnormalities in lipid metabolism (9–12). Previous findings on the association of biomarkers in lipid metabolism with depression have however been controversial, with some studies reporting that Triglycerides (TG) have a positive correlation with the likelihood of developing depression, while low-density lipoproteins (LDL-C), total cholesterol (TC), and high-density lipoproteins (HDL-C) have a negative correlation (13–16), In contrast, Raised HDL-C levels were substantially positively correlated with depression in both sexes, according to a cross-sectional study (17). Jane E. Persons et al. concluded from a meta-analysis that there was a U-shaped relationship between LDL and depression when LDL was used as a continuous variable (18). Non-HDL-C mainly contains cholesterol from all atherogenic lipoprotein particles, apolipoproteins, very low-density lipoprotein cholesterol (VLDL-C), and IDL-C, and relevant studies have demonstrated that the major components contained within non-HDL-C are linked to an increased risk of suffering from depression (19).
Therefore, the development of newer and more reliable lipid parameters is necessary for the prediction and management strategies of depression. The ratio of non-HDL-C to HDL-C (NHHR) is a newly discovered lipoprotein ratio that is known to assess atherosclerosis and blood predictors of cardiovascular disease risk (20). To date, Reports evaluating the connections between NHHR and depression are nonexistent.
Our investigation’s primary goal was to examine the relationship between NHHR and the prevalence of depression in participants from 2005-2018 using data from the National Health and Nutrition Examination Survey (NHANES). We postulated that elevated NHHR is connected to increased prevalence of depression.
2 Materials and methods
2.1 Study population
The National Center for Health Statistics’ main program, NHANES, or the National Health and Nutrition Examination Survey, is intended to evaluate the health and nutritional status of adults and children in the country. The survey offers comprehensive biological, psychological, behavioral, and demographic data at no cost by combining home interviews with health examinations. Written informed consent was acquired by each participant in this investigation, and the National Center for Health Statistics (NCHS) Ethics Review Committee approved the study procedure. For detailed data on participants, see http://www.cdc.gov/nchs/nhanes/index.htm.
Our study used NHANES data from 2005 to 2018 and initially included 70,190 participants who received thorough data on NHHR and depression, after excluding individuals under the age of twenty (n=30440), participants missing information on the Depression Health Questionnaire-9 (PHQ-9) (n=4622) (n=4622) and NHHR (n=1625), and participants missing information on relevant covariates (PIR, BMI, smoking, drinking, and sleep disorders) (n=3942), resulting in a total of 29,561 participants who met the inclusion criteria, as shown in Figure 1.
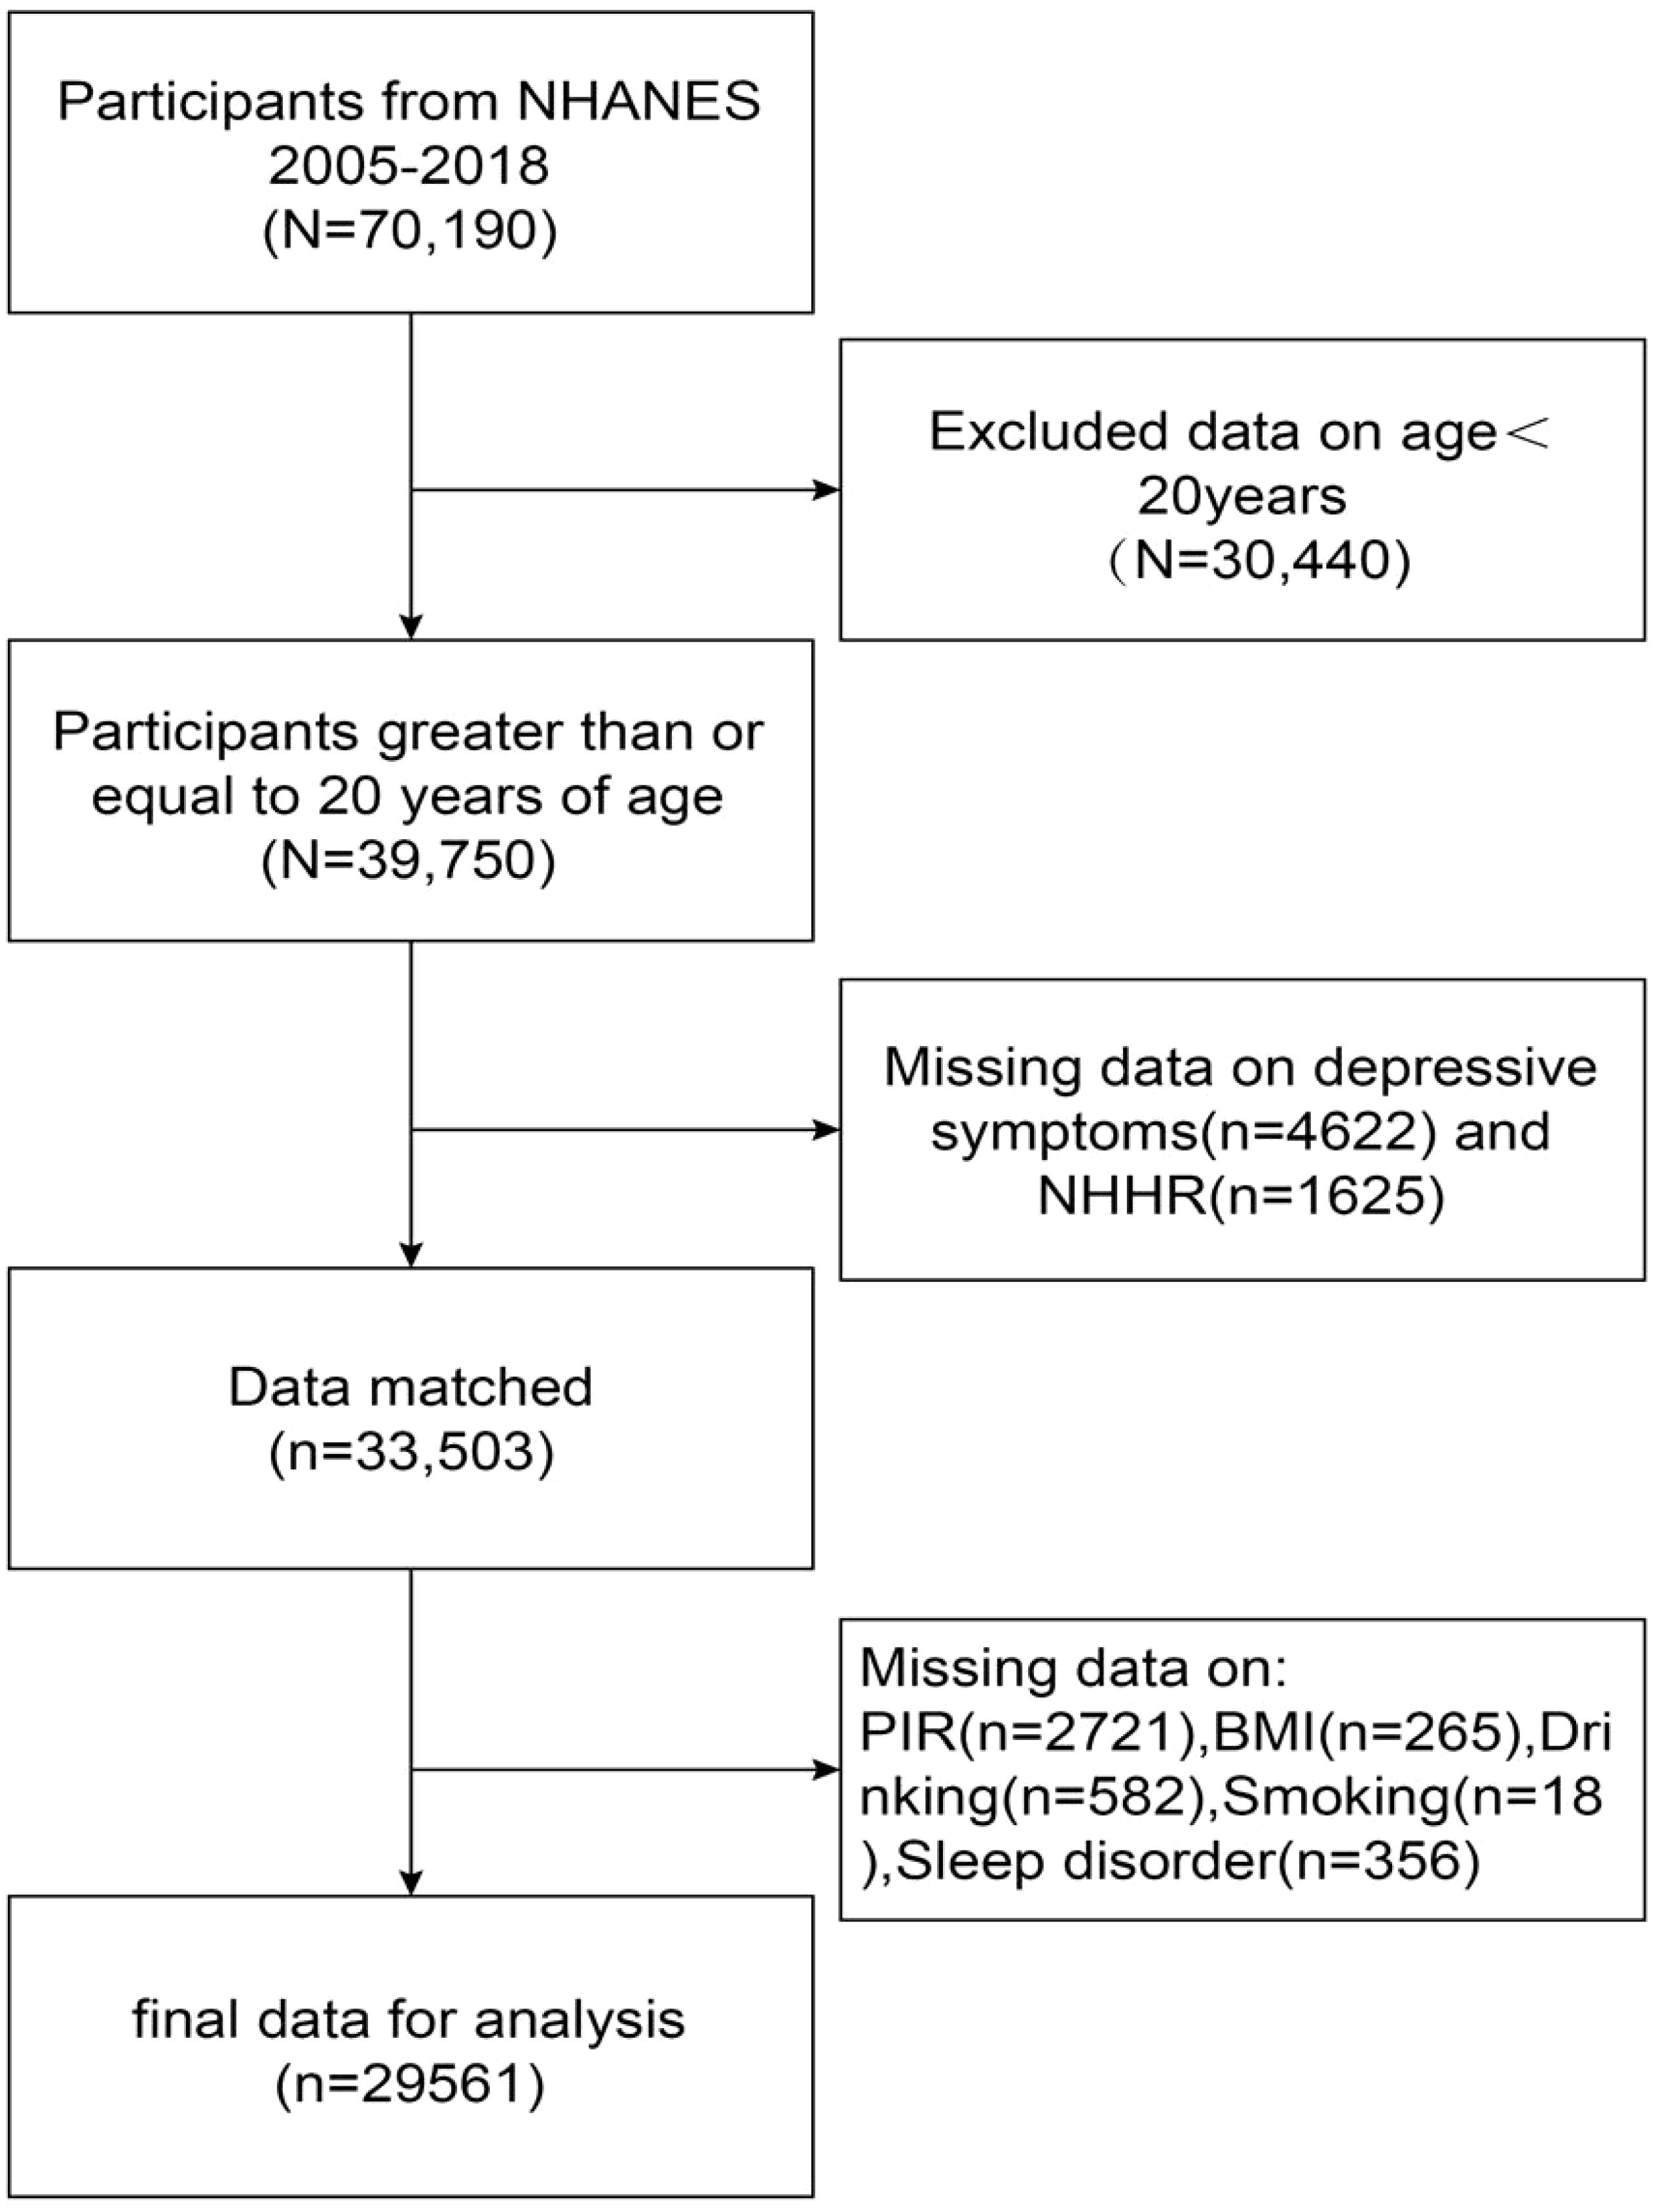
Figure 1. NHANES participant selection flowchart 2005-2018.
2.2 Assessment of depressive symptoms
This study assessed depressive severity based on participants’ health status over the past two weeks through the Depression Screening Scale (PHQ-9).The PHQ-9 contains nine items, each scored 0-3, and the total score is the sum of the nine items added together. Participants with a score of 10 or more were diagnosed with depressive symptoms (21).
2.3 Assessment of NHHR
NHHR was used as the exposure variable in this study and was calculated by subtracting the HDL level from the total cholesterol level and dividing the resulting NHHR level by the HDL level to obtain the final NHHR data for the participants.
2.4 Treatment of covariates
In our current study, there were a number of potential covariates that could have been confounders of the association between NHHR and depression. Covariates included age (years), gender (male/female), race, education level, poverty income ratio (PIR), marital status, body mass index (BMI, kg/m2), smoking status (based on having smoked at least 100 cigarettes in a lifetime, participants who answered yes were considered smokers), drinking status (based on having had at least 12 alcoholic beverages in a lifetime, participants who answered yes were considered drinkers), total cholesterol (TC), sleep disorders, hypertension, diabetes, coronary heart disease, and stroke. Detailed data on all of the above latent variables are publicly available at www.cdc.gov/nchs/nhanes/.
2.5 Statistical analyses
The CDC’s criteria were followed in performing all statistical analyses, which included applying proper NHANES sampling weights and taking into account a complex multistage whole cohort survey design (22).
Continuous variables were expressed as mean ± standard deviation (SD) and categorical variables as percentages, and differences between the two control groups by whether the participant had depression or not were assessed using a weighted Student-t test (for continuous variables) or a weighted chi-square test (for categorical data). Multifactor logistic regression models were used to analyze the independent relationship between NHHR and the prevalence of depression. Model 0 was unadjusted for variables, model 1 was adjusted for gender, age, and ethnicity, and model 2 adjusted for marriage, education, alcohol and smoking status, PIR, BMI, total cholesterol, sleep disorders, hypertension, diabetes mellitus, coronary heart disease, and stroke in addition to model 1. Smoothed curve fitting was used to further analyze the linear relationship between NHHR and the prevalence of depression. Subgroup analyses stratified by age, sex, race, smoking status, drinking status, PIR, BMI, sleep disorders, hypertension, coronary heart disease, diabetes mellitus, and stroke were also performed by stratified multivariate regression analyses, and we added an interaction test to test for heterogeneity in the associations between subgroups, with P < 0.05 considered statistically significant. In addition, we used smooth curve fitting to predict whether there was a positive association between NHHR and depression prevalence stratified by BMI and sleep disturbance. All statistical data in this study were analyzed and visualized using R4.3.2 software for (http://www.R-project.org) and Empower Stats (http://www.empowerstats.com), Empower Stats uses gam () function in mgcv package to draw smooth curve fitting, and the curve fitting items are defined by s () function. and statistical significance was set at P < 0.05.
3 Results
3.1 Baseline characteristics of participants
Table 1 depicts the weighted demographic baseline characteristics of the included participants. A total of 29,561 subjects were included in our study, of whom 49.09% were male and 50.91% were female, with a mean age of 49.45 ± 17.66 years. We set depression as a dichotomous variable, and compared to the non-depressed group, depressed subjects were characterized by a predominance of females, lower age, more often seen in other Hispanic and non-Hispanic blacks, more education in grades 9-12 and high school graduation/GED or equivalent, lower household income, widowed/divorced/separated/never married/living with a partner, higher rates of smoking and alcohol use, increased BMI, higher TC levels, and prevalence of sleep disorders, hypertension, coronary heart disease, diabetes, and stroke, with statistically significant differences in variables between groups (p < 0.05).
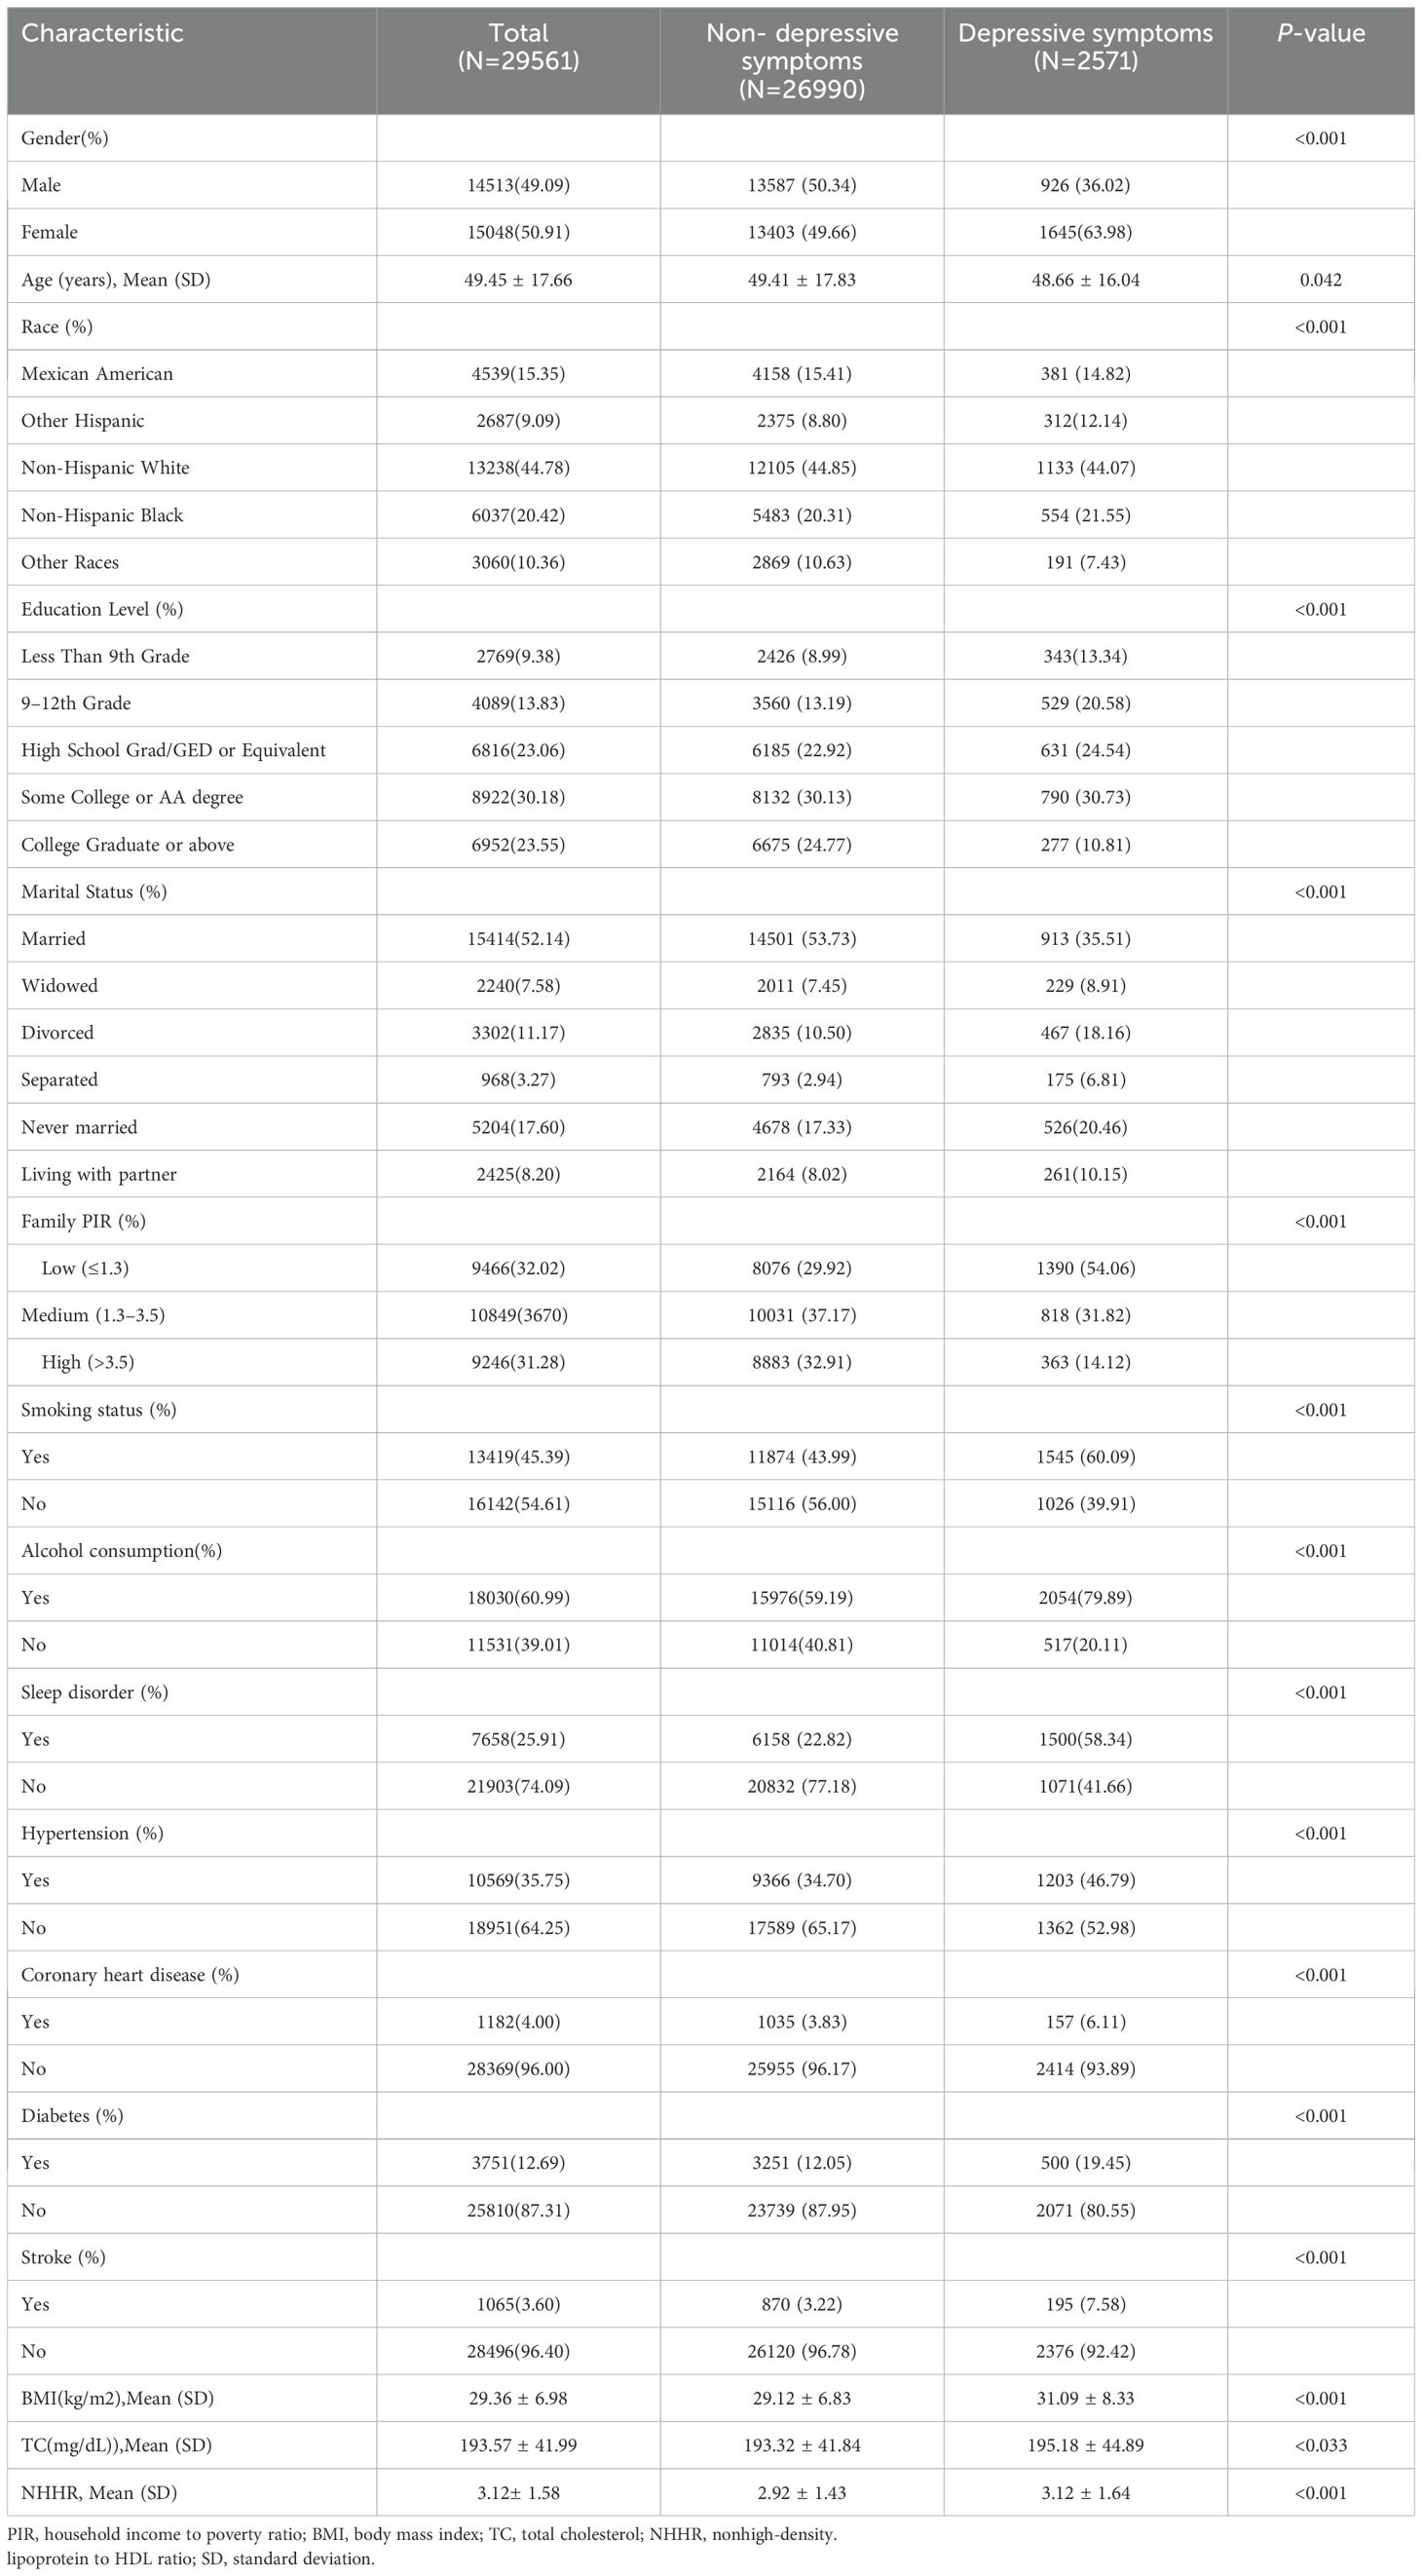
Table 1. Clinical characteristics of depressed and non-depressed patients (n=29561): NHANES, 2005–2018.
3.2 Association between NHHR and depression
Our results point to a strong correlation between the prevalence of depression and NHHR. In all three models, depression has a favorable correlation with the ratio of ratios (OR) of NHHR (Model 0: OR=1.09; 95% CI (1.06, 1.12),P<0.0001; Model 1: OR=1.14; 95% CI (1.11, 1.17),P<0.0001; Model 2:OR=1.05; 95% CI (1.01, 1.09),P=0.0057). As can be seen in Model2 (fully adjusted model), the association remained statistically significant after quartiling the NHHR, with a 23% increase in the likelihood of subjects developing depression for each unit increase in NHHR through the highest quartile of NHHR compared to the lowest quartile of NHHR (Table 2). In addition, we further demonstrated a favorable correlation between NHHR and the prevalence of depression using smoothed curve fitting (Figure 2).
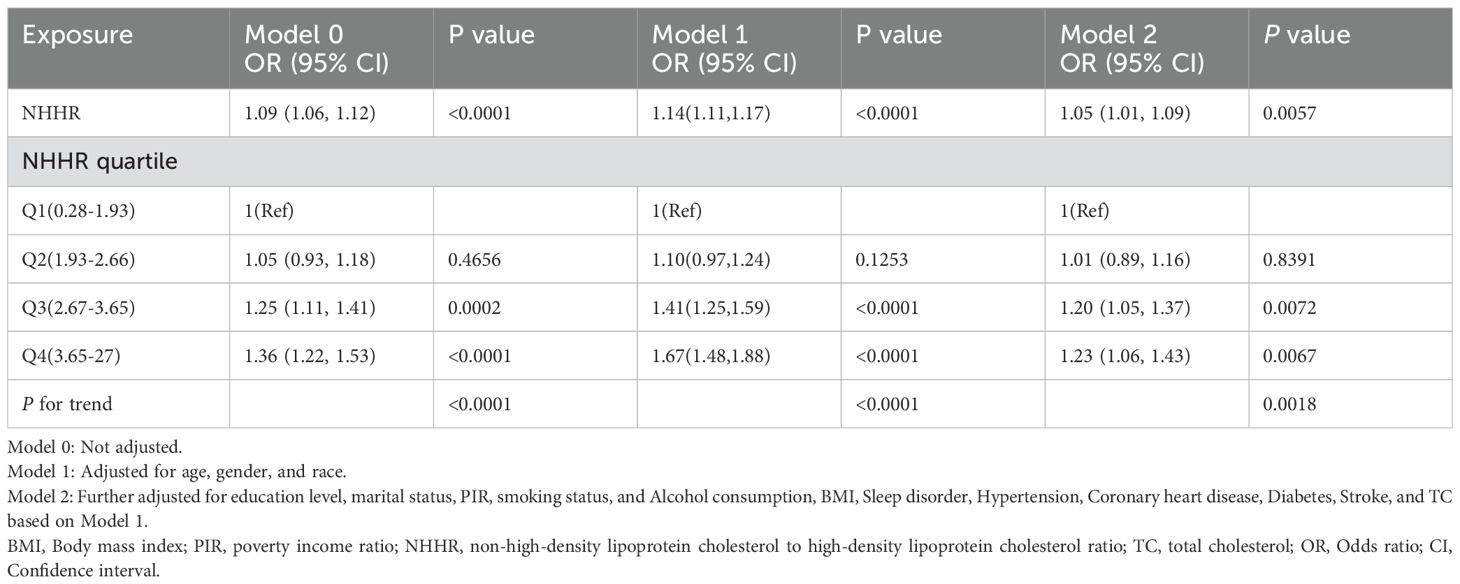
Table 2. Association between non-high-density lipoprotein cholesterol to high-density lipoprotein cholesterol ratio and depressive symptoms in different models.
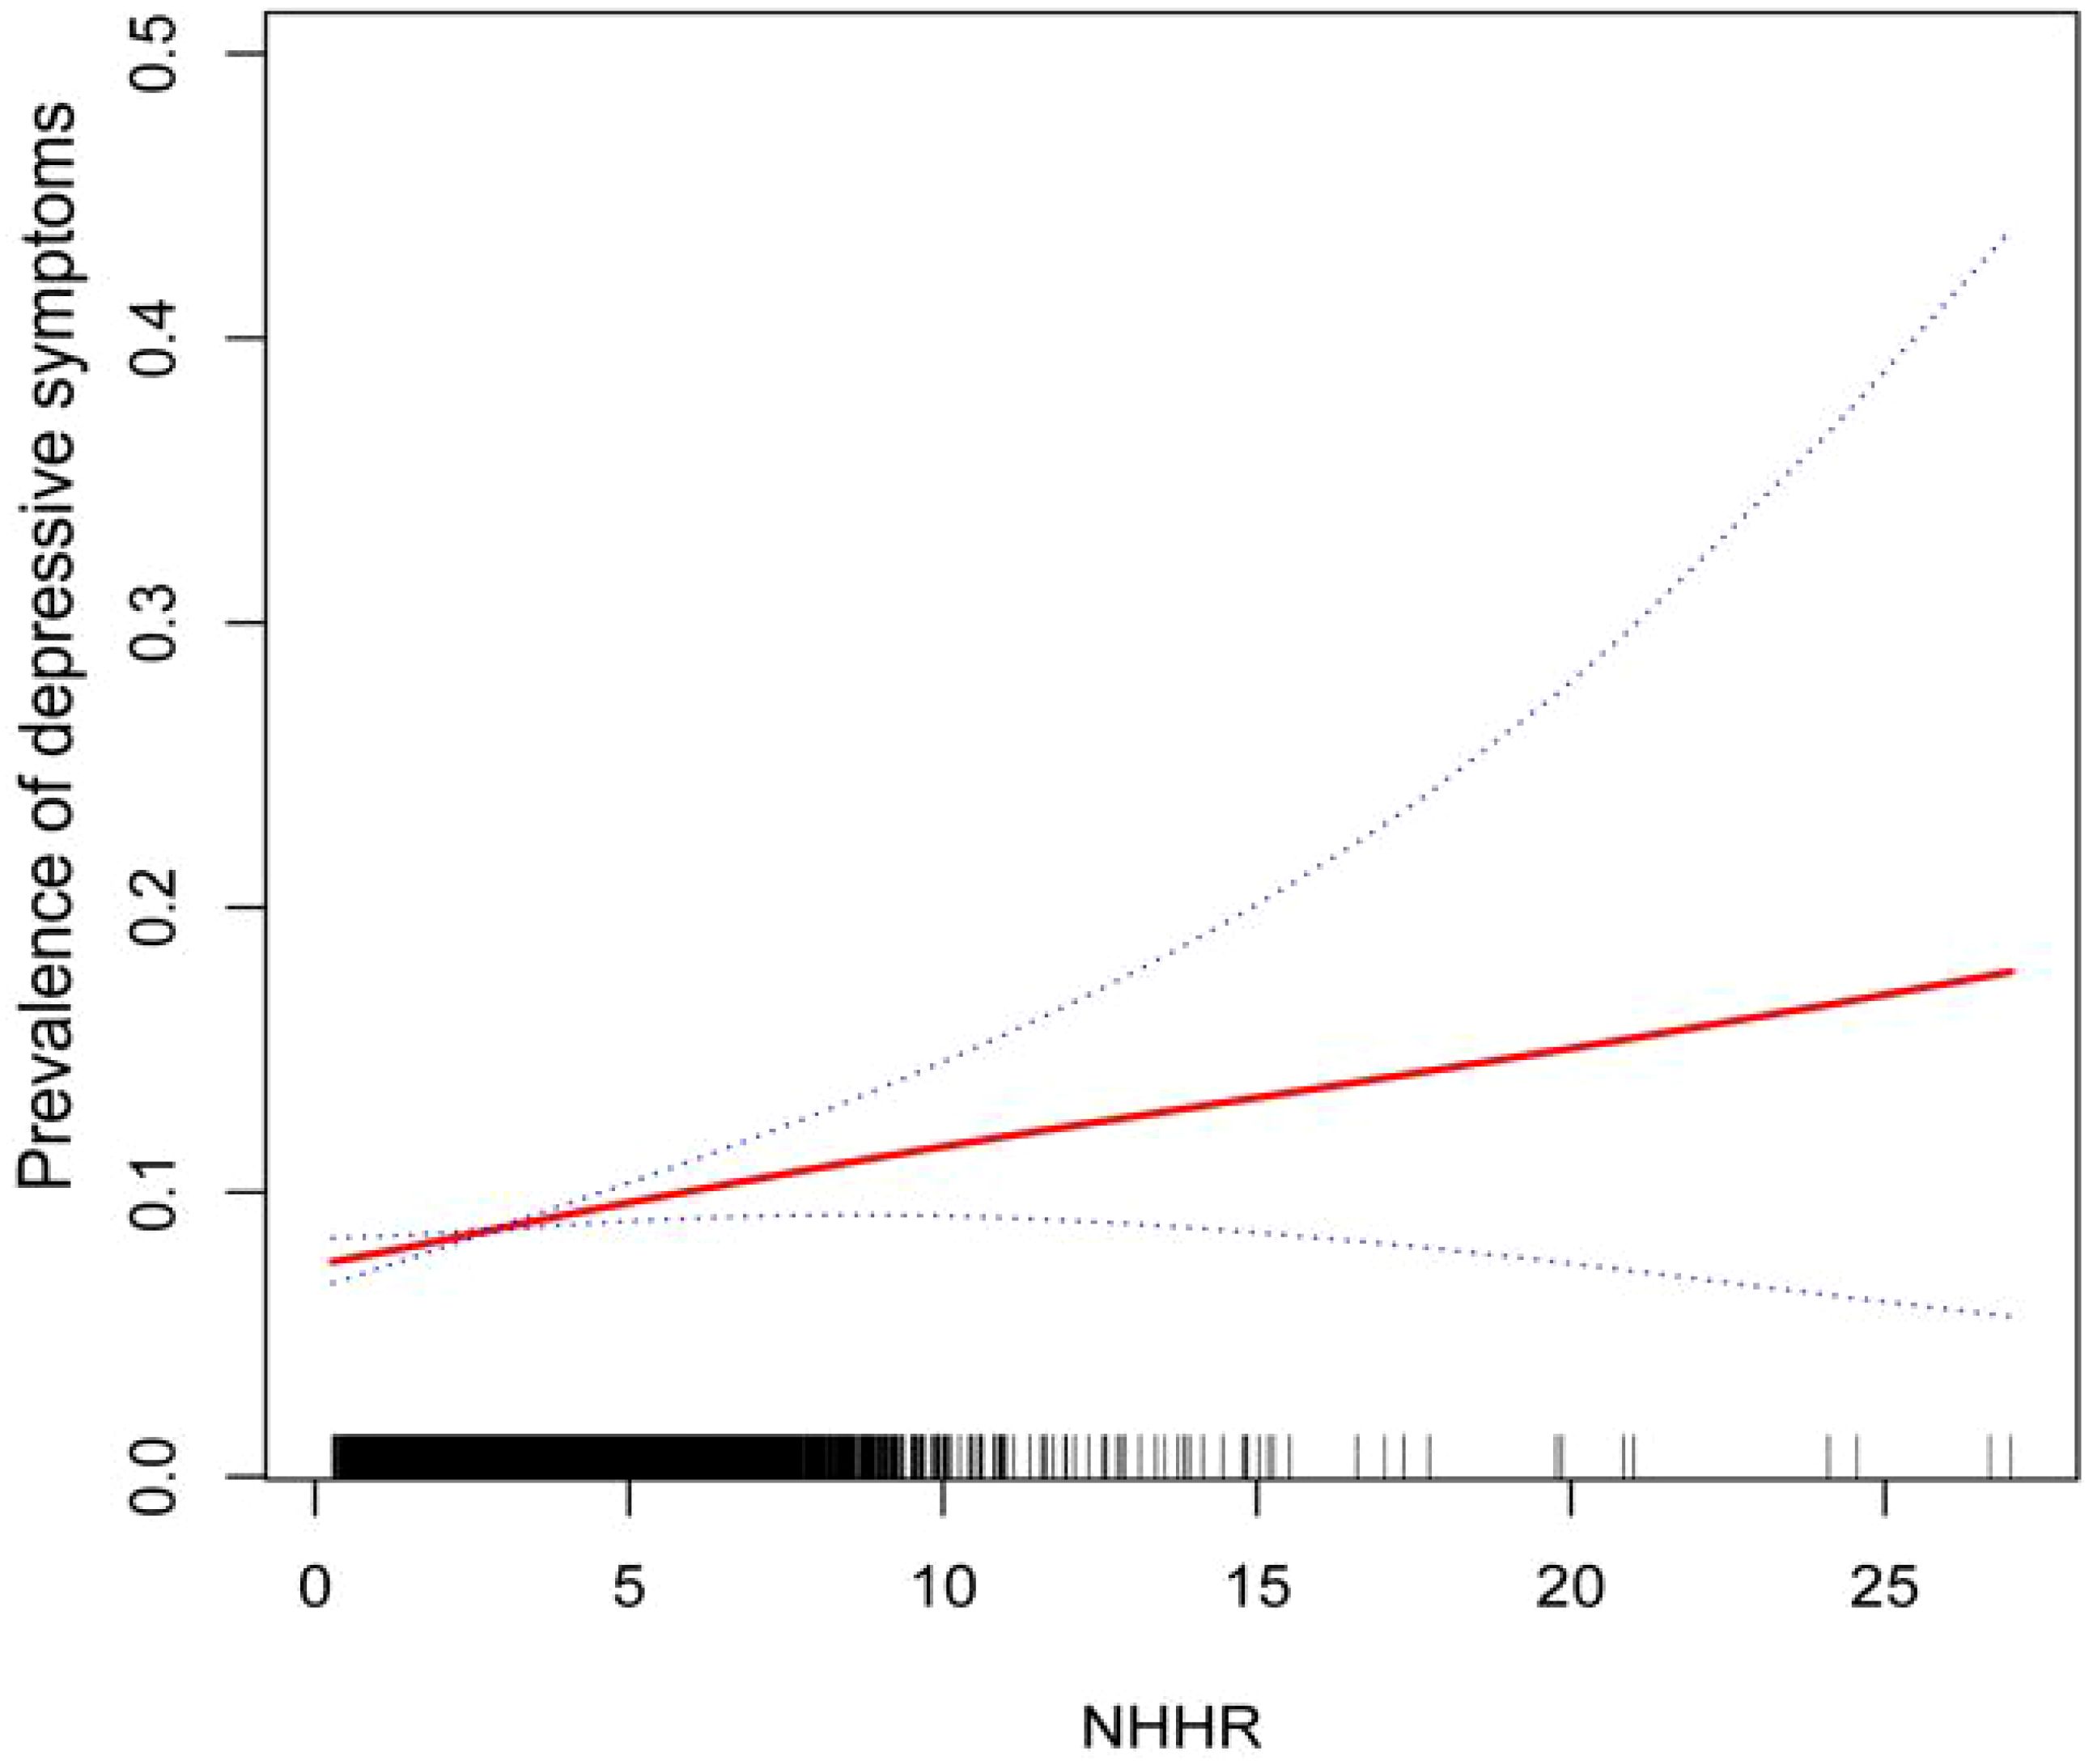
Figure 2. Smoothing curve fitting of NHHR index and depressive symptoms.
3.3 Subgroup analysis
We conducted subgroup analyses to assess the stability of the relationship between NHHR and the prevalence of depression across a variety of factors, including personality, age, ethnicity, BMI, smoking and drinking status, sleep disorders, coronary heart disease, hypertension, diabetes, and stroke. We found that BMI and sleep disorders altered the positive association between NHHR and the prevalence of depression (P < 0.05) (Figures 3, 4).
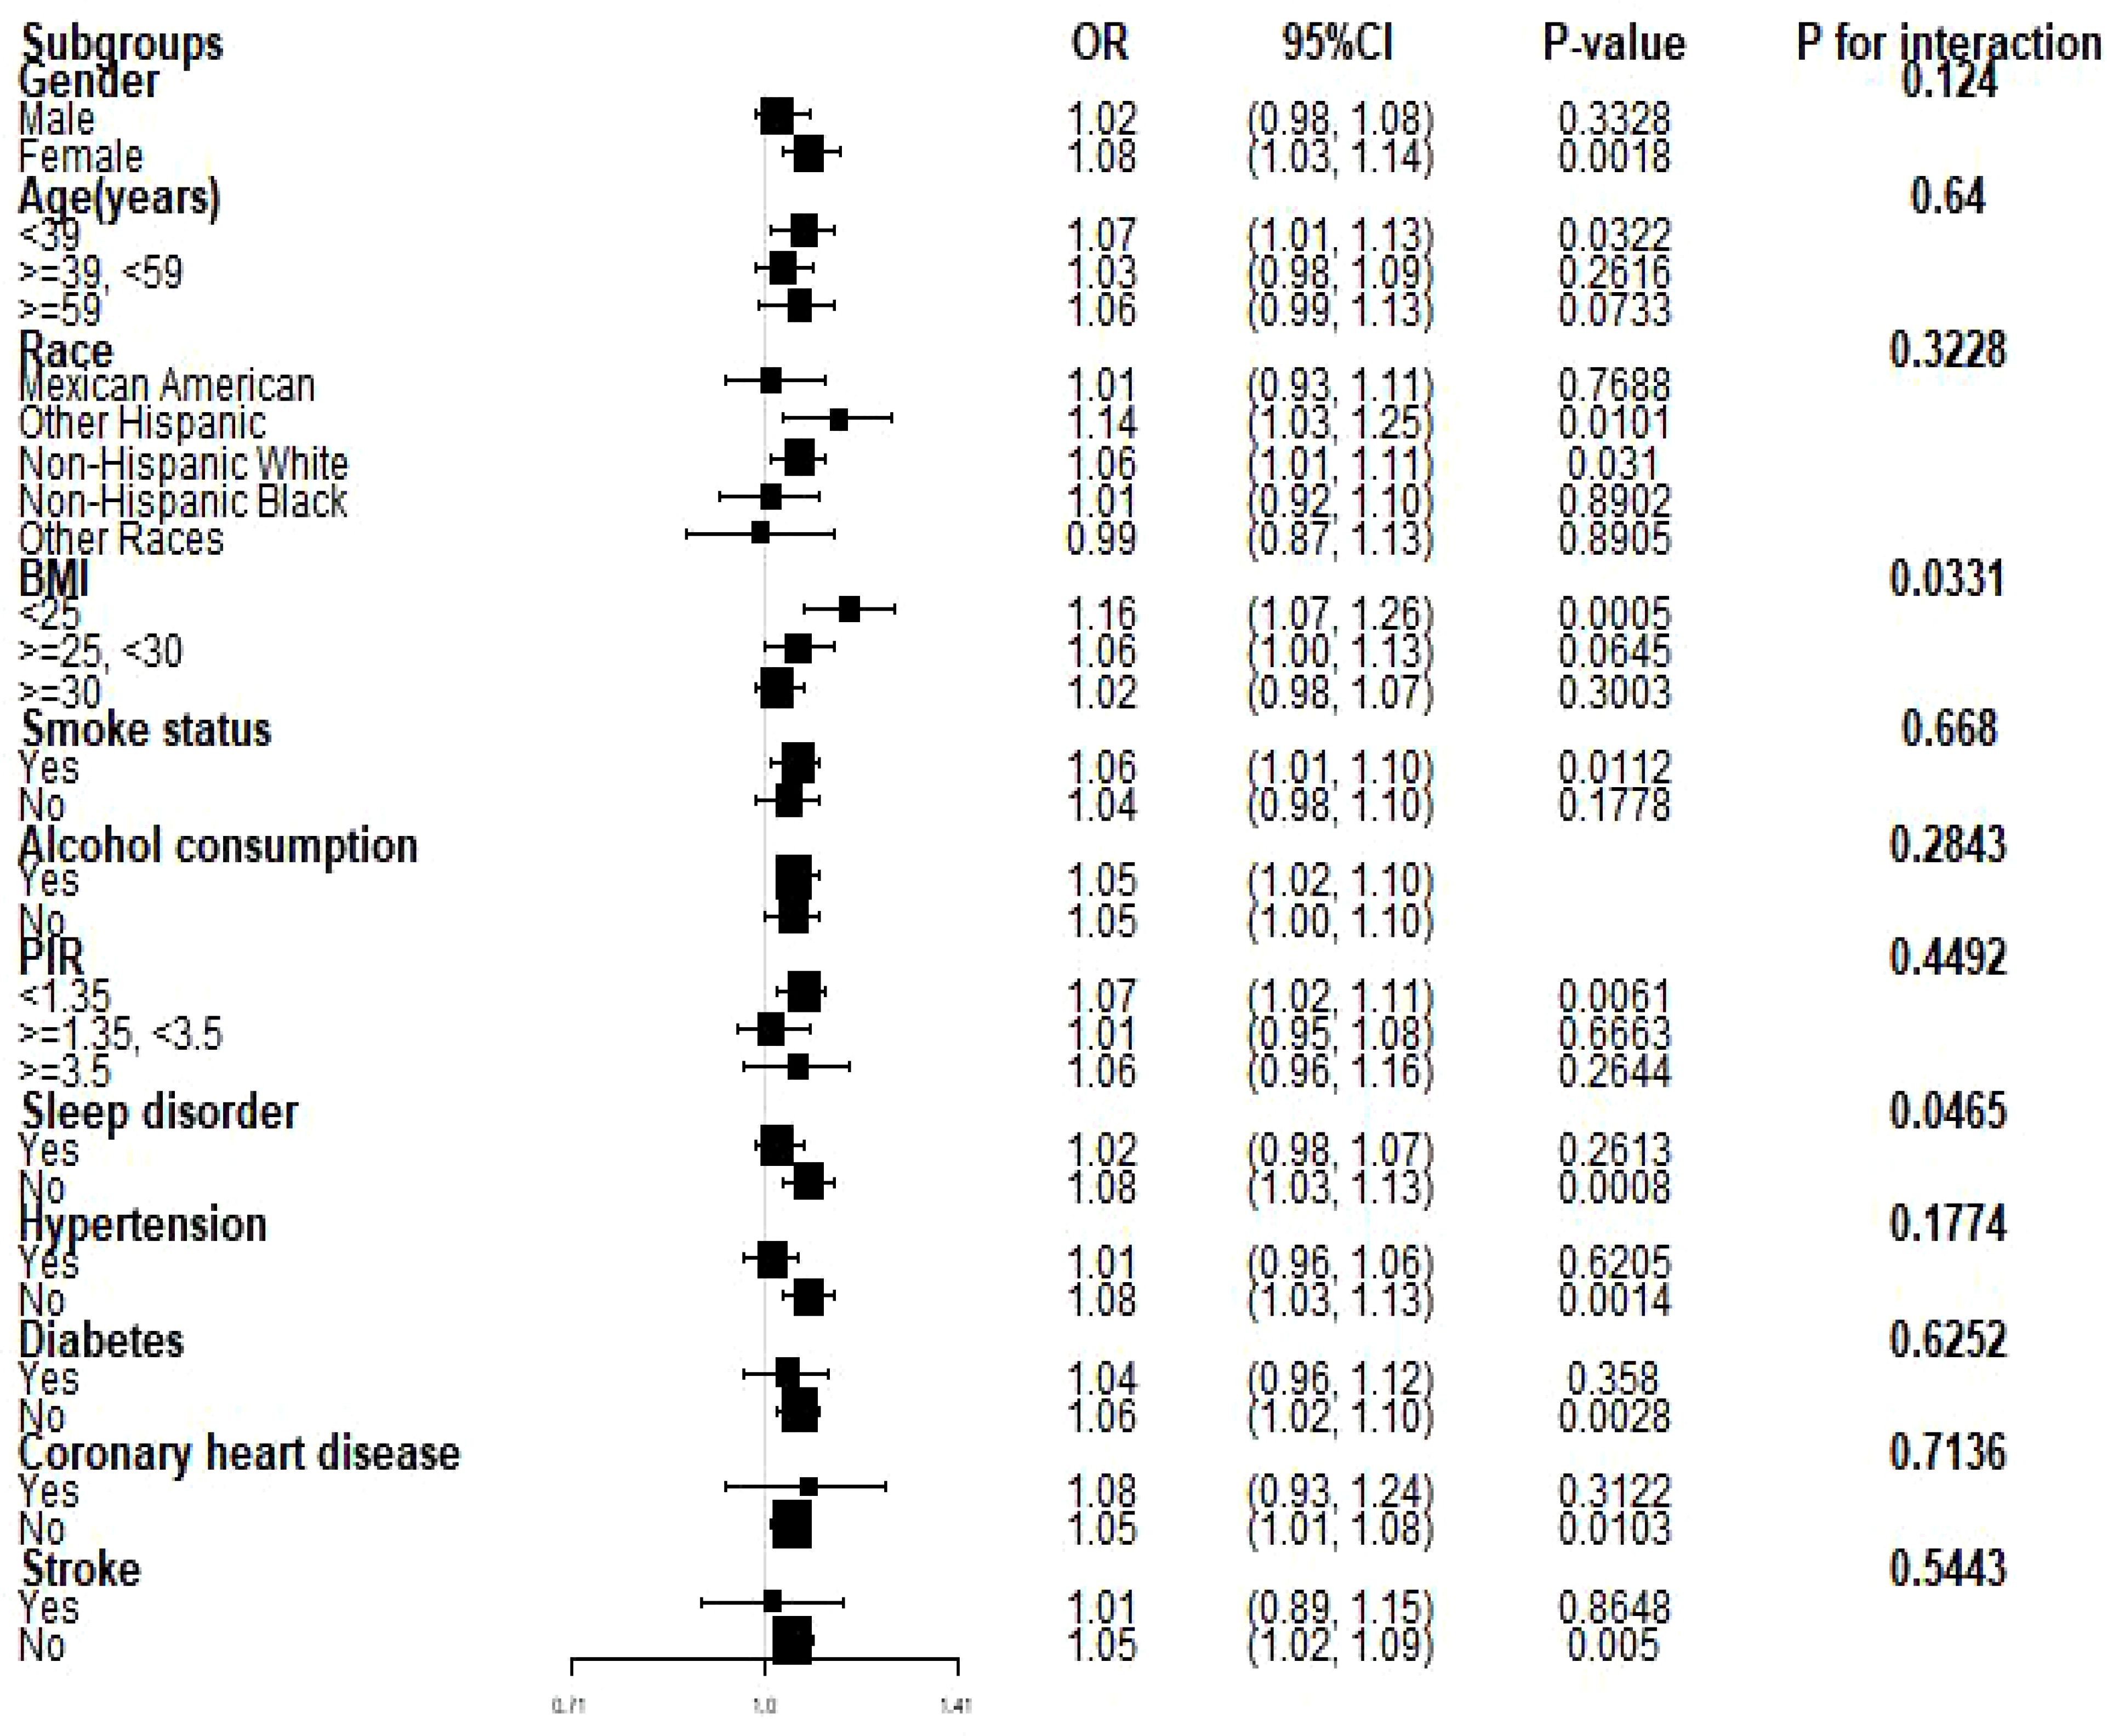
Figure 3. Subgroup analyses of the relationship between NHHR and the prevalence of depression. PIR, ratio of household income to poverty; BMI, body mass index. Each stratum was adjusted for all factors (age, sex, race, PIR, BMI, smoking, alcohol use, hypertension, coronary heart disease, diabetes mellitus, and stroke) except for the stratification factor itself in the model.
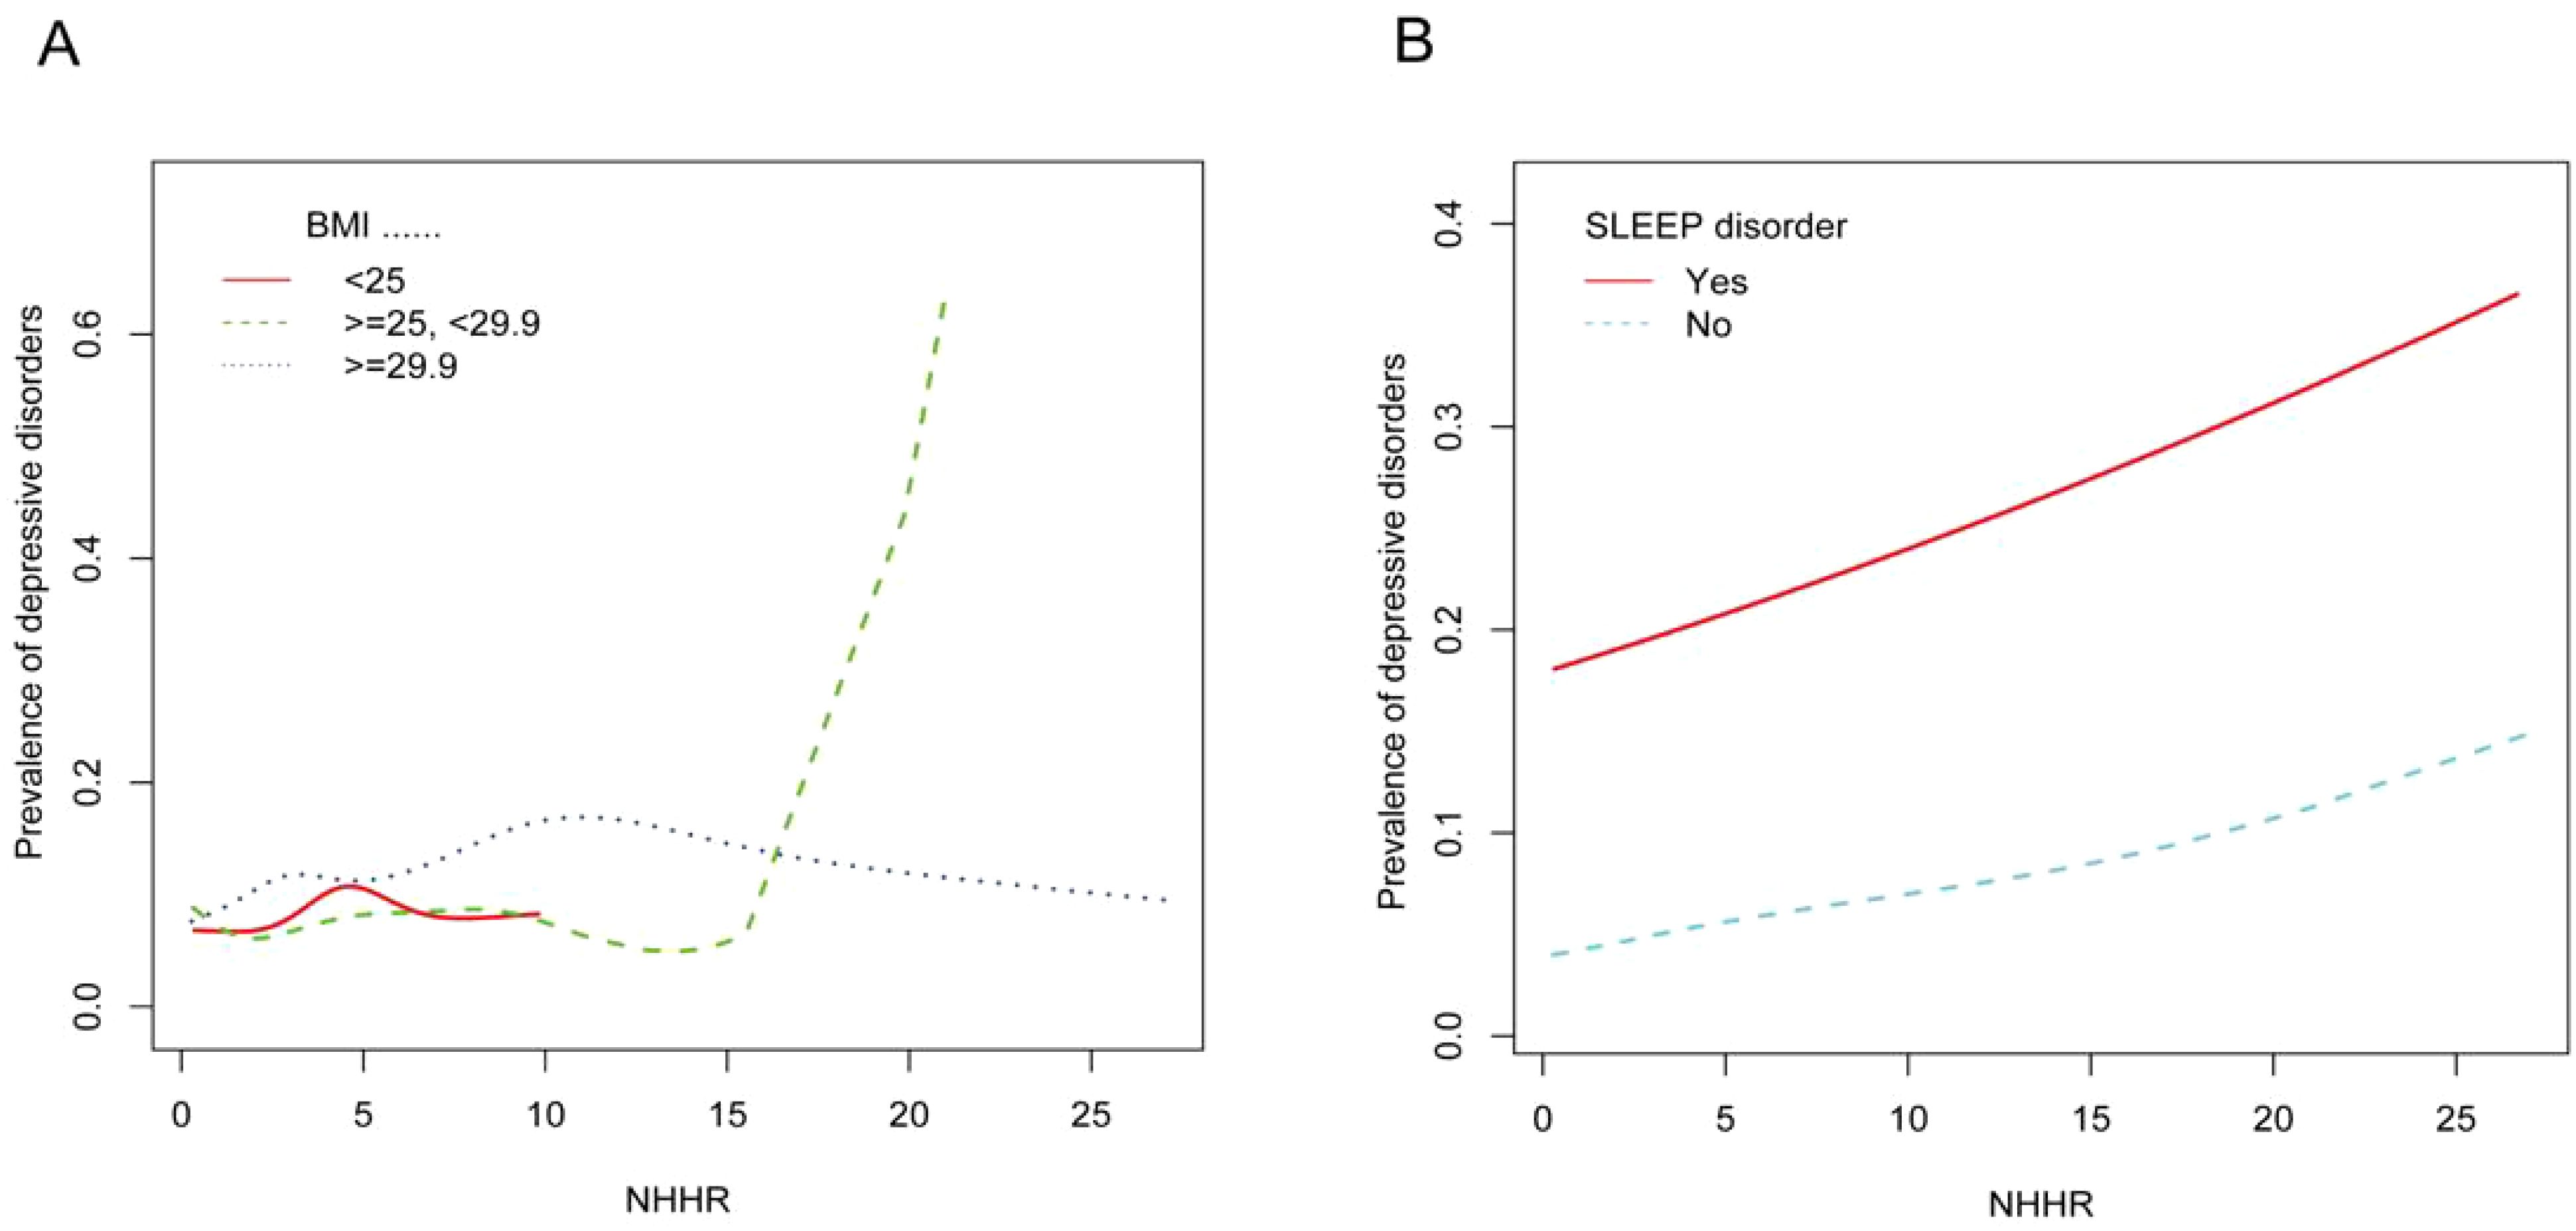
Figure 4. (A) Smoothed curves of the relationship between NHHR and the prevalence of depression analyzed stratified by BMI. (B) Smoothed curves of the relationship between NHHR and the prevalence of depression analyzed stratified by whether or not the subject had a sleep disorder.
4 Discussion
In our cross-sectional study of 29,561 adult participants, we found that the likelihood of participants developing depression increased as the NHHR index rose. A linear relationship between NHHR index and depression was demonstrated using smooth curve fitting. In the subgroup analyses and interaction tests conducted, we hypothesized that two stratification factors, BMI <25 kg/m2 and absence of sleep disorders, may influence the relationship between NHHR and the prevalence of depression.
This is the only study that we are aware of that evaluates the relationship between NHHR and higher rates of depression. Previous studies have discussed associations between depression and other biomarkers. The association between relative adiposity, an indicator of obesity, and depression was found to be most significant in the US adult population in a cross-sectional study conducted by Xianlin Zhu et al. (23). Depression has also been reported to be associated with lymphocyte to HDL ratios, leading to the suggestion that immune dysfunction or inflammatory factors may be a key contributor to depression (24). NHHR, as an emerging biomarker, has received much attention for its regulation of diseases such as atherosclerosis, diabetes, kidney stones, and periodontitis. Despite the lack of previous studies describing the relationship between NHHR and psychiatric disorders, there have been many reports of NHHR-related markers, including non-HDL, TC, HDL, apolipoproteins, and low-density lipoproteins. Non-HDL cholesterol is the sum of all kinds of lipoprotein cholesterol in the blood except HDL cholesterol, and relevant research investigations have found that apolipoprotein (b) and HDL, the main components of non-HDL cholesterol, are the main lipid metabolism indexes constituting atherosclerosis, and that atherosclerosis is prone to cause endothelial function damage at the beginning, and increase in vascular oxidative stress, which further causes nitric oxide-dependent diminished vasodilatory function, which in turn causes major depressive disorder (25–28). Numerous investigations have revealed that lower levels of total cholesterol, LDL and non-HDL increase the risk of depression (15, 29–31). It has been suggested that low plasma cholesterol levels can reduce the synthesis of neuromodulators such as steroids, which can lead to depressed mood (32, 33). In a cross-sectional study of the relationship between lipids and depressive episodes in postmenopausal women, it was found that after quintiles of HDL-C and LDL-C were used as continuous variables, it was concluded that lower concentrations of HDL-C and LDL-C were associated with the risk of developing depression (34). Xianlin Zhu et al. analyzed the positive association between non-HDL-C and depression in 42,143 subjects in a cross-sectional study, and the relationship was more significant in men (35). In view of the above relationship between each of the lipid indicators of depression, we believe that it is necessary for the study of the association between NHHR and depression. Specifically, the results of our subgroup analyses showed that age, gender, race, smoking, alcohol consumption, PIR, coronary heart disease, hypertension, diabetes mellitus, and stroke had no dependence on the positive correlation between NHHR and depression (P for interaction > 0.05), and the baseline characterization of participants as well as the smoothed curve fitting showed that, compared with the no depression group, subjects with depression subjects had a more significant association with NHHR and that for each unit increase in NHHR, subjects were 23% more likely to have depression. Neurosteroids refer to a class of endogenous steroids synthesized from cholesterol in the brain and nervous system. They are modulators involved In emotion, cognition, etc (36–38). Ramirez et al. found that the concentration of the neurosteroid pregnenolone in the hypothalamus was negatively correlated with BMI in animal models. That is, when BMI levels are low, they promote neurosteroid production and induce psychiatric disorders (39). Interestingly, BMI level was associated with changes in brain structure, with an inverse correlation with nucleus accumbens and insula volume in obese patients (BMI > 29.9kg/m2) compared with normal or underweight individuals (40, 41). The insula has been shown to play an important role in depression and cognitive function. Lidia Łapińska et al. found a positive association with insula volume in women with BMI<25 kg/m2. However, it was negatively correlated with Beck Depression Inventory (BDI) score (42). This was consistent with our observation that there was a positive association between NHHR and depression in people with BMI<25 kg/m2 (OR=1.16, 95%CI: 1.07-1.26, P < 0.01).
5 Advantages and limitations
Our study has a number of strengths; firstly, our data came from having a large, accurate and reliable NHANES database, and secondly, we adjusted for multiple confounding variables and performed smoothed curve fitting and subgroup analyses to validate the stability of our results and to more accurately analyze the effects of different single factors on the association between NHHR and depression. However, this paper also has limitations. First, because this paper is a cross-sectional study design, It is unable to elucidate the causal connection between NHHR and depression, and longitudinal studies with larger sample sizes are needed in the future. Second, even though we took some probable covariates into account, we are unable to totally rule out the impact of additional potential confounders. Finally, in the future, we need to further analyze the mechanism behind this correlation through experiments.
6 Conclusion
As a result, our initial research suggests that NHHR could be a reliable independent indicator of the risk of developing depression. Large sample sizes and more prospective research are still required to confirm our findings in the future.
Data availability statement
The datasets presented in this study can be found in online repositories. The names of the repository/repositories and accession number(s) can be found in the article/supplementary material.
Ethics statement
The studies involving humans were approved by the National Center for Health Statistics NCHS Research Ethics Review Board. The studies were conducted in accordance with the local legislation and institutional requirements. The participants provided their written informed consent to participate in this study. Written informed consent was obtained from the individual(s) for the publication of any potentially identifiable images or data included in this article.
Author contributions
CY: Writing – original draft, Software. YZ: Writing – review & editing, Supervision. CL: Writing – review & editing, Validation, Methodology, Data curation. HW: Writing – review & editing, Supervision, Investigation, Formal Analysis. JF: Writing – review & editing, Validation, Supervision, Conceptualization.
Funding
The author(s) declare that no financial support was received for the research, authorship, and/or publication of this article.
Acknowledgments
We express our gratitude to the National Health and Nutrition Examination Survey team for their invaluable efforts.
Conflict of interest
The authors declare that the research was conducted in the absence of any commercial or financial relationships that could be construed as a potential conflict of interest.
Publisher’s note
All claims expressed in this article are solely those of the authors and do not necessarily represent those of their affiliated organizations, or those of the publisher, the editors and the reviewers. Any product that may be evaluated in this article, or claim that may be made by its manufacturer, is not guaranteed or endorsed by the publisher.
References
1. GBD 2019 Diseases and Injuries Collaborators. Global burden of 369 diseases and injuries in 204 countries and territories, 1990–2019: a systematic analysis for the global burden of Disease Study 2019. Lancet. (2020) 396:1204–22. doi: 10.1016/S0140-6736(20)30925-9
2. GBD 2019 Mental Disorders Collaborators. Global, regional, and national burden of 12 mental disorders in 204 countries and territories, 1990–2019: a systematic analysis for the global burden of Disease Study 2019. Lancet Psychiatry. (2022) 9:137–50. doi: 10.1016/S2215-0366(21)00395-3
3. Arias-de la Torre J, Vilagut G, Ronaldson A, Bakolis I, Dregan A, Martín V, et al. Prevalence and variability of depressive symptoms in Europe: update using representative data from the second and third waves of the European Health Interview Survey (EHIS-2 and EHIS-3). Lancet Public Health (2023) 8(11):e889–98. doi: 10.1016/S2468-2667(23)00220-7
4. Daly M, Sutin AR, Robinson E. Depression reported by US adults in 2017–2018 and March and April 2020. J Affect Disord. (2021) 278:131–5. doi: 10.1016/j.jad.2020.09.065
5. Ross RE, VanDerwerker CJ, Saladin ME, Gregory CM. The role of exercise in the treatment of depression: biological underpinnings and clinical outcomes. Mol Psychiatry. (2023) 28:298–328. doi: 10.1038/s41380-022-01819-w
6. Lan A, Li H, Shen M, Li D, Shu D, Liu Y, et al. Association of depressive symptoms and sleep disturbances with survival among US adult cancer survivors. BMC Med. (2024) 22:225. doi: 10.1186/s12916-024-03451-7
7. Lee S-Y, Lee JP, Lee J, Park JY, Kim EY. Association between depressive symptoms and the risk of all-cause and cardiovascular mortality among US adults. Prog Neuropsychopharmacol Biol Psychiatry. (2023) 125:110755. doi: 10.1016/j.pnpbp.2023.110755
8. The Lancet Global H Mental health matters. Lancet Glob Health. (2020) 8:e1352. doi: 10.1016/s2214-109x(20)30432-0
9. Zhu X, Li R, Zhu Y, Zhou J, Han X, Tong Y, et al. Neutrophil/lymphocyte, platelet/lymphocyte, monocyte/lymphocyte ratios and systemic immune-inflammation index in patients with depression. Bratislava Med Journal-bratislavske Lekarske Listy. (2023) 124:471–4. doi: 10.4149/BLL_2023_072
10. Shan M, Lu S, Cui R, Yang Y, Sun Z, Pan Y. Association between neutrophil to lymphocyte ratio and depression among US adults: From a large population-based cross-sectional study. J Psychosomatic Res. (2022) 162:111041. doi: 10.1016/j.jpsychores.2022.111041
11. Penninx BWJH, Lange SMM. Metabolic syndrome in psychiatric patients: overview, mechanisms, and implications. Dialogues Clin Neurosci. (2018) 20:63–73. doi: 10.31887/DCNS.2018.20.1/bpenninx
12. Pan A, Keum N, Okereke OI, Sun Q, Kivimaki M, Rubin RR, et al. Bidirectional association between depression and metabolic syndrome: a systematic review and meta-analysis of epidemiological studies. Diabetes Care. (2012) 35:1171–80. doi: 10.2337/dc11-2055
13. Watson KT, Simard JF, Henderson VW, Nutkiewicz L, Lamers F, Nasca C, et al. Incident major depressive disorder predicted by three measures of insulin resistance: a Dutch cohort study. Am J Psychiatry. (2021) 178:914–20. doi: 10.1176/appi.ajp.2021.20101479
14. Almeida OP, Yeap BB, Hankey GJ, Golledge J, Flicker L. HDL cholesterol and the risk of depression over 5 years. Mol Psychiatry. (2014) 19:637–8. doi: 10.1038/mp.2013.113
15. Partonen T, Haukka J, Virtamo J, Taylor PR, Lönnqvist J. Association of low serum total cholesterol with major depression and suicide. Br J Psychiatry. (1999) 175:259–62. doi: 10.1192/bjp.175.3.259
16. Kim JM, Stewart R, Kim SW, Shin IS, Yang SJ, Yoon JS. Cholesterol and serotonin transporter polymorphism interactions in late-life depression. Neurobiol Aging. (2011) 32:336–43. doi: 10.1016/j.neurobiolaging.2009.02.017
17. Oh J, Kim TS. Serum lipid levels in depression and suicidality: the Korea National Health and Nutrition Examination Survey (KNHANES) 2014. J Affect Disord. (2017) 213:51–8. doi: 10.1016/j.jad.2017.02.002
18. Persons JE, Fiedorowicz JG. Depression and serum low-density lipoprotein: A systematic review and meta-analysis. J Affect Disord. (2016) 206:55–67. doi: 10.1016/j.jad.2016.07.033
19. Chourpiliadis C, Zeng Yu, Lovik Anikó, Wei D, Valdimarsdóttir U, Song H, et al. Metabolic profile and long-term risk of depression, anxiety, and stress-related disorders. JAMA Netw Open. (2024) 7:e244525. doi: 10.1001/jamanetworkopen.2024.4525
20. Sheng G, Liu D, Kuang M, Zhong Y, Zhang S, Zou Y. Utility of non-high-density lipoprotein cholesterol to high-density lipoprotein cholesterol ratio in evaluating incident diabetes risk. (2022) 15:1677–86. doi: 10.2147/DMSO.S355980
21. Dajpratham P, Pukrittayakamee P, Atsariyasing W, Wannarit K, Boonhong J, Pongpirul K. The validity and reliability of the PHQ-9 in screening for post-stroke depression. BMC Psychiat. (2020) 20:291. doi: 10.1186/s12888-020-02699-6
22. Johnson CL, Paulose-Ram R, Ogden CL, Carroll MD, Kruszon-Moran D, Dohrmann SM. National health and nutrition examination survey: analytic guidelines, 1999-2010. vital Health Stat. (2013) 2:1–24.
23. Zhu X, Yue Ya, Li L, Zhu L, Cai Y, Shu Y. The relationship between depression and relative fat mass (RFM): A population-based study. J Affect Disord. (2024) 356:323–8. doi: 10.1016/j.jad.2024.04.031
24. Chen J, Huang Y, Li X. The association between lymphocyte to high-density lipoprotein ratio and depression: Data from NHANES 2015–2018. Brain And Behav. (2024) 14:e3467. doi: 10.1002/brb3.3467
25. Jacobson TAM, Ito MKP, Maki KCP, Orringer CEM, Bays HEM, Jones PHM, et al. National lipid association recommendations for patient-centered management of dyslipidemia: part 1—full report. J Clin Lipidol. (2015) 9:129–69. doi: 10.1016/j.jacl.2015.02.003
26. Chrysohoou C, Kollia N, Tousoulis D. The link between depression and atherosclerosis through the pathways of inflammation and endothelium dysfunction. Maturitas. (2018) 109:1–5. doi: 10.1016/j.maturitas.2017.12.001
27. Moran LJ, Wilson CJ, Buckley JD, Noakes M, Clifton PM, Brinkworth GD. Changes in endothelial function and depression scores are associated following long-term dietary intervention: a secondary analysis. Nutrition. (2013) 29:1271–4. doi: 10.1016/j.nut.2013.03.023
28. Greaney JL, Saunders EF, Santhanam L, Alexander LM. Oxidative stress contributes to microvascular endothelial dysfunction in men and women with major depressive disorder. Circ Res. (2018) 124:564–574. doi: 10.1161/CIRCRESAHA.118.313764
29. Ong KL, Morris MJ, McClelland RL, Maniam J, Allison MA, Rye K-A. Lipids, lipoprotein distribution and depressive symptoms: the Multi-Ethnic Study of Atherosclerosis. Trans Psychiatry. (2016) 6:e962. doi: 10.1038/tp.2016.232
30. Hummel J, Westphal S, Weber-Hamann B, Gilles M, Lederbogen F, Angermeier T, et al. Serum lipoproteins improve after successful pharmacologic antidepressant treatment: a randomized open-label prospective trial. J Clin Psychiatry. (2011) 72:885–91. doi: 10.4088/JCP.09m05853blu
31. Vilibić M, Jukić V, Pandžić-Sakoman M, Bilić P, Milošević M. Association between total serum cholesterol and depression, aggression, and suicidal ideations in war veterans with posttraumatic stress disorder: a cross-sectional study. Croatian Med J. (2014) 55:520–9. doi: 10.3325/cmj.2014.55.520
32. You H, Lu W, Zhao S, Hu Z, Zhang J. The relationship between statins and depression: a review of the literature. Expert Opin Pharmacotherapy. (2013) 14:1467–76. doi: 10.1517/14656566.2013.803067
33. Zorumski CF, Paul SM, Izumi Y, Covey DF, Mennerick S. Neurosteroids, stress and depression: potential therapeutic opportunities. Neurosci And Biobehav Rev. (2013) 37:109–22. doi: 10.1016/j.neubiorev.2012.10.005
34. Persons JE, Robinson JG, Coryell WH, Payne ME, Fiedorowicz JG. Longitudinal study of low serum LDL cholesterol and depressive symptom onset in postmenopause. J Clin Psychiatry. (2016) 77:212–20. doi: 10.4088/JCP.14m09505
35. Zhu X, Zhao Y, Li Lu. Association of non-HDL-C and depression: a cross-sectional analysis of the NHANES data. Front Psychiatry. (2023) 14:1274648. doi: 10.3389/fpsyt.2023.1274648
36. Baulieu EE. Steroid hormones in the brain: several mechanisms. In: Fuxe K, Gustafsson JA, Wetterberg L, editors. Steroid Hormone Regulation of the Brain. Pergamon Press, Oxford (1981). p. 3–14.
37. Paul SM, Purdy RH. Neuroactive steroids. FASEB J. (1992) 6:2311–22. doi: 10.1096/fasebj.6.6.1347506
38. Zorumski CF, Mennerick S, Isenberg KE, Covey DF. Potential clinical uses of neuroactive steroids. Curr Opin Investigational Drugs. (2000) 1:360–9.
39. Walton NL, Antonoudiou P, Barros L, Dargan T, DiLeo A, Evans-Strong A, et al. Impaired endogenous neurosteroid signaling contributes to behavioral deficits associated with chronic stress. Biol Psychiatry. (2023) 94:249–261. doi: 10.1016/j.biopsych.2023.01.022
40. Le TM, Liao DL, Ide J, Zhang S, Zhornitsky S, Wang W, et al. The interrelationship of body mass index with gray matter volume and resting-state functional connectivity of the hypothalamus. Int J Obes. (2020) 44:1097–1107. doi: 10.1038/s41366-019-0496-8
41. Dekkers IA, Jansen PR, Lamb HJ. Obesity, brain volume, and white matter microstructure at MRI: a cross-sectional UK biobank study. Radiology. (2019) 291:763–71. doi: 10.1148/radiol.2019181012
Keywords: NHHR, depression, NHANES, US adults, cross-sectional study
Citation: Yan C, Wang H, Liu C, Fu J and Zhou Y (2024) Association between non-high-density lipoprotein cholesterol to high-density lipoprotein cholesterol ratio (NHHR) with depressive symptoms: recent findings from NHANES 2005–2018. Front. Psychiatry 15:1467142. doi: 10.3389/fpsyt.2024.1467142
Received: 19 July 2024; Accepted: 14 October 2024;
Published: 05 November 2024.
Edited by:
Jacksaint Saintila, Universidad Señor de Sipán, PeruReviewed by:
Ran Wang, The First Hospital of Hebei Medical University, ChinaShinsuke Hidese, Teikyo University, Japan
Copyright © 2024 Yan, Wang, Liu, Fu and Zhou. This is an open-access article distributed under the terms of the Creative Commons Attribution License (CC BY). The use, distribution or reproduction in other forums is permitted, provided the original author(s) and the copyright owner(s) are credited and that the original publication in this journal is cited, in accordance with accepted academic practice. No use, distribution or reproduction is permitted which does not comply with these terms.
*Correspondence: Yabin Zhou, MTUxNjQ2MzY2ODhAMTYzLmNvbQ==