Abstract
Introduction:
Schizophrenia is a psychiatric disorder hypothesized to result from disturbed brain connectivity. Structural covariance networks (SCN) describe the shared variation in morphological properties emerging from coordinated neurodevelopmental processes, This study evaluates the potential of SCNs as diagnostic biomarker for schizophrenia.
Methods:
We compared the diagnostic value of two SCN computation methods derived from regional gray matter volume (GMV) in 154 patients with a diagnosis of first episode psychosis or recurrent schizophrenia (PAT) and 366 healthy control individuals (HC). The first method (REF-SCN) quantifies the contribution of an individual to a normative reference group’s SCN, and the second approach (KLS-SCN) uses a symmetric version of Kulback-Leibler divergence. Their diagnostic value compared to regional GMV was assessed in a stepwise analysis using a series of linear support vector machines within a nested cross-validation framework and stacked generalization, all models were externally validated in an independent sample (NPAT=71, NHC=74), SCN feature importance was assessed, and the derived risk scores were analyzed for differential relationships with clinical variables.
Results:
We found that models trained on SCNs were able to classify patients with schizophrenia and combining SCNs and regional GMV in a stacked model improved training (balanced accuracy (BAC)=69.96%) and external validation performance (BAC=67.10%). Among all unimodal models, the highest discovery sample performance was achieved by a model trained on REF-SCN (balanced accuracy (BAC=67.03%). All model decisions were driven by widespread structural covariance alterations involving the somato-motor, default mode, control, visual, and the ventral attention networks. Risk estimates derived from KLS-SCNs and regional GMV, but not REF-SCNs, could be predicted from clinical variables, especially driven by body mass index (BMI) and affect-related negative symptoms.
Discussion:
These patterns of results show that different SCN computation approaches capture different aspects of the disease. While REF-SCNs contain valuable information for discriminating schizophrenia from healthy control individuals, KLS-SCNs may capture more nuanced symptom-level characteristics similar to those captured by PCA of regional GMV.
1 Introduction
Schizophrenia has been conceptualized as a neurodevelopmental disorder that features structural deficits across numerous brain regions (1–5), such as widespread gray matter loss and cortical thinning (6–8), which are thought to reflect synaptic density alterations (reviewed in e.g., Howes et al. (2023) (9)). Together with evidence for disrupted neuronal communication underlying the diverse phenotypes of the disorder, these findings have given rise to the “dysconnectivity hypothesis” of schizophrenia, according to which symptoms stem from impaired anatomical and functional connectivity between brain regions rather than only region-specific changes (10–13). Structural changes and altered structural and functional connectivity may be interrelated and associated with similar neurodevelopmental genetic, prenatal, and environmental factors (6–8, 14, 15).
Systems-level alterations in brain organization can also be observed in networks based on brain structure covariance, which describe the shared variation in morphological properties, e.g., gray matter volume (GMV), cortical thickness, surface area, and gyrification of brain regions across a population (16–20). Structural covariance networks (SCNs) emerge from coordinated neurodevelopmental processes (20–23), which reflect anatomical connectivity (24), mutually trophic influences (25), and common experience-driven plasticity (26). SCNs demonstrate small-world organization (27), a well-studied, graph-theoretical property of brain networks, and are organized in modules overlapping with functional domains (28). Structural covariance has been shown to be highly heritable, to change significantly across the lifespan (21–23, 29), and to be linked to IQ (23) and brain disorders, including schizophrenia (30–35), autism (36), attention deficit hyperactivity disorder (ADHD) (37), and Alzheimer’s disease (38).
Studies investigating the topology of structural covariance networks (SCN) in schizophrenia with metrics from graph theory (for an overview, see (39)) suggest qualitative and quantitative differences between SCNs of schizophrenia patients and controls (33). These differences may emerge from alterations of maturational trajectories (40, 41) before the onset of the disorder during (pre-)adolescence and aggravate with disease progression (42, 43). While definitive results from graph theoretical analyses of SCN in schizophrenia regarding implicated regions are still lacking, patterns of structural covariance between fronto-temporal, fronto-parietal and fronto-thalamic covariation seem to be altered (for a systematic review, see Prasad et al. (2022a) (32) and Prasad et al. (2022b) (33)).
The heterogeneity of clinical phenotypes of schizophrenia, may be reflected by variations in structural covariance, in line with the dysconnectivity hypothesis of schizophrenia. While Spreng et al. (34) found no relationship between positive and negative symptoms of psychosis, others report supporting findings (44–46). For example, structural covariance of the salience network has been negatively correlated with symptom severity in first episode psychosis patients (44). Further, dysconnectivity in the thalamus (45) and dorsolateral prefrontal cortex has been linked to various symptoms in schizophrenia patients (46). Additionally, treatment response to antipsychotic medication is related to the morphological reconfiguration of brain networks, i.e., structural covariance (47, 48). Jiang et al. (2022) (47) provided evidence of increased interregional covariance in antipsychotic medication responders compared to non-responders among first-episode schizophrenia patients suggesting that the reconfiguration of morphological architecture, i.e., structural covariance, induced by antipsychotic medication acts as a compensatory mechanism for cortical abnormalities. The heterogeneity in brain structural changes in schizophrenia may be explained by comorbidities and cooccurring medical conditions, such as obesity (49, 50) which is disproportionally frequent among schizophrenia patients (51). Obesity, with body mass index (BMI) being an often employed proxy measure, has been linked to changes in brain structure and connectivity (52–54) and structural covariance alterations (55). Further, both brain structure and structural covariance of the perigenual anterior cingulate cortex has been found to be a predictor of future weight gain (56).
SCNs are typically computed at the group-level by means of correlations (not covariance) across participants (27), and can, thus, only be used to identify group-level differences, making individual diagnosis and prognosis and the discovery of connectivity-based biomarkers impossible. Mapping individual SCN differences can facilitate finding clinical and genetic correlates (35, 43, 57) as well as neuroanatomical patient subtypes. In addition, relationships with clinical and environmental factors may exhibit clearer associations.
To date, few methods have been proposed to estimate individual-level SCNs, which differ with regard to the type and number of morphological properties considered, and whether a normative sample is used for computation (19, 57–65). Here, we compare a normative and a single-image-based approaches that both have frequently been reported. The first approach proposed by Saggar et al. (2015) (62) uses a large reference group of healthy control (HC) individuals to derive individual SCNs. This method defines an individual’s SCN as the difference between a group SCN computed across the reference group and the group SCN computed across the reference group plus the respective individual. This approach was also adopted by Drenthen et al. (2018, 2022) (66, 67). Similarly, Das et al. (2018) (57) proposed to compute an individual’s SCN as the difference between the group SCN of the diagnostic group of the participant and the SCN of the diagnostic group excluding the given individual. The second approach was introduced by Kong et al. (2014) (59) and defines an individual’s SCN computing the pairwise symmetric Kulback-Leibler divergence (KLS) between the probability density functions (PDF) of regional voxel-wise GMV. This method has since been adopted by several studies (58, 64, 68, 69), and most recently extended to the multimodal setting (63).
In this study, our primary objective was to assess the diagnostic validity of two alternative individual SCN estimation methods based on GMV in discriminating patients with schizophrenia from HC individuals. We opted for a simplified binary classification task and linear machine learning algorithms to enable a direct comparison of different feature computation techniques and direct model explainability, leveraging well-established structural brain changes in schizophrenia. To the best of our knowledge, no previous research has investigated the differential and complementary diagnostic value of SCNs derived using these two distinct approaches in comparison to region-of-interest (ROI)-GMV.
We hypothesized that machine learning models trained on individual SCNs would be superior in distinguishing patients with schizophrenia from HC individuals compared to models trained on ROI-GMV. Furthermore, we anticipated that integrating regional GMV and SCN models through a stacking-based approach would lead to enhanced performance, given that these modalities may capture distinct aspects of the disorder. Additionally, we conducted an analysis to identify the most influential regions and structural covariance features driving the classification decisions in the top-performing models.
To gain further insights into the clinical relevance of the feature modalities, we investigated whether the decision scores generated by the regional GMV and SCN models are sensitive to disease phenotypes and thus could explain different aspects of the well-known heterogeneity of schizophrenia. To achieve this, we evaluated the extent to which machine learning could predict decision/risk scores generated from our different SCN or GMV-based models using clinical and demographic variables.
2 Methods
2.1 Datasets for model training and validation
Model training and validation were performed using two independent datasets. The training dataset comprised 366 HC individuals and 154 patients with DSM-IV diagnosis of schizophrenia (see (70) for details). All participants were recruited at the Department of Psychiatry and Psychotherapy, Ludwig-Maximilian-University, Munich, Germany. Henceforth, the sample will be referred to as the MUC sample. The validation dataset was provided by the Mind Research Networks Center for Biomedical Research Excellence (COBRE; https://coins.trendscenter.org) and consisted of 71 patients with chronic schizophrenia (SCZ) and 74 HC individuals. Patients were diagnosed using the Structured Clinical Interview for DSM-IV (SCID (71)). For more information on study procedures, see http://fcon_1000.projects.nitrc.org/indi/retro/cobre.html). The COBRE dataset is distributed under the Creative Commons License, and all participants provided written informed consent according to the ethics review board protocols of the University of New Mexico (UNM) (72). We evaluated demographic differences between diagnostic groups within the two samples using Fisher’s exact test or the Wilcoxon rank sum test with continuity correction. These tests were chosen since not all variables were normally distributed. Additionally, differences between discovery and validation samples were analyzed using the same methods. See Table 1 for detailed sociodemographic and clinical characteristics of both samples.
Table 1
| Variable | MUC sample | COBRE sample | |||||
|---|---|---|---|---|---|---|---|
| HC indiv. N=366 | Patients N=154 | P (t/ W, df) | HC indiv. N=74 | Patients N=71 | P (t/ W, df) | P (t/ W, df) | |
| Mean age in years (SD) | 33.6 (11.2) | 30.8 (10.0) | .006a(2.77, 518) | 35.8 (11.6) | 38.1 (14.0) | .278a (-1.09, 143) | <.001a (-3.57, 206) |
| N sex female (%) | 184 (50.3) | 41 (26.6) | <.001b | 23 (31.1) | 14 (19.7) | .131b | <.001b |
| N left handedness (%) | 47 (12.8) | N/A | 3 (4.1) | 12 (16.9) | .014b | N/A | |
| Mean years in education (SD) | 12.1(1.3) | N/A | 14.4 (3.3) | 13.0 (1.9) | .003c(3.08, 103.36) | N/A | |
| Mean IQ (WASI) (SD) | N/A | 108.4 (22.2) | 100.4 (16.9) | .020a(2.35, 123.31) | N/A | ||
| N first-episode SCZ (%) | 66 (42.9) | N/A | N/A | ||||
| N recurrent SCZ (%) | 88 (57.1) | 71 (100) | |||||
| Mean N Hospitalizations (SD) | 2.0 (2.1) | 5.3 (5.5) | <.001g | ||||
| Mean age at illness onset (SD) | 25.4 (8.1) | 21.1 (7.5) | <.001h | ||||
| Mean illness duration in years(SD) | 4.5 (7.1) | 16.8 (13.0) | <.001i | ||||
| Mean PANSS total score (SD) | 51.6 (28.2) | 58.7 (13.8) | .014 j | ||||
| Mean PANSS positive score (SD) | 11.6 (7.7) | 14.8 (4.8) | <.001k | ||||
| Mean PANSS negative score (SD) | 15.0 (9.7) | 14.6 (4.8) | .692l | ||||
| Mean PANSS general score (SD) | 25.0 (15.5) | 29.2 (8.5) | .010a (-2.59, 213) | ||||
| Mean dose CPZ equiv. (SD) | 341.8 (373.8) | 369.2 (306.0) | .575a (-.56, 163) | ||||
| Mean dose OLZ equiv. (SD) | N/A | 15.2 (11.1) | N/A | ||||
Sociodemographic and clinical characteristics of the Munich (MUC) sample (N=520) and COBRE sample (N=145).
Student’s t-test.
Fisher’s exact test.
Welch’s test; HC, healthy control; df, degrees of freedom; SD, standard deviation; IQ, intelligence quotient, WASI, Wechsler Abbreviated Scale Intelligence; PANSS, Positive And Negative Syndrome Scale; SANS, Scale for the Assessment of Negative Symptoms; CPZ, clozapine, OLZ, olanzapine.
2.2 Reference sample characteristics for individual reference group-based SCNs (REF-SCN) construction
For the construction of the SCNs, 489 HC individuals drawn from the PRONIA study (Personalized Prognostic Tools for Early Psychosis Management; http://proniapredictors.eu/pronia/index.html) and 138 HC individuals from the OASIS-3 release (Online Access Series of Imaging Studies; https://www.oasis-brains.org) served as the reference sample. For the demographic information of the reference sample, see Supplementary Table S2.
2.3 Processing of structural MRI data
High-resolution three-dimensional T1-weighted images were acquired for all participants. MRI data acquisition parameters are detailed in S1.1. All T1-weighted images were processed using the open-source CAT12 toolbox (version r1207 (73), an extension of SPM12 (74). For more information on the preprocessing pipeline see S1.2. From the processed T1-weighted images, regional GMV was computed by summing the voxel-wise GMV values within each region-of-interest (ROI) of two cortical parcellation schemes based on the Schaefer atlas, which divided the cortex in 100 and 200 parcels, respectively (75). The derived regional GMV were used as input features (d=100 and d=200) to the ROI GMV-based ML models.
2.4 Structural covariance networks
We derived two types of SCNs following (1), reference group-based SCNs (REF-SCN) and (2) symmetric KL-divergence based SCNs (KLS-SCN) for the two brain parcellations with 100 and 200 parcels (75). A REF-SCN represented the contribution of an individual to the group SCN of the reference group (62), for details on the network computation see S1.3. Before deriving the REF-SCNs, we accounted for systematic differences between the images across the different sites of the PRONIA sample and the OASIS-3 cohort (see Supplementary Methods). In the KLS-SCNs, an edge is quantified as the symmetric KL-divergence between the probability density functions of voxel-wise GMV. The workflow is described in S1.4. From each SCN modality, we derived two different feature sets which served as input to the ML models, (a) the vectorized upper triangle of the individual connectivity matrices (i.e., edges, E), and (b) network metrics (M), specifically global efficiency, transitivity, eigenvector centrality, strength, and local efficiency (see S1.5).
Taken together, our multi-atlas approach resulted in two ROI-based feature sets and eight SCN-based feature sets for the subsequent multimodal machine learning (ML) classification models: ROI-GMV 100, ROI-GMV 200, REF-SCN-E 100, REF-SCN-E 200, REF-SCN-M 100, REF-SCN-M 200, KLS-SCN-E 100, KLS-SCN-E 200, KLS-SCN-M 100, KLS-SCN-M 200.
2.5 Machine learning classification pipelines: schizophrenia patients vs. healthy control individuals
To assess the diagnostic value of ROI GMV and SCNs for individual classification of schizophrenia patients, we trained a total of 20 unimodal models (for an overview, see Supplementary Figure S3). The models differed with respect to the type of input features (ROI GMV vs. REF-SCN-E vs. KLS-SCN-E vs. REF-SCN-M vs. KLS-SCN-M), the cortical parcellation used (100 vs. 200 parcels), and the type of dimensionality reduction employed in the ML pipeline and algorithm employed (feature selection using LASSO regularization vs. principal component analysis, PCA). While LASSO (L1) regularization and PCA both reduce the dimensionality of the feature set, the resulting low-dimensional features differ significantly in their interpretation. While LASSO regularization acts as a feature selection technique by removing redundant and irrelevant features, PCA extracts information across all features into new orthogonal variance components.
Additional preprocessing steps included in the ML model pipelines differed depending on the dimensionality reduction method used. In the LASSO condition, minimal preprocessing was used for all modalities including adjusting for age and sex effects by partial correlation analysis, followed by feature-wise standardization. The classification algorithm used was a L1-regularized hinge-loss support vector classifier with a dual solver (L1-SVC) implemented in LIBLINEAR (76). In the PCA condition, processing involved adjusting for age and sex effects, PCA with the number of principal components being optimized in the range of nPC ∈ [5, 10, 15, 20, 25], followed by standardization. The classification algorithm used in this condition was a L2-regularized hinge-loss support vector classifier with a dual solver (L2-SVC) implemented in LIBLINEAR. SVC was chosen based on recent findings related to the superior scalability of linear vs. non-linear models in neuroimaging datasets considering the limited available sample sizes (77). To mitigate the effects of class imbalance during training, we adjusted the hyperplane coefficients of our model by giving higher importance to the minority class by multiplying class weights calculated as the inverse of class frequencies.
For each separate dimensionality reduction condition, the trained unimodal models were then combined by using their standardized prediction scores as input to L2-SVCs to create ROI-based, REF-SCN-based, KLS-SCN-based ‘meta-classifiers’ through stacked generalization. Stacked generalization is an ensemble learning approach, where the multi-source, second-level model uses the prediction outputs of the single-source, first-level models to predict the output labels (78). In the SCN-stacked models, edge and metric-based model scores were combined to create unifying SCN models for each of the SCN computation approaches. Finally, the standardized prediction scores of the four resulting meta-learners (again, for each dimensionality reduction condition separately) were used as input for a 3rd-level ROI&SCN-based L2-SVCs multimodal stacked classifier. This resulted in in total six 2nd and two 3rd-level stacked generalization models (for an overview, see Supplementary Figure S3).
The ML pipelines, including preprocessing, were implemented in NeuroMiner (version 1.2, https://github.com/neurominer-git/NeuroMiner_1.2). A repeated nested pooled cross-validation (CV) design was used with 10 outer (CV2) folds, 10 CV2 permutations and 10 inner (CV1) folds without permutations. Nesting was done to completely isolate model performance evaluation which was performed at the CV2 level from hyperparameter optimization conducted at CV1 cycle. All preprocessing steps and the stacked generalization analyses without exception were also conducted within the identical cross-validation structure to avoid overfitting through double-dipping (79).
Balanced accuracy (BAC) was used as the criterion for hyperparameter optimization. To produce a final prediction for the CV2 test data, all models in each CV2 training partition were retrained at the optimal hyperparameter combination using the entire CV2 training data, where optimal performance was defined by the maximum average BAC across the CV1 test data. The retrained models were applied to the CV2 test data of the given CV2 partition, and their decision scores were averaged into an ensemble prediction. Finally, the ensembles were identified across the CV2 permutations in which the given test data was not in the CV2 training fold and their predictions were integrated into a grand mean average decision score and a final class membership prediction. For all models, the slack parameter C of the L1-SVC and L2-SVC was optimized across the values C={2x ∈ ℤ:-6<=x<=4}.
The statistical significance of the models was tested using 1000 random label permutations (80). The training performance in terms of BAC, sensitivity, specificity and AUC of the 28 models was compared using the Quade test followed by post hoc pairwise two-sample t-tests, which were corrected for multiple comparisons using the false-discovery rate (81). Generalization was assessed in terms of BAC, sensitivity, specificity, and AUC when the model was applied to the COBRE dataset for external validation. Prior to external validation, the COBRE data was adjusted to the training dataset by subtracting the difference in regional mean GMV values between the samples.
Global explainability analyses were conducted for the best model in each modality for both feature extraction conditions. The contribution of features to a models’ decisions were measured by means of the cross-validation ratio, a measure of pattern element stability which computes the mean and standard error of all weight vectors across the entire nested cross-validation structure and is inspired by bootstrap ratio (82), and signed-based consistency, a measure of pattern element relevance and significance (83). For the SCN-E models, estimates of regional involvement scores were defined by how often a region was involved in a significantly contributing edge (equal to degree centrality (84) of regions in a feature importance network).
The degree of shared or complementary neuroanatomical information captured by the different modalities was quantified using pairwise Pearson correlations among the decision scores of the models (significance was determined at an FDR-corrected threshold of P=0.05). Additionally, we evaluated the similarity of relevant information within in the feature sets prior to model training (i.e., after the preprocessing steps of the model pipelines were performed outside of the CV framework), specifically focusing on the relationship of ROI-GMV-PCA and the SCN-E models. Mean Pearson correlations of the processed SCN-E features with the first ROI-GMV principal component (PC) were chosen as a measure for this analysis.
Finally, cohort effects on decision scores were tested using t-tests and simple linear regression models including age and sex as additional effects.
2.6 Clinical prediction models
To explore the unique clinical and demographic associations of SCN vs. GMV-based model’s decision scores, we employed linear support vector regressors (SVR) within a repeated nested CV framework, as described above. Models were built with NeuroMiner (version 1.2, https://github.com/neurominer-git/NeuroMiner_1.2). The full model pipelines and training setup are detailed in S1.7. The SVRs were trained to predict the imaging-based decision scores using the patients’ clinical and demographic features such as age, sex, handedness, body mass index (BMI), years of education, information about the illness course (duration, onset, hospitalizations, first-generation antipsychotic medication, duration of untreated psychosis), symptoms assessed using the Positive And Negative Syndrome Scale (PANSS (85) and the Scale for the Assessment of Negative Symptoms (SANS (86), drug usage (for a full list, see S1.7)) within the patient sample of the MUC sample. Similarity of feature importance between the models was assessed using Pearson correlations.
3 Results
3.1 Sociodemographic, clinical, and global anatomical results
In the MUC sample (used for training), patients and HC individuals differed significantly regarding age (NHC=366, NPAT=154, tStudent’s(518)=2.771, P=.006) and sex (Fisher’s exact test, P<.001; see Table 2 for an overview of all sociodemographic data and significance tests). In the COBRE sample (used for external validation), patients exhibited decreased years of education (tWelch’s(103.36)=3.08, P=.003) and IQ (tStudent’s(123.31)=2.35, P=.020) and increased left-handedness (Fisher’s exact test, P=.014; see Table 1) compared to HC individuals. Participants of the COBRE sample were significantly older than those of the MUC sample, and the participants of the samples additionally exhibited a significant difference in sex (%-femalesMUC=43.27, %-femalesCOBRE=25.52, Fisher’s exact test, P<.001). When comparing only the patients of the respective samples, significant differences were found in disease status since the MUC sample, in contrast to the COBRE sample, includes not only patients with a recurrent SCZ but also patients with a diagnosis of first-episode SCZ (42.90%), their number of hospitalizations (W (75)=-4794, P<.001), age at illness onset (W (145)=3859, P<.001), illness duration (W (89)=-7416, P<.001), total (W (216)=-2485, P=.014), positive symptom (W (203)=-3836, P<.001), and general PANSS score (W (213)=-2585, P=.01; see Table 1). The sociodemographic characteristics of the reference sample are depicted in Supplementary Table S1.
Table 2
| Training on MUC sample | Validation on COBRE sample | |||||||
|---|---|---|---|---|---|---|---|---|
| Model | BAC (%) | Sens. (%) | Spec. (%) | AUC | BAC (%) | Sens. (%) | Spec. (%) | AUC |
| ROI-GMV 100 LASSO | 64.50 | 62.34 | 66.67 | .68 | 65.92 | 52.11 | 79.73 | .69 |
| ROI-GMV 200 LASSO | 65.54 | 61.69 | 69.40 | .69 | 61.61 | 39.44 | 83.78 | .65 |
| ROI-GMV stacker LASSO | 63.82 | 62.34 | 65.30 | .69 | 64.54 | 50.70 | 78.38 | .68 |
| ROI-GMV 100 PCA | 62.33 | 59.09 | 65.57 | .68 | 65.89 | 50.70 | 81.08 | .71 |
| ROI-GMV 200 PCA | 64.67 | 61.04 | 68.31 | .70 | 65.19 | 49.30 | 81.08 | .69 |
| ROI-GMV stacker PCA | 64.04 | 61.70 | 66.39 | .70 | 66.60 | 52.11 | 81.08 | .71 |
| REF-SCN-E 100 LASSO | 61.51 | 59.09 | 63.93 | .65 | 53.72 | 16.90 | 90.54 | .48 |
| REF-SCN-E 200 LASSO | 67.03 | 59.74 | 74.32 | .72 | 56.32 | 45.07 | 67.57 | .57 |
| REF-SCN-M 100 LASSO | 60.73 | 62.99 | 58.47 | .61 | 52.09 | 36.62 | 67.57 | .47 |
| REF-SCN-M 200 LASSO | 60.14 | 48.70 | 71.58 | .64 | 55.89 | 23.94 | 87.84 | .59 |
| REF-SCN stacker LASSO | 68.11 | 62.99 | 73.22 | .73 | 50.60 | 29.58 | 71.62 | .57 |
| REF-SCN-E 100 PCA | 53.69 | 50.00 | 57.38 | .57 | 47.84 | 26.76 | 68.92 | .47 |
| REF-SCN-E 200 PCA | 64.74 | 53.25 | 76.23 | .69 | 57.38 | 30.99 | 83.78 | .61 |
| REF-SCN-M 100 PCA | 51.93 | 62.34 | 41.53 | .53 | 44.07 | 40.85 | 47.30 | .41 |
| REF-SCN-M 200 PCA | 63.17 | 50.65 | 75.68 | .67 | 61.55 | 36.62 | 86.49 | .60 |
| REF-SCN stacker PCA | 63.78 | 53.25 | 74.32 | .68 | 56.74 | 32.39 | 81.08 | .63 |
| KLS-SCN-E 100 LASSO | 56.88 | 35.06 | 78.69 | .61 | 52.87 | 8.45 | 97.30 | .50 |
| KLS-SCN-E 200 LASSO | 64.34 | 44.81 | 83.88 | .70 | 55.66 | 12.68 | 98.65 | .54 |
| KLS-SCN-M 100 LASSO | 56.44 | 46.75 | 66.12 | .58 | 49.16 | 25.35 | 72.97 | .50 |
| KLS-SCN-M 200 LASSO | 60.55 | 53.90 | 67.21 | .62 | 60.26 | 39.44 | 81.08 | .58 |
| KLS-SCN stacker LASSO | 61.70 | 59.74 | 63.66 | .67 | 47.95 | 32.39 | 63.51 | .54 |
| KLS-SCN-E 100 PCA | 57.12 | 57.14 | 57.10 | .59 | 64.63 | 54.93 | 74.32 | .46 |
| KLS-SCN-E 200 PCA | 60.01 | 59.09 | 60.93 | .63 | 50.89 | 43.66 | 58.11 | .65 |
| KLS-SCN-M 100 PCA | 56.15 | 55.19 | 57.10 | .58 | 64.07 | 60.56 | 67.57 | .49 |
| KLS-SCN-M 200 PCA | 54.63 | 53.25 | 56.01 | .61 | 63.28 | 54.93 | 71.62 | .64 |
| KLS-SCN stacker PCA | 59.24 | 59.74 | 58.74 | .61 | 57.24 | 23.94 | 90.54 | .64 |
| ROI SCN stacker LASSO | 69.97 | 67.53 | 72.40 | .75 | 59.30 | 25.35 | 93.24 | .65 |
| ROI SCN stacker PCA | 64.43 | 59.74 | 69.13 | .71 | 67.10 | 43.66 | 90.54 | .71 |
Classification model performances.
BAC, balanced accuracy; AUC, area under the curve.
3.2 Results: classification models
Of all unimodal models trained on the MUC dataset, the LASSO-regularized classifier trained on REF-SCN-E 200 achieved the highest diagnostic performance, with a BAC of 67.03% (sensitivity=59.74%, specificity=74.32%, P<.001; Table 2). However, its external validity in the COBRE sample was limited, showing a BAC of 56.32% (sensitivity=45.07%, specificity=67.56%, P=.035; Table 2). This model significantly outperformed the other unimodal models, except for the ROI-GMV models, as determined by the Quade’s test (W (27, 2673)=29.49, P<.001) and post-hoc pairwise comparisons. All ROI-GMV based models demonstrated similar training performance without statistically significant differences and maintained their performance on the external validation set (see Table 2). When comparing the training performance of unimodal models and multimodal stacked models, the second-level multimodal classifier based on the LASSO-regularized models, performed significantly better than any other models (BAC=69.96%, sensitivity=67.53%, specificity=72.40%, P<.001). However, this classifier exhibited no significantly better-than-change generalizability when validated on the COBRE sample (BAC=59.30%, sensitivity=25.35%, specificity=93.24%, P=.283). The corresponding ROC curves for the unimodal 200-parcellation models are shown in Supplementary Figure S4.
For the ROI-GMV-200-LASSO model, sign-based consistency mapping (thresholded at -log10-p>1.3) showed that the GMV of 13 out of the 200 regions in the somatomotor network contributed significantly to the model’s decision function (Figure 1). In contrast, 137 out of the 200 regions contributed to the ROI-GMV-200-PCA model’s decision function, mostly including regions in the default mode, frontoparietal, visual, limbic and somatomotor networks (Figure 1). Post-hoc pairwise comparisons revealed that patients with schizophrenia showed reduced GMV in all these regions compared to HC. For the REF-SCN-E-200-LASSO model and respective PCA-based model, 0.56% and 80.17% of edge weights contributed significantly to the model’s decision function (as determined by sign-based consistency mapping, -log10-p>1.3). In the LASSO model, regions most often connected by edge weight features mapped to the retrosplenial, occipital, and temporal cortices (Figure 2). The corresponding PCA model showed lateral and ventrolateral PFC regions to be most important for prediction, as well as some areas of the occipital lobe (Figure 2). In the KLS-SCN-E-200-LASSO model and respective PCA-based model, 3.29% and 70.54% of edge weights contributed to models’ predictions. The involved regions were in the PFC, precuneus and the occipital and temporal lobe.
Figure 1

Reliable brain regions for classifying schizophrenia versus controls using two multivariate approaches applied to 200-parcel gray matter volume (GMV) features: (A) LASSO-regularized logistic regression with embedded feature selection; (B) Principal Component Analysis (PCA). Significant regions are defined using sign-based consistency mapping with FDR-corrected p-values (< 0.05). Colors indicate the median feature weight across cross-validation folds, with blue representing negative weights and yellow representing positive weights.
Figure 2
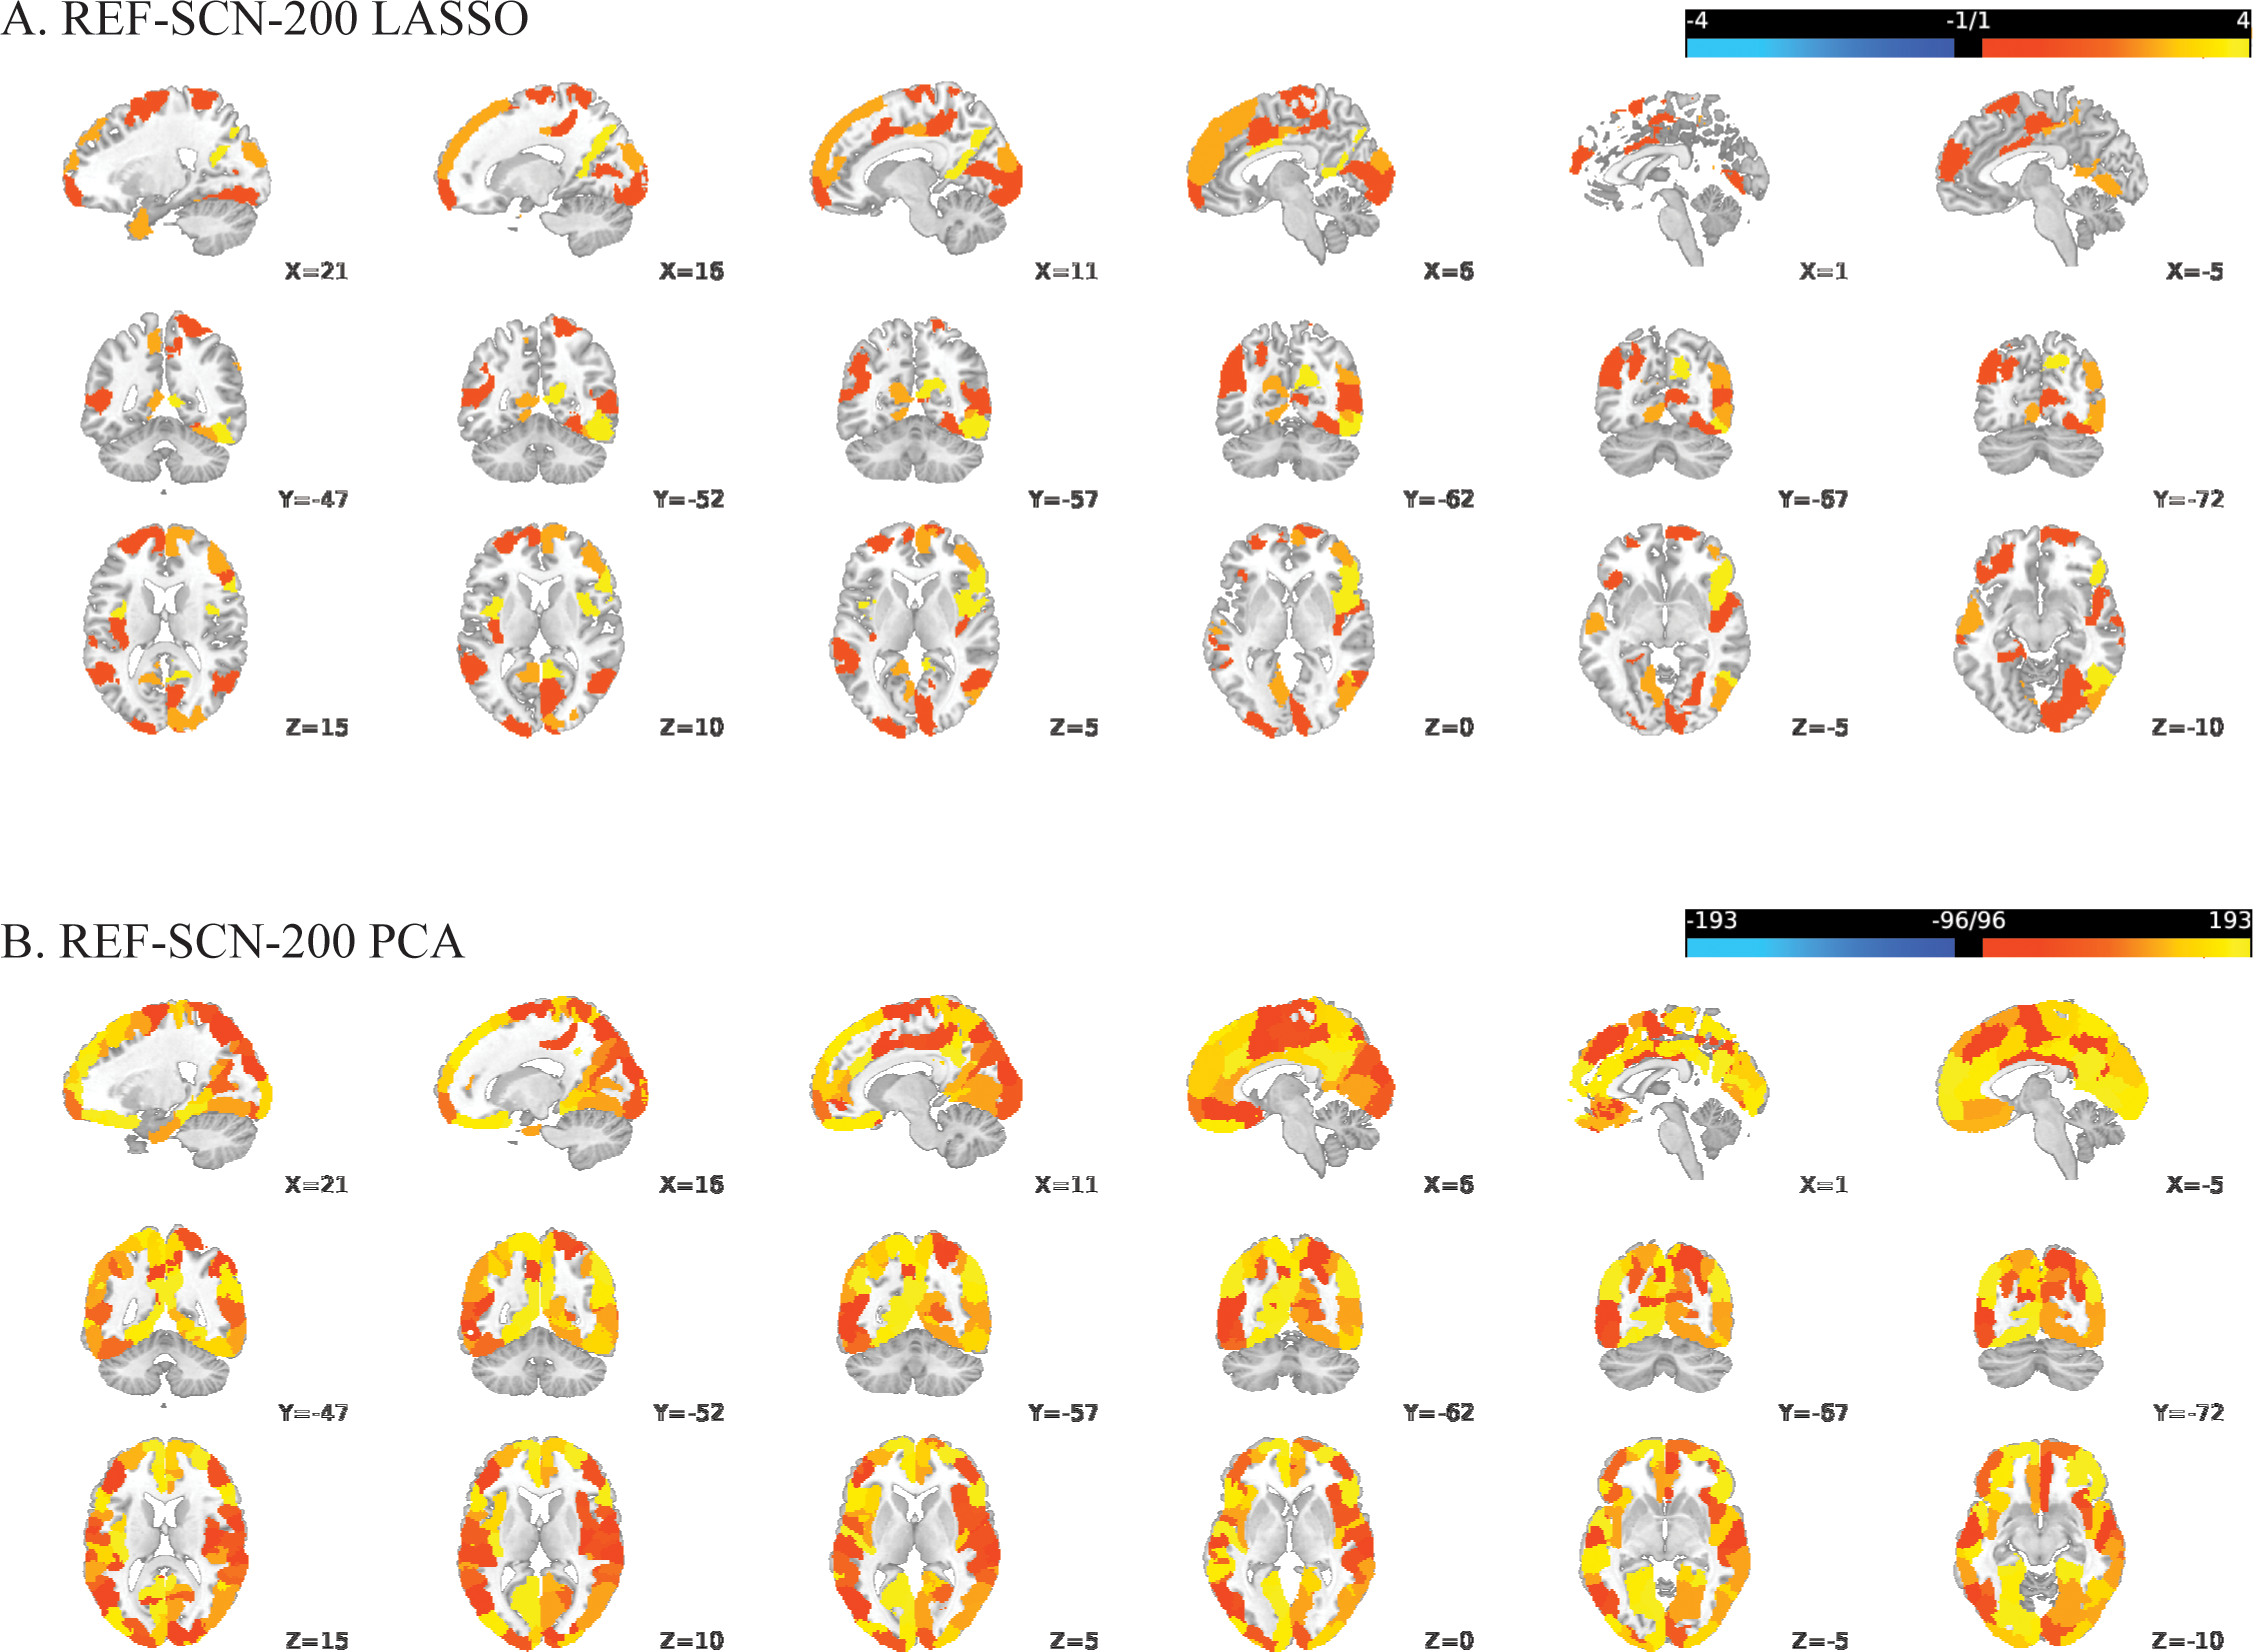
Regional involvement in reliable structural covariance connections predictive of schizophrenia versus controls, based on REF-SCN edge weights derived from a 200-parcel atlas: (A) LASSO-regularized feature selection; (B) Principal Component Analysis (PCA). Significant connections were identified using sign-based consistency mapping with FDR-corrected p-values (< 0.05). Regional involvement is defined as the absolute number of significant connections per region (nodal degree) and reflected by the color gradient, with brighter shades indicating higher connectivity participation.
Significant Pearson correlations (FDR-corrected) were observed among the mean decision scores of the unimodal 200-parcellation-based models, as detailed in Supplementary Table S3. Notably, looking at the relationship between ROI and SCN models respectively, there was a strong correlation observed between the decision scores of the KLS-SCN-E-200-LASSO and ROI-GMV-200-PCA models (r (518)=.94, P<.0001). This high association was driven by high associations in the feature sets before model training; specifically, the first PC of the age and sex-corrected, standardized ROI-GMV-200-PCA features exhibited strong correlations with the respective edges which served as input features in the KLS-SCN-E-200 model (mean r[range]=.69 [.31-.90]) but not those of the REF-SCN-E-200 model (mean r[range]=.04 [-.15-.21]).
Decision scores of the MUC sample were significantly (FDR-corrected P<.05) higher than those in the COBRE sample for 22 of the 28 models (see Supplementary Table S4). The cohort effect on decision scores as tested in simple linear regression models whilst controlling for sex and age was significant for 14 of the 28 models (FDR-corrected, see Supplementary Table S5).
3.3 Results: clinical prediction models
Linear SVR models trained on clinical and sociodemographic data showed the ability to predict the decision scores of the KLS-SCN-E-200 LASSO-regularized model and the ROI-GMV-200 PCA model, but not any of the REF-SCN-based models. The best model performance in terms of R2 was observed for the model predicting the decision scores of the KLS-SCN-E 200 LASSO-regularized model (R2 = 11.01, MSE=0.10), and those of the ROI-GMV-200 PCA model (R2 = 9.01, MSE=0.10). For the KLS-SCN-E LASSO decision score model, 54 of the clinical features contributed significantly to the prediction (sign-based consistency mapping), with BMI, and affective negative symptoms assessed with the SANS (precisely, “unchanging facial expression”, “inappropriate affect”, “paucity of expressive gestures”, as well as the summary scores for Affective Flattening or Blunting and Alogia) and the PANSS (precisely, “excitement”, “tension”), and first-generation antipsychotic medication (yes/no, and dosage) contributing most strongly (as defined by cross-validation ratio based on the median). The prediction of the ROI-GMV PCA decision score model was significantly driven by 46 out of the 87 clinical features. The features with the highest cross-validation ratios (median) were the same as those of the KLS-SCN-E-200 LASSO decision score model. The Pearson correlation of the cross-validation ratio (median) feature scores of the two models was r=.99 (P<.001).
4 Discussion
In this study, we assessed the shared and complementary predictive value of cortical structural covariance for the diagnostic classification of patients with schizophrenia. The prediction model trained on the edges of the individual SCNs defined in terms of the contribution to a healthy reference group, achieved the highest classification performance during training and external validation. This model outperformed those trained on individual SCN defined in terms of KL divergence between regional voxel probability density functions. However, it did not show significant improvements over models trained on ROI-GMV. Although a multimodal stacked model performed better during training, it did not generalize to the external validation set.
In line with our expectations, ROI-GMV was informative in diagnosing patients with schizophrenia with a discovery-sample performance of BAC=62.33 – 65.54%. This was consistent across different brain parcellations and dimensionality reduction techniques. The finding that schizophrenia can be detected at the level of the individual from regional morphological information has frequently been reported with models reaching performance accuracies between 60 and 80% (87, 88). Likewise, models trained on individual SCNs were able to classify patients with schizophrenia from HC individuals, consistently across cortical parcellations and dimensionality reduction technique with BAC=60.14 – 68.11% for REF-SCNs and BAC=56.16 – 64.34% for KLS-SCNs. The performance of our KLS-SCN-E models were comparable to those reported by (89) who classified patients with schizophrenia and HC individuals employing edge weights derived from KLS-SCNs in several samples, amongst others, the COBRE sample used as the independent validation set here. They observed highly varying accuracies ranging from 56% to 81.50% (89). One possible explanation for our lower training performance of both ROI-GMV and SCN models might be our focus on cortical regions only. Subcortical regions and their connectivity have previously been shown to be of great importance in the pathophysiology of schizophrenia with studies reporting especially the thalamus and caudate, but also the hippocampus as well as various subcortical areas to have significantly altered connectivity properties (2, 90–95). Additionally, subcortical areas have been proposed to drive fronto-striato-thalamic dysconnectivity in schizophrenia since first episode psychosis patients displayed no significant differences but with ongoing disease thalamic dysconnectivity may become more pronounced (96). Lei et al. (2020) (89) constructed their SCNs based on the automated anatomical labeling (AAL) parcellation atlas, which spans the whole brain. Computing the pairwise similarity between these regions might capture different information compared to our networks defined solely based on the cortical regions of the Schaefer atlases. Here, we focused solely on cortical regions and cortical SCNs because analyses of scanner and scanning protocol differences between the MUC and COBRE samples revealed pronounced effects predominantly in subcortical regions. However, the inclusion of subcortical brain regions and the use of different parcellation schemes or atlases should be assessed in the future (87, 97). Finally, with respect to the SCN models, the choice of engineered features, i.e., edge weights and network metrics, may have caused loss of diagnostic information. The edge-weight-based models may have missed valuable spatial information regarding network topology. Likewise, the network metric computation step involved the selection of network metrics applicable for the properties of brain networks, thereby introducing the possibility of missing valuable information. Our results show that network metrics produce less reliable results than the SCN modalities and are in line with previous reports on graph metrics being less informative than connectome-wide functional connectivity in such classification tasks (2). In this study, we focused on linear ML models, yet, state-of-the-art graph learning methods include kernel-based methods and graph neural networks (GNNs) (98, 99) and might be more suitable for network structured data. While GNNs are increasingly gaining popularity and are increasingly employed to study functional and anatomical connectivity (100–103), there is still limited consensus on how to best apply them to the unique characteristics of brain networks. Considering that training a neural network requires large samples GNNs might in future be especially interesting for individual SCN analysis since sMRI images are typically more easily and efficiently acquired than fMRI and DTI. Here, we opted for linear models due to our limited sample size as well as for straight-forward model explainability.
Our global model explainability results give insights into what regions drove the decisions in our predictive tasks. The identified regions lie in functional networks (104) which have been previously found altered in schizophrenia. Structural alterations in the somatomotor network, the default mode, frontoparietal control, visual and limbic networks informed the decision of the ROI-GMV models. For SCN-based models, the predictive regions mapped to the ventral attention, default mode, frontoparietal control, visual, and somatomotor networks. For REF-SCN, the dorsal attention network was specifically predictive, while for the KLS-SCN, additionally orbital frontal-temporopolar (“limbic” in YEO’s terminology) networks were identified. These findings are in line with findings of widespread GMV loss (105) and disrupted structural covariance (34, 106, 107) and functional connectivity in schizophrenia (92, 94, 96, 108–111). For example (106), found alterations in cortical SCNs especially in PFC regions, while (34) and (107) found reductions in structural integrity of both the frontoparietal and the salience networks but no differences in the dorsal attention, motor and sensory networks. Studies investigating functional connectivity in schizophrenia reported alterations in overall connectivity (110) with regional disruptions being most prominent in the default mode network (reduced and increased connectivity reported) (92, 108, 111), between the dorsal medial PFC and the medial temporal lobe (111), in the frontoparietal network (108), in the sensorimotor cortex, right lateral prefrontal cortex, left insula, and right lingual gyrus (110). Recently, the visual and sensorimotor network have also been implicated in schizophrenia with findings of connector hubs in these regions, as well as in the insula and calcarine (94). While altered connectivity in the frontoparietal network in schizophrenia is consistent across studies, findings are not as clear for the default mode and other networks. Generally, the use of PCA as a dimensionality reduction method resulted in models that were less spatially specific compared to LASSO-regularized models. Additionally, the models based on the same modality (i.e., ROI-GMV, REF-SCN, and KLS-SCN) showed more similarities in significant regions compared to models based on the other modalities.
Our finding that the multimodal stacked generalization model incorporating information from ROI-GMV, REF-SCN, and KLS-SCN outperformed the models trained on one of the modalities alone in terms of discovery performance highlights their complementary diagnostic value. Especially the REF-SCNs seem to capture differential aspects compared to KLS-SCN (E-LASSO) and ROI-GMV (PCA) which resulted in highly associated risk estimates. Further, our findings revealed stronger associations between clinical variables and the derived risk scores of KLS-SCN-E-LASSO and ROI-GMV compared to REF-SCN based models. Taken together, this suggests that KLS-SCN and ROI-GMV features may capture similar disease related information, while deriving REF-SCNs ‘solely’ quantifies whether an individual is similar to the reference group (i.e., has a low deviation) or not (i.e., deviates strongly) whilst discounting information about differential clinical aspects across patients. The role of the reference group’s composition and characteristics should be investigated in the future; capturing the deviation of structural covariance of individuals from reference groups consisting of individuals with different clinical or demographic profiles (instead of healthy individuals) might prove more useful, e.g., in terms of deriving ‘closeness’ scores to different diagnostic brain states (or ‘closeness to younger/older brains’).
Our clinical prediction models revealed that BMI was the strongest predictor of KLS-SCN and ROI-GMV based risk scores for schizophrenia. BMI, an indicator of body fat, has frequently been linked to schizophrenia and both conditions are associated with brain structural changes in many of the same regions. The effects of obesity and schizophrenia appear to be additive, with patients with schizophrenia who have a higher BMI showing more pronounced alterations in brain structure (50). Further, a recent study found disturbed structural covariance between regions in reward and control networks associated with obesity status (112). In general, the ability of SCNs to map individual differences, besides a schizophrenia diagnosis, was investigated by a few studies in various individual prediction tasks. The results mainly suggest limited gained value, e.g., when predicting brain age in adolescents with ADHD and HC individuals (113), or cognitive functioning in patients with Alzheimer’s (114). Increasing efforts are being made with regard to multi-view SCNs combining different morphological modalities when computing the individual SCNs (19, 63) producing promising results, e.g., establishing a link between schizophrenia-related genes and abnormal structural covariance, for brain age prediction (115), and, recently, showing disturbed structural covariance among obese people (112).
We must note a few limitations of our study. First, the patients in the training and validation data exhibited different clinical profiles. The MUC sample included not only patients with chronic schizophrenia but also those at earlier stages of the disorder. This variability could have confounded the algorithm’s decisions, as alterations in brain structure might be less pronounced in patients experiencing a first episode of psychosis. Second, as previously mentioned, our choice of cortical brain parcellations could have led to discarding valuable information. Repeating the analysis with different brain parcellations would further enhance robustness of the findings. Third, we lacked detailed information regarding medication intake beyond whether antipsychotics or antidepressants were used. Including specific substances, duration, and cumulative dosage would have provided more nuanced insights into their (differential) impact on regional brain structure and structural covariance. Additionally, information on patients’ drug consumption was limited to whether they smoked cigarettes and drank alcohol and took any other drugs (yes/no). Including data on which specific other drugs, e.g., cannabis, they used would have been valuable.
In conclusion, despite some open questions and the limitations mentioned above, our study demonstrates that individual SCNs estimated by means of deviation from a healthy reference sample or KL-divergence contain information for the classification of schizophrenia, beyond information contained in ROI-GMV. Whilst only performing modest in terms of classification accuracy, KLS-SCNs effectively captured clinical differences in patients with schizophrenia, primarily driven by BMI and negative symptoms, similar to information extracted by PCA on ROI-GMV features. Therefore, individual SCNs, as a proxy for brain dysconnectivity, may advance the search for biomarkers of schizophrenia.
Statements
Data availability statement
The original contributions presented in the study are included in the article/Supplementary Material. Further inquiries can be directed to the corresponding author.
Ethics statement
The studies involving humans were approved by University of New Mexico (UNM). The studies were conducted in accordance with the local legislation and institutional requirements. Written informed consent for participation in this study was provided by the participants’ legal guardians/next of kin.
Author contributions
CV: Conceptualization, Formal Analysis, Investigation, Methodology, Project administration, Software, Supervision, Visualization, Writing – original draft. AnB: Investigation, Writing – original draft. DD: Conceptualization, Supervision, Writing – original draft, Methodology. MM: Conceptualization, Writing – original draft. AR: Data curation, Writing – original draft. KC: Data curation, Writing – review & editing. LK-I: Data curation, Writing – review & editing. LA: Data curation, Writing – review & editing. SR: Data curation, Writing – review & editing. JK: Data curation, Writing – review & editing. MR: Data curation, Writing – review & editing. TL: Data curation, Writing – review & editing. AR-R: Data curation, Writing – review & editing. RU: Data curation, Writing – review & editing. RS: Data curation, Writing – review & editing. JH: Data curation, Writing – review & editing. CP: Data curation, Writing – review & editing. RL: Data curation, Writing – review & editing. EM: Data curation, Writing – review & editing. SW: Data curation, Writing – review & editing. PB: Data curation, Writing – review & editing. SB: Data curation, Writing – review & editing. PF: Data curation, Writing – review & editing. AlB: Data curation, Writing – review & editing. NK: Conceptualization, Software, Supervision, Writing – original draft, Writing – review & editing.
Funding
The author(s) declare that financial support was received for the research and/or publication of this article. PRONIA is a Collaboration Project funded by the European Union under the 7th Framework Programme under grant agreement n° 602152. NK is supported through grants from NIH (U01MH124639-01; ProNET), the Wellcome Trust, the German Innovation Fund (CARE project), the German Federal Ministry of Education and Research (COMMITMENT and BEST projects), as well as ERA PerMed (IMPLEMENT project). DP was supported by the Else-Kröner-Fresenius-Foundation through the Clinician Scientist Program ‘EKFS-Translational Psychiatry’.
Acknowledgments
AB would like to express sincere gratitude to Julius-Maximilians University and the Translational Neuroscience study program, as well as the Elitenetzwerk Bayern, for their invaluable support.
Conflict of interest
AlB reports speaker fees from Otsuka, Lundbeck, Angelini and Rovi outside of the submitted work. JH reports personal fees from Orion ltd, personal fees from Lundbeck, personal fees from Otsuka and others from Takeda during the conduct of the study. NK, SR, and AR-R report grants from European Union over the duration of the study. EM and NK hold patent US20160192889A1 ‘Adaptive pattern recognition for psychosis risk modelling’. NK reports speaker fees from Otsuka, Roche and Angelini outside of the submitted work. CP reports grants from Australian NHMRC during the study, and personal fees from Lundbeck, Australia Pty Ltd outside the submitted work. RU reports speaker fees from Sunovion, Otsuka and Vitaris outside the submitted work as well as unpaid officership with the British Association for Pharmacology - Honorary General Secretary 2021-2024. She serves as Deputy Editor for The British Journal of Psychiatry. PF reports he has received research support/honoraria for lectures or advisory activities from Boehringer-Ingelheim, Janssen, Lundbeck, Otsuka, Recordati and Richter outside the submitted work. CP was supported by an Australian National Health and Medical Research Council NHMRC L3 Investigator Grant 1196508 outside the submitted work. LK-I reports receiving a NARSAD Young Investigator Award of the Brain & Behavior Research Foundation No° 28474 PI: LK-I outside the submitted work. Dr Milaneschi reports consulting fees from Noema Pharma outside the submitted work. RU reports support from the UK NIHR Oxford Health Biomedical Research Centre.
The remaining authors declare that the research was conducted in the absence of any commercial or financial relationships that could be construed as a potential conflict of interest.
Generative AI statement
The author(s) declare that no Generative AI was used in the creation of this manuscript.
Publisher’s note
All claims expressed in this article are solely those of the authors and do not necessarily represent those of their affiliated organizations, or those of the publisher, the editors and the reviewers. Any product that may be evaluated in this article, or claim that may be made by its manufacturer, is not guaranteed or endorsed by the publisher.
Author disclaimer
The views expressed are those of the authors and not necessarily those of the NIHR or the Department of Health and Social Care.
Supplementary material
The Supplementary Material for this article can be found online at: https://www.frontiersin.org/articles/10.3389/fpsyt.2025.1570797/full#supplementary-material
The PRONIA consortium
The following authors participated in the screening, recruitment, rating, examination, and follow-up of the study participants used in the current analyses. The authors are listed in alphabetical order according to the institution of affiliation.
Department of Psychiatry and Psychotherapy, Ludwig-Maximilian-University, Munich, Germany: Shalaila Haas, Alkomiet Hasan, Claudius Hoff, Ifrah Khanyaree, Camilla Krämer, Aylin Melo, Susanna Muckenhuber-Sternbauer, Yanis Köhler, Oemer Faruk Oeztuerk, Nora Penzel, David Popovic, Adrian Rangnick, Sebastian von Saldern, Rachele Sanfelici, Moritz Spangemacher, Ana Tupac, Maria Fernanda Urquijo, Johanna Weiske, Antonia Wosgien.
Department of Psychiatry and Psychotherapy, University of Cologne, Cologne, Germany: Karsten Blume, Dennis Hedderich, Dominika Julkowski, Nathalie Kaiser, Thorsten Lichtenstein, Ruth Milz, Alexandra Nikolaides, Tanja Pilgram, Mauro Seves, Martina Wassen.
Department of Psychiatry (Psychiatric University Hospital, UPK), University of Basel, Switzerland: Christina Andreou, Laura Egloff, Fabienne Harrisberger, Ulrike Heitz, Claudia Lenz, Letizia Leanza, Amatya Mackintosh, Renata Smieskova, Erich Studerus, Anna Walter, Sonja Widmayer.
Institute of Mental Health & School of Psychology, University of Birmingham, United Kingdom: Chris Day, Sian Lowri Griffiths, Mariam Iqbal, Mirabel Pelton, Pavan Mallikarjun, Alexandra Stainton, Ashleigh Lin.
Department of Psychiatry, University of Turku, Finland: Alexander Denissoff, Anu Ellilä, Tiina From, Markus Heinimaa, Tuula Ilonen, Päivi Jalo, Heikki Laurikainen, Antti Luutonen, Akseli Mäkela, Janina Paju, Henri Pesonen, Reetta-Liina Säilä, Anna Toivonen, Otto Turtonen.
Department of Psychiatry (Psychiatric University Hospital LVR/HHU Düsseldorf), University of Düsseldorf, Germany: Sonja Botterweck, Norman Kluthausen, Gerald Antoch, Julian Caspers, Hans-Jörg Wittsack.
Department of Basic Medical Science, Neuroscience and Sense Organs - University of Bari Aldo Moro: Giuseppe Blasi, Giulio Pergola, Grazia Caforio, Leonardo Fazio, Tiziana Quarto, Barbara Gelao, Raffaella Romano, Ileana Andriola, Andrea Falsetti, Marina Barone, Roberta Passiatore, Marina Sangiuliano.
Department of Psychiatry and Psychotherapy of the University of Münster, Germany: Marian Surmann, Olga Bienek, Udo Dannlowski.
General Electric Global Research Inc., USA.
Ana Beatriz Solana, Manuela Abraham, Timo Schirmer.
Workgroup of Paolo Brambilla, University of Milan, Italy:
Department of Neuroscience and Mental Health, Fondazione IRCCS Ca’ Granda Ospedale Maggiore Policlinico, University of Milan, Milan, Italy: Carlo Altamura, Marika Belleri, Francesca Bottinelli, Adele Ferro, Marta Re
Programma2000, Niguarda Hospital, Milan: Emiliano Monzani, Maurizio Sberna
San Paolo Hospital, Milan: Armando D’Agostino, Lorenzo Del Fabro
Villa San Benedetto Menni, Albese con Cassano (CO): Giampaolo Perna, Maria Nobile, Alessandra Alciati
Workgroup of Paolo Brambilla at the University of Udine, Italy.
Department of Medical Area, University of Udine, Udine, Italy: Matteo Balestrieri, Carolina Bonivento, Giuseppe Cabras, Franco Fabbro.
IRCCS Scientific Institute “E. Medea”, Polo FVG, Udine: Marco Garzitto, Sara Piccin.
References
1
Dietsche B Kircher T Falkenberg I . Structural brain changes in schizophrenia at different stages of the illness: a selective review of longitudinal magnetic resonance imaging studies. Aust N Z J Psychiatry. (2017) 51:500–8. doi: 10.1177/0004867417699473
2
Lei D Pinaya WHL van Amelsvoort T Marcelis M Donohoe G Mothersill DO et al . Detecting schizophrenia at the level of the individual: relative diagnostic value of whole-brain images, connectome-wide functional connectivity and graph-based metrics. Psychol Med. (2020) 50:1852–61. doi: 10.1017/S0033291719001934
3
Torres US Duran FLS Schaufelberger MS Crippa JAS Louzã MR Sallet PC et al . Patterns of regional gray matter loss at different stages of schizophrenia: a multisite, cross-sectional VBM study in first-episode and chronic illness. NeuroImage: Clinical. (2016) 12:1–15. doi: 10.1016/j.nicl.2016.06.002
4
Vita A De Peri L Deste G Sacchetti E . Progressive loss of cortical gray matter in schizophrenia: a meta-analysis and meta-regression of longitudinal MRI studies. Transl Psychiatry. (2012) 2:e190–0. doi: 10.1038/tp.2012.116
5
Zhao C Zhu J Liu X Pu C Lai Y Chen L et al . Structural and functional brain abnormalities in schizophrenia: a cross-sectional study at different stages of the disease. Prog Neuropsychopharmacol Biol Psychiatry. (2018) 83:27–32. doi: 10.1016/j.pnpbp.2017.12.017
6
Chan RCK Di X McAlonan GM Gong Q-Y . Brain anatomical abnormalities in high-risk individuals, first-episode, and chronic schizophrenia: an activation likelihood estimation meta-analysis of illness progression. Schizophr Bull. (2011) 37:177–88. doi: 10.1093/schbul/sbp073
7
Fusar-Poli P Borgwardt S Crescini A Deste G Kempton MJ Lawrie S et al . Neuroanatomy of vulnerability to psychosis: a voxel-based meta-analysis. Neurosci Biobehav Rev. (2011) 35:1175–85. doi: 10.1016/j.neubiorev.2010.12.005
8
Rapoport JL Giedd JN Gogtay N . Neurodevelopmental model of schizophrenia: update 2012. Mol Psychiatry. (2012) 17:1228–38. doi: 10.1038/mp.2012.23
9
Howes OD Onwordi EC . The synaptic hypothesis of schizophrenia version III: a master mechanism. Mol Psychiatry. (2023) 28:1843–56. doi: 10.1038/s41380-023-02043-w
10
Borgwardt SJ McGuire PK Aston J Berger G Dazzan P Gschwandtner UTE et al . Structural brain abnormalities in individuals with an at-risk mental state who later develop psychosis. Br J Psychiatry. (2007) 191:s69–75. doi: 10.1192/bjp.191.51.s69
11
Friston K Brown HR Siemerkus J Stephan KE . The dysconnection hypothesis (2016). Schizophr Res. (2016) 176:83–94. doi: 10.1016/j.schres.2016.07.014
12
Friston KJ Frith CD . Schizophrenia: a disconnection syndrome. Clin Neurosci. (1995) 3:89–97.
13
Wernicke C . Grundriss der Psychiatrie in klinischen Vorlesungen. Stuttgart, Germany: Thieme (1906).
14
Kochunov P Hong LE . Neurodevelopmental and neurodegenerative models of schizophrenia: white matter at the center stage. Schizophr Bull. (2014) 40:721–8. doi: 10.1093/schbul/sbu070
15
van Os J Kapur S . Schizophrenia. Lancet Lond Engl. (2009) 374:635–45. doi: 10.1016/S0140-6736(09)60995-8
16
Alexander-Bloch A Giedd JN Bullmore E . Imaging structural co-variance between human brain regions. Nat Rev Neurosci. (2013) 14:322–36. doi: 10.1038/nrn3465
17
Yun J-Y Boedhoe PSW Vriend C Jahanshad N Abe Y Ameis SH et al . Brain structural covariance networks in obsessive-compulsive disorder: a graph analysis from the ENIGMA Consortium. Brain. (2020) 143:684–700. doi: 10.1093/brain/awaa001
18
Palaniyappan L Park B Balain V Dangi R Liddle P . Abnormalities in structural covariance of cortical gyrification in schizophrenia. Brain Struct Funct. (2015) 220:2059–71. doi: 10.1007/s00429-014-0772-2
19
Seidlitz J Váša F Shinn M Romero-Garcia R Whitaker KJ Vértes PE et al . Morphometric similarity networks detect microscale cortical organization and predict inter-individual cognitive variation. Neuron. (2018) 97:231–47. doi: 10.1016/j.neuron.2017.11.039
20
Mechelli A Friston KJ Frackowiak RS Price CJ . Structural covariance in the human cortex. J Neurosci. (2005) 25:8303–10. doi: 10.1523/JNEUROSCI.0357-05.2005
21
Thompson PM Sowell ER Gogtay N Giedd JN Vidal CN Hayashi KM et al . Structural MRI and brain development. Int Rev Neurobiol. (2005) 67:285–323. doi: 10.1016/S0074-7742(05)67009-2
22
Giedd JN Blumenthal J Jeffries NO Castellanos FX Liu H Zijdenbos A et al . Brain development during childhood and adolescence: a longitudinal MRI study. Nat Neurosci. (1999) 2:861–3. doi: 10.1038/13158
23
Zielinski BA Gennatas ED Zhou J Seeley WW . Network-level structural covariance in the developing brain. Proc Natl Acad Sci. (2010) 107:18191–6. doi: 10.1073/pnas.1003109107
24
Moura LM Crossley NA Zugman A Pan PM Gadelha A Del Aquilla MAG et al . Coordinated brain development: exploring the synchrony between changes in grey and white matter during childhood maturation. Brain Imaging Behav. (2017) 11:808–17. doi: 10.1007/s11682-016-9555-0
25
Pezawas L Verchinski BA Mattay VS Callicott JH Kolachana BS Straub RE et al . The brain-derived neurotrophic factor val66met polymorphism and variation in human cortical morphology. J Neurosci. (2004) 24:10099–102. doi: 10.1523/JNEUROSCI.2680-04.2004
26
Draganski B Gaser C Busch V Schuierer G Bogdahn U May A . Neuroplasticity: changes in grey matter induced by training. Nature. (2004) 427:311–2. doi: 10.1038/427311a
27
He Y Chen ZJ Evans AC . Small-world anatomical networks in the human brain revealed by cortical thickness from MRI. Cereb Cortex. (2007) 17:2407–19. doi: 10.1093/cercor/bhl149
28
Chen ZJ He Y Rosa-Neto P Germann J Evans AC . Revealing modular architecture of human brain structural networks by using cortical thickness from MRI. Cereb Cortex. (2008) 18:2374–81. doi: 10.1093/cercor/bhn003
29
Montembeault M Joubert S Doyon J Carrier J Gagnon J-F Monchi O et al . The impact of aging on gray matter structural covariance networks. Neuroimage. (2012) 63:754–9. doi: 10.1016/j.neuroimage.2012.06.052
30
Mitelman SA Buchsbaum MS Brickman AM Shihabuddin L . Cortical intercorrelations of frontal area volumes in schizophrenia. Neuroimage. (2005) 27:753–70. doi: 10.1016/j.neuroimage.2005.05.024
31
Modinos G Vercammen A Mechelli A Knegtering H McGuire PK Aleman A . Structural covariance in the hallucinating brain: a voxel-based morphometry study. J Psychiatry Neurosci. (2009) 34:465.
32
Prasad K Rubin J Mitra A Lewis M Theis N Muldoon B et al . Structural covariance networks in schizophrenia: A systematic review Part I. Schizophr Res. (2022) 240:1–21. doi: 10.1016/j.schres.2021.11.035
33
Prasad K Rubin J Mitra A Lewis M Theis N Muldoon B et al . Structural covariance networks in schizophrenia: A systematic review Part II. Schizophr Res. (2022) 239:176–91. doi: 10.1016/j.schres.2021.11.036
34
Spreng RN DuPre E Ji JL Yang G Diehl C Murray JD et al . Structural covariance reveals alterations in control and salience network integrity in chronic schizophrenia. Cereb Cortex 12. (2019) 29:5269–84. doi: 10.1093/cercor/bhz064
35
Ajnakina O Das T Lally J Di Forti M Pariante CM Marques TR et al . Structural covariance of cortical gyrification at illness onset in treatment resistance: A longitudinal study of first-episode psychoses. Schizophr Bull. (2021) 47:1729–39. doi: 10.1093/schbul/sbab035
36
McAlonan GM Cheung V Cheung C Suckling J Lam GY Tai KS et al . Mapping the brain in autism. A voxel-based MRI study of volumetric differences and intercorrelations in autism. Brain. (2005) 128:268–76. doi: 10.1093/brain/awh332
37
Bethlehem RAI Romero-Garcia R Mak E Bullmore ET Baron-Cohen S . Structural covariance networks in children with autism or ADHD. Cereb Cortex. (2017) 27:4267–76. doi: 10.1093/cercor/bhx135
38
He Y Chen Z Evans A . Structural insights into aberrant topological patterns of large-scale cortical networks in Alzheimer’s disease. J Neurosci. (2008) 28:4756–66. doi: 10.1523/JNEUROSCI.0141-08.2008
39
Farahani FV Karwowski W Lighthall NR . Application of graph theory for identifying connectivity patterns in human brain networks: a systematic review. Front Neurosci. (2019) 13:585. doi: 10.3389/fnins.2019.00585
40
Alexander-Bloch A Raznahan A Bullmore E Giedd J . The convergence of maturational change and structural covariance in human cortical networks. J Neurosci. (2013) 33:2889–99. doi: 10.1523/JNEUROSCI.3554-12.2013
41
Dear R Wagstyl K Seidlitz J Markello RD Arnatkevičiūtė A Anderson KM et al . Cortical gene expression architecture links healthy neurodevelopment to the imaging, transcriptomics and genetics of autism and schizophrenia. Nat Neurosci. (2024) 27(6):1075–86. doi: 10.1038/s41593-024-01624-4
42
Casey BJ Getz S Galvan A . The adolescent brain. Dev Rev. (2008) 28:62–77. doi: 10.1016/j.dr.2007.08.003
43
Wu X Palaniyappan L Yu G Zhang K Seidlitz J Liu Z et al . Morphometric dis-similarity between cortical and subcortical areas underlies cognitive function and psychiatric symptomatology: a preadolescence study from ABCD. Mol Psychiatry. (2023) 28:1146–58. doi: 10.1038/s41380-022-01896-x
44
Saviola F Bellani M Perlini C Squarcina L Maggioni E Zacà D et al . First-episode psychosis: Structural covariance deficits in salience network correlate with symptoms severity. J Psychiatr Res. (2021) 136:409–20. doi: 10.1016/j.jpsychires.2021.01.044
45
Ferri J Ford JM Roach BJ Turner JA van Erp TG Voyvodic J et al . Resting-state thalamic dysconnectivity in schizophrenia and relationships with symptoms. Psychol Med. (2018) 48:2492–9. doi: 10.1017/S003329171800003X
46
Cole MW Anticevic A Repovs G Barch D . Variable global dysconnectivity and individual differences in schizophrenia. Biol Psychiatry. (2011) 70:43–50. doi: 10.1016/j.biopsych.2011.02.010
47
Jiang Y Wang Y Huang H He H Tang Y Su W et al . Antipsychotics effects on network-level reconfiguration of cortical morphometry in first-episode schizophrenia. Schizophr Bull. (2022) 48:231–40. doi: 10.1093/schbul/sbab082
48
Tsugawa S Honda S Noda Y Wannan C Zalesky A Tarumi R et al . Associations between structural covariance network and antipsychotic treatment response in schizophrenia. Schizophr Bull. (2024) 50:382–92. doi: 10.1093/schbul/sbad160
49
Hajek T McIntyre R Alda M . Bipolar disorders, type 2 diabetes mellitus, and the brain. Curr Opin Psychiatry. (2016) 29:1–6. doi: 10.1097/YCO.0000000000000215
50
McWhinney SR Brosch K Calhoun VD Crespo-Facorro B Crossley NA Dannlowski U et al . Correction: Obesity and brain structure in schizophrenia - ENIGMA study in 3021 individuals. Mol Psychiatry. (2024) 29:56. doi: 10.1038/s41380-023-02055-6
51
Vancampfort D Stubbs B Mitchell AJ De Hert M Wampers M Ward PB et al . Risk of metabolic syndrome and its components in people with schizophrenia and related psychotic disorders, bipolar disorder and major depressive disorder: a systematic review and meta-analysis. World Psychiatry. (2015) 14:339–47. doi: 10.1002/wps.20252
52
Kolenič M Španiel F Hlinka J Matějka M Knytl P Šebela A et al . Higher body-mass index and lower gray matter volumes in first episode of psychosis. Front Psychiatry. (2020) :556759. doi: 10.3389/fpsyt.2020.556759
53
Lu Emsley R . Fronto-limbic white matter fractional anisotropy and body mass index in first-episode schizophrenia spectrum disorder patients compared to healthy controls. Psychiatry Research: Neuroimaging. (2020) 305:111173. doi: 10.1016/j.pscychresns.2020.111173
54
Koivukangas J Björnholm L Tervonen O Miettunen J Nordström T Kiviniemi V et al . Body mass index and brain white matter structure in young adults at risk for psychosis-The Oulu Brain and Mind Study. Psychiatry Research: Neuroimaging. (2016) 254:169–76. doi: 10.1016/j.pscychresns.2016.06.016
55
Contreras-Rodriguez O Arnoriaga-Rodríguez M Miranda-Olivos R Blasco G Biarnés C Puig J et al . Obesity status and obesity-associated gut dysbiosis effects on hypothalamic structural covariance. Int J Obes (Lond). (2022) 46:30–8. doi: 10.1038/s41366-021-00953-9
56
Yang Y Wang J Qiu J Feng T He Q Lei X et al . Perigenual anterior cingulate cortex and its structural covariance as predictors for future body fat gain in young adults. Obesity (Silver Spring). (2023) 31:446–53. doi: 10.1002/oby.23629
57
Das T Borgwardt S Hauke DJ Harrisberger F Lang UE Riecher-Rössler A et al . Disorganized gyrification network properties during the transition to psychosis. JAMA Psychiatry. (2018) 75:613–22. doi: 10.1001/jamapsychiatry.2018.0391
58
Kong X-Z Liu Z Huang L Wang X Yang Z Zhou G et al . Mapping individual brain networks using statistical similarity in regional morphology from MRI. PloS One. (2015) 10:e0141840. doi: 10.1371/journal.pone.0141840
59
Kong X-Z Wang X Huang L Pu Y Yang Z Dang X et al . Measuring individual morphological relationship of cortical regions. J Neurosci Methods. (2014) 237:103–7. doi: 10.1016/j.jneumeth.2014.09.003
60
Li W Yang C Shi F Wu S Wang Q Nie Y et al . Construction of individual morphological brain networks with multiple morphometric features. Front Neuroanat. (2017) 11:34. doi: 10.3389/fnana.2017.00034
61
Tijms BM Seriès P Willshaw DJ Lawrie SM . Similarity-based extraction of individual networks from gray matter MRI scans. Cereb Cortex. (2012) 22:1530–41. doi: 10.1093/cercor/bhr221
62
Saggar M Hosseini SMH Bruno JL Quintin E-M Raman MM Kesler SR et al . Estimating individual contribution from group-based structural correlation networks. Neuroimage. (2015) 120:274–84. doi: 10.1016/j.neuroimage.2015.07.006
63
Sebenius I Seidlitz J Warrier V Bethlehem RAI Alexander-Bloch A Mallard TT et al . Robust estimation of cortical similarity networks from brain MRI. Nat Neurosci. (2023) 26, 1–11. doi: 10.1038/s41593-023-01376-7
64
Liu Z Palaniyappan L Wu X Zhang K Du J Zhao Q et al . Resolving heterogeneity in schizophrenia through a novel systems approach to brain structure: individualized structural covariance network analysis. Mol Psychiatry. (2021) 26:7719–31. doi: 10.1038/s41380-021-01229-4
65
Li Y Wang N Wang H Lv Y Zou Q Wang J . Surface-based single-subject morphological brain networks: Effects of morphological index, brain parcellation and similarity measure, sample size-varying stability and test-retest reliability. Neuroimage. (2021) 235:118018. doi: 10.1016/j.neuroimage.2021.118018
66
Drenthen GS Backes WH Rouhl RPW Vlooswijk MCG Majoie MHJM Hofman PAM et al . Structural covariance networks relate to the severity of epilepsy with focal-onset seizures. NeuroImage Clin. (2018) :20:861–7. doi: 10.1016/j.nicl.2018.09.023
67
Drenthen GS Backes WH Freeze WM Jacobs HIL Verheggen ICM van Boxtel MPJ et al . Rich-club connectivity of the structural covariance network relates to memory processes in mild cognitive impairment and Alzheimer’s disease. J Alzheimers Dis. (2022) 89:209–17. doi: 10.3233/JAD-220175
68
Homan P Argyelan M DeRosse P Szeszko PR Gallego JA Hanna L et al . Structural similarity networks predict clinical outcome in early-phase psychosis. Neuropsychopharmacology. (2019) 44:915–22. doi: 10.1038/s41386-019-0322-y
69
Lai H Kong X Zhao Y Pan N Zhang X He M et al . Patterns of a structural covariance network associated with dispositional optimism during late adolescence. Neuroimage. (2022) 251:119009. doi: 10.1016/j.neuroimage.2022.119009
70
Koutsouleris N Meisenzahl EM Borgwardt S Riecher-Rössler A Frodl T Kambeitz J et al . Individualized differential diagnosis of schizophrenia and mood disorders using neuroanatomical biomarkers. Brain. (2015) 138:2059–73. doi: 10.1093/brain/awv111
71
First MB Gibbon M . The structured clinical interview for DSM-IV axis I disorders (SCID-I) and the structured clinical interview for DSM-IV axis II disorders (SCID-II). Washington, D.C., USA: American Psychiatric Publishing, Inc. (2004).
72
Cabral C Kambeitz-Ilankovic L Kambeitz J Calhoun VD Dwyer DB Von Saldern S et al . Classifying schizophrenia using multimodal multivariate pattern recognition analysis: evaluating the impact of individual clinical profiles on the neurodiagnostic performance. Schizophr Bull. (2016) 42:S110–7. doi: 10.1093/schbul/sbw053
73
Gaser C Dahnke R . CAT-a computational anatomy toolbox for the analysis of structural MRI data. Hbm. (2016) 2016:336–48. doi: 10.1002/hbm.23142
74
Ashburner J Barnes G Chen C-C Daunizeau J Flandin G Friston K et al . SPM12 manual. London, UK: Wellcome Trust Centre for Neuroimaging (2014). p. 2464.
75
Schaefer A Kong R Gordon EM Laumann TO Zuo X-N Holmes AJ et al . Local-global parcellation of the human cerebral cortex from intrinsic functional connectivity MRI. Cereb Cortex. (2018) 28:3095–114. doi: 10.1093/cercor/bhx179
76
Fan R-E Chang K-W Hsieh C-J Wang X-R Lin C-J . LIBLINEAR: A library for large linear classification. J Mach Learn Res. (2008) 9:1871–4. doi: 10.5555/1390681.1442794
77
Schulz M-A Yeo BTT Vogelstein JT Mourao-Miranada J Kather JN Kording K et al . Different scaling of linear models and deep learning in UKBiobank brain images versus machine-learning datasets. Nat Commun. (2020) 11:1–15. doi: 10.1038/s41467-020-18037-z
78
Wolpert DH . Stacked generalization. Neural Netw. (1992) 5:241–59. doi: 10.1016/S0893-6080(05)80023-1
79
Kong X Yu PS Wang X Ragin AB . (2013). Discriminative feature selection for uncertain graph classification. In: Proceedings of the 2013 SIAM International Conference on Data Mining. Philadelphia, Pennsylvania, USA: Society for Industrial and Applied Mathematics (SIAM). pp. 82–93.
80
Ojala M Garriga GC . (2009). Permutation Tests for Studying Classifier Performance. In: Proceedings of the 2009 Ninth IEEE International Conference on Data Mining. IEEE, pp. 1833–63. Available at: https://www.jmlr.org/papers/volume11/ojala10a/ojala10a.pdf.
81
Quade D . Using weighted rankings in the analysis of complete blocks with additive block effects. J Am Stat Assoc. (1979) 74:680–3. doi: 10.1080/01621459.1979.10481670
82
Krishnan A Williams LJ McIntosh AR . Abdi H. Partial Least Squares (PLS) methods for neuroimaging: a tutorial and review. Neuroimage. (2011) 56:455–75. doi: 10.1016/j.neuroimage.2010.07.034
83
Gómez-Verdejo V Parrado-Hernández E Tohka J . Sign-consistency based variable importance for machine learning in brain imaging. Neuroinformatics. (2019) 17:593–609. doi: 10.1007/s12021-019-9415-3
84
Rubinov M Sporns O . Complex network measures of brain connectivity: Uses and interpretations. Neuroimage. (2010) 52:1059–69. doi: 10.1016/j.neuroimage.2009.10.003
85
Kay SR Fiszbein A Opler LA . The positive and negative syndrome scale (PANSS) for schizophrenia. Schizophr Bull. (1987) 13:261–76. doi: 10.1093/schbul/13.2.261
86
Andreasen NC . The Scale for the assessment of Negative Symptoms (SANS): Conceptual and theoretical foundations. Br J Psychiatry. (1989) 155:49–52. doi: 10.1192/s0007125000291496
87
Zang J Huang Y Kong L Lei B Ke P Li H et al . Effects of brain atlases and machine learning methods on the discrimination of schizophrenia patients: A multimodal MRI study. Front Neurosci. (2021) 15:697168. doi: 10.3389/fnins.2021.697168
88
de Pierrefeu A Löfstedt T Laidi C Hadj-Selem F Bourgin J Hajek T et al . Identifying a neuroanatomical signature of schizophrenia, reproducible across sites and stages, using machine learning with structured sparsity. Acta Psychiatr Scand. (2018) 138:571–80. doi: 10.1111/acps.12964
89
Lei D Pinaya WHL Young J van Amelsvoort T Marcelis M Donohoe G et al . Integrating machining learning and multimodal neuroimaging to detect schizophrenia at the level of the individual. Hum Brain Mapp. (2020) 41:1119–35. doi: 10.1002/hbm.24863
90
Alexander-Bloch AF Gogtay N Meunier D Birn R Clasen L Lalonde F et al . Disrupted modularity and local connectivity of brain functional networks in childhood-onset schizophrenia. Front Syst Neurosci. (2010) 4:147. doi: 10.3389/fnsys.2010.00147
91
Ray KL Lesh TA Howell AM Salo TP Ragland JD MacDonald AW et al . Functional network changes and cognitive control in schizophrenia. NeuroImage Clin. (2017) 15:161–70. doi: 10.1016/j.nicl.2017.05.001
92
Salvador R Sarró S Gomar JJ Ortiz-Gil J Vila F Capdevila A et al . Overall brain connectivity maps show cortico-subcortical abnormalities in schizophrenia. Hum Brain Mapp. (2010) 31:2003–14. doi: 10.1002/hbm.20993
93
Welsh RC Chen AC Taylor SF . Low-frequency BOLD fluctuations demonstrate altered thalamocortical connectivity in schizophrenia. Schizophr Bull. (2010) 36:713–22. doi: 10.1093/schbul/sbn145
94
Yamamoto M Bagarinao E Shimamoto M Iidaka T Ozaki N . Involvement of cerebellar and subcortical connector hubs in schizophrenia. NeuroImage Clin. (2022) 35:103140. doi: 10.1016/j.nicl.2022.103140
95
Saiz-Masvidal C Contreras F Soriano-Mas C Mezquida G Díaz-Caneja CM Vieta E et al . Structural covariance predictors of clinical improvement at 2-year follow-up in first-episode psychosis. Prog Neuropsychopharmacol Biol Psychiatry. (2023) 120:110645. doi: 10.1016/j.pnpbp.2022.110645
96
Sabaroedin K Razi A Chopra S Tran N Pozaruk A Chen Z et al . Frontostriatothalamic effective connectivity and dopaminergic function in the psychosis continuum. Brain. (2023) 146:372–86. doi: 10.1093/brain/awac018
97
Kalmady SV Greiner R Agrawal R Shivakumar V Narayanaswamy JC Brown MRG et al . Towards artificial intelligence in mental health by improving schizophrenia prediction with multiple brain parcellation ensemble-learning. Schizophrenia. (2019) 5:1–11. doi: 10.1038/s41537-018-0070-8
98
Corcoran P . An end-to-end graph convolutional kernel support vector machine. Appl Network Science. (2020) 5:1–15. doi: 10.1007/s41109-020-00282-2
99
Ying R You J Morris C Ren X Hamilton WL Leskovec J . Hierarchical graph representation learning with differentiable pooling. Ithaca, New York: arXiv (2018).
100
Gallo S El-Gazzar A Zhutovsky P Thomas RM Javaheripour N Li M et al . Functional connectivity signatures of major depressive disorder: machine learning analysis of two multicenter neuroimaging studies. Mol Psychiatry. (2023) 28(7):30–22. doi: 10.1038/s41380-023-01977-5
101
Cui H Dai W Zhu Y Kan X Gu AAC Lukemire J et al . BrainGB: A benchmark for brain network analysis with Graph Neural Networks. IEEE Trans Med Imaging. (2023) 42:493–506. doi: 10.1109/TMI.2022.3218745
102
Li X Zhou Y Dvornek N Zhang M Gao S Zhuang J et al . BrainGNN: Interpretable brain graph neural network for fMRI analysis. Med Image Anal. (2021) 74:102233. doi: 10.1016/j.media.2021.102233
103
Bessadok A Mahjoub MA Rekik I . Graph neural networks in network neuroscience. IEEE Trans Pattern Anal Mach Intell. (2023) 45:5833–48. doi: 10.1109/TPAMI.2022.3209686
104
Yeo BTT Krienen FM Sepulcre J Sabuncu MR Lashkari D Hollinshead M et al . The organization of the human cerebral cortex estimated by intrinsic functional connectivity. J Neurophysiol. (2011) 106:1125–65. doi: 10.1152/jn.00338.2011
105
Fornito A Yücel M Patti J Wood SJ Pantelis C . Mapping grey matter reductions in schizophrenia: an anatomical likelihood estimation analysis of voxel-based morphometry studies. Schizophr Res. (2009) 108:104–13. doi: 10.1016/j.schres.2008.12.011
106
Kim S Kim Y-W Jeon H Im C-H Lee S-H . Altered cortical thickness-based individualized structural covariance networks in patients with schizophrenia and bipolar disorder. J Clin Med. (2020) 9:1846. doi: 10.3390/jcm9061846
107
Zhang X Liu W Guo F Li C Wang X Wang H et al . Disrupted structural covariance network in first episode schizophrenia patients: Evidence from a large sample MRI-based morphometric study. Schizophr Res. (2020) 224:24–32. doi: 10.1016/j.schres.2020.11.004
108
Tu P-C Lee Y-C Chen Y-S Li C-T Su T-P . Schizophrenia and the brain’s control network: aberrant within- and between-network connectivity of the frontoparietal network in schizophrenia. Schizophr Res. (2013) 147:339–47. doi: 10.1016/j.schres.2013.04.011
109
Zhang D Guo L Hu X Li K Zhao Q Liu T . Increased cortico-subcortical functional connectivity in schizophrenia. Brain Imaging Behav. (2012) 6:27–35. doi: 10.1007/s11682-011-9138-z
110
Wang X Xia M Lai Y Dai Z Cao Q Cheng Z et al . Disrupted resting-state functional connectivity in minimally treated chronic schizophrenia. Schizophr Res. (2014) 156:150–6. doi: 10.1016/j.schres.2014.03.033
111
Du Y Pearlson GD Yu Q He H Lin D Sui J et al . Interaction among subsystems within default mode network diminished in schizophrenia patients: A dynamic connectivity approach. Schizophr Res. (2016) 170:55–65. doi: 10.1016/j.schres.2015.11.021
112
Dong D Chen X Li W Gao X Wang Y Zhou F et al . Opposite changes in morphometric similarity of medial reward and lateral non-reward orbitofrontal cortex circuits in obesity. Neuroimage. (2024) 290:120574. doi: 10.1016/j.neuroimage.2024.120574
113
Griffiths-King D Wood AG Novak J . Predicting “Brainage” in late childhood to adolescence (6-17yrs) using structural MRI, morphometric similarity, and machine learning. Sci Rep. (2023) 13:15591. doi: 10.1038/s41598-023-42414-5
114
Wagner F Duering M Gesierich BG Enzinger C Ropele S Dal-Bianco P et al . Gray matter covariance networks as classifiers and predictors of cognitive function in Alzheimer’s disease. Front Psychiatry. (2020) 11:360. doi: 10.3389/fpsyt.2020.00360
115
Corps J Rekik I . Morphological brain age prediction using multi-view brain networks derived from cortical morphology in healthy and disordered participants. Sci Rep. (2019) 9:9676. doi: 10.1038/s41598-019-46145-4
Summary
Keywords
precision psychiatry, schizophrenia, structural covariance, machine learning, neuroimaging, brain connectivity
Citation
Vetter CS, Bender A, Dwyer DB, Montembeault M, Ruef A, Chisholm K, Kambeitz-Ilankovic L, Antonucci LA, Ruhrmann S, Kambeitz J, Rosen M, Lichtenstein T, Riecher-Rössler A, Upthegrove R, Salokangas RKR, Hietala J, Pantelis C, Lencer R, Meisenzahl E, Wood SJ, Brambilla P, Borgwardt S, Falkai P, Bertolino A, Koutsouleris N and PRONIA Consortium (2025) Exploring the predictive value of structural covariance networks for the diagnosis of schizophrenia. Front. Psychiatry 16:1570797. doi: 10.3389/fpsyt.2025.1570797
Received
04 February 2025
Accepted
12 May 2025
Published
09 June 2025
Volume
16 - 2025
Edited by
Ping Jiang, Sichuan University, China
Reviewed by
Valentina Ciullo, Santa Lucia Foundation (IRCCS), Italy
Dafa Shi, Second Affiliated Hospital of Shantou University Medical College, China
Updates
Copyright
© 2025 Vetter, Bender, Dwyer, Montembeault, Ruef, Chisholm, Kambeitz-Ilankovic, Antonucci, Ruhrmann, Kambeitz, Rosen, Lichtenstein, Riecher-Rössler, Upthegrove, Salokangas, Hietala, Pantelis, Lencer, Meisenzahl, Wood, Brambilla, Borgwardt, Falkai, Bertolino, Koutsouleris and PRONIA Consortium.
This is an open-access article distributed under the terms of the Creative Commons Attribution License (CC BY). The use, distribution or reproduction in other forums is permitted, provided the original author(s) and the copyright owner(s) are credited and that the original publication in this journal is cited, in accordance with accepted academic practice. No use, distribution or reproduction is permitted which does not comply with these terms.
*Correspondence: Nikolaos Koutsouleris, Nikolaos.koutsouleris@med.uni-muenchen.de
Disclaimer
All claims expressed in this article are solely those of the authors and do not necessarily represent those of their affiliated organizations, or those of the publisher, the editors and the reviewers. Any product that may be evaluated in this article or claim that may be made by its manufacturer is not guaranteed or endorsed by the publisher.