Abstract
Objectives:
This study aims to identify the topological abnormalities of the brain white matter structural network in adolescents with first episode, drug-naïve major depressive disorder (MDD), and to explore the relationship between these abnormalities and chronic childhood stress.
Methods:
T1-weighted images and diffusion tensor imaging (DTI) data were collected from 77 first-episode, drug-naïve MDD adolescents and 31 healthy controls (HCs). A whole-brain white matter structural network was constructed for each participant. Graph-theoretical analyses were employed to investigate the topological properties of white matter structural networks. Subsequently, we applied four machine learning methods—univariate linear regression, stepwise regression, LASSO regression, and random forest—to screen for relevant variables. The selected variables were then integrated into a final multivariate linear regression model to examine their correlations with Childhood Chronic Stress Questionnaire (CCSQ) scores.
Results:
Compared with HCs, adolescents with MDD showed significantly larger network radius (t = -2.647, p = 0.009) and network diameter (t = -2.619, p = 0.010), as well as significantly lower small-worldness (t = 2.066, p = 0.041) and global efficiency (t = 2.083, p = 0.040) in brain white matter structural network. Local topological abnormalities were observed in multiple brain regions of adolescents with MDD, primarily involving paracentral lobular and mid cingulate cortex, MT+ complex, early auditory cortex, dorsolateral prefrontal cortex, orbital and polar frontal cortex, as well as anterior cingulate and medial prefrontal cortex. The final regression model showed that the weighted betweenness centrality in left area 1, left area 6mp, left frontal opercular area 4, left posterior OFC complex and left lateral belt complex, as well as the weighted local efficiency of the right ventral intraparietal complex and right orbital frontal complex (adjusted R2 = 0.270, Cohen’s f2 = 0.630).
Conclusion:
We found that chronic childhood stress is associated with local topological abnormalities in multiple regions of the white matter structural networks of adolescents with MDD. These altered white matter network topological properties may be utilized in the future to aid in identifying depressive subtypes with high childhood stress exposure.
1 Introduction
Major depressive disorder (MDD) is characterized by long-lasting low mood, loss of interest, and anhedonia (1). The prevalence of MDD has risen sharply in adolescents over the past decade (2). Depression in adolescents is associated with high-risk behaviors, including suicide attempts, abuse of alcohol, nicotine, and drugs (3, 4).
In recent years, neuroimaging studies have viewed MDD as a brain network dysfunction syndrome (5). Previous studies using graph theory methods have found that MDD patients exhibit alterations in brain structural and functional topological properties, including global efficiency, local efficiency, node degree, and other related network metrics (6–12). However, previous studies have primarily focused on adult patients (13–15). Notably, adolescence is a critical period for brain structural and functional development, during which the brain is highly susceptible to external environmental factors (16). Research indicates that chronic stress during childhood significantly increases the risk of developing MDD in adolescents (17). The underlying mechanisms may be related to changes in white matter integrity, as previous studies have shown that chronic stress during childhood is closely associated with axial diffusion tensor (AD), mean diffusion tensor (MD), and fractional anisotropy (FA) in individuals with MDD (18, 19). These findings deepen our understanding of the neurobiology of major depressive disorder in adolescents. However, gaps remain in our understanding of how the brain is affected by environmental factors at the network level. To the best of our knowledge, there is limited systematic research investigating the relationship between white matter networks and childhood stress specifically in adolescents with MDD.
Therefore, the primary objective of this study was to identify topological abnormalities in the white matter structural network of adolescents with MDD and to explore the association between these abnormalities and childhood chronic stress. To exclude the influence of psychiatric medications, this study included only adolescents with first-episode MDD who had not received any psychiatric medication prior to magnetic resonance imaging (MRI) scanning.
2 Participants and measures
This study has been approved by the Ethics Committee of West China Hospital, Sichuan University and registered on the Chinese Clinical Trial Registration Platform (ChiCTR2000033402). All participants and their guardians provided written informed consent before participating in the study.
From September 2020 to January 2022, we recruited adolescents aged 12–18 years with first-episode drug-naïve MDD from the inpatient and outpatient departments of West China Hospital, Sichuan University. Healthy controls aged 12 to 18 years were recruited through advertisements.
Adolescent MDD was diagnosed by two experienced clinical psychiatrists using the Diagnostic and Statistical Manual of Mental Disorders, Fourth Edition (DSM-IV) and the Chinese version of the Kiddie Schedules for Affective Disorders and Psychosis (KSADS-PL). All participants were required to meet the following criteria: right-handedness, completion of at least elementary school education, absence of structural brain abnormalities, and the ability to comprehend the content of the scales used in this study. Additionally, the HCs must not have any current or past psychiatric diagnoses. Participants were excluded if they had a history of electroconvulsive therapy, severe physical illness, head trauma, loss of consciousness, central nervous system disease, other DSM-IV Axis I psychiatric diagnoses, exposure to pesticides, toxins, or other substances with potential neurotoxic effects, pregnancy or breastfeeding, or any condition that was not suitable for MRI scanning.
Childhood chronic stress was assessed with the Childhood Chronic Stress Questionnaire (CCSQ), which includes three dimensions: childhood peer bullying, childhood abuse and neglect, and adverse childhood experiences (20). The questionnaire was originally developed and validated in a sample of 1,786 third- to fifth-grade students, demonstrating excellent internal consistency (Cronbach’s α = 0.946), high test-retest reliability (r = 0.921), and strong support for its hypothesized three-factor structure in confirmatory factor analysis. The Social Support Rating Scale (SSRS) was used to assess adolescents’ actual objective support, subjective support, and support utilization (21). Depression symptom was assessed using the Chinese version of the Beck Depression Inventory-II (BDI-II-C) (22).
2.1 MRI data acquisition
T1-weighted images and diffusion tensor imaging (DTI) were acquired using a 3.0T scanner (uMR 790, United Imaging Healthcare, Shanghai, China). Each participant’s acquisition sequence parameters are the same. T1-weighted (T1w) images were acquired using a magnetization-prepared fast gradient echo sequence: repetition time (TR)=8.4 ms; echo time (TE)=3.8 ms; flip angle=8°; slice thickness=0.8 mm; total number of sagittal slices=208; matrix size=256×256; field of view (FOV)=256×256 mm2; voxel size=0.8×0.8×0.8 mm3.
DTI data were obtained using an echo-planar imaging sequence: TR = 6.4s; TE = 0.068s; FOV = 210×210mm2; matrix size=140×140; slice thickness=1.5 mm; voxel size=1.5×1.5×1.5mm3; flip angle=90°; diffusion directions=32; b-value=1010 s/mm2; 98 slices.
During the scanning procedure, participants are instructed to stay calm. They are asked to remain motionless, relax with their eyes closed, and avoid falling asleep while thinking of nothing in particular. Foam pads and earplugs are used to minimize head movement and attenuate scanner noise for participants. In this procedure, images with structural abnormalities, evident head movements, and artifacts are excluded by visual inspection.
2.2 HCP-MMP atlas
We adopted the HCP-MMP (Human Connectome Project Multi-Modal Parcellation) atlas, which consists of 180 distinct areas per hemisphere. For organizational purposes, this atlas grouped the 180 cortical areas into 22 regions based on several criteria, including geographic proximity and functional similarities. Each region comprises a set of geographically contiguous cortical areas that share common properties based on architecture, task-fMRI profiles, and/or functional connectivity (23).
2.3 Image processing
We visually inspected the T1W and dMRI images of all subjects to detect any signal dropouts or artifacts. Next, we preprocessed the images via the well-established pipeline. Briefly, for both T1W and dMRI data, the procedure began with axial alignment, centering, Gibbs ringing removal based on local subvoxel shifts, and intensity inhomogeneity correction via N4ITK.
For dMRI data, we also included the following steps: (1) Marchenko–Pastur principal-component analysis (MP-PCA) denoising to improve the signal-to-noise ratio (SNR) without reducing spatial resolution; we retained 95% of the principal components to achieve an optimal balance between noise suppression and preservation of neurobiologically meaningful signal; (2) FSL’s eddy_correct tool was used for eddy current correction; (3) brain mask generation using a brain extraction tool (BET); and (4) distortion correction via registration of individual T1W and dMRI data. Finally, the transformation was applied to each diffusion-weighted volume, and the gradient vectors were rotated using the rotation matrix estimated from the affine transformation.
For dMRI data, we created the brain masks using a convolutional neural network (CNN) based segmentation tool in pnlNipype (https://github.com/pnlbwh/pnlNipype). Finally, each individual’s T1-weighted images were transformed from structural space into diffusion space through a rigid registration using FSL.
In the processing of dMRI data, the connectivity matrix was established using DSI Studio software for deterministic fiber tracking, utilizing the generalized q-space sampling imaging (GQI) reconstruction method following eddy current correction. The parameters employed for fiber tracking were as follows: (1) tracking metric - quantitative anisotropy (QA), (2) random angle threshold, (3) random tracking threshold, (4) random step size, and (5) minimum/maximum length threshold set at 30/200 mm. A total of 180 regions of interest (ROIs) were defined based on the Glasser atlas. The weight of an edge was defined as the natural logarithm of the number of fiber tracts between two brain regions.
2.4 Network measures
The Brain Connectivity Toolbox (URL: http://www.brain-connectivity-toolbox.net/) was used to conduct graph-theoretical analyses on connectivity matrices. This method enabled us to analyze the global properties of the brain network. Metrics evaluated included global efficiency, small-worldness, characteristic path length, network diameter, network radius, and average clustering coefficient. Furthermore, we computed some nodal properties to identify critical nodes in the brain network, specifically: nodal degree, nodal strength, local clustering coefficient, local efficiency, betweenness centrality, eigenvector centrality, and PageRank centrality.
2.5 Machine learning
Given the high dimensionality and complexity of topological properties in the brain’s white matter structural network, machine learning can be an effective method for analyzing such data (24). Traditional methods, such as linear regression and stepwise regression, are often limited by their inability to model nonlinear relationships. In contrast, more recent machine learning techniques, such as LASSO regression and random forests, despite their lower interpretability compared to traditional methods, offer unique advantages (25, 26). To overcome the limitations of any single method, we employed a combination of four methods—univariate linear regression, stepwise regression, LASSO regression, and random forests—to identify key variables. The results from these analyses were integrated to develop the final multivariate linear regression model, providing a comprehensive assessment of the key factors.
2.6 Statistical analysis
SPSS version 25 (IBM, Armonk, NY, USA) was used for statistical analyses, and p < 0.05 was considered significant for differences. The differences in age and questionnaire score were compared using independent samples t-tests. The differences in gender and family type were evaluated through chi-square tests. To determine if there were significant between-group differences in the topological metrics of the brain white matter structural network, we performed independent samples t-tests for each network topological metric. Multiple comparisons were controlled using the false discovery rate (FDR; Benjamini-Hochberg method) (corrected-P < 0.05). To quantify the practical significance of intergroup differences, we reported corresponding effect sizes. Cohen’s d is used as the effect size measure for continuous variables and all Cohen’s d values presented in the tables are reported as absolute values. For categorical variables, Cramér’s V was used as the effect size.
Subsequently, topological metrics demonstrating significant intergroup differences were included as candidate features. We employed four distinct machine learning methods—univariate linear regression, stepwise regression, LASSO regression, and random forest—to perform feature selection for associations with clinical outcomes (CCSQ and SSRS total scores). Age, gender, group, education level and total intracranial volume (TIV) were included as covariates in all models. To improve model interpretability, we further assessed feature importance within each model to quantify the relative contribution of each variable to CCSQ total scores and SSRS total scores. For the random forest model, we used 10-fold cross-validation to select the optimal feature-importance threshold (0.1-0.95) that minimizes mean squared error (MSE). In each cross-validation iteration, the data were partitioned into 10 subsets: 9 for training and 1 for validation. We then integrated the results from the four methods. Variables were retained if they met any of the following criteria: (1) significant univariate association (p < 0.05), (2) selection by stepwise regression, (3) non-zero coefficient in LASSO regression, or (4) surpassing the cross-validated importance threshold in random forest. After merging outcomes, removing duplicates, and adjusting for pre-included covariates, a final set of brain network variables was derived.
Using this final set of variables, combined with all original covariates (age, gender, group, education level and TIV), we constructed a multiple linear regression model, and applied the Akaike Information Criterion (AIC) to identify the well-fitting model. We evaluated the final model using the overall goodness of fit (R², adjusted R²), regression coefficients with corresponding p-values, and the complete regression equation.
3 Results
3.1 Demographic and clinical characteristics
The demographic and clinical characteristics of all participants are shown in Table 1. The final analysis included 77 adolescents with MDD (mean age 14.27 [1.38] years; 18 males [23.4%]) and 31 HCs (mean age 14.00 [1.51] years; 13 males [41.9%]). No statistically significant differences were found in age, gender or educational level between HCs and MDD patients. There were significant differences between the two groups in family type (χ² = 11.163, p = 0.008). Compared with HCs, MDD patients had significantly higher CCSQ scores on the total scale (t = 3.363, p = 0.001) and all subscales (childhood peer bullying: t = 2.702, p = 0.008; childhood maltreatment and neglect: t = 2.532, p = 0.013; adverse childhood experiences: t = 4.100, p < 0.001). Conversely, the MDD group had significantly lower SSRS scores on the total scale (t = -7.972, p < 0.001) and all subscales compared with the HCs (objective support: t = -4.014, p < 0.001; subjective support: t = -5.484, p < 0.001; utilization of support: t = -4.745, p < 0.001).
Table 1
| Characteristics | MDD (n=77) | HCs (n=31) | χ2/t/Z | p-value | Effect size |
|---|---|---|---|---|---|
| Demographic characteristics | |||||
| Male (N, %) | 18 (23.4%) | 13 (41.9%) | 3.720 | 0.054 | 0.163 |
| Age, years (mean [SD]) | 14.27 [1.38] | 14.00 [1.51] | 0.904 | 0.368 | |
| Education | 1.738 | 0.391 | 0.126 | ||
| Elementary School (N, %) | 3 (3.9%) | 1 (3.2%) | |||
| Middle School (N, %) | 47 (61.0%) | 23 (74.2%) | |||
| High School (N, %) | 27 (35.1%) | 7 (22.6%) | |||
| Family type | 11.163 | 0.008 | 0.338 | ||
| Nuclear family (N, %) | 31 (41.9%) | 21 (67.7%) | |||
| Extended family (N, %) | 19 (25.7%) | 9 (29.0%) | |||
| Live without their parents (N, %) | 6 (8.1%) | 0 (0.0%) | |||
| Single Parent Family (N, %) | 18 (24.3%) | 1 (3.2%) | |||
| Clinical characteristics | |||||
| BDI-II-C scores (mean [SD]) | 34.41 [10.83] | 9.26 [9.17] | 11.383 | <0.001 | 2.421 |
| CCSQ scores (mean [SD]) | 115.42 [58.88] | 87.63 [26.85] | 3.363 | 0.001 | 0.536 |
| Childhood peer bullying (mean [SD]) | 25.3 [15.62] | 19.45 [6.85] | 2.702 | 0.008 | 0.426 |
| Childhood maltreatment and neglect (mean [SD]) | 50.23 [27.17] | 40.23 [13.67] | 2.532 | 0.013 | 0.414 |
| Adverse childhood experiences (mean [SD]) | 38.47 [18.55] | 27.18 [9.85] | 4.100 | <0.001 | 0.682 |
| SSRS scores (mean [SD]) | 27.21 [4.38] | 35.14 [5.35] | -7.972 | <0.001 | 1.696 |
| objective support (mean [SD]) | 6.44 [1.58] | 7.72 [1.25] | -4.014 | <0.001 | 0.857 |
| subjective support (mean [SD]) | 14.91 [3.09] | 18.58 [3.31] | -5.484 | <0.001 | 1.164 |
| support utilization (mean [SD]) | 5.70 [1.52] | 7.84 [2.32] | -4.745 | <0.001 | 1.200 |
Demographic and clinical characteristics of adolescents with MDD and HCs.
MDD, major depressive disorder; HCs, healthy controls; BDI, Beck Depression Inventory; CCSQ, Childhood Chronic Stress Questionnaire; SSRS, Social Support Rating Scale; Statistical notations: N, number of participants; %, percentage.
Effect sizes for continuous variables are reported as Cohen’s d; those for categorical variables are reported as Cramér’s V.
3.2 Network metrics
3.2.1 Between-group differences in global topological metrics
Compared with HCs, the MDD group showed significantly higher network radius (t = 2.647, p = 0.009) and network diameter (t = 2.619, p = 0.010) and had significantly lower small-worldness (t = -2.066, p = 0.041) and global efficiency (t = -2.083, p = 0.040) (Figure 1). No significant differences were observed between the two groups in characteristic path length or average clustering coefficient (all p>0.05).
Figure 1

Significant between-group differences in global metrics (A) Significant between-group differences in network radius. (B) Significant between-group differences in network diameter. (C) Significant between-group differences in small-worldness. (D) Significant between-group differences in global efficiency. ∗p < 0.05, ∗∗p < 0.01.
3.2.2 Between-group differences in local topological metrics
Significant differences in local topological metrics between adolescents with MDD and HCs are shown in Figure 2; Table 2 (all p < 0.05, FDR-corrected).
Figure 2
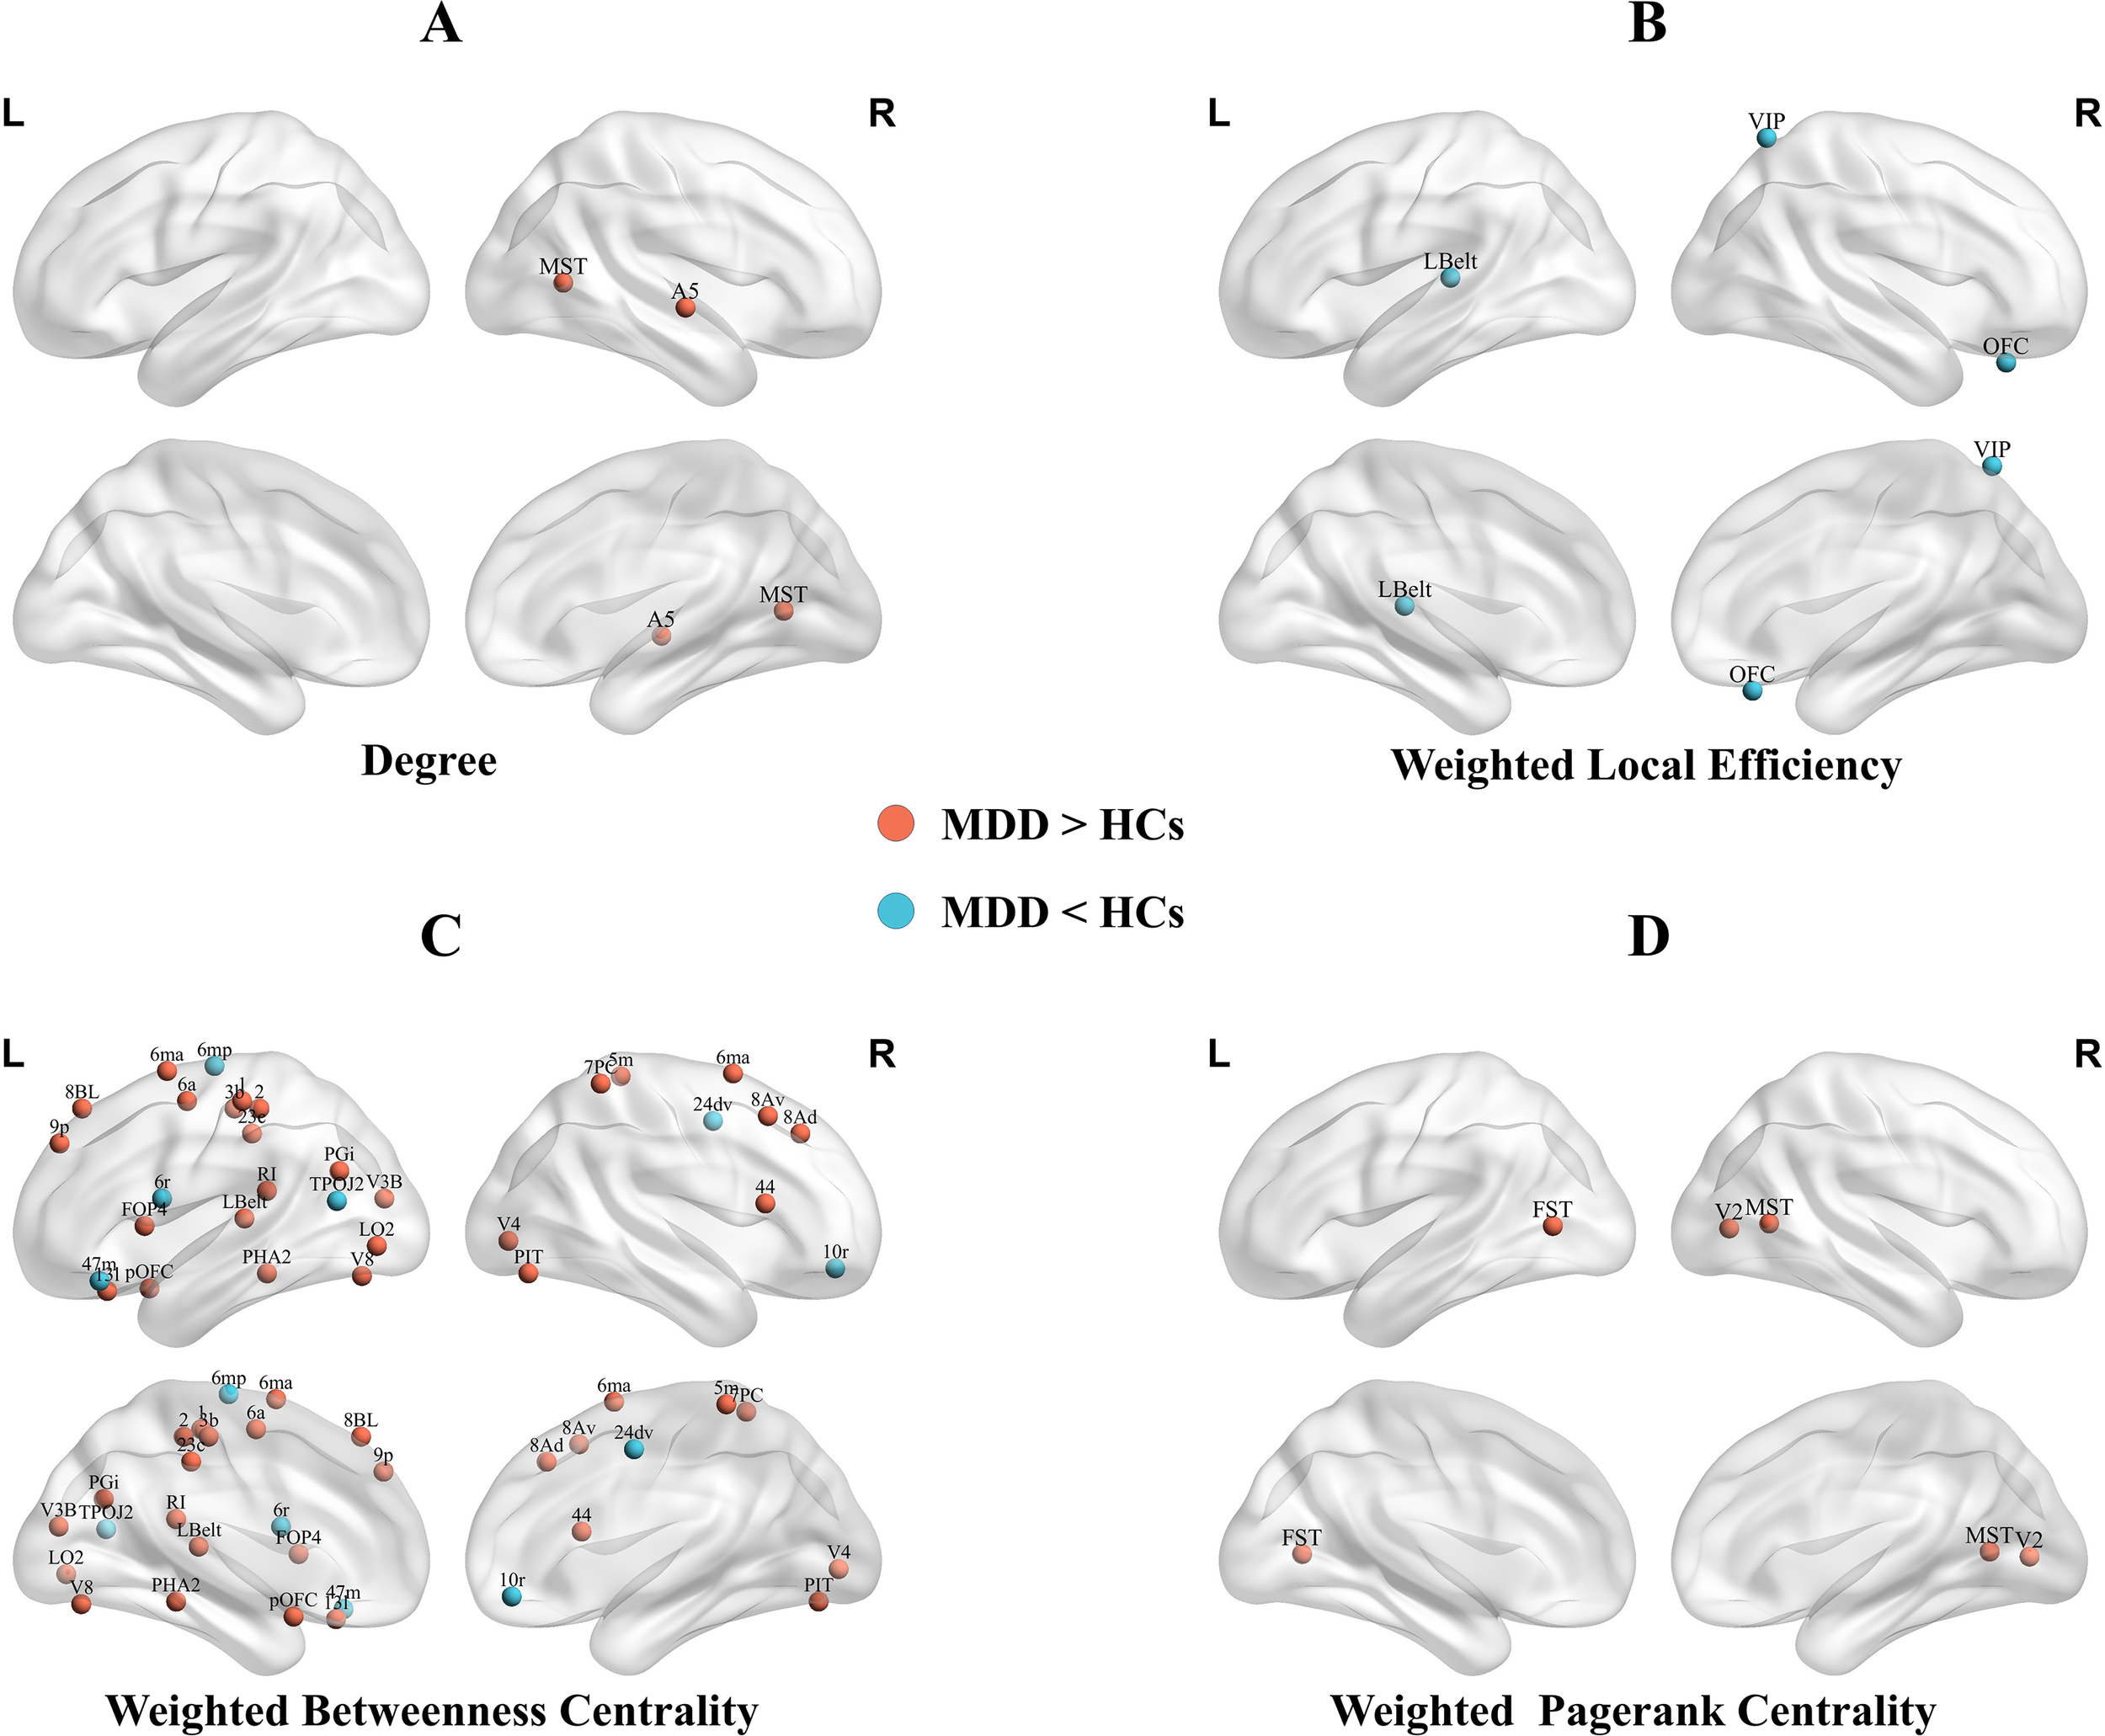
Brain regions showed significantly higher nodal degree (A), lower weighted betweenness centrality (B), altered weighted betweenness centrality (C), and higher weighted PageRank centrality (D) in adolescents with MDD compared with HCs. MDD, major depressive disorder; HCs, health controls;R, right;L, left;MST, Medial Superior Temporal Area; A5, Auditory 5 Complex; Lbelt, Lateral Belt Complex; VIP, Ventral IntraParietal Complex; OFC, Orbital Frontal Complex; 6mp, Area 6mp; 47m, Area 47m; 6r, Rostral Area 6; TPOJ2, Area TemporoParietoOccipital Junction 2; 24dv, Ventral Area 24d; 10r, Area 10r; V8, Eighth Visual Area; V3B, Area V3B; 6ma, Area 6m anterior; 1, Area 1; 2, Area 2; 6a, Area 6 anterior; PGi, Area PGi; PHA2, ParaHippocampal Area 2; pOFC, posterior OFC Complex; V4, Fourth Visual Area; 3b, Primary Sensory Cortex; LO2, Area Lateral Occipital 2; 23c, Area 23c; 8BL, Area 8B Lateral; 9p, Area 9 Posterior; 13l, Area 13l; RI, RetroInsular Cortex; FOP4, Frontal Opercular Area 4; PIT, Posterior InferoTemporal Complex; 5m, Area 5m; 7PC, Area 7PC; 8Av, Area 8Av; 8Ad, Area 8Ad; 44, Area 44; FST, Area FST; V2, Second Visual Area.
Table 2
| Metric | Regions | Cortical sections | t | p Value | Cohen’s d |
|---|---|---|---|---|---|
| Degree | |||||
| MDD > HCs | |||||
| Right Medial Superior Temporal Area | 5 | 4.115 | 0.027 | 0.669 | |
| Right Auditory 5 Complex | 11 | 3.936 | 0.027 | 0.633 | |
| Weighted local efficiency | |||||
| MDD < HCs | |||||
| Left Lateral Belt Complex | 10 | -4.735 | 0.001 | 0.753 | |
| Right Ventral IntraParietal Complex | 16 | -3.689 | 0.043 | 0.785 | |
| Right Orbital Frontal Complex | 20 | -5.283 | <0.001 | 0.789 | |
| Weighted betweenness centrality | |||||
| MDD < HCs | |||||
| Left Area 6mp | 7 | -3.209 | 0.033 | 0.978 | |
| Left Area 47m | 20 | -3.284 | 0.032 | 1.045 | |
| Left Rostral Area 6 | 8 | -3.201 | 0.033 | 0.891 | |
| Left Area TemporoParietoOccipital Junction 2 | 15 | -3.181 | 0.033 | 0.804 | |
| Right Ventral Area 24d | 7 | -3.352 | 0.028 | 1.041 | |
| Right Area 10r | 19 | -2.949 | 0.046 | 0.799 | |
| MDD > HCs | |||||
| Left Eighth Visual Area | 4 | 3.893 | 0.004 | 0.622 | |
| Left Area V3B | 3 | 3.869 | 0.004 | 0.559 | |
| Left Area 6m anterior | 7 | 4.014 | 0.003 | 0.614 | |
| Left Area 1 | 6 | 3.422 | 0.015 | 0.587 | |
| Left Area 2 | 6 | 4.003 | 0.003 | 0.614 | |
| Left Area 6 anterior | 8 | 2.852 | 0.046 | 0.465 | |
| Left Area PGi | 17 | 3.481 | 0.012 | 0.561 | |
| Left ParaHippocampal Area 2 | 13 | 4.581 | 0.001 | 0.622 | |
| Left posterior OFC Complex | 19 | 2.910 | 0.042 | 0.482 | |
| Left Lateral Belt Complex | 10 | 3.208 | 0.026 | 0.537 | |
| Left Primary Sensory Cortex | 6 | 2.819 | 0.046 | 0.462 | |
| Left Area Lateral Occipital 2 | 5 | 4.510 | 0.001 | 0.676 | |
| Left Area 23c | 7 | 2.821 | 0.046 | 0.600 | |
| Left Area 8B Lateral | 22 | 3.641 | 0.008 | 0.533 | |
| Left Area 9 Posterior | 22 | 4.374 | 0.001 | 0.623 | |
| Left Area 13l | 20 | 3.033 | 0.033 | 0.445 | |
| Left RetroInsular Cortex | 10 | 3.017 | 0.033 | 0.454 | |
| Left Frontal Opercular Area 4 | 12 | 4.746 | 0.001 | 0.754 | |
| Right Fourth Visual Area | 2 | 4.299 | 0.001 | 0.647 | |
| Right Area 6m anterior | 7 | 3.640 | 0.008 | 0.549 | |
| Right Posterior InferoTemporal Complex | 4 | 2.965 | 0.037 | 0.482 | |
| Right Area 5m | 7 | 5.259 | <0.001 | 0.746 | |
| Right Area 7PC | 16 | 2.863 | 0.046 | 0.477 | |
| Right Area 8Av | 22 | 3.313 | 0.019 | 0.525 | |
| Right Area 8Ad | 22 | 4.574 | 0.001 | 0.663 | |
| Right Area 44 | 21 | 4.017 | 0.003 | 0.565 | |
| Weighted pagerank centrality | |||||
| MDD > HCs | |||||
| Left Area FST | 5 | 4.616 | 0.004 | 0.739 | |
| Right Medial Superior Temporal Area | 5 | 3.743 | 0.040 | 0.665 | |
| Right Second Visual Area | 2 | 3.795 | 0.040 | 0.607 | |
| Weighted eigenvector centrality | |||||
| MDD > HCs | |||||
| Right posterior OFC Complex | 19 | 4.914 | 0.001 | 0.726 | |
Differences in local topological metrics between MDD patients and HCs.
The p-value was adjusted for multiple comparisons using the Benjamini-Hochberg FDR correction method.
The region is assigned to one of the 22 cortical sections defined by the HCP-MMP parcellation (23): 1, Primary Visual Cortex(V1); 2, Early Visual Cortex; 3, Dorsal Stream Visual Cortex; 4, Ventral Stream Visual Cortex; 5, MT+ Complex and Neighboring Visual Areas; 6, Somatosensory and Motor Cortex; 7, Paracentral Lobular and Mid Cingulate Cortex; 8, Premotor Cortex; 9, Posterior Opercular Cortex; 10, Early Auditory Cortex; 11, Auditory Association Cortex; 12, Insular and Frontal Opercular Cortex; 13, Medial Temporal Cortex; 14, Lateral Temporal Cortex; 15, Temporo-Parieto-Occipital Junction; 16, Superior Parietal Cortex; 17, Inferior Parietal Cortex; 18, Posterior Cingulate Cortex; 19, Anterior Cingulate and Medial Prefrontal Cortex; 20, Orbital and Polar Frontal Cortex; 21, Inferior Frontal Cortex; 22, DorsoLateral Prefrontal Cortex.
3.2.2.1 Nodal degree
Adolescents with MDD showed significantly higher nodal degree in the right medial superior temporal area (MT+ Complex) and right auditory 5 complex (Association Auditory Cortex) compared with HCs.
3.2.2.2 Weighted local efficiency
MDD participants showed significantly lower local efficiency in the left lateral belt complex (Early Auditory Cortex), right ventral intraparietal complex (Superior Parietal Cortex), and right orbital frontal complex (Orbital Frontal Cortex).
3.2.2.3 Weighted betweenness centrality
Widespread alterations in weighted betweenness centrality were observed. Compared with HCs, adolescents with MDD exhibited higher weighted betweenness centrality mainly in left area 6m anterior, left area 23c, right area 6m anterior, and right area 5m(Paracentral Lobular and Mid Cingulate Cortex); left area 8B lateral, left area 9 posterior, right area 8Av, and right area 8Ad(DorsoLateral Prefrontal Cortex); left area 1, left area 2 and left primary sensory cortex(Somatosensory and Motor Cortex); left eighth visual area and right posterior inferotemporal complex(Ventral Stream Visual Cortex); and left lateral belt complex and left retroinsular cortex(Early Auditory Cortex).
Conversely, adolescents with MDD showed significantly lower weighted betweenness centrality mainly in the left area 6mp and right ventral area 24d (Paracentral Lobular and Mid Cingulate Cortex); left rostral area 6(Premotor Cortex); left area temporoparietooccipital junction 2(Temporo-Parieto-Occipital Junction); right area 10r (Anterior Cingulate and Medial Prefrontal Cortex); and left area 47m (Orbital and Polar Frontal Cortex).
3.2.2.4 Weighted pagerank centrality
Compared with HCs, adolescents with MDD exhibited significantly higher weighted PageRank centrality in the left area FST and right medial superior temporal area (MT+ complex) and right second visual area (Early Visual Cortex).
3.2.2.5 Weighted eigenvector centrality
Compared with HCs, adolescents with MDD exhibited significantly higher weighted eigenvector centrality in the right posterior OFC complex (Anterior Cingulate and Medial Prefrontal Cortex) (Supplementary Figure S1).
3.2.2.6 Other local topological metrics
No significant differences were observed in nodal strength or local clustering coefficient between the two groups (both p > 0.05, FDR-corrected).
Although sex ratio did not differ significantly (p = 0.054), we tested for sex-by-diagnosis interactions in all significant metrics. None survived correction, supporting the generalizability of findings across sexes (eMethods, Supplementary Table S7).
3.3 Machine learning
Utilizing four distinct modeling techniques, we selected a set of variables potentially linked to the clinical outcomes (Supplementary Tables S2–S5).
In the final regression model(Supplementary Table S6), CCSQ total scores were significantly associated with the following network metrics: weighted betweenness centrality in left area 1 (1; β = -16.830, p<0.001), left area 6mp (6mp; β = -11.281, p = 0.034), left frontal opercular area 4 (FOP4; β = 10.973, p = 0.031), left posterior OFC complex (pOFC; β = -11.222, p = 0.021) and left lateral belt complex (Lbelt; β = -13.828, p = 0.004); and the weighted local efficiency of the right ventral intraparietal complex (VIP; β = -13.233, p = 0.010)and right orbital frontal complex (OFC; β = 13.345, p = 0.009) (Figure 3). The final model demonstrated a large effect size (Cohen’s f2 = 0.630) and accounted for 27.0% of the variance in the outcome after adjusting for the number of predictors (adjusted R2 = 0.270). Higher betweenness centrality in left area 1, left 6mp, left pOFC and left LBelt, as well as higher local efficiency in right VIP, was associated with lower CCSQ scores. In contrast, higher weighted betweenness centrality in left FOP4 and local efficiency in right OFC were associated with higher CCSQ scores.
Figure 3

Topological metrics associated with CCSQ and SSRS scores. (A) Topological metrics associated with CCSQ. (B) Topological metrics associated with SSRS scores. Nodes colored yellow represent brain regions where topological metrics are positively associated with CCSQ or SSRS scores. Nodes colored purple represent brain regions where topological metrics are negatively associated with CCSQ or SSRS scores. Abbreviations of cortical regions: VIP, Ventral IntraParietal Complex (Superior Parietal Cortex); OFC, Orbital Frontal Complex (Orbital and Polar Frontal Cortex); 1, area 1(Somatosensory and Motor Cortex); 6mp, Area 6mp (Paracentral Lobular and Mid Cingulate Cortex); FOP4, Frontal Opercular Area 4 (Insular and Frontal Opercular Cortex); pOFC, posterior OFC Complex (Anterior Cingulate and Medial Prefrontal Cortex); Lbelt, Lateral Belt Complex(Early Auditory Cortex); PIT, Posterior InferoTemporal Complex (Ventral Stream Visual Cortex).
The final model for SSRS total scores demonstrated a huge effect size (Cohen’s f² = 1.002) and accounted for 41.4% of the variance in the outcome (adjusted R² = 0.414). Significant predictors included group (β = –7.184, p < 0.001), gender (β = 2.698, p = 0.019), and weighted betweenness centrality of the right posterior inferotemporal complex (PIT; β = 1.582, p = 0.003) (Figure 3). Higher weighted betweenness centrality in the right PIT was associated with higher SSRS total scores.
4 Discussion
Adolescence is a critical transitional period shaped by the interplay of biological, psychological, and social factors (27), during which the prevalence of MDD increases sharply (2). This study investigated alterations in white matter network topology among adolescents with MDD and their association with childhood chronic stress. Our study focused on first-episode, drug-naive adolescents with MDD. These individuals were experiencing their initial depressive episode and had not yet commenced any form of treatment before MRI scanning, thereby excluding the influence of medication on brain function.
Our study has identified local topological properties associated with chronic childhood stress in adolescents with MDD, located within the early auditory cortex and secondary visual networks. Choi et al. found that individuals who witnessed domestic violence during childhood exhibited reduced white matter integrity in the visual limbic pathway by early adulthood (28). Exposure to parental verbal abuse was associated with increased gray matter volume in the left superior temporal gyrus (auditory cortex) (29). Prolonged childhood exposure to adversities such as domestic conflict and verbal abuse may reshape the brain’s primary processing of auditory and visual information. While these adaptive changes may aid in recognizing environmental dangers in the short term, they lead individuals to unconsciously prioritize and amplify negative stimuli over time (30). This selective focus on negative stimuli lays the groundwork for the development of depression (31).
Beyond sensory areas, we found that chronic childhood stress was significantly associated with local topological properties in multiple key nodes of the prefrontal cortex (left pOFC, left FOP4, and right OFC). Chronic stress can activate the hypothalamic-pituitary-adrenal (HPA) axis, elevating glucocorticoid levels. Glucocorticoids act on brain regions that express high levels of glucocorticoid receptors, such as the prefrontal cortex, and trigger oxidative stress (32). This oxidative stress impairs oligodendrocyte precursor cell differentiation and disrupts myelination (33), ultimately diminishing white matter microstructural integrity (34). The topological abnormalities observed in our study may therefore represent the macroscopic network-level consequences of this underlying neurobiological pathway.
In this study, we found that adolescents with MDD exhibited higher network radius and diameter, along with lower small-worldness and global efficiency. These altered metrics converge to indicate that the white matter structural networks in MDD adolescents demonstrate elongated communication pathways, diminished global efficiency and integrative capacity. Our findings are consistent with previous studies in adults with MDD (35, 36), but contrast with those observed in first-episode, drug-naïve adults. Previous work in this latter group has reported increased global efficiency and reduced characteristic path length (37), suggesting enhanced information transmission within the brain’s structural network. These findings may indicate that adolescence represents a critical developmental window during which white matter networks are particularly vulnerable. In contrast, the mature adult brain retains greater compensatory capacity and short-term adaptive plasticity despite initial depressive episodes.
However, we observed no significant differences in characteristic path length and clustering coefficient between the MDD and HCs. This might be because the first-episode, drug-naïve MDD patients recruited in this study were in the early stages of the disease, with some global topological properties yet to be disrupted (38). These two global topological metrics have also shown heterogeneity in previous studies. Wu et al. found no significant changes in characteristic path length but a significant decrease in clustering coefficient in the white matter structural networks of MDD patients compared to healthy controls (13); Li et al. observed no significant change in clustering coefficient in the white matter structural networks of MDD patients (39); Xu et al. found increased characteristic path length and decreased clustering coefficient in the white matter structural networks of MDD patients compared to healthy controls (40). The inconsistent findings across studies regarding path length and clustering coefficient likely stem from the high heterogeneity of depression. For instance, He et al. further subdivided depressed patients into major depressive disorder with melancholic features (M-MDD) and non-melancholic MDD (NM-MDD), revealing significant differences in WM network alterations between the two MDD groups (41); Another study revealed significant differences in white matter structural network properties among MDD patients with different onset ages (6). Therefore, future research should focus on refining depression subtypes to enhance the sensitivity and specificity of neuroimaging biomarkers.
Additionally, we investigated differences in local topological metrics of brain white matter structural networks between adolescents with MDD and healthy controls. In graph-theoretical analyses, node degree, local efficiency, and centrality are key metrics for evaluating the significance and impact of individual nodes within a network. In this study, we observed alterations in local topological properties across several brain regions in MDD adolescents, including the frontal, parietal, and occipital lobe, as well as lateral occipitotemporal regions. These regions predominantly participate in secondary visual, somatomotor, default mode, cingulo-opercular, and frontoparietal networks (according to Cole-Anticevic’s brain network parcellation (42)). These networks are critically involved in key neurocognitive processes, including visual information processing (43, 44), motor coordination (11, 45), introspection and self-referential thought (46), and cognitive control (47–49). Dysfunction within these network nodes may underlie core clinical features of MDD, such as cognitive biases, psychomotor retardation, rumination, and impaired emotional regulation (2). Therefore, our research support the idea of adolescent MDD as a syndrome of network dysfunction.
However, this study also has some limitations. First, given the relatively young age of the participants, we cannot exclude the possibility that some patients may be diagnosed with bipolar disorder or schizophrenia in the future. Second, the relatively small sample size and imbalance between groups may have reduced statistical power, thereby limiting the robustness and generalizability of the findings. Furthermore, as a cross-sectional study, this research cannot establish causal relationships between brain network topological properties and chronic stress or MDD. Although we identified abnormal white matter structural network topologies in adolescent MDD, it remains unclear whether this abnormality represents a neurophysiological risk factor preceding the onset of depression or a vulnerability marker for childhood chronic stress. Future research could address this gap by assessing developmental changes in brain structural networks across longitudinal samples. Lastly, the use of self-reported questionnaires in this study may be subject to recall bias, which could affect the accuracy of the reported information. To further elucidate the pr) and role of neural circuits in the pathogenesis of adolescent depression, future research should incorporate larger and more matched samples, employ multimodal neuroimaging techniques (e.g., fMRI, PET), and examine both structural and functional brain networks. Moreover, dynamic brain network analyses may provide novel insights into how time-varying topological properties relate to fluctuations in depressive symptoms over time.
5 Conclusion
In this study, we identified an impaired topology of the brain white matter structural network in adolescents with MDD. We found that chronic childhood stress is associated with local topological abnormalities across multiple regions of the white matter structural networks of adolescents with MDD, including the secondary visual, auditory, and orbito-affective networks. This pattern suggests vulnerability in these regions among adolescents with MDD who experienced chronic childhood stress. These altered white matter network topological properties may be utilized in the future to aid in identifying depressive subtypes with high childhood stress exposure, thereby guiding targeted social support interventions or individualized psychotherapy strategies. Moreover, they could also be leveraged to guide the selection of targets for non-invasive neuromodulation techniques—such as transcranial magnetic stimulation (TMS)—enabling more precise, individualized neural circuit-based interventions.
Statements
Data availability statement
The raw data supporting the conclusions of this article will be made available by the authors, without undue reservation.
Ethics statement
The studies involving humans were approved by the Ethics Committee of West China Hospital, Sichuan University. The studies were conducted in accordance with the local legislation and institutional requirements. Written informed consent for participation in this study was provided by the participants’ legal guardians/next of kin.
Author contributions
LY: Conceptualization, Funding acquisition, Methodology, Project administration, Resources, Supervision, Writing – review & editing. YW: Methodology, Conceptualization, Supervision, Writing – review & editing. ZW: Data curation, Formal analysis, Investigation, Methodology, Project administration, Validation, Visualization, Writing – original draft, Writing – review & editing. ZM: Conceptualization, Formal analysis, Methodology, Writing – original draft, Writing – review & editing. MJ: Data curation, Investigation, Project administration, Writing – review & editing. MR: Data curation, Investigation, Project administration, Writing – review & editing. HZ: Data curation, Investigation, Project administration, Writing – review & editing. YT: Data curation, Investigation, Writing – review & editing. HX: Data curation, Investigation, Writing – review & editing. SZ: Data curation, Investigation, Writing – review & editing.
Funding
The author(s) declared that financial support was received for this work and/or its publication. This work was supported by the National Key R&D Program of the Chinese Science & Technology Department (2023YFE0118600), the National Natural Science Foundation of China (81801357), the Science and Technology Department of Sichuan Province (2022YFS0351 and 2020JDKP0013), the Health Commission of Sichuan Province (21PJ020), and the Science and Technology Department of Chengdu (2019-YF05-00284-SN and 2024-YF05-00148-SN).
Conflict of interest
The author(s) declared that this work was conducted in the absence of any commercial or financial relationships that could be construed as a potential conflict of interest.
Generative AI statement
The author(s) declared that generative AI was not used in the creation of this manuscript.
Any alternative text (alt text) provided alongside figures in this article has been generated by Frontiers with the support of artificial intelligence and reasonable efforts have been made to ensure accuracy, including review by the authors wherever possible. If you identify any issues, please contact us.
Publisher’s note
All claims expressed in this article are solely those of the authors and do not necessarily represent those of their affiliated organizations, or those of the publisher, the editors and the reviewers. Any product that may be evaluated in this article, or claim that may be made by its manufacturer, is not guaranteed or endorsed by the publisher.
Supplementary material
The Supplementary Material for this article can be found online at: https://www.frontiersin.org/articles/10.3389/fpsyt.2026.1732661/full#supplementary-material
References
1
Marx W Penninx BWJH Solmi M Furukawa TA Firth J Carvalho AF et al . Major depressive disorder. Nat Rev Dis Primers. (2023) 9:44. doi: 10.1038/s41572-023-00454-1
2
Thapar A Eyre O Patel V Brent D . Depression in young people. Lancet. (2022) 400:617–31. doi: 10.1016/S0140-6736(22)01012-1
3
Johnson D Dupuis G Piche J Clayborne Z Colman I . Adult mental health outcomes of adolescent depression: A systematic review. Depress Anxiety. (2018) 35:700–16. doi: 10.1002/da.22777
4
Groenman AP Janssen TWP Oosterlaan J . Childhood psychiatric disorders as risk factor for subsequent substance abuse: A meta-analysis. J Am Acad Child Adolesc Psychiatry. (2017) 56:556–69. doi: 10.1016/j.jaac.2017.05.004
5
Gong Q He Y . Depression, neuroimaging and connectomics: A selective overview. Biol Psychiatry. (2015) 77:223–35. doi: 10.1016/j.biopsych.2014.08.009
6
He M Shen Z Ping L Zhou C Cheng Y Xu X . Age-related heterogeneity revealed by disruption of white matter structural networks in patients with first-episode untreated major depressive disorder: WM Network In OA-MDD. J Affect Disord. (2022) 303:286–96. doi: 10.1016/j.jad.2022.02.036
7
Long J-Y Qin K Pan N Fan W-L Li Y . Impaired topology and connectivity of grey matter structural networks in major depressive disorder: evidence from a multi-site neuroimaging data-set. Br J Psychiatry. (2024) 224:170–8. doi: 10.1192/bjp.2024.41
8
Zhang Y Liu X Hou Z Yin Y Xie C Zhang H et al . Global topology alteration of the brain functional network affects the 8-week antidepressant response in major depressive disorder. J Affect Disord. (2021) 294:491–6. doi: 10.1016/j.jad.2021.07.078
9
Dai Y-R Wu Y-K Chen X Zeng Y-W Li K Li J-T et al . Eight-week antidepressant treatment changes intrinsic functional brain topology in first-episode drug-naïve patients with major depressive disorder. J Affect Disord. (2023) 329:225–34. doi: 10.1016/j.jad.2023.02.126
10
Zhang W Zhai X Zhang C Cheng S Zhang C Bai J et al . Regional brain structural network topology mediates the associations between white matter damage and disease severity in first-episode, Treatment-naïve pubertal children with major depressive disorder. Psychiatry Res Neuroimaging. (2024) 344:111862. doi: 10.1016/j.pscychresns.2024.111862
11
Yang H Chen X Chen Z-B Li L Li X-Y Castellanos FX et al . Disrupted intrinsic functional brain topology in patients with major depressive disorder. Mol Psychiatry. (2021) 26:7363–71. doi: 10.1038/s41380-021-01247-2
12
Yun J-Y Choi S-H Park S Yoo SY Jang JH . Neural of anhedonia in young adults with subthreshold depression: A graph theory approach for cortical-subcortical structural covariance. J Affect Disord. (2024) 366:234–43. doi: 10.1016/j.jad.2024.08.192
13
Wu B Zhang X Xie H Wang X Gong Q Jia Z . Disrupted structural brain networks and structural-functional decoupling in first-episode drug-naïve adolescent major depressive disorder. J Adolesc Health. (2024) 74:941–9. doi: 10.1016/j.jadohealth.2024.01.015
14
Wu B Li X Zhou J Zhang M Long Q . Altered whole-brain functional networks in drug-naïve, first-episode adolescents with major depression disorder. J Magn Reson Imaging. (2020) 52:1790–8. doi: 10.1002/jmri.27270
15
Ho TC Sacchet MD Connolly CG Margulies DS Tymofiyeva O Paulus MP et al . Inflexible functional connectivity of the dorsal anterior cingulate cortex in adolescent major depressive disorder. Neuropsychopharmacology. (2017) 42:2434–45. doi: 10.1038/npp.2017.103
16
Fuhrmann D Knoll LJ Blakemore S-J . Adolescence as a sensitive period of brain development. Trends Cogn Sci. (2015) 19:558–66. doi: 10.1016/j.tics.2015.07.008
17
LeMoult J Humphreys KL Tracy A Hoffmeister J-A Ip E Gotlib IH . Meta-analysis: exposure to early life stress and risk for depression in childhood and adolescence. J Am Acad Child Adolesc Psychiatry. (2020) 59:842–55. doi: 10.1016/j.jaac.2019.10.011
18
Poletti S Aggio V Brioschi S Bollettini I Falini A Colombo C et al . Impact of early and recent stress on white matter microstructure in major depressive disorder. J Affect Disord. (2018) 225:289–97. doi: 10.1016/j.jad.2017.08.017
19
Zhao H Rong B Gao G Zhou M Huang J Tu N et al . Alterations in the white matter structure of major depressive disorder patients and their link to childhood trauma. Front Psychiatry. (2024) 15:1364786. doi: 10.3389/fpsyt.2024.1364786
20
Hu G Su P Sun Y Liu Y Tao F Hao J . Development and reliability and validity assessment of childhood chronic stress questionnaire. Chin J Sch Health. (2015) 36:70–3. doi: 10.16835/j.cnki.1000-9817.2015.01.021
21
Xiao S . Theoretical basis and research application of the Social Support Rating Scale. J Clin Psychiatry. (1994), 98–100.
22
Beck AT Steer RA Brown GK . Manual for the Beck Depression Inventory-II. San Antonio, TX: Psychological Corporation (1996).
23
Glasser MF Coalson TS Robinson EC Hacker CD Harwell J Yacoub E et al . A multi-modal parcellation of human cerebral cortex. Nature. (2016) 536:171–8. doi: 10.1038/nature18933
24
Iniesta R Stahl D McGuffin P . Machine learning, statistical learning and the future of biological research in psychiatry. Psychol Med. (2016) 46:2455–65. doi: 10.1017/S0033291716001367
25
Tibshirani R . Regression shrinkage and selection via the lasso. J R Stat Society: Ser B (Methodol). (1996) 58:267–88. doi: 10.1111/j.2517-6161.1996.tb02080.x
26
Breiman L . Random forests. Mach Learn. (2001) 45:5–32. doi: 10.1023/A:1010933404324
27
Larsen B Luna B . Adolescence as a neurobiological critical period for the development of higher-order cognition. Neurosci Biobehav Rev. (2018) 94:179–95. doi: 10.1016/j.neubiorev.2018.09.005
28
Choi J Jeong B Polcari A Rohan ML Teicher MH . Reduced fractional anisotropy in the visual limbic pathway of young adults witnessing domestic violence in childhood. Neuroimage. (2012) 59:1071–9. doi: 10.1016/j.neuroimage.2011.09.033
29
Tomoda A Sheu Y-S Rabi K Suzuki H Navalta CP Polcari A et al . Exposure to parental verbal abuse is associated with increased gray matter volume in superior temporal gyrus. Neuroimage. (2011) 54 Suppl 1:S280–286. doi: 10.1016/j.neuroimage.2010.05.027
30
McLaughlin KA Weissman D Bitrán D . Childhood adversity and neural development: A systematic review. Annu Rev Dev Psychol. (2019) 1:277–312. doi: 10.1146/annurev-devpsych-121318-084950
31
LeMoult J Gotlib IH . Depression: A cognitive perspective. Clin Psychol Rev. (2019) 69:51–66. doi: 10.1016/j.cpr.2018.06.008
32
Lupien SJ McEwen BS Gunnar MR Heim C . Effects of stress throughout the lifespan on the brain, behaviour and cognition. Nat Rev Neurosci. (2009) 10:434–45. doi: 10.1038/nrn2639
33
Spaas J van Veggel L Schepers M Tiane A van Horssen J Wilson DM et al . Oxidative stress and impaired oligodendrocyte precursor cell differentiation in neurological disorders. Cell Mol Life Sci. (2021) 78:4615–37. doi: 10.1007/s00018-021-03802-0
34
Monin A Baumann PS Griffa A Xin L Mekle R Fournier M et al . Glutathione deficit impairs myelin maturation: relevance for white matter integrity in schizophrenia patients. Mol Psychiatry. (2015) 20:827–38. doi: 10.1038/mp.2014.88
35
Yao Z Zou Y Zheng W Zhang Z Li Y Yu Y et al . Structural alterations of the brain preceded functional alterations in major depressive disorder patients: Evidence from multimodal connectivity. J Affect Disord. (2019) 253:107–17. doi: 10.1016/j.jad.2019.04.064
36
Chen J-H Yao Z-J Qin J-L Yan R Hua L-L Lu Q . Aberrant global and regional topological organization of the fractional anisotropy-weighted brain structural networks in major depressive disorder. Chin Med J (Engl). (2016) 129:679–89. doi: 10.4103/0366-6999.178002
37
Long Z Duan X Wang Y Liu F Zeng L Zhao J-P et al . Disrupted structural connectivity network in treatment-naive depression. Prog Neuropsychopharmacol Biol Psychiatry. (2015) 56:18–26. doi: 10.1016/j.pnpbp.2014.07.007
38
Qiu X Li J Pan F Yang Y Zhou W Chen J et al . Aberrant single-subject morphological brain networks in first-episode, treatment-naive adolescents with major depressive disorder. Psychoradiology. (2023) 3:kkad017. doi: 10.1093/psyrad/kkad017
39
Zheng K Wang H Li J Yan B Liu J Xi Y et al . Structural networks analysis for depression combined with graph theory and the properties of fiber tracts via diffusion tensor imaging. Neurosci Lett. (2019) 694:34–40. doi: 10.1016/j.neulet.2018.11.025
40
Xu Z Zhou Z Tao W Lai W Qian L Cui W et al . Altered topology in cortical morphometric similarity network in recurrent major depressive disorder. J Psychiatr Res. (2025) 181:206–13. doi: 10.1016/j.jpsychires.2024.11.038
41
He M Cheng Y Chu Z Wang X Xu J Lu Y et al . White matter network disruption is associated with melancholic features in major depressive disorder. Front Psychiatry. (2022) 13:816191. doi: 10.3389/fpsyt.2022.816191
42
Ji JL Spronk M Kulkarni K Repovš G Anticevic A Cole MW . Mapping the human brain’s cortical-subcortical functional network organization. NeuroImage. (2019) 185:35–57. doi: 10.1016/j.neuroimage.2018.10.006
43
Stepniewska I Kaas JH . Topographic patterns of V2 cortical connections in macaque monkeys. J Comp Neurol. (1996) 371:129–52. doi: 10.1002/(SICI)1096-9861(19960715)371:1<129::AID-CNE8>3.0.CO;2-5
44
Lu J Zhang Z Yin X Tang Y Ji R Chen H et al . An entorhinal-visual cortical circuit regulates depression-like behaviors. Mol Psychiatry. (2022) 27:3807–20. doi: 10.1038/s41380-022-01540-8
45
Raichle ME MacLeod AM Snyder AZ Powers WJ Gusnard DA Shulman GL . A default mode of brain function. Proc Natl Acad Sci U.S.A. (2001) 98:676–82. doi: 10.1073/pnas.98.2.676
46
Spreng RN Grady CL . Patterns of brain activity supporting autobiographical memory, prospection, and theory of mind, and their relationship to the default mode network. J Cognit Neurosci. (2010) 22:1112–23. doi: 10.1162/jocn.2009.21282
47
Dosenbach NUF Fair DA Cohen AL Schlaggar BL Petersen SE . A dual-networks architecture of top-down control. Trends Cognit Sci. (2008) 12:99–105. doi: 10.1016/j.tics.2008.01.001
48
Miller EK Cohen JD . An integrative theory of prefrontal cortex function. Annu Rev Neurosci. (2001) 24:167–202. doi: 10.1146/annurev.neuro.24.1.167
49
Funahashi S Andreau JM . Prefrontal cortex and neural mechanisms of executive function. J Physiol Paris. (2013) 107:471–82. doi: 10.1016/j.jphysparis.2013.05.001
Summary
Keywords
adolescent, adverse childhood experience, magnetic resonance imaging, major depressive disorder, white matter
Citation
Wang Z, Ming Z, Jin M, Ran M, Zhang H, Tao Y, Xu H, Zou S, Wu Y and Yin L (2026) Childhood chronic stress associated with abnormal brain white matter networks in first-episode, drug-naïve MDD adolescents: a machine learning study. Front. Psychiatry 17:1732661. doi: 10.3389/fpsyt.2026.1732661
Received
26 October 2025
Revised
18 December 2025
Accepted
19 January 2026
Published
04 February 2026
Volume
17 - 2026
Edited by
Zihao Zeng, Hunan Normal University, China
Reviewed by
Shu Wang, Capital Medical University, China
Zufa Zhang, Affiliated Zhongshan Hospital of Dalian University, China
Updates
Copyright
© 2026 Wang, Ming, Jin, Ran, Zhang, Tao, Xu, Zou, Wu and Yin.
This is an open-access article distributed under the terms of the Creative Commons Attribution License (CC BY). The use, distribution or reproduction in other forums is permitted, provided the original author(s) and the copyright owner(s) are credited and that the original publication in this journal is cited, in accordance with accepted academic practice. No use, distribution or reproduction is permitted which does not comply with these terms.
*Correspondence: Ye Wu, wuye@njust.edu.cn; Li Yin, yli009@163.com
†Theses authors have contributed equally to this work
Disclaimer
All claims expressed in this article are solely those of the authors and do not necessarily represent those of their affiliated organizations, or those of the publisher, the editors and the reviewers. Any product that may be evaluated in this article or claim that may be made by its manufacturer is not guaranteed or endorsed by the publisher.