 Xinwu Du
 Tingting Li
 Xin Jin
 Xiufang Yu2
 Xiaolin Xie
- 1Longmen Laboratory, Luoyang, China
- 2College of Agricultural Equipment Engineering, Henan University of Science and Technology, Luoyang, China
- 3Collaborative Innovation Center of Machinery Equipment Advanced Manufacturing of Henan Province, Luoyang, China
Simultaneous Localization and Mapping (SLAM) has emerged as one of the foundational technologies enabling mobile robots to achieve autonomous navigation, garnering significant attention in recent years. To address the limitations inherent in traditional SLAM systems when operating within dynamic environments, this paper proposes a new SLAM system named GNV2-SLAM based on ORB-SLAM2, offering an innovative solution for the scenario of cowshed inspection. This innovative system incorporates a lightweight object detection network called GNV2 based on YOLOv8. Additionally, it employs GhostNetv2 as backbone network. The CBAM attention mechanism and SCDown downsampling module were introduced to reduce the model complexity while ensuring detection accuracy. Experimental results indicate that the GNV2 network achieves excellent model compression effects while maintaining high performance: mAP@0.5 increased by 1.04%, reaching a total of 95.19%; model parameters were decreased by 41.95%, computational cost reduced by 36.71%, and the model size shrunk by 40.44%. Moreover, the GNV2-SLAM system incorporates point and line feature extraction techniques, effectively mitigate issues reduced feature point extraction caused by excessive dynamic targets or blurred images. Testing on the TUM dataset demonstrate that GNV2-SLAM significantly outperforms the traditional ORB-SLAM2 system in terms of positioning accuracy and robustness within dynamic environments. Specifically, there was a remarkable reduction of 96.13% in root mean square error (RMSE) for absolute trajectory error (ATE), alongside decreases of 88.36% and 86.19% for translation and rotation drift in relative pose error (RPE), respectively. In terms of tracking evaluation, GNV2-SLAM successfully completes the tracking processing of a single frame image within 30 ms, demonstrating expressive real-time performance and competitiveness. Following the deployment of this system on inspection robots and subsequent experimental trials conducted in the cowshed environment, the results indicate that when the robot operates at speeds of 0.4 m/s and 0.6 m/s, the pose trajectory output by GNV2-SLAM is more consistent with the robot's actual movement trajectory. This study systematically validated the system's significant advantages in target recognition and positioning accuracy through experimental verification, thereby providing a new technical solution for the comprehensive automation of cattle barn inspection tasks.
1 Introduction
In autonomous navigation systems of mobile robots, simultaneous localization and mapping (SLAM) concept is widely acknowledged as a core technology that enables robots to achieve accurate self-location and environmental mapping without prior knowledge of the environment (Jia et al., 2022). Particularly, Visual SLAM (VSLAM) method has received special attention due to its low hardware cost and its ability to capture rich environmental details (Islam R. et al., 2023). However, traditional VSLAM methods are generally based on the premise of environment statics (Sun et al., 2022), which faces many challenges in actual environments. Especially in dynamic environments containing moving targets, the problem of extracting erroneous feature information from dynamic objects in turn triggers degradation of localization accuracy or tracking interruptions (Wan Aasim et al., 2022). If there are multiple moving targets or camera motion blur in the environment, traditional VSLAM methods will reduce the number of extracted features, leading to a decrease in system stability and robustness. Taking the inspection environment of cattle sheds in animal husbandry as an example, inspection robots are often disturbed by the movement of cattle or workers when performing inspection tasks. Meanwhile, the cowshed is a structural environment with a large number of line features. In order to ensure the reliable operation of the SLAM system in such complex scenarios, it is necessary to design a SLAM system that can identify and eliminate dynamic feature points in real-time, and combine with line features in the environment to improve overall positioning accuracy and robustness.
Deep Learning-based VSLAM is regarded as a promising solution to address the challenges of dynamic environments (Song et al., 2022). It can recognize predefined dynamic target categories, and providing the system with their semantic labels and coordinate information. By proposing characteristics on dynamic targets, it improves the localization accuracy in dynamic environments, which lays the foundation for autonomous detection of inspection robots.
Red Green Blue-Depth (RGB-D) camera can accurately obtain depth information through sensor measurements, while their color images can be used for visual tasks such as target recognition and image segmentation. Although the image segmentation technique is effective in eliminating the interference of dynamic objects to the SLAM system, its high computational overhead tends to affect the real-time performance of the system (Liu and Miura, 2021). Therefore, YOLO (You Only Look Once), as a single-stage efficient object detection framework, has gradually become the preferred solution in dynamic environment SLAM systems. The structurally optimized YOLO model can provide localization accuracy close to that of image segmentation methods while maintaining a high detection speed, thus striking a good balance between accuracy and real-time performance (Zhang et al., 2022). When there are multiple moving objects on the image or when there is image blurring, the number of extracted point and line features is reduced. Whereas, in the absence of texture or motion blur, line features show higher robustness to represent the structural features of the environment and provide intuitive visual information (Zhao et al., 2022). By integrating object detection techniques with point-line fusion methods, the number of extractable point and line features can be ensured to be sufficient and well-distributed, thereby enhancing the stability of the system.
The main work of this paper is as follows:
1. Based on the ORB-SLAM2 algorithm, the target detection thread and dynamic region feature rejection module were added, while line feature extraction and point-line feature fusion were added to optimize the pose, and multi-thread parallelism was used to ensure the real-time capability and accuracy of the algorithm.
2. A target detection dataset based on inspection environment has been constructed for training target detection models. A lightweight target detection model named GNV2 was developed based on YOLOv8s, which was lightly processed by combining GhostNetV2. The CBAM (Convolutional Block Attention Module) attention mechanism and SCDown downsampling module have been added.
3. Integrated the GNV2 model into the improved SLAM algorithm and evaluate it, and deploy the GNV2-SLAM to the inspection robot for experiments.
The structured of this paper is organized as follows: Section II reviews the relevant literature in this research field and summarizes the current research progress. Section III elaborates the overall architecture of the GNV2-SLAM system and the improvement methodology. Section IV describes the experimental materials and research methodology used in this research. Section V presents the experimental results and evaluates the system’s performance based on the TUM dataset. Finally, Section VI concludes the major findings of this research. Section VII discusses contributions of this research work, and outlines potential directions for future research.
2 Related work
The feature point method is a widely utilized approach for visual mileage computation method in VSLAM. This method primarily focuses on extracting and matching key feature points across consecutive image frames to estimate the camera’s motion trajectory (Chen et al., 2018). To enhance the stability and robustness of SLAM systems in dynamic environments, deep learning techniques have been increasingly integrated in recent years to identify and eliminate dynamic feature points. Numerous researches have been devoted to integrating target detection and image segmentation methods from deep learning into SLAM systems. These advancements provide valuable a priori information for the recognition and eliminate dynamic feature points, thereby improving the performance of the system in complex scenarios (Favorskaya, 2023).
In order to achieve high-precision localization and map construction, Bescos et al. (2018) proposed Dyna-SLAM, which significantly improves the localization accuracy by identifying and eliminating the keypoints in the dynamic region through the Mask R-CNN (He et al., 2018) method. However, its real-time performance is poor due to its dependence on deep semantic segmentation. Yu et al. (2018) proposed DS-SLAM, which combines semantic segmentation with motion consistency detection to construct semantic maps and improve accuracy. Although these methods improve the accuracy, they generally suffer from insufficient real-time performance. Islam Q. U. et al. (2023) proposed YoloV8-SLAM, which employs the cutting-edge target detection algorithm YoloV8 and enhanced multiview geometry techniques to handle low, medium, and high-dynamic environments, whereas a well-matched point selection algorithm extracts high-speed motion information. Wu et al. (2022) proposed the YOLO- SLAM algorithm to accelerate and generate the basic semantic information of the SLAM system by Darknet19-YOLOv3 lightweight target detection network, and utilize the depth difference of random sample consistency to distinguish dynamic features. These algorithms can ensure the real-time operation of the SLAM system, but when there are multiple moving objects or image blurring in the environment, it will reduce the number of extracted feature points and cause the system to experience tracking failure.
Li et al. (2021) proposed RPL-SLAM by extracting point features and line features. The depth information of the RGBD image is further utilized to recover the 3D information of the point and line features, which improves the accuracy of the camera trajectory localization and solves the problem of not being able to find enough reliable features in case of missing texture or motion blur. Zhang, (2021) proposed PL-GM, which calculates the camera position by utilizing the two kinds of features of the point and line features, and constructs a 3D point element and line element by taking into account the two-dimensional point elements and line elements to constrain the error and enhance the positioning accuracy calculated by the algorithm. Although these algorithms improve the positioning accuracy of the system, these algorithms are only applicable to static environments, and when a dynamic target appears in the environment, it will lead to mis-correlation of data, which will cause the system to crash. Yuan et al. (2023). proposed PLDS-SLAM, a point and line fusion SLAM system for dynamic environments, which combines the a priori dynamic region detection, the geometrical and epipolar constraints to separate static and dynamic targets, and the introduction of Bayesian-based SLAM system with a point and line fusion. Wang et al. (2018) proposed a SLAM method that combines point and line features with real-time target detection to enhance the localization accuracy and robustness of the system by enhancing the feature extraction capability in an indoor environment and eliminating the interference of dynamic targets.
Cowsheds, as a typical structured scene, contain a large number of linear structures. However, the frequent appearance of dynamic targets often interferes with traditional SLAM systems during the feature extraction stage, leading to positioning errors. Additionally, when there are too many dynamic targets or motion blur, the number of effective feature points in the image decreases, negatively impacting the system’s positioning accuracy and operational reliability. To address these issues, this paper proposes a visual SLAM method based on dynamic target removal and point-line feature fusion, effectively enhancing the system’s accuracy and stability in real-world inspection scenarios.
3 Methodology
In this section, the GNV2-SLAM system is presented in detail. This system integrates a lightweight deep learning model optimization strategy, enabling it to achieve efficient target recognition and dynamic feature point elimination effectively. Furthermore, the SLAM system incorporates the point-line feature fusion strategy, which establishes foundation for the accurate localization and autonomous inspection of the mobile robot in cowshed inspection environment.
3.1 Overview of the GNV2-SLAM system
The framework of the GNV2-SLAM system proposed in this paper is shown in Figure 1. The system has been structurally optimized and functionally extended based on ORB-SLAM2 (Mur-Artal and Tardós, 2017). In addition to the original three threads: tracking, local map building, and closed-loop detection, a new target detection thread has been introduced to facilitate real-time recognition of dynamic targets. Concurrently, a dynamic target rejection module has been implemented to effectively remove the interference feature points caused by moving objects and improve the robustness of the system in dynamic environments. Furthermore, the system also performs line feature extraction and the optimizes of point-line feature fusion.
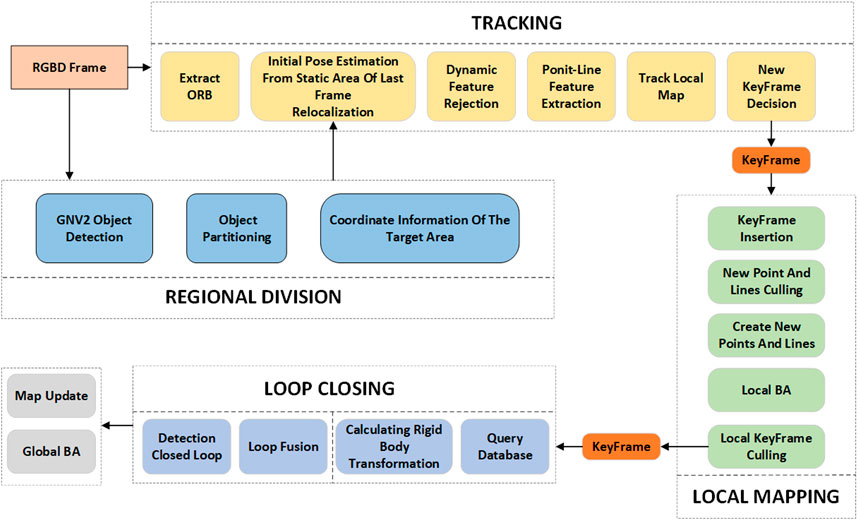
Figure 1. GNV2-SLAM system framework.
3.2 Overview of the GNV2 lightweight target detection network
The GNV2 network is based on YOLOv8s. An efficient GNV2 target detection network is constructed through a lightweight design and two structural optimizations, aiming to significantly reduce the consumption of computational resources and maintain high operational speed while ensuring detection accuracy. In this study, YOLOv8s′ original backbone network is substituted with lightweight GhostNetV2 to reduce model parameters and computation costs. To enhance the model performance further, two important improvements have been made to its network structure. First, the CBAM attention mechanism is introduced, which guides the model to pay more attention to the key fields related to the target by modeling the importance of the channel dimension and the spatial dimension, thus effectively improving the detection accuracy. Second, the SCDown downsampling module is adopted to optimize the feature downsampling process, so that the model achieves more efficient feature compression and delivery while maintaining the key feature information, thus enhancing the expressive capability of the overall network. The final structure of the GNV2 network is shown in Figure 2, which combines high accuracy and high efficiency and provides a good foundation for subsequent deployment in SLAM systems.
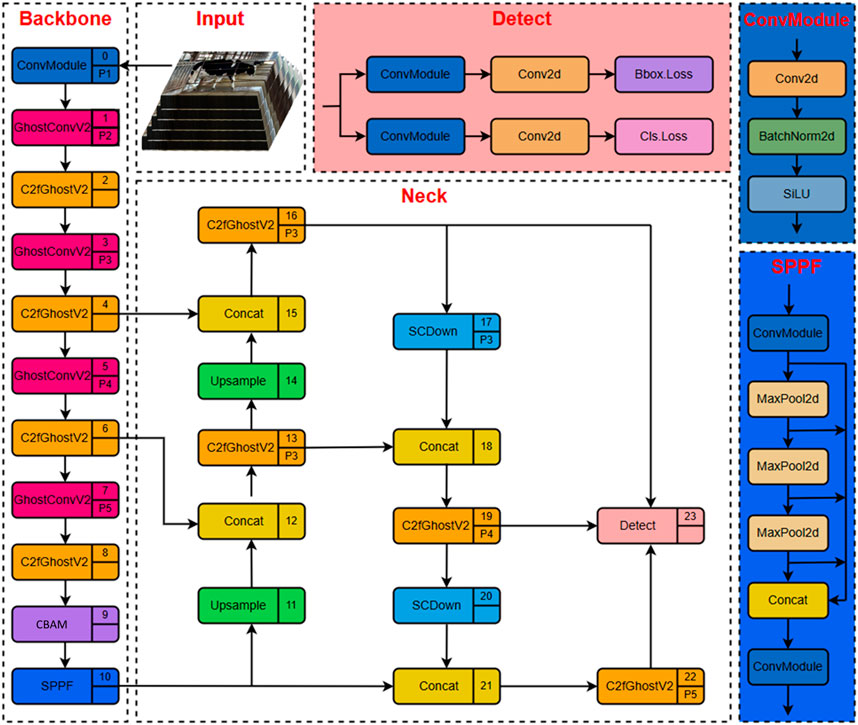
Figure 2. GNV2 network architecture.
3.2.1 GhostNetV2 neural network
GhostNetV2 (Tang et al., 2022) represents a lightweight convolutional neural network improved on GhostNet (Han et al., 2020), with the objective of improving feature expression capability while simultaneously reducing computational complexity. The core innovation lies in generating fundamental features using a limited number of convolutions via the Ghost module, subsequently producing additional redundant features through cost-effective linear operations. This approach effectively replaces traditional convolutional operations and significantly mitigates computational costs. In terms of structural design, the downsampling module of GhostNetV2 adopts stepwise convolution and pooling operations to minimize reliance on high-complexity operators, thereby further enhancing network efficiency. To enhance the feature representation capability of the intermediate layer, the network introduces the DFC (Dynamic Feature Consolidation) attention mechanism, which dynamically adjusts feature responses to enhance the expression of key features. Overall, GhostNetV2 effectively improves the balance between model accuracy and inference speed while maintaining a lightweight architecture. The basic module structure is shown in Figure 3.
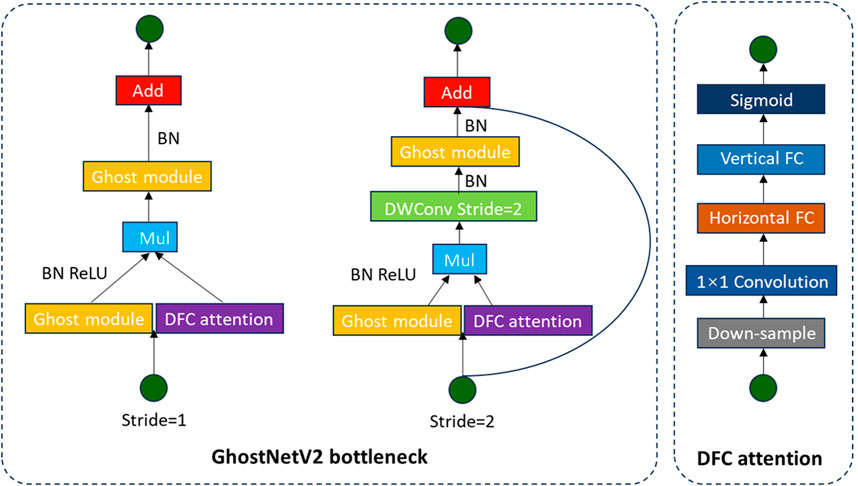
Figure 3. GhostNetV2 architecture schematic diagram.
3.2.2 CBAM attention mechanism
Woo et al. (2018) proposed CBAM, a lightweight attention mechanism module designed to enhance the feature representation of convolutional neural networks. By sequentially integrating both Channel Attention and Spatial Attention mechanisms, this module directs the network to focus on key feature field more effectively, thus improving the performance of the model in various visual tasks. Specifically, CBAM first applies the channel attention module to the input feature map, extracts channel descriptive information through global maximum pooling and average pooling operations. It generates channel weight coefficients by combining these descriptors with a multilayer perceptron and weights the feature map along the channel dimension. Subsequently, this weighted feature map is passed into the spatial attention module, which extracts the spatial information through the pooling operations along the channel dimension and generates the spatial attention map by using convolution attention map. The feature map is weighted again in the spatial dimension. The final output feature map has stronger discriminative ability and can be used in the subsequent network structure to improve the overall performance. The structure of the CBAM attention mechanism module is shown in Figure 4.
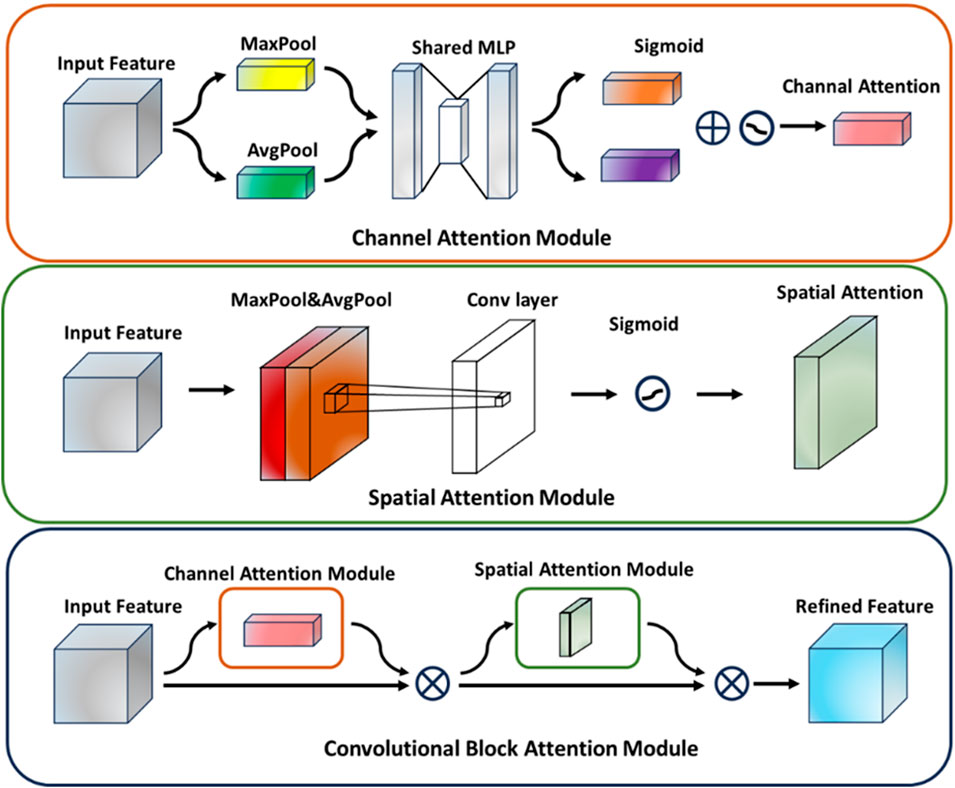
Figure 4. Cbam attention mechanism module structure.
3.2.3 SCDown downsampling module
SCDown is an advanced downsampling module that simultaneously considers both spatial and channel dimensions. It is extensively utilized in lightweight neural networks and efficient computational models, with the objective of substantially decreasing computational complexity and parameter size while preserving feature integrity. By downsampling both the spatial dimensions and the number of channels of the input feature maps, this module decreases both the feature map size and the number of channels, thus effectively reducing the computational overhead and memory usage. In terms of implementation, the SCDown module usually combines convolutional operations, pooling layers or other downsampling strategies to retain key information while eliminating redundant features to improve the efficiency of feature processing. Its structural design provides an efficient feature compression scheme for lightweight networks, which helps to realize fast inference and deployment in resource-constrained environments. The structure of the SCDown module is shown in Figure 5.
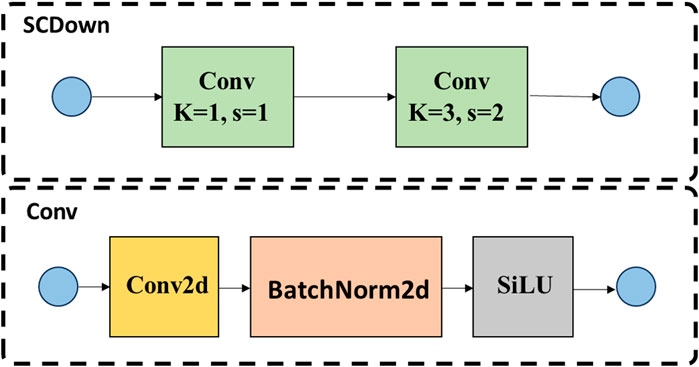
Figure 5. SCDown downsampling module architecture.
3.3 Point and line feature fusion
In this paper, a line feature extraction and matching module is presented based on the ORB-SLAM2 framework. This enhancement enables the system to simultaneously extract point features and line features, so as to improve the robustness and stability of the VSLAM algorithm in complex scenarios. This improvement effectively enhances the system’s ability to perceive geometric information in structured environments by combining different types of feature information. Line features are extracted based on the LSD (Line Segment Descriptor) algorithm (Grompone Von Gioi et al., 2012), which extracts geometrically structured line segment features from images. To enhance the effectiveness of features and matching accuracy, line features are filtered and optimized based on the length of the line segments. Subsequently, LBD (Line Band Descriptor) algorithm descriptors are used to characterize the filtered line segments and match them with line features in other keyframes, so as to construct a stable line feature association relationship. By introducing the line feature information, the localization accuracy of the system is improved.
3.3.1 Point feature reprojection error
The reprojection error is used to optimize the robot’s position. The reprojection error for the line features is shown in Figure 6. Let I1 and I2 denote two frames of images, the 3D spatial points P in the images corresponding to the pixel points p1 and p2, p2’ is the reprojection point of p1 on I2, and e is the error between p2 and p2´.
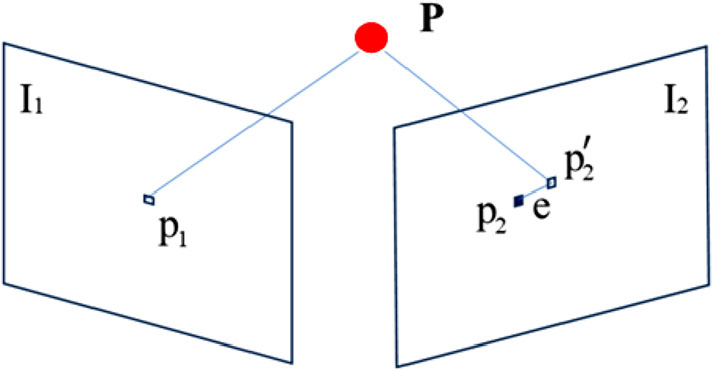
Figure 6. Reprojection error of point features.
The pixel coordinate of point p2 on I2 is x, K is the camera parameter matrix, Tcw is the bitmap transformation from the world coordinate system to the camera coordinate system between I1 and I2, and Xw is the coordinate of point P under the projection of p1 to the world coordinate system. k is the kth image with a total of i feature points. The reprojection error formula for feature points is shown in Equation 1.
3.3.2 Line feature reprojection error
The line feature reprojection error is shown in Figure 7. The O1 and O2 are the camera optical centers of the images, I1 and I2 are the two frames, p1q1 and p2q2 are the corresponding line features of the images, p2´q2’ is the reprojected line segment of p1q1 on I2, ep is the error between p2’ and p2.
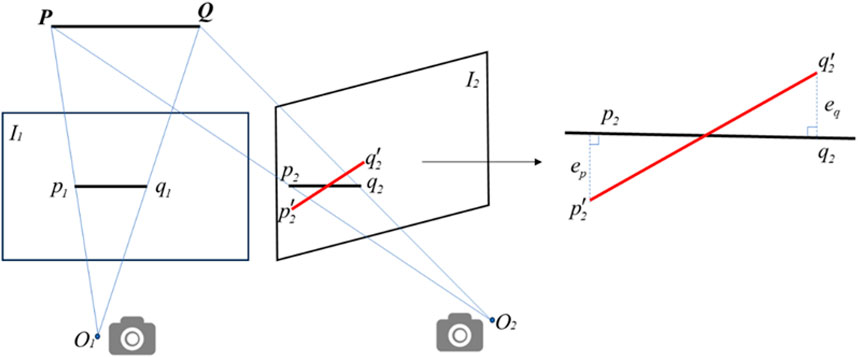
Figure 7. Reprojection error for line features.
Plücker coordinates are commonly used to represent spatial line features, and the spatial line segment PQ expressed in Plücker coordinates as shown in Equation 2.
The formula for projecting a line segment in the camera coordinate system to the pixel coordinate system is shown in Equation 3:
The line segment in pixel coordinate system is denoted by lc, fx and fy represent the effective focal lengths along the x and y directions, respectively; cx and cy represent the translation of the origin of the coordinate system in the x and y directions, and the reprojection error of the line segment is shown in Equation 4.
In the formula for calculating the reprojection error, the function d represents the orthogonal distance function from a point to a line.
Assuming that the observation errors of the point and line features are all Gaussian distributed cases, the combined error function C based on the point and line features can be obtained. As illustrated in Equation 5.
4 Equipment and methods
During the experiments, we ran the training task of the GNV2 deep learning model and the testing and evaluation work of the SLAM algorithm on the same server, respectively. Table 1 provides a detailed listing of the experimental environments used, including hardware configuration and software environment parameters.
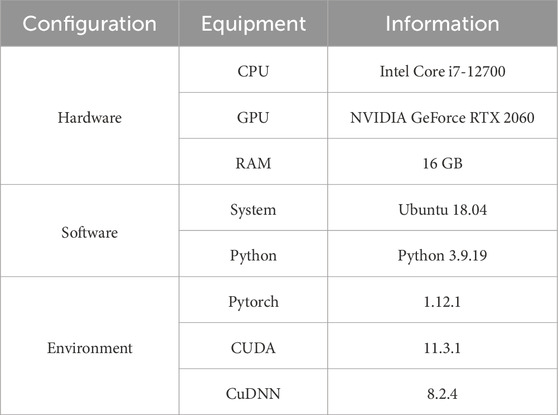
Table 1. Experimental environment configuration.
4.1 GNV2 model training
The YOLO image dataset utilized in this study comprises images captured using an Intel D455 camera. The dataset was collected from two large-scale dairy farms (Henan Ruiya Dairy Co., Ltd. and Luoyang Shengsheng Dairy Co., Ltd.) and the publicly available COCO dataset. We carefully selected a total of 1,246 images from these sources. These images were annotated with “Person” and “Cow” labels using the LabelImg tool. To improve the model’s generalization ability, data augmentation methods such as translation, mirroring, cropping, adding Gaussian noise, and adjusting brightness were used for offline expansion, ultimately constructing an enhanced dataset containing 6,230 images.
During model training, we used the Mosaic data augmentation method, which randomly selects four images and scales, rotates, crops, and rearranges them to generate new images for the model to learn. This method improves the model’s adaptability in multi-scale object detection through random combinations of multi-scale objects, thereby enhancing the diversity of the dataset. This proprietary dataset had strong generalizability and was suitable for train and evaluate a wide range of network models. The training and validation set were divided in a ratio of 8:2, while the test set consisted of video streaming images obtained during the actual operation of the GNV2-SLAM system. The hyperparameter configurations utilized for the training of the GNV2 network is shown in Table 2.
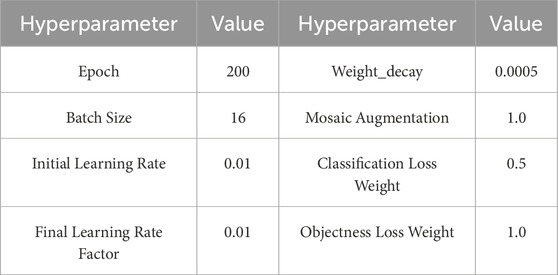
Table 2. Hyperparameter configuration for GNV2 network training.
4.2 Performance evaluation of VSLAM algorithms
4.2.1 TUM dataset
A publicly available TUM RGB-D dataset was used to evaluate the proposed system. The dataset, published by the Technical University of Munich, was acquired using a Kinect camera and contains time-synchronized color images, depth images, and camera positional truth (Ground Truth) from a high-precision motion capture system (Motion Capture). The image resolution is 640 × 480, which is suitable for evaluating the localization accuracy and robustness of various RGB-D SLAM algorithms in indoor environments (Singh et al., 2024). The TUM dataset encompasses a diverse range of scenarios, including low-texture environments, fast camera motion, illumination variations, and so on. These characteristics provide a rich set of samples for testing algorithms’ robustness and generalization capabilities. In this study, the representative sequences were selected such as fr3_sitting_halfsphere, fr3_walking_rpy, fr3_walking_xyz, among others. These sequences cover complex scenarios that ranging from low-dynamic environments to high-dynamic environments.
4.2.2 Assessment methods
In order to quantitatively evaluate the trajectory estimation performance of the SLAM system, this study employed the evaluation tool provided by the TUM dataset to compare the camera trajectories outputted by our system against the true value trajectories included in the dataset. Absolute Trajectory Error (ATE) serves as one of the key metrics for evaluating the performance of SLAM system performance, which is used to quantify the positional deviation between the estimated trajectory of the system and the true trajectory (Ground Truth). ATE measures the spatial global consistency across entire trajectory while reflecting cumulative error over extended periods, thus providing an effective method to both algorithm robustness and localization accuracy. In addition to ATE analysis, this paper also incorporated Relative Pose Error (RPE) as a supplementary evaluation metrics. RPE focuses on the relative transformation error between neighboring frames, and can effectively evaluate the local accuracy and trajectory smoothness of the system in short time scales. This metric is especially suitable for analyzing the drift phenomenon caused by the instability of position estimation. By comparing the performance of different algorithms in the ATE and RPE dimensions, each algorithm’s actual performance in different scenarios can be more comprehensively revealed.
The formula used to calculate the absolute trajectory error between the estimated trajectory Q and the true trajectory P is shown in Equation 6.
Where, n is the number of trajectory points on the trajectory.
The relative trajectory error is shown in Equation 7.
where, Δ is the time interval between two consecutive poses.
5 Experimental results
5.1 Results of the GNV2 experiment
In this study, significant emphasis has been placed on optimizing the structural complexity of the GNV2 model to minimize the computational resource consumption during the inference phase, while maintaining both accuracy and real-time performance in model detection. To comprehensively evaluate the model performance, metrics were utilized as follows: the target detection accuracy as measured by the average precision with an IoU threshold of 0.5 (mAP@0.5), the number of model parameters (Parameters), computational overhead measured by hundreds of billions of floating-point operations per second (GFLOPs), and the size of the model weights file are used to characterize the structural complexity of the model. The last three metrics collectively reflect the computational resource requirements of the model during deployment.
5.1.1 Lightweight network comparison experiment
Three mainstream obtained lightweight feature extraction networks were replaced with the backbone network of the original YOLOv8s to obtain three lightweight variant networks. These lightweight variant networks would be trained on the self-constructed cowshed inspection environment dataset to generate the corresponding target detection models. The experimental results for the different lightweight variant networks are shown in Table 3.
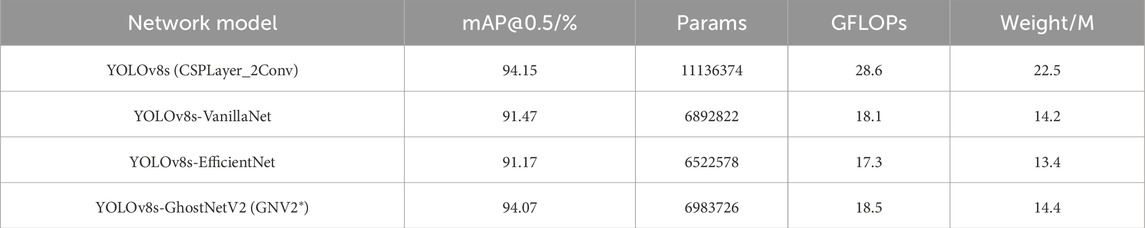
Table 3. Comparative experiments on lightweight variant networks.
The experimental results indicated that replacing the original backbone network of YOLOv8s with VanillaNet (Chen et al., 2023), EfficientNet (Tan and Le, 2020) and GhostNetV2, leads to a significant reduction in the number of parameters, computational load, and the model size. Although there is a decrease in detection accuracy, the extent of this reduction varies among different models. Specifically, YOLOv8s-VanillaNet exhibits a decline in detection accuracy by 2.68%, resulting in an accuracy of 91.47%. Conversely, YOLOv8s-EfficientNet experiences the most substantial decrease in accuracy at 2.98% while achieving a remarkable reduction in computational workload by 39.51%. In contrast, YOLOv8s-GhostNetV2 (GNV2*) mitigates model complexity while preserving detection accuracy, it showed only a minor drop of 0.08% in average detection accuracy along with notable reductions: 37.29% fewer parameters, 35.31% decrease in computation load, and 36% reduction in the model size. The comprehensive performance advantages were so evident that GNV2* was selected as the foundational network for further enhancements within this study.
5.1.2 Comparative experiments on attention mechanisms
Three different attentional modules, such as EffectiveSE, MHSA and ECA, were selected for comparison experiments with CBAM channel attentional modules. The results of the comparison experiments of the attention mechanisms are shown in Table 4.
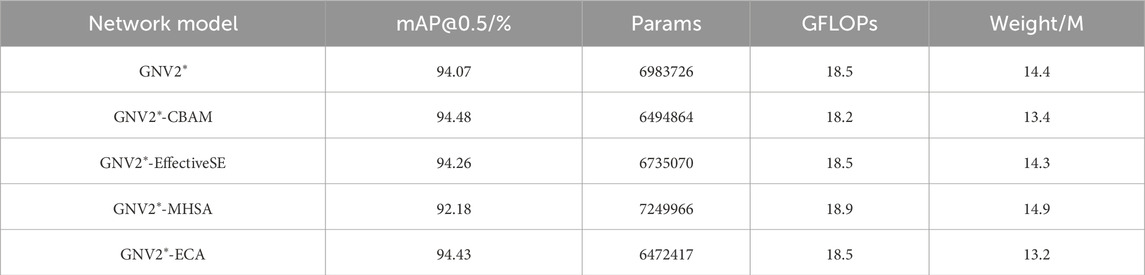
Table 4. Attention comparison experiment.
The experimental data indicate that the introduction of the MHSA attention mechanism not only increases the model’s complexity but also reduces its accuracy. After increasing the EffectiveSE attention mechanism, there was a slight enhancement in average detection accuracy compared to the GNV2* model, while the number of parameters and the model size were also reduced. A comparative analysis between the ECA and CBAM attention mechanism revealed minimal differences regarding their respective advantages. Although the ECA attention mechanism offers the advantage of a smaller model, the introduction of the CBAM attention mechanism resulted in the highest average detection accuracy, improving by 0.41% compared to the original GNV2* model, while also achieving the lowest floating-point computation. Therefore, the incorporation of the CBAM attention mechanism significantly enhances the performance of the GNV2* model. Consequently, the introduction of CBAM attention mechanism more effectively enhances the performance of the GNV2* model.
5.1.3 Downsampling module comparison experiments
Through the comparison experiments of different attention mechanisms, the results showed that introducing the CBAM attention mechanism into the GNV2* model significantly improves its accuracy. On the basis of this finding, the superiority of the model performance after the introduction of the SCDown downsampling module was verified by comparing with the ADown and RFCAConv downsampling modules. The results from these downsampling comparison experiments are shown in Table 5.

Table 5. Downsampling comparison experiments.
The experimental data indicate that the introduction of the ADown downsampling operator decreases the floating-point computations, the number of parameters and the model size significantly compared with the initial model GNV2*-CBAM model. However, this improvement is accompanied by a slight decrease in the average accuracy of 0.28%. The introduction of the RFCAConv downsampling operator enhances the model complexity while increasing the detection accuracy. The model accuracy improved the most when the SCDown operator was combined with the original model, reaching 95.19%, while the average model accuracy improved by 0.75%. In addition, the number of parameters and floating-point calculations were also low, enabling a better balance between efficiency and performance. This enables a more favorable balance between efficiency and performance. Thus, the final model obtained by fusing GNV2* lightweight network, CBAM attention mechanism and SCDown downsampling was designated as GNV2.
5.1.4 Algorithm comparison experiments
The GNV2 model was compared with different models of YOLO series to highlight the performance advantages of the algorithms proposed in this study. The data of average detection accuracy and model size were used to compare the performance difference of different algorithms on the self-constructed cowshed inspection dataset. The results of comparison experiments of different algorithms of YOLO series are shown in Table 6.
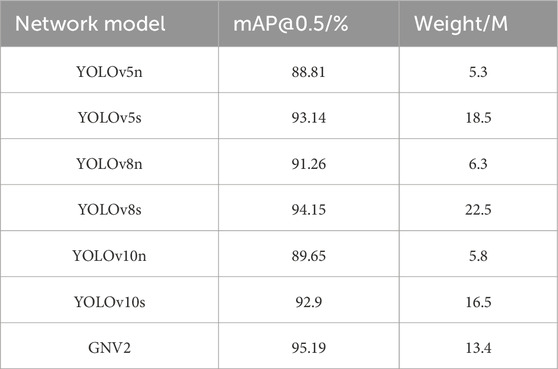
Table 6. Comparison experiment of different algorithms of YOLO series.
The experimental results indicate that GNV2 surpasses other models within the YOLO series in terms of average detection accuracy. It achieved an accuracy that was still 3.93% higher than that of the highest-accuracy YOLOv8n, even though it does not have the advantage of YOLOv5n, YOLOv8n, and YOLOv10n in terms of model size. In comparison to its predecessor YOLOv8s, the GNV2 model size was reduced by 40.44%, rendering it 3.1M smaller than YOLOv10s while also improving its accuracy by 2.29%. In conclusion, GNV2 effectively balances high accuracy with substantial model compression requirements while considering both performance metrics and lightweight design. The mAP@0.5 performance curves of each model in different experiments are shown in Figure 8.
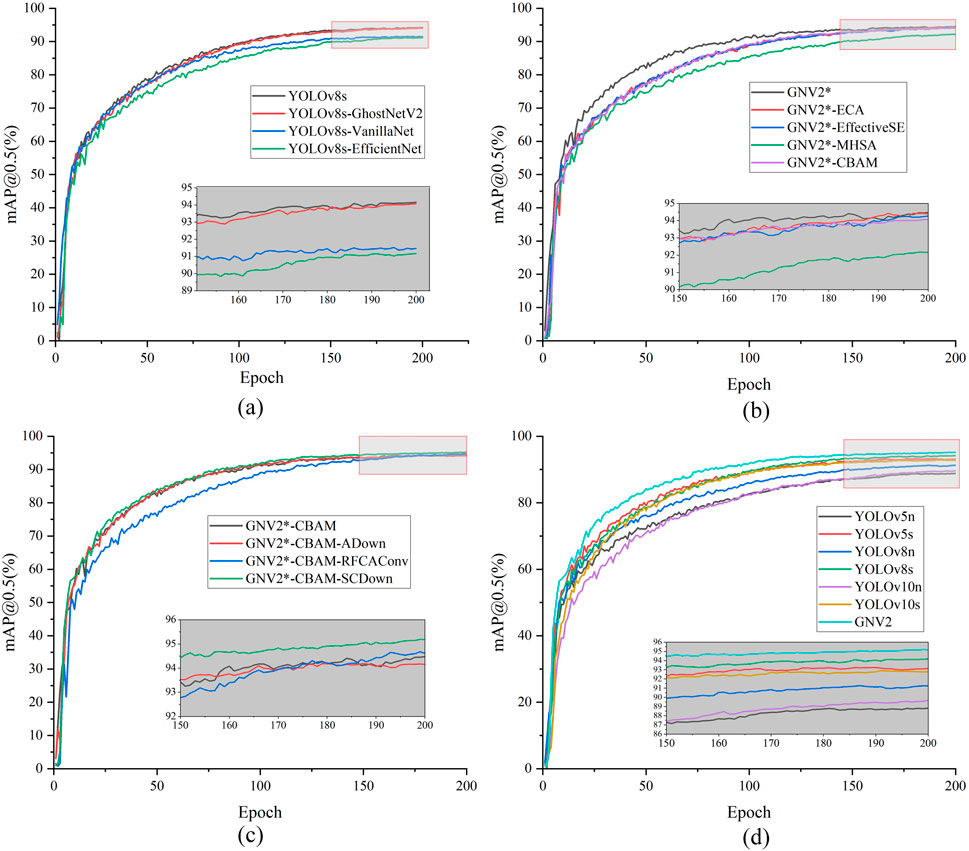
Figure 8. mAP@0.5 graph. (a) The mAP@0.5 curves of different models in the lightweight network comparison experiment; (b) The mAP@0.5 curves of different models in the attention comparison; (c) The mAP@0.5 curves of different models in the downsampling comparison experiment; (d) The mAP@0.5 curves of different models in the algorithm comparison experiment.
The results presented in Figure 8 provide validation for the effectiveness of the selected strategies at each stage. Furthermore, a comparative analysis was conducted between the detection accuracy of the GNV2 model and that of the YOLOv8s to evaluate its improvement. The detection results are shown in Figure 9, demonstrating that the overall detection accuracy of GNV2 surpasses that of YOLOv8s network.
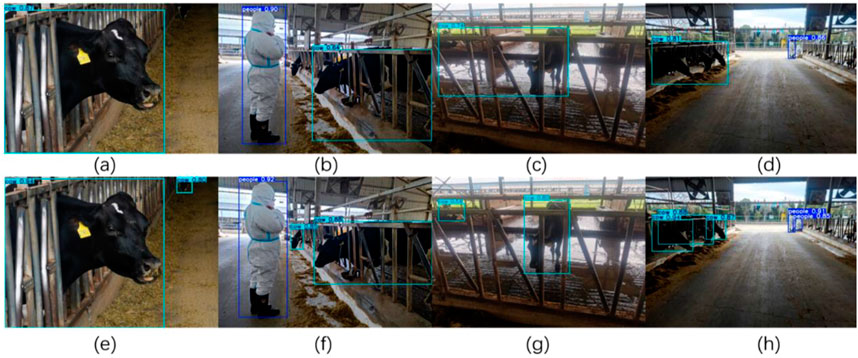
Figure 9. Comparison of the detection results of YOLOv8s and GNV2. The images in the first row (a–d) represent the detection results of YOLOv8s in four images; the images in the second row (e–h) represent the detection results of GNV2 in the same four images as YOLOv8s.
5.2 GNV2-SLAM experimental results
The GNV2 model was integrated into the GNV2-SLAM system for performing the target recognition task. Subsequently, the overall performance of GNV2-SLAM as well as the tracking elapsed time were evaluated on the TUM dataset. Using the ORB-SLAM2 as a reference, the performance difference between GNV2-SLAM and Dyna-SLAM were further compare. All algorithms were executed independently for five times under identical conditions, and the final results were averaged as the evaluation metrics.
5.2.1 Effectiveness of dynamic feature removal and point and line feature fusion
In order to verify the effectiveness of the point and line feature extraction algorithm, experiments were conducted on different images in the cowshed inspection dataset. The images following feature extraction and matching are shown in Figure 10.
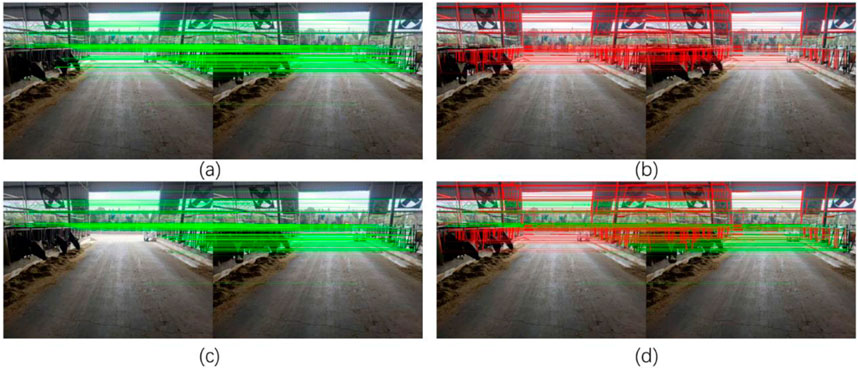
Figure 10. Different feature extraction results (a) shows the effect of extracting only ORB feature points and matching, some of the feature points were located on the cow, which may affect the subsequent calculation of the SLAM system and cannot guarantee the accuracy of localization, and Figure (b) shows the effect of matching after eliminating the feature points on the dynamic target. Figure (c) shows the effect of extracting LSD line features and matching. Figure (d) shows the effect of removing the dynamic region as well as point-line fusion proposed in this paper.
5.2.2 TUM dataset for performance evaluation
The performance of the SLAM algorithm was evaluated by selecting the root mean square error (RMSE) and standard deviation (SD) in low-dynamic environments (fr3_s_hs) and high-dynamic environments (fr3_w_hs, fr3_w_rpy, etc.). The results pertaining to absolute trajectory error, comparison of relative positional error translational drift, comparison of relative positional error rotational drift for GNV2-SLAM algorithm, ORB-SLAM2 algorithm, and Dyna-SLAM algorithm are shown in the tables as Tables 7-9 respectively.
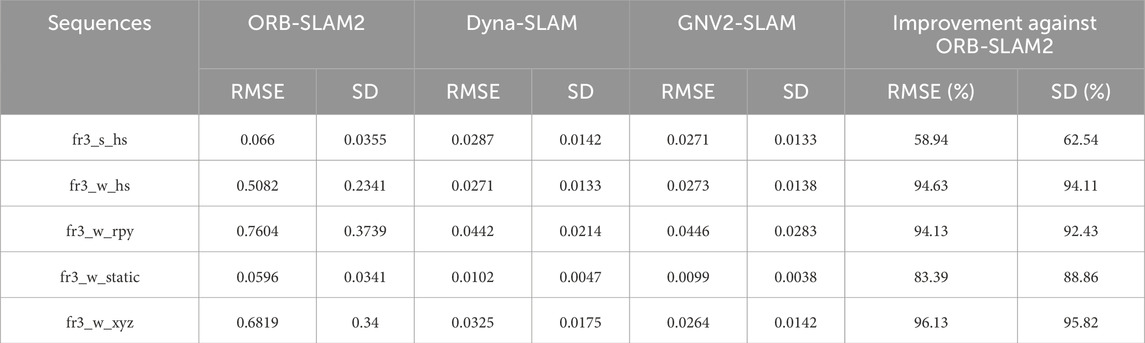
Table 7. Absolute trajectory error results for different algorithms.
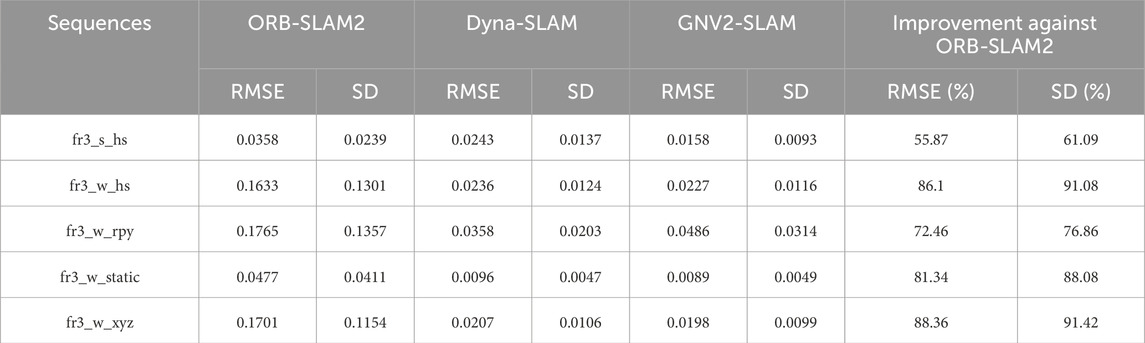
Table 8. Relative trajectory translation error results for different algorithms.
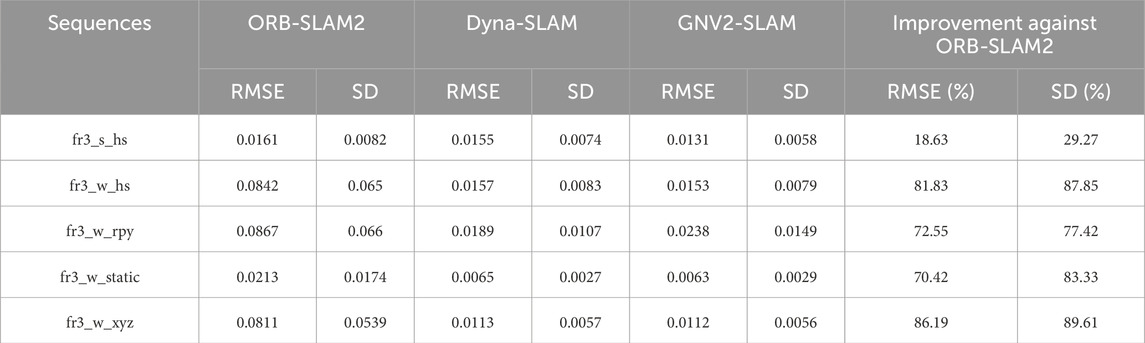
Table 9. Relative trajectory rotation error results for different algorithms.
The experimental results indicate that GNV2-SLAM significantly outperforms ORB-SLAM2 in terms of absolute trajectory error in high-dynamic environments, with RMSE decreasing exceeding 83.39% and SD decreasing exceeding 88.86%. Compared with Dyna-SLAM, GNV2-SLAM exhibited superior localization accuracy in low-dynamic scenarios while showing comparable performance in high-dynamic scenarios. In contrast, the GNV2 network can effectively identify dynamic targets, improving the robustness of the system in dynamic environments. Regarding relative trajectory error, the relative position error of GNV2-SLAM was lower than that of ORB-SLAM2 in low dynamic scenarios. with slight improvements observed in accuracy. Conversely, in high dynamic scenarios, the translation error RMSE decreases by up to 88.36%, and the SD decreases by up to 91.42%. The trend of rotation error was also consistent. In some sequences, the overall performance of GNV2-SLAM was better than that of Dyna-SLAM, and Figure 11 shows the comparison of the absolute trajectory error (ATE) of ORB-SLAM2, Dyna-SLAM and GNV2-SLAM in some sequences. The results indicate that the error of GNV2-SLAM was significantly reduced and exhibits higher localization accuracy.

Figure 11. Absolute trajectory error maps Image (a,d,g) represents the ATE maps of ORB-SLAM2, Dyna-SLAM, and GNV2-SLAM on fr3_w_hs sequences, respectively; image (b,e,h) represents the ATE maps of the three algorithms on fr3_w_hs sequences; image (c,f,i) represents the ATE maps of the three algorithms on fr3_w_xyz sequence.
5.2.3 Tracking time assessment
VSLAM systems needs to strike an optimal balance localization accuracy and real-time performance. To evaluate the real-time performance of these algorithms, this study compares the average tracking time of ORB-SLAM2, Dyna-SLAM and GNV2-SLAM using the TUM dataset. In this experiment, the average time for each algorithm to process a single image frame were counted, and measured the time consumption of the tracking process. The results were in seconds, and are shown in Table 10.
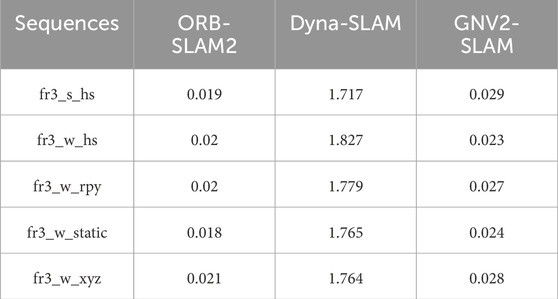
Table 10. Time consumption of the tracking process.
The experimental data analysis revealed that although GNV2-SLAM has a slight increase in time overhead compared to ORB-SLAM2 after the introduction of the target detection threading processes, the system can still successfully complete single frame image tracking within approximately 29 ms, which provides a significant advantage in real-time performance. Compared with Dyna-SLAM, GNV2-SLAM demonstrates an approximate reduction in processing time by about 90%, further highlighting its substantial benefit in terms of real-time performance.
5.2.4 Assessment in real environments
In order to verify the effectiveness of the proposed algorithm, it was deployed the algorithm to a cowshed inspection robot and tested the localization accuracy of the GNV2-SLAM in a cowshed inspection environment. The experiments used an NVIDIA Jetson Xavier NX as the robot’s upper computer with Ubuntu 18.04 operating system and configured with a Melodic version of the ROS (Robot Operating System) system. The inspection robot moves along a straight line at speeds of 0.4 m/s and 0.6 m/s while employing the GNV2-SLAM system and the ORB-SLAM2 system, respectively. The resulting trajectories from different vision SLAM systems are shown in Figure 12.

Figure 12. Absolute trajectory error maps Images (a,b) represent the trajectory maps computed by ORB-SLAM2 at 0.4 m/s and 0.6 m/s velocity on the robot, respectively. Image (c,d) represents the trajectory maps computed by GNV2-SLAM2 at 0.4 m/s and 0.6 m/s velocity on the robot, respectively.
From the experimental results, it could be seen that during the robot’s movement along a straight line, the interference of dynamic targets occurs, which leads to an obvious drift in the trajectory of ORB-SLAM2. GNV2-SLAM utilizes the line features in the cowshed environment to perform point and line fusion to make the trajectory closer to the real trajectory while eliminating the dynamic targets.
6 Discussion
This paper proposes an improved GNV2-SLAM method based on the ORB-SLAM approach. The method maintains high accuracy while significantly enhancing the system’s real-time performance. By refining the GNV2 model, the system’s robustness and accuracy in object recognition are improved. GNV2-SLAM demonstrates superior precision in high-dynamic environments, particularly excelling in object recognition and localization accuracy, which highlights its strong model compression capability and efficient extraction of point and line features.
It is worth noting that in certain high-dynamic environments, GNV2-SLAM still shows some gaps compared to Dyna-SLAM. The main reason lies in Dyna-SLAM’s ability to leverage prior dynamic region information from each frame to achieve pixel-level semantic segmentation, thus providing stronger dynamic point filtering capabilities that effectively enhance the precision of static environment mapping. The global optimization strategy of GNV2-SLAM may lead to instability or misoptimization in dynamic scenes due to frequent interference from dynamic objects. However, comparing the Relative Pose Error (RPE) results shows that GNV2-SLAM, through point-line feature fusion, significantly reduces computational errors, effectively optimizing the pose estimation process and improving the system’s accuracy and stability.
However, due to budget constraints, the research has primarily focused on the algorithm’s effectiveness, and hardware experiments still require improvement. Future work will focus on the adaptation of the algorithm to complex hardware platforms, aiming to achieve automated monitoring of livestock activity, spatial distribution, and facility safety. Additionally, multiple metrics will be used to comprehensively assess the adaptability and application potential of GNV2-SLAM in dynamic agricultural environments.
7 Conclusion
This paper presents a vision-based SLAM method, GNV2-SLAM, which integrates dynamic object removal and point-line feature fusion for livestock barn inspection. Building on ORB-SLAM2, the method introduces a target detection thread and a dynamic point removal module. By adopting a lightweight design for the target detection model, the overall computational complexity is reduced. Additionally, the CNAM attention mechanism and SCDown downsampling structure are incorporated to further optimize performance without increasing model complexity. This model is integrated into the SLAM system, and point and line features are fused to improve pose estimation.
Experimental results show that, compared to YOLOv8s, the GNV2 network model achieves a 1.04% improvement in average detection accuracy, with a 41.96% reduction in the number of parameters, a 36.71% decrease in computational load, and a 40.44% reduction in model size. After integrating GNV2-SLAM into the visual SLAM system, performance evaluation on the TUM dataset demonstrates that GNV2-SLAM outperforms ORB-SLAM2 in high-dynamic scenes, achieving a reduction of over 83.39% in RMSE and 88.86% in SD for absolute trajectory error. For relative trajectory error, the translation error RMSE shows a maximum reduction of 88.36%, with SD reduced by 91.42%, and the rotation error follows a similar trend to the translation error. In the tracking evaluation, GNV2-SLAM processes each frame of the image within 30 ms, highlighting its excellent real-time performance and competitive advantage. Real-world evaluation results show that the trajectory generated by the proposed algorithm more accurately reflects the robot’s motion path in the actual environment.
Given the challenges posed by strong ground reflections and frequent target occlusions in livestock barn environments, future research will consider introducing a multimodal perception mechanism. By integrating thermal imaging, LiDAR, and visual data, the fusion of multimodal data and a deep learning-optimized multi-input network structure can enhance the system’s robustness and adaptability, improving target recognition and localization accuracy, and overcoming the limitations of GNV2-SLAM in occlusion and reflection scenarios. Furthermore, considering the dynamic nature of livestock, future work will focus on further optimizing dynamic object modeling and segmentation strategies to enhance map consistency and localization accuracy under conditions of frequent animal movement.
Data availability statement
The raw data supporting the conclusions of this article will be made available by the authors, without undue reservation.
Author contributions
XD: Methodology, Funding acquisition, Supervision, Writing – review and editing, Conceptualization. TL: Software, Formal Analysis, Writing – original draft. XJ: Data curation, Investigation, Software, Writing – review and editing. XY: Visualization, Funding acquisition, Writing – review and editing. XX: Visualization, Software, Writing – review and editing. CZ: Investigation, Writing – review and editing.
Funding
The author(s) declare that financial support was received for the research and/or publication of this article. This work was supported by the Science and Technology Innovation Leading Talent Support Program of Henan Province (Grant No. 254000510059), the Major Innovation Project of Henan Province (Grant No. 241112220100), and Longmen Laboratory’s emerging industry project (Grant No. LMFKCY2023001).
Conflict of interest
The authors declare that the research was conducted in the absence of any commercial or financial relationships that could be construed as a potential conflict of interest.
Generative AI statement
The author(s) declare that no Generative AI was used in the creation of this manuscript.
Any alternative text (alt text) provided alongside figures in this article has been generated by Frontiers with the support of artificial intelligence and reasonable efforts have been made to ensure accuracy, including review by the authors wherever possible. If you identify any issues, please contact us.
Publisher’s note
All claims expressed in this article are solely those of the authors and do not necessarily represent those of their affiliated organizations, or those of the publisher, the editors and the reviewers. Any product that may be evaluated in this article, or claim that may be made by its manufacturer, is not guaranteed or endorsed by the publisher.
References
Bescos, B., Fácil, J. M., Civera, J., and Neira, J. (2018). “DynaSLAM: tracking, mapping,” in Inpainting in dynamic scenes. doi:10.1109/LRA.2018.2860039
Chen, Z., Sheng, W., Yang, G., Su, Z., and Liang, B. (2018). “Comparison and analysis of feature method and direct method in visual SLAM technology for social robots,” in 2018 13th world congress on intelligent control and automation (WCICA). Presented at the 2018 13th world congress on intelligent control and automation (WCICA), 413–417. doi:10.1109/WCICA.2018.8630714
Chen, H., Wang, Y., Guo, J., and Tao, D. (2023). VanillaNet: the power of minimalism in deep learning. doi:10.48550/arXiv.2305.12972
Favorskaya, M. N. (2023). Deep learning for visual SLAM: the state-of-the-art and future trends. Electronics 12, 2006. doi:10.3390/electronics12092006
Grompone Von Gioi, R., Jakubowicz, J., Morel, J.-M., and Randall, G. (2012). LSD: a line segment detector. Image Process. Line 2, 35–55. doi:10.5201/ipol.2012.gjmr-lsd
Han, K., Wang, Y., Tian, Q., Guo, J., Xu, C., and Xu, C. (2020). GhostNet: more features from cheap operations. 1577, 1586. doi:10.1109/cvpr42600.2020.00165
He, K., Gkioxari, G., Dollár, P., and Girshick, R. (2018). Mask R-CNN. doi:10.48550/arXiv.1703.06870
Islam, Q. U., Ibrahim, H., Chin, P. K., Lim, K., and Abdullah, M. Z. (2023). Dynamic object-aware SLAM: yoloV8 integration and enhanced multi-view geometry for reliable mapping in dynamic environment. Available online at: https://ieeexplore.ieee.org/abstract/document/10371761.doi:10.1109/icispc59567.2023.00013
Islam, R., Habibullah, H., and Hossain, T. (2023). AGRI-SLAM: a real-time stereo visual SLAM for agricultural environment. Auton. Robot. 47, 649–668. doi:10.1007/s10514-023-10110-y
Jia, G., Li, X., Zhang, D., Xu, W., Lv, H., Shi, Y., et al. (2022). Visual-SLAM classical framework and key techniques: a review. Sensors 22, 4582. doi:10.3390/s22124582
Li, D., Zhang, X., Wang, Y., Liu, H., Zhao, F., Chen, M., et al. (2021). A SLAM system based on RGBD image and point-line feature. IEEE Access 9, 9012–9025. doi:10.1109/ACCESS.2021.3049467
Liu, Y., and Miura, J. (2021). RDMO-SLAM: real-time visual SLAM for dynamic environments using semantic label prediction with optical flow. IEEE Access 9, 106981–106997. doi:10.1109/ACCESS.2021.3100426
Mur-Artal, R., and Tardós, J. D. (2017). ORB-SLAM2: an open-source SLAM system for monocular, stereo, and RGB-D cameras. IEEE Xplore 33, 1255–1262. doi:10.1109/tro.2017.2705103
Singh, B., Kumar, P., and Kaur, N. (2024). “Advancements and challenges in visual-only simultaneous localization and mapping (V-SLAM): a systematic review,” in 2024 2nd International Conference on Sustainable Computing and Smart Systems (ICSCSS). Presented at the 2024 2nd International Conference on Sustainable Computing and Smart Systems (ICSCSS), 116–123. doi:10.1109/ICSCSS60660.2024.10624826
Song, S., Lim, H., Lee, A. J., and Myung, H. (2022). DynaVINS: a visual-inertial SLAM for dynamic environments. IEEE Robot. Autom. Lett. 7, 11523–11530. doi:10.1109/LRA.2022.3203231
Sun, L., Wei, J., Su, S., and Wu, P. (2022). SOLO-SLAM: a parallel semantic SLAM algorithm for dynamic scenes. Sensors 22, 6977. doi:10.3390/s22186977
Tan, M., and Le, Q. V. (2020). EfficientNet: rethinking model scaling for convolutional neural networks. doi:10.48550/arXiv.1905.11946
Tang, Y., Han, K., Guo, J., Xu, C., Xu, C., and Wang, Y. (2022). GhostNetV2: enhance cheap operation with long-range attention. doi:10.48550/arXiv.2211.12905
Wan Aasim, W. F. A., Okasha, M., and Faris, W. F. (2022). Real-time artificial intelligence based visual simultaneous localization and mapping in dynamic environments – a review. J. Intell. Robot. Syst. 105, 15–23. doi:10.1007/s10846-022-01643-y
Wang, R., Wang, Y., Wan, W., and Di, K. (2018). A point-line feature based visual SLAM method in dynamic indoor scene. IEEE Xplore, 1–6. doi:10.1109/UPINLBS.2018.8559749
Woo, S., Park, J., Lee, J.-Y., and Kweon, I. S. (2018). CBAM: convolutional block attention module. 3, 19. doi:10.1007/978-3-030-01234-2_1
Wu, W., Guo, L., Gao, H., You, Z., Liu, Y., and Chen, Z. (2022). YOLO-SLAM: a semantic SLAM system towards dynamic environment with geometric constraint. Neural comput. Appl. 34, 6011–6026. doi:10.1007/s00521-021-06764-3
Yu, C., Liu, Z., Liu, X.-J., Xie, F., Yang, Y., Wei, Q., et al. (2018). DS-SLAM: a semantic visual SLAM towards dynamic environments. IEEE Xplore, 1168–1174. doi:10.1109/IROS.2018.8593691
Yuan, C., Xu, Y., and Zhou, Q. (2023). PLDS-SLAM: point and line features SLAM in dynamic environment. Remote Sens. 15, 1893. doi:10.3390/rs15071893
Zhang, C. (2021). PL-GM:RGB-D SLAM with a novel 2D and 3D geometric constraint model of point and line features. IEEE Access 9, 9958–9971. doi:10.1109/ACCESS.2021.3049801
Zhang, X., Zhang, R., and Wang, X. (2022). Visual SLAM mapping based on YOLOv5 in dynamic scenes. Appl. Sci. 12, 11548. doi:10.3390/app122211548
Keywords: SLAM, YOLOv8, GNV2-SLAM, cowshed inspection, computer vision
Citation: Du X, Li T, Jin X, Yu X, Xie X and Zhang C (2025) GNV2-SLAM: vision SLAM system for cowshed inspection robots. Front. Robot. AI 12:1648309. doi: 10.3389/frobt.2025.1648309
Received: 18 July 2025; Accepted: 28 August 2025;
Published: 19 September 2025.
Edited by:
Faiza Gul, Air University-Kamra Campus, PakistanReviewed by:
Felipe Trujillo-Romero, Universidad de Guanajuato, MexicoLaurens Keuker, RWTH Aachen University, Germany
Copyright © 2025 Du, Li, Jin, Yu, Xie and Zhang. This is an open-access article distributed under the terms of the Creative Commons Attribution License (CC BY). The use, distribution or reproduction in other forums is permitted, provided the original author(s) and the copyright owner(s) are credited and that the original publication in this journal is cited, in accordance with accepted academic practice. No use, distribution or reproduction is permitted which does not comply with these terms.
*Correspondence: Xinwu Du, ZHVfeGlud3VAc2luYS5jb20=