Abstract
Background:
Contradictory evidence exists on whether medicine explicates social disparities in health perceptions. This study evaluates healthcare systems as mesocosms to understand social differences in spousal violence perceptions in sub-Saharan Africa, concretely, cohort differences in victim decisions in spousal violence (VDSV).
Conceptual framework:
Medical dominance theory criticizes medical power asymmetry, while socio-ecological theory illuminates social disparities in human behavior. This study investigates socio-behavioral patterns in medicine as parallels to spousal violence behaviors, analyzing how power asymmetry influences VDSV in sub-Saharan Africa.
Methods:
A cross-sectional study analyzed data from the latest Demographic and Health Surveys (2001–2024) across 31 countries, focusing on 193,232 women aged 15–49 years and their VDSV patterns: none, Discordant, and Other types. Unadjusted odds ratios (ORs) examined associations between VDSV patterns and birth cohorts (BCs) while adjusting for confounders. Interaction terms assessed the impact of neighborhood ethnic diversity, relationship power differences, and healthcare access. A two-level hierarchical multinomial logistic regression model analyzed VDSV variation, considering individual, cluster, and household-level confounders with random country effects. Spatial interpolation addressed geographical clustering. Analyses were performed using the McLogit package in R (Version 4.4.0).
Results:
Across BCs, a greater percentage change in predicted marginal probabilities was observed for Other type VDSV compared to Discordant VDSV. Overall, women with recent healthcare access had smaller percentage changes; those with a large relationship power difference, especially, showed the opposite trend. Notably, observed healthcare access effects persisted beyond socioeconomic disparities.
Discussion:
Higher VDSV amongst younger birth cohorts suggests lower SV-accepting attitudes. VDSV differences across healthcare access intimate anti-violence intervention exposure effects; relationship power differences play moderating roles. Persistent adjusted healthcare access effects suggest roles for narrowing socio-health inequalities in SSA.
Conclusion:
The study results advocate for macro-societal policies within healthcare that address social issues, particularly through theory-based approaches. Future research may evaluate the potential influence of healthcare funding cuts.
1 Purpose of study
1.1 Medicine and social problems
Evidence indicates that unethical medical practices can exacerbate persistent social issues, like the racial health inequalities highlighted by the controversial Tuskegee syphilis study (Thomas and Quinn, 1991; Gamble, 1997). Conrad (1992) outlines pathways (Conrad, 1992, 2007) for medical social control (Zola, 1972; Illich, 1976), including medical ideology, such as the medical model (Parsons, 1975; Silverman, 1983), medical collaboration, such as workplace screening and intervention for infectious diseases or substance abuse (R. Williams and Williams-Morris, 2000; Marcotte, 2004), incremental population-based medical surveillance (Foucault, 1975; Armstrong, 1995), and the use of medical technology for social control (Conrad and Schneider, 1992; Rose, 2001), such as genetic screening (Rose, 2001; National Research Council (U.S.) et al., 2008).
Some research studies on medical approaches to social problems (Conrad and Schneider, 1992; Ityo, 2010; Dillon, 2020) extend the medical ideology pathway (Conrad, 1992, 2007), proposing macrocosm, mesocosm, and microcosm research analogies. These view research experiment environments as microcosms, explaining larger or equal environments (macrocosm or mesocosm environments) and vice versa (Odum, 1984; Carpenter, 1996). This study examines medicine as a mesocosm to understand social differences in perceptions of spousal violence (SV) in sub-Saharan Africa (SSA). It focuses on cohort differences in medical dominance (MD) victim decisions as mesocosms to understand cohort disparities in spousal violence victim decisions (VDSV).
Research on social aspects of medicine explores social problems at macro-, mezzo-, and micro-levels, their effects on medicine, and vice versa (Evans et al., 1994; Marmot and Wilkinson, 2006), to support evidence-based national policy (Solar and Irwin, 2010). It also examines social problems within medicine and their impacts (Starr, 1982; Conrad, 1992). However, gaps remain in understanding how these interaction effects occur.
1.2 Healthcare systems and victim decisions in spousal violence
Surviving SV is partly about victim decisions. VDSV are discussed in various ways, such as whether victims sought help (Ahmad et al., 2009; Itimi et al., 2014; Metheny and Stephenson, 2019), distinguishing between short-term and long-term responses (Kaye et al., 2007; Ahmad et al., 2009), and whether victims utilized attitudinal or emotional responses instead of behavioral responses (Kanagaratnam et al., 2012; Swart, 2013; Arestoff and Djemai, 2016). Some discussions center on barriers to help-seeking, distinguishing between group-level barriers (Rizo and Macy, 2011; Prosman et al., 2014; Huntley et al., 2019; Satyen et al., 2019). Another method contrasts direct and indirect sources of violence (Swart, 2013; Balogun and John-Akinola, 2015; Mannell et al., 2016), such as violence due to victim poverty (Swart, 2013) compared to wealth (Balogun and John-Akinola, 2015). Other studies examine the motivation for victim behavior, whether self-initiated, aka individual agency (Horn et al., 2016; Mannell et al., 2016; McCleary-Sills et al., 2016) or other-initiated, aka structure-initiated (Allen and Devitt, 2012; Horn et al., 2016; Mannell et al., 2016). Regarding other-initiated VDSV, several studies in SSA postulate that SV experiences precede healthcare system contact (Allen and Devitt, 2012; Horn et al., 2016; Mannell et al., 2016); evidence from SSA's high maternal mortality rates, for example, links SV experience among the urban poor to compromised help-seeking during pregnancy and delivery, including mortality-risk exacerbating decisions (Essendi et al., 2011), resulting in higher maternal mortality (Ziraba et al., 2009a; Izugbara and Ngilangwa, 2010). Furthermore, however, evidence suggests that socio-behavioral patterns within medicine may explain those outside medicine and vice versa (Parsons, 1975; Conrad, 2005; Timmermans and Oh, 2010). However, contradictory evidence exists on whether medicine may explain health perceptions, including SV perceptions, while some views disagree (McKeown, 1979; Fogel and Costa, 1997) and others concur (Parsons, 1975; Conrad and Schneider, 1992).
1.3 Healthcare systems and social differences in spousal violence perceptions
Generally, social inequalities in health perceptions exist, such as socioeconomic inequalities (Quesnel-Vallee, 2004; Lutfey and Freese, 2005). However, limited evidence exists on social disparities in SV perceptions, including help-seeking behavior (Solar and Irwin, 2010). SV perpetrated by current or former intimate partners is high in SSA, higher among women, and even higher among adolescents (ICF, 2012b; UN-WOMEN, 2024), yet overall, < 50% of victims seek help (ICF, 2012b; UN-WOMEN, 2024). Some victims, supposing SV-accepting family or community social norms, such as protecting family honor (Kanagaratnam et al., 2012; Mannell et al., 2016), ineffectively seek help from family and friends (UN-WOMEN, 2024). Moreover, despite higher SV incidence amongst younger spousal partners, effective responses, including reporting, were less likely, such as with powerful partners (ICF, 2012b; Kenya National Bureau of Statistics et al., 2015). Help-seeking is further unlikely due to the high femicide risk (UN-WOMEN, 2024). The 2024 anti-femicide protests in Kenya, for instance, underscored the exacerbating effect of delayed SV penalties on femicide (Africapractice, 2024). Despite higher female life expectancy estimates worldwide, higher lifetime female disability-life adjusted years estimates are reported for depressive anxiety and headache disorders (Patwardhan et al., 2023), frequently associated with SV (Balogun and John-Akinola, 2015; Hatcher et al., 2022; Metheny et al., 2024). Finally, there is diminished help-seeking, including reporting, due to the intersectionality of disadvantage. Amongst the urban poor, for example (Wilson, 1987; Small and Newman, 2001; African Population and Health Research Center, 2002), environmental degradation exacerbates sexual violence risk and hampers subsequent help-seeking via increased crime and the resulting disruptions in essential service provision disruptions (Corburn and Hildebrand, 2015; Corburn and Sverdlik, 2017).
Contradictory evidence exists on healthcare system approaches to social disparities in health perceptions, including SV perceptions. Some equity perspectives highlight healthcare systems' failure to narrow social inequality. Certain studies indicate incorrect associations between preceding healthcare system improvements and succeeding population health inequality narrowing (Great Britain Working Group on Inequalities in Health et al., 1982; Mackenbach et al., 1997; Lutfey and Freese, 2005). Other studies indicate an incorrect attribution of ongoing population health improvements to current healthcare system enhancements (McKeown, 1979; Fogel and Costa, 1997). Supporting studies, however, link value-free physician–patient interactions (Parsons, 1975) to diminished population health inequalities (Ananth et al., 2001; Alexander et al., 2002; Rittenhouse et al., 2003), whereas value-influenced physician–patient interactions (Abbott, 1988; Conrad, 2005) were associated with persistent health inequalities (Hollingshead and Redlich, 1953; Silverman, 1981, 1983; Solar et al., 2007).
While some SSA studies mention linkages between healthcare systems and SV, limited literature focuses on social differences in SV perceptions. Research in SSA indicates that healthcare systems can integrate health service responses to SV (Colombini et al., 2008, 2017; Joyner and Mash, 2011), enhancing victim support and provider insights. These systems enable comprehensive testing of health service responses to SV (Sprague et al., 2016; Hatcher et al., 2019), leading to improved implementation models (Jacobs and Jewkes, 2002; Joyner and Mash, 2012a). In fact, clinic-tested SV responses were often positively received (Christofides and Jewkes, 2010; Joyner and Mash, 2014). Even basic screening tests effectively identified SV victims among clinic attendees (Christofides and Jewkes, 2010; Joyner and Mash, 2012b). Healthcare systems also help raise community awareness, beyond victim and care provider awareness (Colombini et al., 2008, 2017), and facilitate victim referrals to social services (Colombini et al., 2008, 2017). Furthermore, healthcare systems provide a suitable sampling frame (Prabhu et al., 2011; Delamou et al., 2015; Gibbs et al., 2017) for understanding victims' SV experiences and sociodemographic backgrounds (Hampanda et al., 2014; Hampanda, 2016a,b), although findings may have limited generalizability (Hampanda et al., 2014; Punch, 2014; Hampanda, 2016a). Furthermore, framing SV as a health issue rather than a social one promotes recognition of healthcare's potential impact (Joyner, 2013; Rees et al., 2014a).
Regarding theoretical limitations, some SSA studies acknowledge inadequate social theory application, such as impact evaluations, where inadequate socio-contextual information hinders understanding (Colombini et al., 2008; Hatcher et al., 2015; Sprague et al., 2017). Some SSA studies test theories on cross-sectional rather than longitudinal data (Ezeanochie et al., 2011; Prabhu et al., 2011; Delamou et al., 2015; Tusiime et al., 2015; Bernstein et al., 2016; Mahenge et al., 2016; Gibbs et al., 2017; Berhanie et al., 2019), which better captures changes over time (Menard, 2002). Some propose social theories tested on qualitative as opposed to quantitative data (Rees et al., 2014b), others use purposively selected samples (Rees et al., 2014b) instead of representative ones (Shryock et al., 1975), or small data samples (Bernstein et al., 2016; Mahenge et al., 2016; Mohammed et al., 2017), hindering generalizability (Luker, 2008; Greenwell and Salentine, 2018). Other studies do not clearly define their sampling methods (Tusiime et al., 2015), hindering sample validity evaluation (Lee and Forthofer, 2006). Some studies rely on quantitative data without a clear theoretical basis (Ezeanochie et al., 2011; Prabhu et al., 2011; Delamou et al., 2015; Tusiime et al., 2015; Bernstein et al., 2016; Mahenge et al., 2016; Gibbs et al., 2017; Berhanie et al., 2019), other studies propose well-defined theories (Colombini et al., 2008; Joyner and Mash, 2012a) that are not effectively tested, while other studies lacked a named social theory which guided the empirical analysis process (Umeora et al., 2008; Onoh et al., 2013; Delamou et al., 2015).
This study evaluates whether medicine may explicate social differences in SV perceptions in SSA. Hereafter, I define SV perceptions as VDSV, medicine based on the “medical dominance (MD)” theory, and social differences as birth cohort differences. Subsequently, the literature review focuses on critical debates surrounding cohort differences in MD victim behavior as mesocosms to elucidate cohort differences in VDSV in SSA. The SSA focus explicates disagreements between health service-based response advocacy (Joyner, 2013; World Health Organization, 2013) and ongoing health disparities (The Africa Health Agenda International Conference Commission et al., 2021). Furthermore, birth cohort differences provide a historical lens (Abramsky et al., 2014; Ezenweke, 2016) to disagreements between high SV rates in low- and middle-income settings, including SSA (World Health Organization, 2013), persistent socio-cultural intervention barriers (Ezenweke, 2016), and various effective time-based behavior change interventions in the region (Abramsky et al., 2014; Kapiga et al., 2019). Additionally, the study examines SV perceptions in SSA, presuming perceptions underlying behavior, particularly where high social desirability bias risk in social normative behavior reporting exists (Mackie et al., 2015; Ezenweke, 2016); furthermore, perceptions can illuminate associated perceptions and related prioritization processes (Porter, 1985; Zedelius et al., 2017).
1.4 Background
1.4.1 Mesocosms
According to Odum (1984), mesocosms describe controlled environments where natural behaviors may be observed; in this study, MD illuminates socio-behavioral patterns within medicine, specifically proposing relationship power asymmetry and its effects within medicine (Freidson, 1970; Starr, 1982; Toth, 2015). Bioscience employs mesocosms to compare complex real-world natural systems against bounded and partially enclosed experimental environments (Odum, 1984). In this study, the MD mesocosm explicates socio-behavioral patterns within spousal violence in households in SSA through relationship power asymmetry and its effects (Freidson, 1970; Starr, 1982; Toth, 2015). Parsons proposes teacher–student relationship mesocosms to model physician–patient relationships (Dillon, 2020), while Conrad and Schneider (1992) postulate physician–patient relationship mesocosms for interactions between medical boards and physicians (Conrad and Schneider, 1992); our mesocosm hypothesis proposes comparable interpersonal relationships to elucidate similar social contexts, specifically physician–patient relationship mesocosms of spouse–partner relationships. Across similar social contexts, there are also micro, mezzo, and macro socio-contextual similarities, including analogous cross-system interactions. Furthermore, within similar social contexts, socio-behavioral patterns in interpersonal relationships can elucidate each other; for instance, MD, its socio-contextual influences, and their interactions can explain equivalent interpersonal relationships beyond medicine. Notably, however, equality between the compared environments is assumed (Odum, 1984). Nonetheless, unforeseen inequality may arise for various reasons (Carpenter, 1996); these reasons include environments at different stages of evolution, incomparable environmental boundaries, and unexpected effects of the compared environments on observed social behavior. Generally, however, proof of the viability of medical mesocosms may advance medical SV interventions (Joyner, 2013), surmounting documented challenges within legal redress systems in SSA (Odero et al., 2014; Mannell et al., 2016).
1.4.2 Cohort-related differences and victim decisions
This review examines vital debates surrounding cohort-related differences in MD and SV victim decisions. The limited MD theory in SSA literature suggested a pattern-matched inclusion of related studies, increasing the risk of measurement biases (Trochim, 2005; Punch, 2014). Few hospital-level studies assess intergenerational differences related to MD. Two such studies (Silverman, 1981, 1983) defined generations as parent generations compared to child generations and found differing parent–child responses based on whether the child was below the consenting age. Additionally, parent responses dominated when they differed from children‘s; however, physician opinions prevailed where the physician's view conflicted with either or both parents and children (Silverman, 1981, 1983). Other studies indicate that temporal changes in hospital policy or regulations resulted in shifts in physicians' relationships with MD victims and corresponding victim behavior toward these changes (Weiss and Sutton, 2009; Cooper et al., 2012; Lennan, 2014; Zhou et al., 2019). Several population-level studies suggest that intergenerational differences may explain VDSV in SSA. Some studies evaluate intergenerational differences as variations between the VDSV of parents and their children (Kaye et al., 2007; Kanagaratnam et al., 2012; Decker et al., 2013), birth cohort disparities, or changes across temporal periods (Arestoff and Djemai, 2016; Mannell et al., 2016); at times, these changes were linked to implemented SV interventions (Njuki et al., 2012; Abramsky et al., 2014; Harvey et al., 2018; Naved et al., 2018). Previous debates were somewhat limited (Simister, 2010; Kanagaratnam et al., 2012; Mannell et al., 2016); this study aimed to fill that gap. One expectation from the review is that cohort differences may explain VDSV in SSA, with younger cohorts less accepting of SV (Hypothesis 1).
1.4.3 Medical mesocosms and victim decisions
Below, various debates surrounding medical mesocosm approaches to social disparities in victim decisions are explored, particularly concerning MD theory. MD theory posits that physicians strategically disempower other stakeholders within their field (Freidson, 1970; Starr, 1982); consequently, they gain medical sovereignty (Freidson, 1970; Toth, 2015), technical and professional autonomy (Freidson, 1970; Sandstrom, 2007), and cultural authority (Freidson, 1970; Toth, 2015). Contra-MD arguments highlight that existing research predominantly centers on physicians as perpetrators rather than victims (Freidson, 1970; Starr, 1982). Several reviewed MD studies employed qualitative data, and efforts to derive comparable quantitative data may exacerbate research biases. Finally, autonomous decision-making regarding the mechanisms through which social conditions influence MD (Coburn, 1993, 1999) also increases the risk of measurement biases. Pro-MD arguments recognize a two-way interaction, wherein either the physician or patient can be victims (Gerhardt, 1989), respond uniquely (Silverman, 1981, 1983), with social patterning (Abbott, 1988), but also be value-influenced (Silverman, 1981, 1983; Conrad and Schneider, 1992). The above arguments suggest that MD “mesocosms” may explain cohort differences in VDSV in SSA.
1.4.4 Conceptual framework
Adopting pattern-matching (Trochim, 2005; Punch, 2014) and socioecological theory approaches (Bronfenbrenner, 2005; Mackie et al., 2015), this section proposes how, based on existing evidence, an MD theory (Freidson, 1970; Starr, 1982; Toth, 2015) mesocosm (Odum, 1984) may elucidate cohort differences in VDSV in SSA. Pattern-matching posits hypotheses generation from comparisons of observed and expected conceptual patterns (Trochim, 2005; Punch, 2014); it employs a grounded-theory strategy (Punch, 2014).
1.4.4.1 Socio-ecological theory and cross-system interactions
A study expectation predicated on pattern-matching theory (Trochim, 2005; Punch, 2014) and socio-ecological theory (Bronfenbrenner, 2005) posits that interactions among micro, mezzo, and macro systems may elucidate VDSV in SSA. Mackie et al. (2015) suggest that socio-ecological theory (Bronfenbrenner, 2005) may explain human behavior within SV (specifically across three main sub-systems: microsystems encompassing the conflict arena, the perpetrator (male partner), the victim (female partner), their relationship, and specific SV experiences; mesosystems comprising neighborhoods; and macrosystems incorporating socio-historical factors, such as socioeconomic stratification (Dillon, 2020). Additionally, socio-ecological theory posits that interactions across exosystems (Bronfenbrenner, 2005), such as overarching public policy (Quesnel-Vallée et al., 2021), explain SV.
Despite limitations, some household-based evidence indicates that cross-system interactions, such as socioeconomic inequalities (Wright, 1997; Phelan et al., 2010), explain social disparities in VDSV in SSA. For instance, despite higher SV incidence amongst lower socioeconomic status couples (Itimi et al., 2014), within this group, lower education levels and reduced help-seeking for SV are further associated (Simister, 2010; Bhuwania and Heymann, 2022), sometimes due to government service fee payments (Njuki et al., 2012; Odero et al., 2014). Associations are also reported between MD victim resistance and victim-perpetrator power differences, socioeconomic differences (Sandstrom, 2007; Alubo and Hunduh, 2017), and institutional and government support differences (Coburn, 1999; Alubo and Hunduh, 2017). Notably, however, beyond SV, VDSV emphasizes roles for individual agency (Swart, 2013; Horn et al., 2016), suggesting that SE theory applicability (Assari, 2013; Jefferies, 2016) to VDSV remains unclear.
1.4.4.2 Macrosystem, mesosystem, and microsystem environments
Following pattern-matching theory (Trochim, 2005; Punch, 2014) and socio-ecological theory proposed macrosystems (Mackie et al., 2015), some hospital-based research studies indicate that despite theoretical and methodological limitations, “pre-assigned role change” may explain social differences in MD victim responses (Weiss and Sutton, 2009; Cooper et al., 2012). Pattern-matched (Trochim, 2005; Punch, 2014) household-based studies also indicate that, despite limitations, “pre-assigned social roles” may elucidate social disparities in VDSV in SSA (Kanagaratnam et al., 2012; Gillum et al., 2018). Indeed, structural-functionalism theory (Dillon, 2020), partly characterized by “pre-assigned social roles,” posits that despite theoretical limitations (Parsons, 1975), at the macrosystem level, society dictates accepted victim behavior, gatekeeper behavior, and rules for behavior change through institutional interventions, which vary across social stratification (Dillon, 2020).
Conformable with pattern-matching theory (Trochim, 2005; Punch, 2014) and the socio-ecological theory proposed mesosystems (Mackie et al., 2015), various hospital-based research studies suggest that, notwithstanding theoretical and methodological limitations, the concept of “knowledge exchange across social interactions” may explain social differences in MD victim responses (Wilson et al., 2007; Goldman et al., 2016). Pattern-matched household-based studies (Trochim, 2005; Punch, 2014) indicate roles for “knowledge exchange across social interactions,” such as religious interactions (Swart, 2013; Itimi et al., 2014) in comprehending VDSV social differences, particularly victim resistance planning efforts (Swart, 2013; Kohli et al., 2015). Indeed, symbolic interactionism theory (Goffman, 1974), partly characterized by “knowledge exchange across social interactions,” suggests that despite recognized theoretical limitations (Sandstrom and Kleinman, 2004; Ritzer, 2005; Ritzer and Ryan, 2011), at the mesosystems level, social processes impact the victim's self once or repeatedly depending on whether a fundamental self already exists. However, the effect varies across the corresponding victim reactions, society's reaction to the victims and those like them, and the social processes which connect the two (Goffman, 1974), such as group social interactions.
Finally, according to pattern-matching theory (Trochim, 2005; Punch, 2014) and socio-ecological theory proposed microsystems (Mackie et al., 2015), specific hospital-based evidence suggests that despite theoretical and methodological limitations, “artifactual effects” may elucidate social differences in MD victim responses (Sandstrom, 2007; Ghasi et al., 2020). Additionally, pattern-matched household-based evidence (Trochim, 2005; Punch, 2014) indicates that despite limitations, “artifactual effects” may similarly elucidate VDSV social differences (Arestoff and Djemai, 2016; Kapiga et al., 2019). Furthermore, some proponents of MD theory (Starr, 1982; Toth, 2015) suggest that despite known theoretical limitations (Parsons, 1975), at the microsystems level, “artifactual effects,” such as ineffective bias handling (Sica, 2006; Pannucci and Wilkins, 2010), systematic error biases (Sica, 2006; Morgensten, 2018), and limited reliability and validity of research study approaches (Coggon et al., 2009; Pannucci and Wilkins, 2010), may explain observed MD-related result patterns. As such, a second study expectation, predicated on pattern-matching theory (Trochim, 2005; Punch, 2014) and socio-ecological theory (Mackie et al., 2015) is that cross-system interactions between macrosystem social role change, mesosystem knowledge networks, and microsystem artifactual effects may explain VDSV in SSA (Hypothesis 2).
1.4.4.3 Exosystem environment
Unlike Mackie et al. (2015), Bronfenbrenner (2005)'s version of socio-ecological theory additionally emphasizes roles for exosystems, which include higher-level socio-political determinants, such as changes in governance or overarching public and social policies (Solar et al., 2007; Quesnel-Vallée et al., 2021). Some hospital-based evidence indicates that, despite methodological limitations, national healthcare policy changes can elucidate social disparities in MD victim responses (Coburn, 1993, 1999). Similarly, the Evolutionary Social Change Theory (Dietz et al., 1990), partly characterized by “public policy change,” posits that despite recognized theoretical limitations (Parsons, 1975), at the macrosystems level, victim behavior results partly from co-evolutionary perspectives, integrating both micro-process and macro-process societal change effects on human behavior, including immanent social forces changes, and culture, social organization, and institutional changes (Dietz et al., 1990). In contrast, limited household-based evidence conclusively highlights this same aspect. As such, a third study expectation predicated on pattern-matching theory (Trochim, 2005; Punch, 2014) and socio-ecological theory (Bronfenbrenner, 2005) was that interactions between microsystem artifactual effects, mesosystem social networks, macrosystem social role change, and exosystem healthcare policy may explain VDSV in SSA (Hypothesis 3). Hypothesis 3 also postulates medical mesocosms (Odum, 1984), that MD theory may illuminate socio-behavioral patterns within spousal violence in households in SSA.
2 Materials and methods section
2.1 Data
The study used demographic and health survey data (DHS), nationally representative household surveys conducted every 5 years across selected low- and middle-income countries. Further information regarding data collection (ICF, 2020), sampling strategy (ICF International, 2012), ethical approval, and other details concerning the study can be found elsewhere (ICF, 2012a; Measure DHS/ICF International, 2013; Croft et al., 2023). Ethical consent was obtained from ICF International, the distributor of these data. Analysis was limited to the most recent country surveys, which included a complete SV module, capturing household-level SV experiences and surrounding circumstances (ICF, 2020); a total of 31 countries in SSA were considered. Survey-specific logical rules and related record-matching facilitated data cleaning and imputation (Gelman and Hill, 2007; Sauro, 2015); fewer than 2% of records were affected. All data cleaning was conducted using Stata 16.0. The final study sample, described in Tables 1–5, comprised 193,232 women aged 15–49 years. A cross-sectional analytic study was carried out to compare three VDSV patterns across birth cohorts while adjusting for confounding factors (Fox, 2016; Oakes and Kaufman, 2017).
Table 1
| Country code | Survey year | Females 15/49 | DV Module | SV | VDSV1 | VDSV2 | VDSV3 | |||
|---|---|---|---|---|---|---|---|---|---|---|
| Other | Discord | Other | Discord | Other | Discord | |||||
| N | N | Row % | Row % | Row % | Row % | Row % | Row % | Row % | ||
| SSA | 2000–24 | 512,269 | 193,232 | 45.5 | 24.0 | 21.5 | 32.3 | 13.2 | 31.7 | 13.8 |
| WA | 2000–24 | 226,170 | 76,157 | 50.3 | 27.0 | 23.3 | 37.2 | 13.2 | 36.1 | 14.2 |
| BF | 2021 | 17,659 | 10,863 | 53.4 | 26.7 | 26.7 | 46.0 | 7.5 | 44.5 | 9.0 |
| BJ | 2017–18 | 15,928 | 5,408 | 51.2 | 33.0 | 18.2 | 39.3 | 11.9 | 39.9 | 11.4 |
| CI | 2021 | 14,877 | 5,040 | 35.4 | 23.8 | 11.6 | 26.5 | 9.0 | 25.2 | 10.2 |
| CM | 2018 | 14,677 | 6,682 | 44.5 | 29.8 | 14.8 | 30.6 | 13.9 | 31.0 | 13.5 |
| TD | 2014–15 | 17,719 | 4,283 | 57.5 | 11.9 | 45.6 | 44.6 | 12.9 | 44.7 | 12.9 |
| GA | 2019–21 | 11,043 | 4,163 | 35.2 | 21.8 | 13.4 | 20.8 | 14.4 | 18.5 | 16.6 |
| GH | 2022 | 15,014 | 5,737 | 37.5 | 27.6 | 9.9 | 26.9 | 10.5 | 25.3 | 12.2 |
| GM | 2019–20 | 11,865 | 2,470 | 42.1 | 17.3 | 24.7 | 29.9 | 12.2 | 23.2 | 18.8 |
| LB | 2019–20 | 8,065 | 3,120 | 51.8 | 28.9 | 22.9 | 32.6 | 19.2 | 36.8 | 15.0 |
| ML | 2018 | 10,424 | 3,784 | 64.3 | 10.1 | 54.2 | 51.0 | 13.4 | 37.7 | 26.6 |
| NG | 2018 | 38,948 | 10,678 | 50.2 | 32.7 | 17.5 | 39.6 | 10.6 | 38.6 | 11.6 |
| SL | 2019 | 16,658 | 5,248 | 60.5 | 27.5 | 33.0 | 35.9 | 24.6 | 41.0 | 19.5 |
| ST | 2008–09 | 15,574 | 1,980 | 79.5 | 62.0 | 17.5 | 65.2 | 14.1 | 67.4 | 12.1 |
| TG | 2013–14 | 17,719 | 6,701 | 41.8 | 25.4 | 16.4 | 31.7 | 10.1 | 32.3 | 9.5 |
Weighted victim decisions in spousal violence estimates among females aged 15–49 in Sub-Saharan Africa, Latest Country DHS 2003–2024, West Africa.
Author calculations using Demographic and Health Surveys (DHS), 2003–2024.
SSA, Sub-Saharan Africa; DV Module, Domestic Violence Module; VDSV, Victim Decisions in Spousal Violence; Discord, Discordant Decisions; Other, Unknown or Concordant Decisions; SV, Spousal Violence Experience Last 12 Months; VDSV1, Spousal Violence Accepting Attitudes despite Spousal Violence Experience; VDSV2, Sought Help for Spousal Violence Despite Spousal Violence Accepting Attitudes; VDSV3, Sought Help for Spousal Violence After Spousal Violence Experience Notwithstanding Attitudes; WA, Western Africa; BF, Burkina Faso; BJ, Benin; CI, Ivory Coast; CM, Cameroon; TD, Chad; GA, Gabon; GH, Ghana; GM, Gambia; LB, Liberia; ML, Mali; NG, Nigeria; SL, Sierra Leone; ST, Sao Tome & Principe; TG, Togo.
Table 2
| Country code | Survey year | Females 15/49 | DV Module | SV | VDSV1 | VDSV2 | VDSV3 | |||
|---|---|---|---|---|---|---|---|---|---|---|
| Other | Discord | Other | Discord | Other | Discord | |||||
| N | N | Row % | Row % | Row % | Row % | Row % | Row % | Row % | ||
| SSA | 2000–24 | 512,269 | 193,232 | 45.5 | 24.0 | 21.5 | 32.3 | 13.2 | 31.7 | 13.8 |
| EA | 2000–24 | 153,955 | 68,860 | 44.8 | 18.4 | 26.4 | 30.8 | 14.0 | 30.2 | 14.6 |
| BU | 2016–17 | 17,269 | 10,188 | 40.0 | 11.8 | 28.2 | 24.3 | 15.7 | 20.9 | 19.1 |
| CD | 2013–14 | 18,827 | 6,811 | 58.8 | 11.6 | 47.3 | 36.7 | 22.1 | 36.5 | 22.3 |
| ET | 2016 | 15,683 | 5,860 | 53.6 | 15.5 | 38.1 | 44.7 | 8.9 | 37.6 | 16.0 |
| KE | 2022 | 32,156 | 16,926 | 37.7 | 21.7 | 16.0 | 24.7 | 13.1 | 26.8 | 11.0 |
| MD | 2021 | 18,869 | 7,308 | 54.2 | 29.3 | 24.9 | 40.8 | 13.4 | 40.3 | 13.9 |
| MR | 2019–21 | 15,714 | 4,184 | 27.0 | 16.0 | 10.9 | 22.6 | 4.4 | 21.3 | 5.7 |
| RW | 2019–20 | 13,497 | 2,788 | 36.5 | 16.3 | 20.2 | 21.1 | 15.4 | 25.9 | 10.6 |
| TZ | 2022 | 13,266 | 5,563 | 42.1 | 18.5 | 23.6 | 29.2 | 12.9 | 28.9 | 13.2 |
| UG | 2016 | 8,674 | 9,232 | 53.2 | 24.6 | 28.6 | 32.7 | 20.5 | 33.9 | 19.3 |
Weighted victim decisions in spousal violence estimates among females aged 15–49 in Sub-Saharan Africa, Latest Country DHS 2003–2024, East Africa.
Author calculations using Demographic and Health Surveys (DHS), 2003–2024.
SSA, Sub-Saharan Africa; DV, Domestic Violence; VDSV, Victim Decisions in Spousal Violence; Discord, Discordant Decision; Other, Unknown or Concordant Decision; SV, Spousal Violence Experience Last 12 Months; VDSV1, Spousal Violence Accepting Attitudes despite Spousal Violence Experience; VDSV2, Sought Help for Spousal Violence Despite Spousal Violence Accepting Attitudes; VDSV3, Sought Help for Spousal Violence After Spousal Violence Experience Notwithstanding Attitudes; Discord, Discordant Decision; EA, East Africa; BU, Burundi; CD, Democratic Republic of Congo; ET, Ethiopia; KE, Kenya; MD, Madagascar; MR, Mauritania; RW, Rwanda; TZ, Tanzania; UG, Uganda.
Table 3
| Country code | Survey year | Females 15/49 | DV Module | SV | VDSV1 | VDSV2 | VDSV3 | |||
|---|---|---|---|---|---|---|---|---|---|---|
| Other | Discord | Other | Discord | Other | Discord | |||||
| N | N | Row % | Row % | Row % | Row % | Row % | Row % | Row % | ||
| SSA | 2000–24 | 512,269 | 193,232 | 45.5 | 24.0 | 21.5 | 32.3 | 13.2 | 31.7 | 13.8 |
| SA | 2000–24 | 132,144 | 48,215 | 38.0 | 25.5 | 12.5 | 26.8 | 11.2 | 26.5 | 11.6 |
| AO | 2015–16 | 14,379 | 10,519 | 38.3 | 25.0 | 13.3 | 25.7 | 12.6 | 23.4 | 14.9 |
| LS | 2023–24 | 6,413 | 2,490 | 35.5 | 26.7 | 8.8 | 23.7 | 11.8 | 23.7 | 11.8 |
| MZ | 2022–23 | 13,745 | 4,813 | 46.1 | 32.5 | 13.5 | 32.8 | 13.3 | 30.7 | 15.4 |
| MW | 2015–16 | 11,698 | 6,379 | 54.8 | 45.5 | 9.3 | 38.2 | 16.6 | 38.2 | 16.6 |
| NM | 2013 | 41,821 | 2,931 | 21.1 | 11.8 | 9.2 | 19.9 | 1.2 | 19.8 | 1.3 |
| ZA | 2016 | 18,506 | 4,357 | 18.1 | 15.9 | 2.2 | 13.6 | 4.5 | 14.0 | 4.0 |
| ZM | 2018 | 16,411 | 9,503 | 49.3 | 22.9 | 26.4 | 34.1 | 15.2 | 33.6 | 15.7 |
| ZW | 2015 | 9,171 | 7,223 | 41.3 | 23.9 | 17.4 | 26.9 | 14.4 | 28.5 | 12.8 |
Weighted victim decisions in spousal violence estimates among females aged 15–49 in Sub-Saharan Africa, Latest Country DHS 2003–2024, Southern Africa.
Author calculations using Demographic and Health Surveys (DHS), 2003–2024.
SSA, Sub-Saharan Africa; DV, Domestic Violence; VDSV, Victim Decisions in Spousal Violence; Discord, Discordant Decision; Other, Unknown or Concordant Decision; SV, Spousal Violence Experience; VDSV1, Spousal Violence Accepting Attitudes despite Spousal Violence Experience; VDSV2, Sought Help for Spousal Violence Despite Spousal Violence Accepting Attitudes; VDSV3, Sought Help for Spousal Violence After Spousal Violence Experience Notwithstanding Attitudes; SA, Southern Africa; AO, Angola; LS, Lesotho; MZ, Mozambique; MW, Malawi; NM, Namibia; ZA, South Africa; ZM, Zambia; ZW, Zimbabwe.
2.2 Measures
Refer to Figure 1 for the conceptualization of the primary analytical measures used and the hypothesized relationships between them.
Figure 1
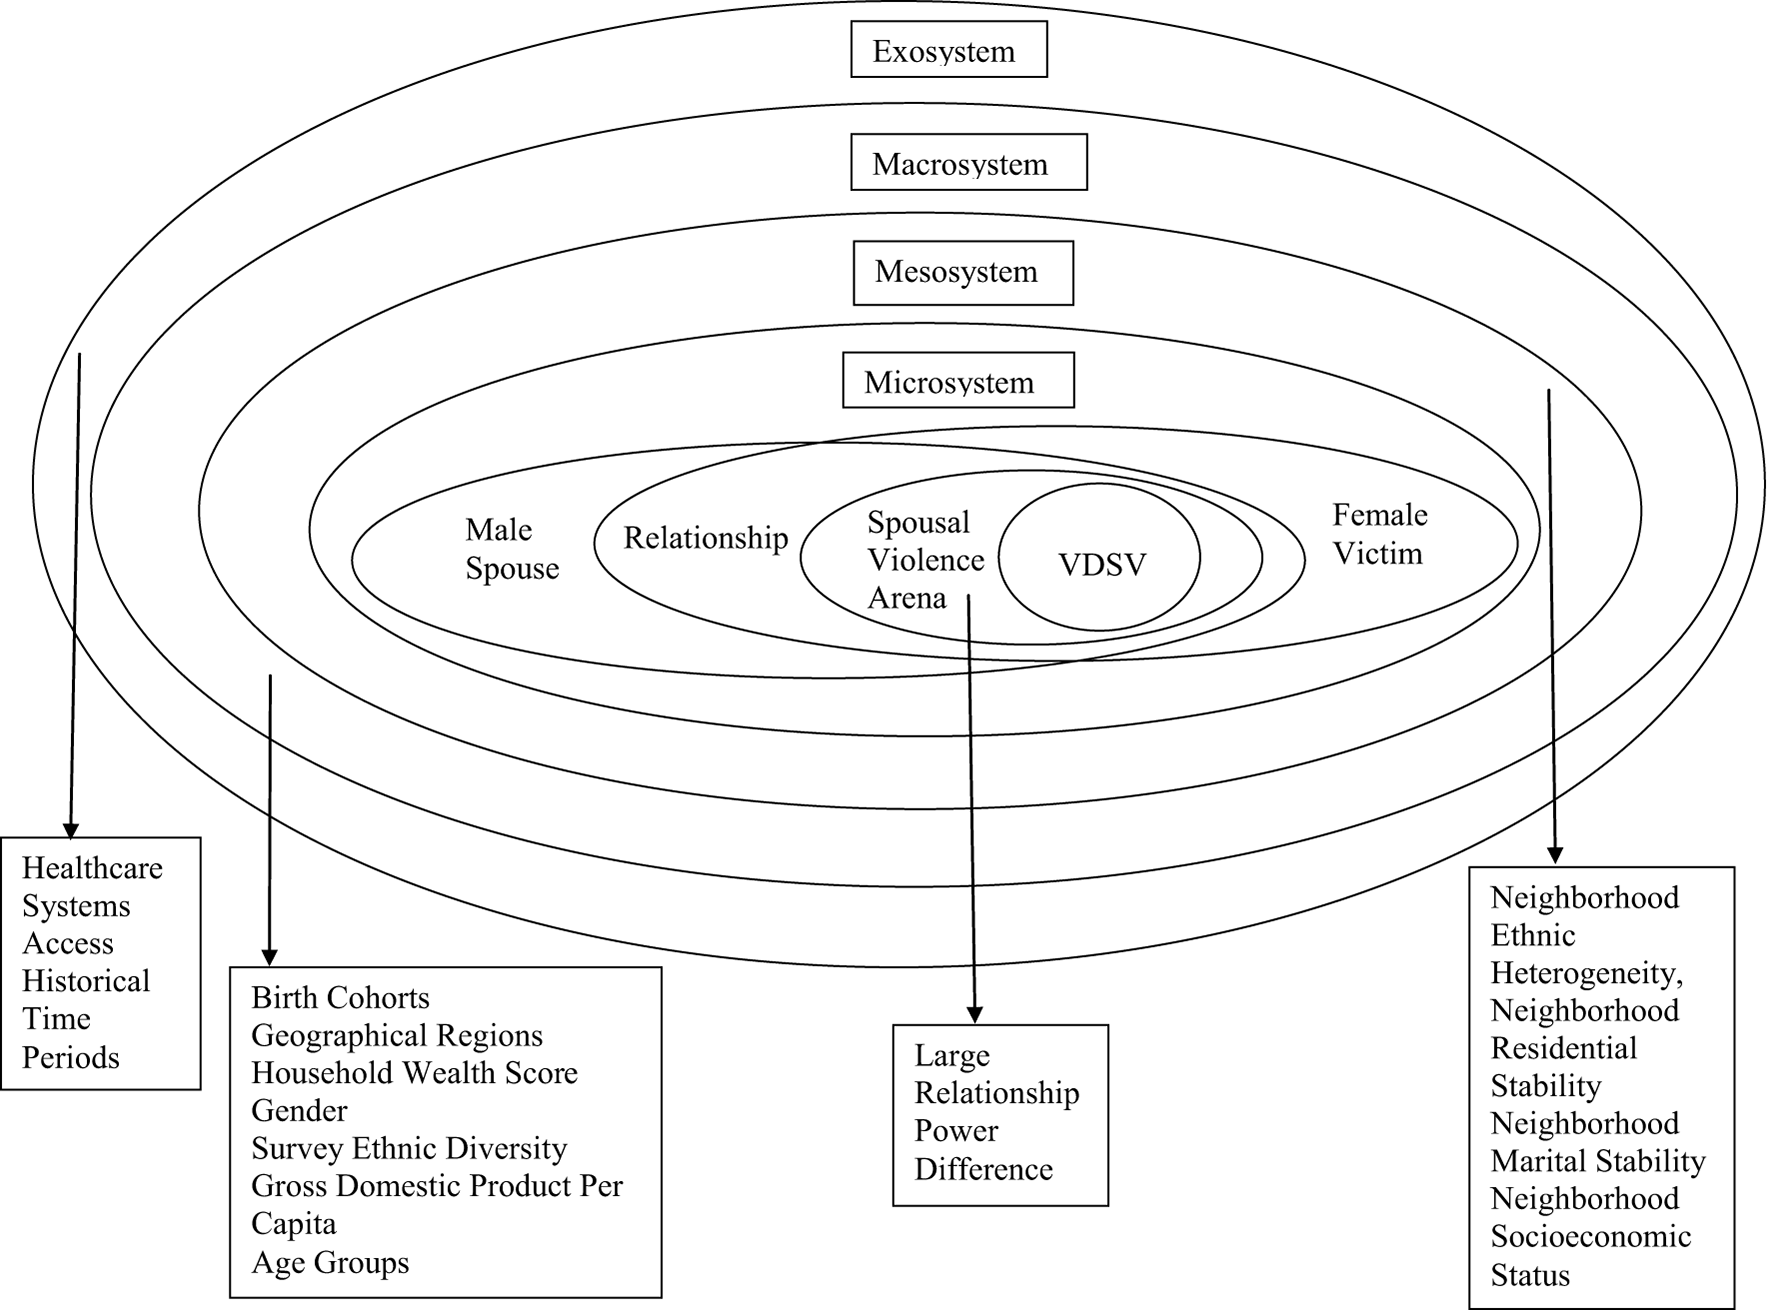
Conceptual framework for female victim decisions in spousal violence (VDSV) in Sub-Saharan Africa.
2.2.1 Cross-system interaction measures
2.2.1.1 Dependent variable
Victim Decisions in Spousal Violence (VDSV): In line with sick-role theory (Parsons, 1975), the common-sense model of health-related decisions theory (Leventhal et al., 2016), and rational choice theory (Jasso, 2011)—which serve as interpretations of MD theory (Freidson, 1970; Toth, 2015)—I define three measures for VDSV. VDSV patterns 1, 2, and 3 are coded as 0 when respondents reported no spousal violence (0 = None). Additionally, VDSV pattern 1, coded as 2, when respondents express SV-accepting attitudes despite experiencing SV, but not otherwise (1 = Other, including Unknown and Concordant Decisions; 2 = Discordant Decision). In contrast, VDSV pattern 2, coded as 2, was observed when respondents sought help for SV despite expressing SV-accepting attitudes, but not otherwise (1 = Other, including Unknown and Concordant Decisions; 2 = Discordant Decision). VDSV pattern 3, coded as 2, when respondents sought help for SV after experiencing SV, regardless of their attitudes, but not otherwise (1 = Other, including Concordant and Unknown Decisions; 2 = Discordant Decision). Notably, Unknown And Concordant decisions were combined for VDSV patterns 1, 2, and 3 since the focus was on Discordant decisions. Moreover, VDSV patterns 1, 2, and 3 primarily derive from three underlying measures: “SV experience,” “SV accepting attitudes,” and “Sought help for SV.” The binary variable SV experience was coded 1 when respondents experienced SV in the 12 months preceding the survey, whether emotional, sexual, or physical violence, but zero otherwise (Rutstein and Rojas, 2006; Croft et al., 2023). The binary variable SV accepting attitudes takes the value 1 when respondents felt that SV would be warranted in at least one of five hypothetical situations: if she goes out without informing him, neglects the children or argues with him, refuses to have sex with him or burns the food, but zero otherwise (Rutstein and Rojas, 2006; Arestoff and Djemai, 2016; Croft et al., 2023). Finally, the binary variable respondents sought help for SV, was coded 1 when respondents reported seeking help after the SV experience, or they did not seek help but confided in someone about it, but zero otherwise (Rutstein and Rojas, 2006; Croft et al., 2023).
2.2.1.2 Independent variable
Birth cohorts: In line with proponents of “Cohort as a Concept in the Study of Social Change” (Ryder, 1965) and “Time, Human Agency and Social Change” (Elder Jr, 1994) as interpretations of structural-functionalism theory (Dillon, 2020), I define birth cohorts. Rather than using survey-reported years of birth, I estimate these as the survey year minus the reported age at survey; this method addresses the issue of surveys spanning more than 1 year (Arestoff and Djemai, 2016). Consequently, for birth years spanning 1947 to 2005, birth cohorts ranging from 1 = 1947–1985 to 2 = 1986+ were defined. Cohort cutoff points were drawn from dates of international family planning policy change (Seltzer, 2002; Garenne, 2018), plus estimated 18-month implementation delays (Ayeni, 2016; Nyarko, 2016; Mutuku, 2023; Adesina, 2024), particularly the 1984 United Nations Mexico City International Conference on Population (United Nations, 1984); proxy measures for less documented national reproductive health policy changes within SSA (Seltzer, 2002; Garenne, 2018); cutoff points assumed equal outcome probability within birth cohorts.
2.2.1.3 Moderating variables
Neighborhood ethnic diversity (heterogeneity): In line with the analysis of Social Disorganization Theory (Sampson, 2012; Parks, 2013), as an interpretation of Symbolic Interactionism Theory (Goffman, 1974), I define the first moderating variable as a two-category measure coded (2) when the ethnic diversity within a survey cluster is greater than or equal to the sample grand mean ethnic diversity, and (1) otherwise. Survey clusters constitute neighborhoods. The sample grand mean ethnic diversity is estimated by dividing the total by the count of survey cluster estimates of ethnic diversity. Ethnic diversity is derived from the Entropy Index, which estimates cluster ethnicity distribution; lower scores signify low ethnic diversity, with negative scores viewed as lower than positive scores (Sampson, 2012; Parks, 2013).
Relationship power-difference: In line with sick-role theory (Parsons, 1975) as an interpretation of MD theory (Freidson, 1970; Toth, 2015), I define this second moderating variable. This is a derived measure of individual-level microsystem effects, coded (1) when respondents were in a union and were the principal decision-maker in at least one of three household decisions, (2) for respondents not currently in a union, and (0) otherwise (Rutstein and Rojas, 2006; Croft et al., 2023). Relationship power difference was used as a proxy measure for perpetrator behaviors, distinguishing between emotional, sexual, and physical violence solely and the former plus marital control issues (Rutstein and Rojas, 2006; Croft et al., 2023).
Healthcare system access: In line with macro-social policy and health inequalities theory (Solar et al., 2007; Quesnel-Vallée et al., 2021) as interpretations of Evolutionary Social Change Theory (Dietz et al., 1990), I define a proxy measure for national healthcare policy changes as the third moderating variable. Access estimates whether respondents sought family planning advice from healthcare professionals, had health insurance coverage, consulted skilled birth attendants for their most recent delivery, or delivered at a healthcare facility. The measure was coded (1) where healthcare access was reported in the 12 months preceding the survey, and (0) otherwise.
2.2.2 Control variables
First, measures to account for unaddressed mesosystem effects.
Neighborhood marital stability: Survey clusters constituted neighborhoods. Marital stability within the index survey cluster was calculated as the ratio of the proportion of divorced or separated persons amongst married persons to the proportion of single persons (Sampson, 2012; Parks, 2013).
Neighborhood residential stability: a three-category measure, was coded (0) for movers, (1) for non-movers, but (2) otherwise (Emina et al., 2011); survey clusters constituted neighborhoods. Within index households, stay duration was defined as the reported length of stay in years for those coded “96” or “visitor,” but completed age in years for those coded “since birth” or “always.”
Neighborhood socioeconomic status: Survey clusters constituted neighborhoods. Cluster Socioeconomic Status was indirectly estimated by calculating the proportion of women aged 15 to 49 years who have attained secondary education or higher (African Population and Health Research Center, 2002).
Furthermore, measures accounting for unaddressed macrosystem effects. Age groups, a derived measure of completed age in years at the time of the interview, categorized into 5-year intervals, ranging from 1 = 15–19 years to 7 = 45–49 years. Household Wealth Score, a derived measure of reported household assets and living conditions, was coded from 1 to 5, with 1 representing the poorest and 5 denoting the wealthiest households (Rutstein and Rojas, 2006; Croft et al., 2023). Gross Domestic Product (GDP) Per Capita was derived by country from International Monetary Fund estimates (IMF, 2024) to capture between-country socioeconomic differences (Magadi, 2017; Goodson and Hayes, 2021; IMF, 2024).
Survey ethnic diversity: In line with Social Disorganization Theory (Sampson, 2012; Parks, 2013), as an interpretation of Symbolic Interactionism Theory (Goffman, 1974), I define Survey Ethnic Diversity which is derived from the Entropy Index. It estimates various ethnic distributions within each country survey; lower scores indicate less ethnic diversity, with negative scores perceived as lower than positive scores (Sampson, 2012; Parks, 2013).
Moreover, measures adjusting for unaddressed exosystem effects. Historical Time Periods, a derived three-category variable, was coded (1) for surveys conducted between 1990 and 2000, (2) for 2001 to 2010, and (3) for 2011 to 2024, aligned with the ‘Time, Human Agency and Social Change' Theory (Elder Jr, 1994), providing interpretations of structural-functionalism theory (Dillon, 2020), and serving as a proxy measure for changes across DHS Data Collection Phases (Rutstein and Rojas, 2006; Croft et al., 2023).
Finally, measures to address unexamined structural-level macrosystem effects. Geographical Regions, a classification derived from the countries where interviews were conducted, coded 1 for East, 2 for South, and 3 for West Africa.
2.3 Empirical analysis
2.3.1 Descriptive analysis
Each categorical variable was assessed for zero cell values, and recategorizations were implemented where necessary (Lewis-Beck, 1995). For every variable, central tendency and dispersion were estimated using means and standard deviations, respectively (Lewis-Beck, 1995; Lewis-Beck and Lewis-Beck, 2016). For continuous variables, histograms and skewness statistics were employed to evaluate the normality of the variable distribution (Lewis-Beck, 1995; Fox, 2016; Lewis-Beck and Lewis-Beck, 2016); normality implied that means were equal to modes and medians. Regarding skewness statistics, results with p-value ≥ 0.05 indicated normality assumptions could be rejected and suitable transformations could be applied (Lewis-Beck, 1995); all such continuous variables were converted into categorical variables (Lee and Forthofer, 2006). All descriptive analyses were conducted using STATA 16.0; see Tables 1–5.
2.3.2 Multivariate analysis
The multivariate analysis sample was restricted to the most recent 2001–2024 country DHS data, focusing on 193,232 women aged 15–49 years. Unadjusted Odds Ratios (ORs) were employed to evaluate the strength of the bivariate association between the dependent variables, VDSV patterns 1–3, and the primary explanatory variable, birth cohorts (Liebetrau, 1983; Lewis-Beck and Lewis-Beck, 2016). The moderating effects of neighborhood ethnic heterogeneity, relationship power difference, and healthcare systems accessibility were subsequently evaluated through interaction terms added to the base models. Control measures, such as household wealth and age groups, were also included in the models to account for potential confounding effects. Analyses were based on cross-sectional data; thus, the results reflect neither a causal association nor the direction of the association (Liebetrau, 1983).
A two-level hierarchical multinomial logistic regression model (Gelman and Hill, 2007; Luke, 2020; Rabe-Hesketh and Skrondal, 2022) was fitted to assess VDSV variation across birth cohorts while controlling for potential confounding effects from social-theory-derived determinants at the individual, cluster, and household levels as fixed effects (level 1), and for country effects as random effects (level 2). Within countries, household-level clustering was comparably limited within the sample (Tables 4, 5), but spatial interpolation was employed to account for clustering at the geographical cluster level (Galster, 2012; Duncan and Kawachi, 2018). Across countries, cluster-level and household-level effects helped to account for the hierarchical structure and clustering within DHS datasets (ICF International, 2012; Greenwell and Salentine, 2018). At the country level, random effects accommodate the possibility that, given the average values of all other independent variables, the probability of the outcome varies due to clustering (Gelman and Hill, 2007; Luke, 2020; Rabe-Hesketh and Skrondal, 2022). However, spatial interpolation effects account for the possibility that even within countries, the likelihood of the outcome additionally varies across geographical clusters (Galster, 2012; Duncan and Kawachi, 2018). All multivariate analyses were performed using the mblogit function in the mclogit package (Elff, 2022) of the R programming language version 4.4.0 (R Development Core Team, 2025), which adjusts for survey weights and design by incorporating sampling weights in the likelihood function (Elff, 2022).
Table 4
| Level | Predictors | Mean | S.D. | N |
|---|---|---|---|---|
| No experience and some spousal violence experience | ||||
| Survey | Survey ethnic diversity (−10.3,1) | −1.2 | 4.0 | 31 |
| Cluster | Cluster ethnic diversity (−10.1,1) | −0.8 | 2.4 | 18,769 |
| Marital instability (0,30) | 0.9 | 1.1 | 18,769 | |
| Proportion SECONDARY Plus (0,1) | 0.4 | 0.3 | 18,769 | |
| Household | Household Wealth (1,5) | 3.0 | 1.4 | 193,232 |
| Urban–rural residence (0,1) | 0.4 | 0.5 | 193,232 | |
| Individual | Birth cohort (0,1) | 0.6 | 0.5 | 193,232 |
| Time period (1,2) | 2.0 | 0.2 | 193,232 | |
| Healthcare past 12 months (1,2) | 1.5 | 0.5 | 193,232 | |
| Relationship power–differences (1,3) | 2.1 | 0.7 | 193,232 | |
| Age group (1,7) | 3.5 | 1.8 | 193,232 | |
| Residential stability (0,2) | 0.7 | 0.7 | 193,232 | |
| No spousal Violence experience | ||||
| Survey | Survey ethnic diversity (−10.3,1) | −1.0 | 3.6 | 16 |
| Cluster | Cluster ethnic diversity (−10.1,1) | −0.7 | 2.4 | 9,903 |
| Marital instability (0,30) | 1.0 | 1.4 | 9,903 | |
| Proportion secondary plus (0,1) | 0.5 | 0.3 | 9,903 | |
| Household | Household wealth (1,5) | 3.1 | 1.4 | 97,237 |
| Urban–rural residence (0,1) | 0.4 | 0.5 | 97,237 | |
| Individual | Birth cohort (0,1) | 0.7 | 0.5 | 97,237 |
| Time period (1,2) | 2.0 | 0.2 | 97,237 | |
| Healthcare past 12 months (1,2) | 1.4 | 0.5 | 97,237 | |
| Relationship power–differences (1,3) | 2.3 | 0.8 | 97,237 | |
| Age group (1,7) | 3.1 | 1.9 | 97,237 | |
| Residential stability (0,2) | 0.6 | 0.7 | 97,237 | |
| Some spousal violence experience | ||||
| Survey | Survey ethnic diversity (−10.3,1) | −1.5 | 4.4 | 15 |
| Cluster | Cluster ethnic diversity (−10.1,1) | −0.9 | 2.5 | 8,866 |
| Marital instability (0,30) | 0.7 | 0.7 | 8,866 | |
| Proportion secondary plus (0,1) | 0.4 | 0.3 | 8,866 | |
| Household | Household wealth (1,5) | 2.8 | 1.4 | 95,995 |
| Urban–rural residence (0,1) | 0.3 | 0.5 | 95,995 | |
| Individual | Birth cohort (0,1) | 0.5 | 0.5 | 95,995 |
| Time period (1,2) | 2.0 | 0.2 | 95,995 | |
| Healthcare past 12 months (1,2) | 1.5 | 0.5 | 95,995 | |
| Relationship power–differences (1,3) | 1.8 | 0.6 | 95,995 | |
| Age group (1,7) | 3.9 | 1.7 | 95,995 | |
| Residential stability (0,2) | 0.7 | 0.7 | 95,995 | |
Spousal violence experience estimates among females aged 15–49 in Sub-Saharan Africa by selected predictors, Latest Country Demographic and Health Surveys, 2003–2024.
SSA, Sub-Saharan Africa; SV, Spousal Violence; S.D., Standard Deviation; N, Number of Observations.
Table 5
| Level | Predictors | Mean | S.D. | N | Mean | S.D. | N |
|---|---|---|---|---|---|---|---|
| Discordant | Other | ||||||
| VDSV3 | |||||||
| Survey | Survey ethnic diversity (−10.3,1) | −0.6 | 3.6 | 9 | −2.7 | 4.8 | 11 |
| Cluster | Cluster ethnic diversity (−10.1,1) | −0.9 | 2.3 | 2,340 | −0.9 | 2.6 | 5,291 |
| Marital instability (0,30) | 0.6 | 0.5 | 2,340 | 0.6 | 0.7 | 5,291 | |
| Proportion secondary plus (0,1) | 0.4 | 0.3 | 2,340 | 0.4 | 0.3 | 5,291 | |
| Household | Household wealth (1,5) | 2.8 | 1.4 | 29,132 | 2.8 | 1.4 | 66,863 |
| Urban-rural residence (0,1) | 0.3 | 0.5 | 29,132 | 0.3 | 0.5 | 66,863 | |
| Individual | Birth cohort (0,1) | 0.5 | 0.5 | 29,132 | 0.5 | 0.5 | 66,863 |
| Time period (1,2) | 2.0 | 0.2 | 29,132 | 1.9 | 0.2 | 66,863 | |
| Healthcare past 12 months (1,2) | 1.6 | 0.5 | 29,132 | 1.5 | 0.5 | 66,863 | |
| Relationship power–differences (1,3) | 1.8 | 0.6 | 29,132 | 1.8 | 0.6 | 66,863 | |
| Age group (1,7) | 3.9 | 1.7 | 29,132 | 3.9 | 1.7 | 66,863 | |
| Residential stability (0,2) | 0.7 | 0.6 | 29,132 | 0.7 | 0.7 | 66,863 | |
| VDSV2 | |||||||
| Survey | Survey ethnic diversity (−10.3,1) | −0.5 | 3.4 | 10 | −2.9 | 5.0 | 10 |
| Cluster | Cluster ethnic diversity (−10.1,1) | −0.8 | 2.2 | 2,252 | −1.0 | 2.6 | 5,379 |
| Marital instability (0,30) | 0.7 | 0.6 | 2,252 | 0.6 | 0.7 | 5,379 | |
| Proportion secondary plus (0,1) | 0.4 | 0.3 | 2,252 | 0.3 | 0.3 | 5,379 | |
| Household | Household wealth (1,5) | 2.8 | 1.4 | 27,619 | 2.8 | 1.4 | 68,369 |
| Urban–rural residence (0,1) | 0.3 | 0.5 | 27,619 | 0.3 | 0.5 | 68,369 | |
| Individual | Birth cohort (0,1) | 0.5 | 0.5 | 27,619 | 0.5 | 0.5 | 68,369 |
| Time period (1,2) | 2.0 | 0.2 | 27,619 | 1.9 | 0.2 | 68,369 | |
| Healthcare past 12 months (1,2) | 1.6 | 0.5 | 27,619 | 1.5 | 0.5 | 68,369 | |
| Relationship power–differences (1,3) | 1.8 | 0.7 | 27,619 | 1.8 | 0.6 | 68,369 | |
| Age group (1,7) | 4.0 | 1.6 | 27,619 | 3.9 | 1.7 | 68,369 | |
| Residential stability (0,2) | 0.7 | 0.6 | 27,619 | 0.7 | 0.7 | 68,369 | |
| VDSV1 | |||||||
| Survey | Survey ethnic diversity (−10.3,1) | −1.7 | 4.2 | 6 | −1.7 | 4.5 | 14 |
| Cluster | Cluster ethnic diversity (−10.1,1) | −0.9 | 2.5 | 3,510 | −0.9 | 2.5 | 4,121 |
| Marital instability (0,30) | 0.6 | 0.6 | 3,510 | 0.7 | 0.7 | 4,121 | |
| Proportion secondary plus (0,1) | 0.3 | 0.3 | 3,510 | 0.4 | 0.3 | 4,121 | |
| Household | Household wealth (1,5) | 2.6 | 1.3 | 45,761 | 3.0 | 1.4 | 50,234 |
| Urban–rural residence (0,1) | 0.3 | 0.4 | 45,761 | 0.4 | 0.5 | 50,234 | |
| Individual | Birth cohort (0,1) | 0.5 | 0.5 | 45,761 | 0.5 | 0.5 | 50,234 |
| Time period (1,2) | 1.9 | 0.2 | 45,761 | 2.0 | 0.2 | 50,234 | |
| Healthcare past 12 months (1,2) | 1.5 | 0.5 | 45,761 | 1.6 | 0.5 | 50,234 | |
| Relationship power–differences (1,3) | 1.8 | 0.6 | 45,761 | 1.8 | 0.7 | 50,234 | |
| Age group (1,7) | 3.9 | 1.7 | 45,761 | 4.0 | 1.7 | 50,234 | |
| Residential stability (0,2) | 0.8 | 0.7 | 45,761 | 0.6 | 0.6 | 50,234 | |
Victim decisions in spousal violence estimates in Sub-Saharan Africa among females aged 15–49, Latest Country Demographic and Health Surveys, 2003–2024.
S.D., Standard Deviation; N, Number of Observations; VDSV1, Spousal Violence Accepting Attitudes despite Spousal Violence Experience; VDSV2, Sought Help for Spousal Violence Despite Spousal Violence Accepting Attitudes; VDSV3, Sought Help for Spousal Violence After Spousal Violence Experience Notwithstanding Attitudes.
Sample weight use is occasionally debated (Winship and Radbill, 1994; Lee and Forthofer, 2006); however, sampling weights were applied to adjust for non-response and oversampling. P-values of ≤ 0.05 were considered statistically significant. Independent variables' standard error (SE) precision and likelihood ratio test-based parameter testing were employed. Ultimately, the reported results utilized adjusted odds ratios (ORs) with 95% confidence intervals (CIs). Maximum likelihood estimation (MLE) was sought at 100 iterations to achieve convergence Ors (Andersen, 2008). In addition to ORs, post-estimation tests were performed to confirm that multivariate models fitted the data better than null models (prtest ≤ 0.05) (Hoffmann, 2004; Fox, 2016), including predicted marginal probabilities (Curtis et al., 1993; Fox, 2016), Wald tests (Hoffmann, 2004; Fox, 2016), Akaike Information Criterion (AIC), and Bayesian Information Criterion (BIC) scores (Hoffmann, 2004), alongside model log-likelihood tests (Hoffmann, 2004). Statistical conclusion validity, evaluating the plausibility of study findings, was assessed through external validity measures (Trochim, 2005). The Relative Index of Inequality (RII) estimates (Sergeant and Firth, 2006; O'Donnell and Wagstaff, 2008; Moreno-Betancur et al., 2015) were used to evaluate final models against relevant social theories (Trochim, 2005), particularly those addressing socioeconomic disparities in healthcare access. Some limitations in the validity assessments were noted (Fleck and Kuhn, 1979; Trochim, 2005; White, 2015).
3 Results
3.1 Descriptive analysis results
Tables 1–3 highlight regional variations in SV Experience and VDSV rates across Sub-Saharan Africa (SSA). Compared to SV experience rates in SSA (45.5%), SV experience rates are highest in Western Africa (50.3%), followed by Eastern Africa (44.8%) and Southern Africa (38.0%). For VDSV, the highest rates are seen for Other type VDSV2 (31.6%), Other type VDSV3 (31.0%), and Other type VDSV1 (23.6%). Lower rates occur for Discordant VDSV1 (20.7%), Discordant VDSV3 (13.5%), and Discordant VDSV2 (12.8%). Specifically, for the most reported VDSV types, the highest Other type VDSV2 rates are observed in Western Africa (37.2%), Eastern Africa (30.8%), and Southern Africa (26.9%), conversely the highest Discordant VDSV1 rates are observed in Eastern Africa (26.4%), Western Africa (23.3%), and Southern Africa (12.5%). Additionally, regional estimates of women's spousal violence against partners (calculations not shown) reveal the highest rates in Southern Africa (3.82%), followed by Western Africa (3.69%) and Eastern Africa (2.97%), compared to SSA (3.52%).
Table 4 indicates that in the final analytical sample, spousal violence was more commonly reported in survey years characterized by comparatively lower survey ethnic entropy/diversity, lower cluster ethnic entropy/diversity, lower cluster marital instability, and lower cluster proportions of women with secondary education or higher. Additionally, spousal violence victims were of lower socioeconomic status, lower urbanicity, younger birth cohorts, slightly better healthcare system accessibility, less women's final say in household decision-making, and higher residential stability when compared to women not reporting spousal violence.
Table 5 shows that among those reporting spousal violence, notwithstanding VDSV type, Discordant VDSV and Other type VDSV are evenly distributed across pre-1986 and post-1986 birth cohorts. Discordant VDSV1 and VDSV2 typically occur in areas with lower ethnic diversity, while Other VDSV1 and VDSV2 types were found in higher diversity areas; however, both Discordant and Other type VDSV appear equally in VDSV3 contexts. Across relationship power differences, not much variability is observed when comparing Discordant VDSV against Other type VDSV. Regarding healthcare system access, while Discordant VDSV1 and Discordant VDSV2 were more common among women with better access, Discordant VDSV3 is more prevalent among those with less healthcare access.
3.2 Multivariate model selection
Table 6 presents potential regression models of cohort disparities in VDSV in SSA. Based on the reviewed MD literature, four models were evaluated (M1–M4); centered on the lowest AICs, lowest BICs, highest positive and lowest negative log-likelihoods, highest degrees of freedom, lowest deviance, and largest difference between the null model (constant-only model) and the current model, M4 was selected. Typically, the best models were selected based on AIC and BIC measures, but other information criteria, such as log-likelihoods and degrees of freedom, deviance, and likelihood ratio tests (LR tests), helped resolve discrepancies among models. While AIC determines the best predictive models and BIC helps select the “true” model amongst multiple possible models, higher degrees of freedom suggest larger sample sizes and, subsequently, better false null hypotheses rejection; typically, the lowest AICs and highest log-likelihoods also went together (Hoffmann, 2004; Fox, 2016).
Table 6
| df | AIC | BIC | Log-lik. (Full) | LRTest | Deviance | ||
|---|---|---|---|---|---|---|---|
| By VDSV1 | |||||||
| M1 | Birth cohorts + other predictors (Mean Values) | 43 | 331,511.7 | 331,949.6 | −165,712.9 | 97,889.2 | 331,425.7 |
| M2 | Birth cohorts * cluster ethnic diversity + other predictors (mean values) | 47 | 331,414.3 | 331,892.8 | −165,660.1 | 97,994.6 | 331,320.3 |
| M3 | Birth cohorts * cluster ethnic diversity * relationship power-difference + other predictors (mean values) | 63 | 312,073.8 | 312,715.3 | −155,973.9 | 117,367.1 | 311,947.8 |
| M4 | Birth cohorts * cluster ethnic diversity * relationship power-difference * healthcare systems access + other predictors (mean values) | 87 | 310,666 | 311,551.9 | −155,246 | 118,822.9 | 310,492 |
| N | Sample size (weighted) | 195,389.6 | |||||
| By VDSV2 | |||||||
| M1 | Birth cohorts + other predictors (mean values) | 43 | 325,990.7 | 326,428.5 | −162,952.3 | 103,410.2 | 325,904.7 |
| M2 | Birth cohorts * cluster ethnic diversity + other predictors (mean values) | 47 | 325,923.3 | 326,401.9 | −162,914.7 | 103,485.6 | 325,829.3 |
| M3 | Birth cohorts * cluster ethnic diversity * relationship power-difference + other predictors (mean values) | 63 | 306,449 | 307,090.5 | −153,161.5 | 122,991.9 | 306,323 |
| M4 | Birth cohorts * cluster ethnic diversity * relationship power-difference * healthcare systems access + other predictors (mean values) | 87 | 305,127.7 | 306,013.6 | −152,476.8 | 124,361.2 | 304,953.7 |
| N | Sample size (weighted) | 195,389.6 | |||||
| By VDSV3 | |||||||
| M1 | Birth cohorts + other predictors (mean values) | 43 | 328,560.9 | 328,998.8 | −164,237.5 | 100,839.9 | 328,474.9 |
| M2 | Birth cohorts * cluster ethnic diversity + other predictors (mean values) | 47 | 328,494 | 328,972.6 | −164,200 | 100,914.9 | 328,400 |
| M3 | Birth cohorts * cluster ethnic diversity * relationship power-difference + other predictors (mean values) | 63 | 309,142 | 309,783.5 | −154,508 | 120,298.9 | 309,016 |
| M4 | Birth cohorts * cluster ethnic diversity * relationship power-difference * healthcare systems access + other predictors (mean values) | 87 | 307,806.9 | 308,692.8 | −153,816.5 | 121,682 | 307,632.9 |
| N | Sample size (weighted) | 195,389.6 | |||||
Multivariate multinomial logistic regression model selection for birth cohort differences in victim decisions in spousal violence in Sub-Saharan Africa demographic health surveys 2003–2024.
Author calculations using Demographic and Health Survey Data, 2003–2024.
VDSV1, Spousal Violence Accepting Attitudes despite Spousal Violence Experience; VDSV2, Sought Help For Spousal Violence Despite Spousal Violence Accepting Attitudes; VDSV3, Sought Help For Spousal Violence After Spousal Violence Experience Notwithstanding Attitudes; AIC, Aikake Criteria: lower values are better for prediction; BIC, Bayesian Information Criteria: smaller positive BIC is better and indicates a better model fit; Log lik. , Log Likelihood Full. Model: higher positive and lower negative values indicate better fit; df, Degrees of freedom: higher values are best fitted for predictions and generally mean larger sample sizes. Higher degrees of freedom also mean more power to reject a false null hypothesis and find a statistically significant result. Deviance: Lower deviance values indicate a better model fit. LRTest: The larger the difference between the null model (a constant-only model) and the current model, including predictors, the stronger the evidence that the model is significant.
3.3 Multivariate analysis results
Tables 7–9 present odds ratios for VDSV1, VDSV2, and VDSV3 across birth cohorts (BCs), neighborhood ethnic heterogeneity (NE), relationship power differences (PDs), and healthcare systems access (HC), adjusted for other related predictors. Conversely, Tables 10–14 present changes in predicted marginal probabilities for VDSV1, VDSV2, and VDSV3 across birth cohorts (before and after 1986) adjusted for similar factors with other predictors held constant at mean values.
Table 7
| Predictors | Categories | Discordant VDSV1 | Other type VDSV1 | ||
|---|---|---|---|---|---|
| OR | CI | OR | CI | ||
| (Intercept) | 1.17 | 0.55–2.47 | 2.32 | 0.94–5.75 | |
| Birth cohort | BC2 (Ref:BC1) | 1.10 | 0.86–1.42 | 1.09 | 0.83–1.43 |
| Cluster ethnic diversity | NE2 (Ref:NE1) | 0.82 | 0.74–0.90 | 0.90 | 0.81–1.00 |
| Relationship power-difference | PD2 (Ref:PD1) | 0.72 | 0.59–0.88 | 0.95 | 0.77–1.18 |
| PD3 | 0.82 | 0.66–1.03 | 0.75 | 0.58–0.97 | |
| Healthcare systems access | HC2 (Ref:HC1) | 0.89 | 0.70–1.12 | 1.40 | 1.08–1.81 |
| Urban residence | Rural (Ref:Urban) | 1.10 | 1.07–1.14 | 1.03 | 0.99–1.07 |
| Wealth quintile | Poorer (Ref.Poorest) | 0.99 | 0.95–1.03 | 0.90 | 0.86–0.94 |
| Middle | 0.95 | 0.91–0.99 | 0.80 | 0.77–0.83 | |
| Richer | 0.83 | 0.79–0.87 | 0.62 | 0.59–0.65 | |
| Richest | 0.66 | 0.62–0.69 | 0.38 | 0.36–0.40 | |
| Historical time period | 2013–2024 (Ref:2003–2012) | 0.36 | 0.18–0.74 | 0.34 | 0.14–0.82 |
| Cluster residential stability | Non–Movers (Ref:Movers) | 1.13 | 1.10–1.17 | 1.13 | 1.10–1.17 |
| Others | 0.64 | 0.38–1.07 | 1.43 | 0.76–2.68 | |
| Age group | 20–24(Ref:15–19) | 2.86 | 2.70–3.03 | 2.06 | 1.95–2.18 |
| 25–29 | 3.85 | 3.63–4.08 | 2.56 | 2.41–2.70 | |
| 30–34 | 4.38 | 4.11–4.67 | 2.85 | 2.67–3.03 | |
| 35–39 | 4.66 | 4.32–5.03 | 3.16 | 2.92–3.41 | |
| 40–44 | 4.66 | 4.30–5.05 | 3.05 | 2.81–3.32 | |
| 45–49 | 4.97 | 4.57–5.40 | 3.18 | 2.92–3.47 | |
| Survey ethnic diversity | 1.02 | 0.98–1.07 | 1.02 | 0.96–1.08 | |
| GDP per capita | 1.00 | 1.00–1.00 | 1.00 | 1.00–1.00 | |
| Cluster secondary plus proportion | 0.88 | 0.82–0.95 | 0.46 | 0.42–0.50 | |
| Cluster marital instability | 0.90 | 0.88–0.92 | 0.84 | 0.82–0.87 | |
| Interaction term 1 | BC2*NE2 | 1.09 | 0.94–1.26 | 1.07 | 0.91–1.25 |
| Interaction term 2 | BC2*NE2*PD2 | 0.96 | 0.80–1.15 | 0.96 | 0.79–1.16 |
| BC2*NE2*PD3 | 1.59 | 1.30–1.95 | 1.68 | 1.33–2.12 | |
| Interaction term 3 | BC2*NE2*PD2*HC2 | 0.91 | 0.71–1.16 | 0.74 | 0.57–0.96 |
| BC2*NE2*PD3*HC2 | 0.78 | 0.58–1.06 | 0.43 | 0.31–0.61 | |
| Observations | 195,389 | ||||
Estimated odds ratios (or) and confidence intervals (ci) for spousal violence accepting attitudes despite spousal violence experience across birth cohort differences in Sub-Saharan Africa, Latest Country DHS 2003–2024.
Demographic and Health Surveys(DHS), 2003–2024.
Ref., Reference Category; BC1, Pre-1986, BC2, 1986+; NE1, Less than Sample Grand Mean Cluster Ethnic Diversity, NE2, Sample Grand Mean and Greater; PD1, Final Say in Household Decisions, PD2, No Final Say, PD3, Never Married; HC1, No Healthcare Access, HC2, Healthcare Access in Past 12 Months; VDSV1, Spousal Violence Accepting Attitudes Despite Spousal Violence Experience; GDP, Gross Domestic Product; Discord, Discordant Decisions; Other, Unknown or Concordant Decisions.
Table 8
| Predictors | Categories | Discordant VDSV2 | Other type VDSV2 | ||
|---|---|---|---|---|---|
| OR | CI | OR | CI | ||
| (Intercept) | 3.00 | 1.66–5.45 | 0.67 | 0.27–1.64 | |
| Birth cohort | BC2 (Ref:BC1) | 1.13 | 0.89–1.44 | 1.06 | 0.79–1.42 |
| Cluster ethnic Diversity | NE2 (Ref:NE1) | 0.87 | 0.80–0.96 | 0.84 | 0.75–0.94 |
| Relationship Power-Difference | PD2 (Ref:PD1) | 0.89 | 0.74–1.07 | 0.67 | 0.53–0.85 |
| PD3 | 0.82 | 0.66–1.02 | 0.74 | 0.56–0.97 | |
| Healthcare Systems Access | HC2 (Ref:HC1) | 1.10 | 0.88–1.38 | 0.98 | 0.74–1.28 |
| Urban Residence | Rural (Ref:Urban) | 1.06 | 1.02–1.09 | 1.09 | 1.04–1.14 |
| Wealth Quintile | Poorer (Ref.Poorest) | 0.95 | 0.91–0.98 | 0.92 | 0.88–0.97 |
| Middle | 0.87 | 0.84–0.91 | 0.85 | 0.81–0.90 | |
| Richer | 0.73 | 0.70–0.77 | 0.70 | 0.66–0.73 | |
| Richest | 0.54 | 0.51–0.56 | 0.47 | 0.44–0.50 | |
| Historical Time Period | 2013–2024 (Ref:2003–2012) | 0.29 | 0.16–0.50 | 0.52 | 0.22–1.21 |
| Cluster Residential Stability | Non-movers (Ref:Movers) | 1.09 | 1.06–1.12 | 1.28 | 1.23–1.32 |
| Others | 1.07 | 0.71–1.60 | 0.68 | 0.36–1.26 | |
| Age Group | 20–24 (Ref:15–19) | 2.29 | 2.18–2.41 | 2.78 | 2.59–2.99 |
| 25–29 | 2.89 | 2.75–3.04 | 3.86 | 3.59–4.15 | |
| 30–34 | 3.27 | 3.09–3.45 | 4.39 | 4.05–4.76 | |
| 35–39 | 3.54 | 3.30–3.78 | 4.79 | 4.36–5.26 | |
| 40–44 | 3.57 | 3.32–3.84 | 4.46 | 4.03–4.92 | |
| 45–49 | 3.82 | 3.54–4.12 | 4.55 | 4.10–5.04 | |
| Survey Ethnic Diversity | 1.02 | 0.98–1.05 | 1.04 | 0.98–1.09 | |
| GDP Per Capita | 1.00 | 1.00–1.00 | 1.00 | 1.00–1.00 | |
| Cluster Secondary Plus Proportion | 0.64 | 0.59–0.68 | 0.80 | 0.73–0.88 | |
| Cluster Marital Instability | 0.87 | 0.86–0.89 | 0.89 | 0.86–0.91 | |
| Interaction Term 1 | BC2*NE2 | 1.07 | 0.93–1.23 | 1.08 | 0.91–1.28 |
| Interaction Term 2 | BC2*NE2*PD2 | 0.97 | 0.82–1.14 | 0.94 | 0.76–1.17 |
| BC2*NE2*PD3 | 1.62 | 1.34–1.97 | 1.60 | 1.24–2.07 | |
| Interaction term 3 | BC2*NE2*PD2*HC2 | 0.83 | 0.66–1.04 | 0.86 | 0.65–1.15 |
| BC2*NE2*PD3*HC2 | 0.64 | 0.48–0.86 | 0.60 | 0.41–0.87 | |
| Observations | 195389 | ||||
Estimated odds ratios (OR) and confidence intervals (CI) for sought help for spousal violence despite accepting attitudes across birth cohort differences in Sub-Saharan Africa, Latest Country DHS 2003–2024.
Demographic and Health Surveys(DHS), 2003–2024.
Ref., Reference Category; BC1, Pre-1986, BC2, 1986+; NE1, Less than Sample Grand Mean Cluster Ethnic Diversity, NE2, Sample Grand Mean and Greater; PD1, Final Say in Household Decisions, PD2, No Final Say, PD3, Never Married; HC1, No Healthcare Access, HC2, Healthcare Access in Past 12 Months; VDSV2, Sought Help for Spousal Violence despite Accepting Attitudes; GDP, Gross Domestic Product; Discord, Discordant Decisions; Other, Unknown or Concordant Decisions.
Table 9
| Predictors | Categories | Discordant VDSV3 | Other type VDSV3 | ||
|---|---|---|---|---|---|
| OR | CI | OR | CI | ||
| (Intercept) | 2.75 | 1.47–5.18 | 0.87 | 0.37–2.03 | |
| Birth Cohort | BC2 (Ref:BC1) | 1.09 | 0.86–1.38 | 1.19 | 0.88–1.61 |
| Cluster Ethnic Diversity |
NE2 (Ref:NE1) | 0.85 | 0.78–0.93 | 0.89 | 0.80–1.00 |
| Relationship Power-Difference |
PD2 (Ref:PD1) | 0.82 | 0.68–0.98 | 0.83 | 0.66–1.05 |
| PD3 | 0.85 | 0.69–1.06 | 0.65 | 0.49–0.87 | |
| Healthcare Systems Access |
HC2 (Ref:HC1) | 1.02 | 0.81–1.28 | 1.16 | 0.88–1.52 |
| Urban Residence | Rural (Ref:Urban) | 1.06 | 1.03–1.10 | 1.07 | 1.03–1.12 |
| Wealth Quintile | Poorer (Ref.Poorest) | 0.94 | 0.91–0.98 | 0.93 | 0.89–0.97 |
| Middle | 0.86 | 0.83–0.90 | 0.87 | 0.83–0.91 | |
| Richer | 0.72 | 0.69–0.75 | 0.73 | 0.69–0.77 | |
| Richest | 0.53 | 0.50–0.55 | 0.50 | 0.47–0.53 | |
| Historical Time Period |
2013–2024 (Ref:2003–2012) | 0.30 | 0.16–0.54 | 0.46 | 0.20–1.03 |
| Cluster Residential Stability |
Non–Movers (Ref:Movers) | 1.13 | 1.10–1.16 | 1.17 | 1.13–1.21 |
| Others | 1.11 | 0.72–1.71 | 0.62 | 0.35–1.12 | |
| Age Group | 20–24 (Ref:15–19) | 2.42 | 2.31–2.55 | 2.40 | 2.24–2.56 |
| 25–29 | 3.16 | 3.01–3.32 | 3.06 | 2.86–3.28 | |
| 30–34 | 3.61 | 3.41–3.81 | 3.40 | 3.16–3.67 | |
| 35–39 | 3.93 | 3.67–4.21 | 3.66 | 3.34–4.00 | |
| 40–44 | 3.94 | 3.67–4.24 | 3.47 | 3.15–3.82 | |
| 45–49 | 4.06 | 3.76–4.38 | 3.89 | 3.52–4.29 | |
| Survey Ethnic Diversity |
1.02 | 0.98–1.06 | 1.03 | 0.97–1.08 | |
| GDP Per Capita | 1.00 | 1.00–1.00 | 1.00 | 1.00–1.00 | |
| Cluster Secondary Plus Proportion |
0.65 | 0.60–0.70 | 0.76 | 0.69–0.84 | |
| Cluster Marital Instability |
0.88 | 0.86–0.89 | 0.88 | 0.85–0.91 | |
| Interaction Term 1 | BC2*NE2 | 1.09 | 0.95–1.26 | 1.02 | 0.86–1.21 |
| Interaction Term 2 | BC2*NE2*PD2 | 0.95 | 0.80–1.12 | 1.00 | 0.81–1.24 |
| BC2*NE2*PD3 | 1.69 | 1.39–2.05 | 1.46 | 1.12–1.91 | |
| Interaction Term 3 | BC2*NE2*PD2*HC2 | 0.86 | 0.68–1.08 | 0.78 | 0.58–1.03 |
| BC2*NE2*PD3*HC2 | 0.63 | 0.48–0.84 | 0.62 | 0.42–0.91 | |
| Observations | 195389 | ||||
Estimated odds ratios (OR) and confidence intervals (CI) for sought help for spousal violence after spousal violence experience notwithstanding attitudes across birth cohort differences in Sub-Saharan Africa, Latest Country DHS 2003–2024.
Demographic and Health Surveys(DHS), 2003–2024.
Ref., Reference Category; BC1, Pre-1986, BC2, 1986+; NE1, Less than Sample Grand Mean Cluster Ethnic Diversity, NE2, Sample Grand Mean and Greater; PD1, Final Say in Household Decisions, PD2, No Final Say, PD3, Never Married; HC1, No Healthcare Access, HC2, Healthcare Access in Past 12 Months; VDSV3 , Sought Help for Spousal Violence after Spousal Violence Experience; GDP, Gross Domestic Product; Discord, Discordant Decisions; Other, Unknown or Concordant Decisions.
Table 10
| VDSV | Region | BC | BC/NE1 | BC/NE2 |
|---|---|---|---|---|
| Discord VDSV1 | Sub-Saharan Africa | 0.55 | 1.45 | (0.01) |
| Eastern Africa | 0.81 | 1.50 | 0.36 | |
| Southern Africa | 0.53 | 1.44 | (0.06) | |
| Western Africa | 0.29 | 1.40 | (0.33) | |
| Discord VDSV2 | Sub-Saharan Africa | (0.11) | 0.86 | (0.70) |
| Eastern Africa | 0.04 | 0.92 | (0.50) | |
| Southern Africa | (0.08) | 0.84 | (0.67) | |
| Western Africa | (0.30) | 0.83 | (0.93) | |
| Discord VDSV3 | Sub-Saharan Africa | 0.71 | 2.02 | (0.10) |
| Eastern Africa | 0.83 | 2.04 | 0.06 | |
| Southern Africa | 0.79 | 2.02 | 0.00 | |
| Western Africa | 0.51 | 2.01 | (0.36) | |
| Other VDSV1 | Sub-Saharan Africa | 4.86 | 2.07 | 6.73 |
| Eastern Africa | 5.14 | 2.13 | 7.13 | |
| Southern Africa | 4.85 | 2.07 | 6.67 | |
| Western Africa | 4.60 | 2.02 | 6.38 | |
| Other VDSV2 | Sub-Saharan Africa | 5.14 | 2.13 | 7.13 |
| Eastern Africa | 4.03 | 1.81 | 5.52 | |
| Southern Africa | 3.91 | 1.74 | 5.34 | |
| Western Africa | 3.68 | 1.72 | 5.06 | |
| Other VDSV3 | Sub-Saharan Africa | 5.14 | 2.13 | 7.13 |
| Eastern Africa | 3.75 | 1.42 | 5.29 | |
| Southern Africa | 3.71 | 1.40 | 5.23 | |
| Western Africa | 3.42 | 1.39 | 4.85 |
Effects of neighborhood ethnic heterogeneity (NE) on percent change across birth cohorts (BC) in predicted probabilities of victim decisions in spousal violence (VDSV) in Sub-Saharan Africa, Latest Country DHS 2003–2024.
Author calculations using Demographic and Health Survey (DHS), 2003–2024.
VDSV1, Spousal Violence Accepting Attitudes despite Spousal Violence Experience; VDSV2, Sought Help for Spousal Violence despite Accepting Attitudes; VDSV3, Sought Help for Spousal Violence after Spousal Violence Experience; NE1, Less than Sample Grand Mean Cluster Ethnic Diversity; NE2, Sample Grand Mean and Greater; Discord=Discordant Decisions; Other, No Decision or Concordant Decisions.
Do birth cohorts explain VDSV in SSA? To what extent? (Hypothesis 1). Table 10 reveals that when holding other predictors constant at mean values, a 1-unit increase in BCs was associated with changes of 0.55%, minus 0.11%, and 0.71% in predicted marginal probabilities of Discordant VDSV1, VDSV2, and VDSV3, respectively; furthermore, changes of 4.86%, 5.14%, and 5.14%, respectively, in Other VDSV1, VDSV2, and VDSV3 types.
Does neighborhood ethnic heterogeneity moderate birth cohort differences in VDSV? To what extent? (Hypothesis 1). In sub-Saharan Africa, Table 10 indicates, while holding other predictors constant at mean values, with every 1-unit increase in BCs and corresponding 1-unit increase in cluster ethnic diversity, 1.45%, 0.86%, and 2.02% changes in predicted marginal probabilities of Discordant VDSV1, VDSV2, and VDSV3 in neighborhoods with ethnic heterogeneity less than sample grand mean, compared to minus 0.01%, minus 0.70%, and minus 0.10% changes in neighborhoods with ethnic heterogeneity equal to or greater than sample grand mean, respectively. Additionally, Table 10 indicates that under similar conditions, neighborhoods with below sample grand mean ethnic heterogeneity experience 2.07%, 2.13%, and 2.13% changes in predicted marginal probabilities of Other VDSV1, VDSV2, and VDSV3 types, compared to 6.73%, 7.13%, and 7.13% changes in neighborhoods with greater ethnic heterogeneity.
Do relationship power difference and neighborhood ethnic heterogeneity moderate birth cohort differences in VDSV? To what extent? (Hypothesis 2). In SSA, Table 11 indicates, while holding other predictors at mean values, with every 1-unit increase in BCs, average changes in Discordant VDSV1 probabilities of 46.2%, 3.7%, and minus 46.9% across relationship power differences, small (PD1), large (PD2), and never-married (PD3), respectively, in cluster ethnic diversity below sample grand mean. In contrast, average changes in Discordant VDSV1 probabilities of 46.1%, 3.4%, and minus 46.6% across relationship power differences, small (PD1), large (PD2), and never-married (PD3), in cluster ethnic diversity greater than or equal to the sample grand mean. Additionally, Other VDSV1 probabilities reflect changes of 40.4%, 7.6%, and minus 40.5% across relationship power differences, small (PD1), large (PD2), and never-married (PD3), in cluster ethnic diversity below sample grand mean, compared to average changes in Other VDSV1 probabilities of 37.9%, 7.3%, and minus 39.1% across relationship power differences, small (PD1), large (PD2), and never-married (PD3), in cluster ethnic diversity greater than or equal to sample grand mean.
Table 11
| VDSV | Region | BC /NE1 /PD1 | BC /NE1 /PD2 | BC /NE1 /PD3 | BC /NE2 /PD1 | BC /NE2 /PD2 | BC /NE2 /PD3 |
|---|---|---|---|---|---|---|---|
| Discord VDSV1 | Sub-Saharan Africa | 46.18 | 3.74 | (46.93) | 46.11 | 3.41 | (46.59) |
| Eastern Africa | 45.52 | 3.96 | (46.84) | 47.19 | 3.71 | (47.00) | |
| Southern Africa | 47.59 | 3.65 | (47.20) | 48.43 | 3.48 | (47.27) | |
| Western Africa | 45.44 | 3.61 | (46.73) | 42.72 | 3.02 | (45.50) | |
| Discord VDSV2 | Sub-Saharan Africa | 43.31 | 4.71 | (48.23) | 37.56 | 2.69 | (44.49) |
| Eastern Africa | 44.97 | 4.85 | (48.70) | 39.87 | 3.01 | (45.11) | |
| Southern Africa | 42.77 | 4.67 | (48.18) | 39.09 | 2.82 | (45.17) | |
| Western Africa | 42.17 | 4.61 | (47.82) | 33.72 | 2.23 | (43.19) | |
| Discord VSDV3 | Sub-Saharan Africa | 43.07 | 5.83 | (47.12) | 39.95 | 3.39 | (44.70) |
| Eastern Africa | 44.51 | 5.93 | (47.63) | 41.87 | 3.67 | (45.32) | |
| Southern Africa | 42.61 | 5.80 | (47.07) | 41.84 | 3.60 | (45.36) | |
| Western Africa | 42.10 | 5.75 | (46.67) | 36.14 | 2.91 | (43.42) | |
| Other VDSV1 | Sub-Saharan Africa | 40.37 | 7.61 | (40.52) | 37.88 | 7.29 | (39.07) |
| Eastern Africa | 39.73 | 7.84 | (40.43) | 38.89 | 7.61 | (39.54) | |
| Southern Africa | 41.71 | 7.52 | (40.84) | 40.06 | 7.36 | (39.85) | |
| Western Africa | 39.65 | 7.48 | (40.30) | 34.67 | 6.89 | (37.83) | |
| Other VDSV2 | Sub-Saharan Africa | 47.91 | 5.80 | (48.80) | 45.39 | 8.88 | (40.95) |
| Eastern Africa | 49.63 | 5.94 | (49.26) | 47.83 | 9.23 | (41.61) | |
| Southern Africa | 47.36 | 5.76 | (48.75) | 47.00 | 9.02 | (41.67) | |
| Western Africa | 46.74 | 5.70 | (48.39) | 41.33 | 8.40 | (39.57) | |
| Other VDSV3 | Sub-Saharan Africa | 48.07 | 5.47 | (49.25) | 44.41 | 8.65 | (40.81) |
| Eastern Africa | 49.56 | 5.58 | (49.73) | 46.40 | 8.94 | (41.48) | |
| Southern Africa | 47.59 | 5.45 | (49.20) | 46.37 | 8.88 | (41.52) | |
| Western Africa | 47.06 | 5.39 | (48.81) | 40.48 | 8.14 | (39.44) |
Effects of neighborhood ethnic heterogeneity (NE) and relationship power difference (PD) on percent change across birth cohorts (BC) in predicted probabilities of victim decisions in spousal violence (VDSV) in Sub-Saharan Africa, Latest Country DHS 2003–2024.
Author calculations using Demographic and Health Surveys (DHS), 2003–2024.
VDSV1, Spousal Violence Accepting Attitudes Despite Spousal Violence Experience; VDSV2, Sought Help for Spousal Violence Despite Spousal Accepting Attitudes; VDSV3, Sought Help for Spousal Violence After Spousal Violence Experience; NE1, Less than Sample Grand Cluster Mean Ethnic Diversity; NE2, Sample Grand Mean and Greater Neighborhood Ethnic Diversity; PD1, Final Say in Household Decisions; PD2, No Final Say; PD3, Never Married; Discord, Discordant Decisions; Other, Unknown or Concordant Decisions.
In SSA, Table 11 indicates, while holding other predictors at mean values, with every 1-unit increase in BCs, average changes in Discordant VDSV2 probabilities of 43.3%, 4.7%, and minus 48.2% across relationship power differences, small (PD1), large (PD2), and never-married (PD3), respectively, in cluster ethnic diversity below sample grand mean. In contrast, average changes in Discordant VDSV2 probabilities of 37.6%, 2.7%, and minus 44.5% across relationship power-differences, small (PD1), large (PD2), and never-married (PD3), in cluster ethnic diversity greater than or equal to the sample grand mean. Additionally, Other VDSV2 probabilities reflect changes of 47.9%, 5.8%, and minus 48.8% across relationship power-differences, small (PD1), large (PD2), and never-married (PD3), in cluster ethnic diversity below sample grand mean, compared to average changes in Other VDSV2 probabilities of 45.4%, 8.9%, and minus 41.0% across relationship power-differences, small (PD1), large (PD2), and never-married (PD3), in cluster ethnic diversity greater than or equal to sample grand mean.
In SSA, Table 11 indicates, while holding other predictors at mean values, with every 1-unit increase in BCs, average changes in Discordant VDSV3 probabilities of 43.1%, 5.8%, and minus 47.1% across relationship power differences, small (PD1), large (PD2), and never-married (PD3), respectively, in cluster ethnic diversity below sample grand mean. In contrast, average changes in Discordant VDSV3 probabilities of 40.4%, 3.4%, and minus 44.7% across relationship power differences, small (PD1), large (PD2), and never-married (PD3), in cluster ethnic diversity greater than or equal to the sample grand mean. Additionally, other VDSV3 probabilities reflect changes of 48.1%, 5.5%, and minus 49.3% across relationship power differences, small (PD1), large (PD2), and never-married (PD3), in cluster ethnic diversity below sample grand mean, compared to average changes in Other VDSV3 probabilities of 44.4%, 8.7%, and minus 40.8% across relationship power differences, small (PD1), large (PD2), and never-married (PD3), in cluster ethnic diversity greater than or equal to sample grand mean.
Do birth cohorts on VDSV effects, varying across relationship power difference and neighborhood ethnic heterogeneity, also differ with healthcare systems' accessibility? To what extent? (Hypothesis 3).
3.3.1 Discordant VDSV1, VDSV2, and VSDV3
In SSA, Table 12 shows, across HC1, with other predictors held constant at mean values, for each 1-unit increase in BCs, Discordant VDSV1 probabilities change by 51.9%, minus 4.1%, and minus 63.3% across relationship power differences, small (PD1), large (PD2), and never-married (PD3), respectively, where cluster ethnic diversity is below the sample grand mean. In contrast, with cluster ethnic diversity at or above the grand mean, the changes were 47.4%, minus 4.7%, and minus 60.9%. Additionally, under similar conditions, across HC2, Discordant VDSV1 probabilities change by 41.1%, 11.8%, and minus 25.1% across relationship power differences, small (PD1), large (PD2), and never-married (PD3) where cluster ethnic diversity is below sample grand mean, compared to changes of 45.8%, 11.8%, and minus 28.3% where cluster ethnic diversity at or above the sample grand mean.
Table 12
| VDSV | Region | HC | BC/NE1/ PD1 | BC/NE1/ PD2 | BC/NE1/ PD3 | BC/NE2/PD1 | BC/NE2/ PD2 | BC/NE2/ PD3 |
|---|---|---|---|---|---|---|---|---|
| Discord VDSV1 | Sub-Saharan Africa | HC1 | 51.90 | (4.14) | (63.26) | 47.41 | (4.72) | (60.90) |
| Eastern Africa | HC1 | 51.87 | (3.76) | (63.31) | 49.46 | (4.45) | (61.41) | |
| Southern Africa | HC1 | 53.07 | (4.41) | (63.43) | 49.66 | (4.89) | (61.50) | |
| Western Africa | HC1 | 50.76 | (4.25) | (63.03) | 43.10 | (4.82) | (59.80) | |
| Sub-Saharan Africa | HC2 | 41.14 | 11.81 | (25.10) | 45.82 | 11.78 | (28.32) | |
| Eastern Africa | HC2 | 39.71 | 11.78 | (24.76) | 45.75 | 12.09 | (28.36) | |
| Southern Africa | HC2 | 42.89 | 11.98 | (25.48) | 48.29 | 12.17 | (28.94) | |
| Western Africa | HC2 | 40.84 | 11.66 | (25.05) | 43.43 | 11.06 | (27.67) | |
| Discord VDSV2 | Sub-Saharan Africa | HC1 | 54.82 | (5.96) | (72.14) | 51.13 | (3.27) | (62.62) |
| Eastern Africa | HC1 | 57.59 | (5.77) | (72.45) | 54.24 | (3.11) | (63.21) | |
| Southern Africa | HC1 | 53.85 | (6.09) | (72.16) | 53.21 | (3.29) | (63.25) | |
| Western Africa | HC1 | 53.02 | (6.04) | (71.83) | 45.94 | (3.40) | (61.41) | |
| Sub-Saharan Africa | HC2 | 30.93 | 16.34 | (9.12) | 25.05 | 8.47 | (19.63) | |
| Eastern Africa | HC2 | 31.59 | 16.37 | (9.60) | 26.65 | 8.97 | (20.01) | |
| Southern Africa | HC2 | 30.79 | 16.41 | (8.94) | 26.07 | 8.78 | (20.07) | |
| Western Africa | HC2 | 30.41 | 16.22 | (8.81) | 22.42 | 7.65 | (18.82) | |
| Discord VDSV3 | Sub-Saharan Africa | HC1 | 58.86 | (3.85) | (71.72) | 50.86 | (5.78) | (64.51) |
| Eastern Africa | HC1 | 61.06 | (3.77) | (72.08) | 53.45 | (5.61) | (65.05) | |
| Southern Africa | HC1 | 58.13 | (3.85) | (71.70) | 53.36 | (5.73) | (65.10) | |
| Western Africa | HC1 | 57.40 | (3.93) | (71.39) | 45.76 | (5.99) | (63.38) | |
| Sub-Saharan Africa | HC2 | 26.97 | 16.11 | (6.59) | 29.86 | 13.18 | (15.69) | |
| Eastern Africa | HC2 | 27.73 | 16.22 | (7.04) | 31.14 | 13.56 | (16.15) | |
| Southern Africa | HC2 | 26.73 | 16.05 | (6.55) | 31.18 | 13.59 | (16.12) | |
| Western Africa | HC2 | 26.45 | 16.05 | (6.18) | 27.26 | 12.39 | (14.80) |
Effect of healthcare systems accessibility (HC) on percent change across birth cohorts (BC) in predicted probabilities of discordant victim decisions in spousal violence (VDSV) in Sub-Saharan Africa adjusted for neighborhood ethnic heterogeneity (NE), relationship power difference (PD), Latest Country DHS 2003–2024.
Author calculations using Demographic and Health Surveys (DHS), 2003–2024.
VDSV1, Spousal Violence Accepting Attitudes Despite Spousal Violence Experience; VDSV2, Sought Help for Spousal Violence Despite Spousal Accepting Attitudes; VDSV3, Sought Help for Spousal Violence After Spousal Violence Experience; NE1, Less than Sample Grand Mean Cluster Ethnic Diversity; NE2, ; Sample Grand Mean and Greater Neighborhood Ethnic Diversity; na, Not Applicable; HC1, No Healthcare Access; HC2, Healthcare Access in Past 12 Months; PD1, Final Say in Household Decisions; PD2, No Final Say; PD3, Never Married; Discord, Discordant Decision; Other, Unknown or Concordant Decisions.
Furthermore, in SSA, Table 12 indicates, across HC1, while holding other predictors constant at mean values, for each 1-unit increase in BCs, average changes in Discordant VDSV2 probabilities are 54.8%, minus 6.0%, and minus 72.1% across relationship power-differences, small (PD1), large (PD2), and never-married (PD3) respectively, in clusters ethnic heterogeneity below the sample grand mean. In contrast, for cluster ethnic diversity at or above the grand mean, the changes are 51.1%, minus 3.3%, and minus 62.6%. Additionally, across HC2, under similar conditions, the average changes in Discordant VDSV2 probabilities were 30.9%, 16.3%, and minus 9.1% across relationship power differences, small (PD1), large (PD2), and never-married (PD3), respectively, in cluster ethnic diversity below the sample grand mean, compared to 25.1%, 8.5%, and minus 19.6% for cluster ethnic diversity at or above the sample grand mean.
Finally, in SSA, Table 12 indicates, across HC1, with other predictors held constant at mean values, for each 1-unit increase in BCs, average changes in Discordant VDSV3 probabilities are 58.9%, minus 3.9%, and minus 71.7% across relationship power differences, small (PD1), large (PD2), and never-married (PD3), respectively, in clusters ethnic heterogeneity below the sample grand mean. In contrast, for cluster ethnic diversity at or above the grand mean, the changes are 50.9%, minus 5.8%, and minus 64.5%. Additionally, across HC2, under similar conditions, the average changes in Discordant VDSV3 probabilities were 27.0%, 16.1%, and minus 6.6% across relationship power differences, small (PD1), large (PD2), and never-married (PD3), respectively, in cluster ethnic diversity below sample grand mean, compared to 30.0%, 13.2%, and minus 15.7% for cluster ethnic diversity at or above the sample grand mean.
3.3.2 Other type VDSV1, VDSV2, and VSDV3
In SSA, Table 13 shows, with other predictors held constant at mean values, for every 1-unit increase in BCs, average changes in Other VDSV1 type probabilities across HC1 are 59.1%, minus 3.7%, and minus 59.0% across relationship power differences, small (PD1), large (PD2), and never-married (PD3), respectively, in clusters ethnic heterogeneity below the sample grand mean. In contrast, for cluster ethnic diversity at or above the grand mean, the changes are 56.0%, minus 3.2%, and minus 56.7%. Similarly, for HC2, average changes in Other VDSV1 type probabilities are 23.4%, 10.9%, and minus 15.7% across relationship power differences, small (PD1), large (PD2), and never-married (PD3), in cluster ethnic diversity below the sample grand mean, compared to 21.7%, 10.8%, and minus 15.7% for cluster ethnic diversity at or above the sample grand mean.
Table 13
| VDSV | Region | HC | BC/NE1/ PD1 | BC/NE1/ PD2 | BC/NE1/ PD3 | BC/NE2/PD1 | BC/NE2/ PD2 | BC/NE2/ PD3 |
|---|---|---|---|---|---|---|---|---|
| OtherVDSV1 | Sub-Saharan Africa | HC1 | 59.12 | 3.67 | (58.97) | 55.97 | 3.19 | (56.66) |
| Eastern Africa | HC1 | 59.09 | 4.09 | (59.03) | 58.14 | 3.48 | (57.23) | |
| Southern Africa | HC1 | 60.35 | 3.38 | (59.16) | 58.35 | 3.00 | (57.32) | |
| Western Africa | HC1 | 57.93 | 3.55 | (58.72) | 51.41 | 3.09 | (55.44) | |
| Sub Saharan Africa | HC2 | 23.42 | 10.89 | (15.73) | 21.68 | 10.75 | (15.67) | |
| Eastern Africa | HC2 | 22.16 | 10.87 | (15.36) | 21.62 | 11.06 | (15.72) | |
| Southern Africa | HC2 | 24.95 | 11.06 | (16.16) | 23.74 | 11.14 | (16.40) | |
| Western Africa | HC2 | 23.15 | 10.75 | (15.68) | 19.68 | 10.04 | (14.91) | |
| OtherVDSV2 | Sub-Saharan Africa | HC1 | 69.65 | 2.08 | (70.04) | 60.17 | 4.20 | (59.08) |
| Eastern Africa | HC1 | 72.68 | 2.29 | (70.37) | 63.46 | 4.37 | (59.73) | |
| Southern Africa | HC1 | 68.59 | 1.95 | (70.06) | 62.38 | 4.17 | (59.77) | |
| Western Africa | HC1 | 67.68 | 2.00 | (69.70) | 54.67 | 4.05 | (57.75) | |
| Sub-Saharan Africa | HC2 | 26.72 | 8.82 | (17.83) | 31.77 | 13.07 | (17.12) | |
| Eastern Africa | HC2 | 27.36 | 8.85 | (18.27) | 33.46 | 13.60 | (17.51) | |
| Southern Africa | HC2 | 26.59 | 8.90 | (17.67) | 32.85 | 13.40 | (17.56) | |
| Western Africa | HC2 | 26.22 | 8.72 | (17.55) | 29.01 | 12.22 | (16.28) | |
| OtherVDSV3 | Sub-Saharan Africa | HC1 | 67.95 | 1.59 | (70.14) | 60.68 | 5.70 | (58.07) |
| Eastern Africa | HC1 | 70.27 | 1.67 | (70.52) | 63.45 | 5.89 | (58.71) | |
| Southern Africa | HC1 | 67.18 | 1.59 | (70.11) | 63.35 | 5.76 | (58.77) | |
| Western Africa | HC1 | 66.41 | 1.50 | (69.79) | 55.25 | 5.46 | (56.73) | |
| Sub-Saharan Africa | HC2 | 28.43 | 8.68 | (19.08) | 29.52 | 10.88 | (18.87) | |
| Eastern Africa | HC2 | 29.20 | 8.79 | (19.47) | 30.79 | 11.25 | (19.31) | |
| Southern Africa | HC2 | 28.19 | 8.63 | (19.05) | 30.83 | 11.28 | (19.29) | |
| Western Africa | HC2 | 27.90 | 8.63 | (18.73) | 26.92 | 10.10 | (18.01) |
Effect of healthcare systems accessibility (HC) on percent change across birth cohorts (BC), in predicted probabilities of other victim decisions in spousal violence (VDSV) in Sub-Saharan Africa adjusted for neighborhood ethnic heterogeneity (NE), and relationship power difference (PD), Latest Country DHS 2003–2024.
Author Calculations using Demographic and Health Surveys (DHS), 2003–2024.
VDSV1, Spousal Violence Accepting Attitudes Despite Spousal Violence Experience; VDSV2, Sought Help for Spousal Violence Despite Accepting Attitudes; VDSV3, Sought Help for Spousal Violence After Violence Experience; NE1, Less than Sample Grand Mean Cluster Ethnic Diversity; NE2, Sample Grand Mean and Greater; na, Not Applicable; HC1, No Access; HC2, Access in Past 12 Months; PD1, Final Say in Household Decisions; PD2, No Final Say; PD3, Never Married; Discord, Discordant Decisions; Other, Unknown or Concordant Decisions.
Furthermore, In SSA, Table 13 indicates, with other predictors held constant at mean values, for each 1-unit increase in BCs, average changes in Other VDSV2 type probabilities across HC1 are 69.7%, 2.1%, and minus 70.0% across relationship power differences, small (PD1), large (PD2), and never-married (PD3), respectively, with cluster ethnic diversity below the sample grand mean. In contrast, for cluster ethnic diversity at or above the grand mean, the changes are 60.2%, 4.2%, and minus 59.1%. Similarly, across HC2, average changes of 26.7%, 8.8%, and minus 17.8% in Other VDSV2 type probabilities are observed across relationship power differences, small (PD1), large (PD2), and never-married (PD3), for cluster ethnic diversity below sample grand mean, compared to 31.8%, 13.1%, and minus 17.1% for cluster ethnic diversity at or above the sample grand mean.
Finally, in SSA, Table 13 indicates, with other predictors held constant at mean values, for each 1-unit increase in BCs, average changes in Other VDSV3 type probabilities across HC1 are 68.0%, 1.6%, and minus 70.1% across relationship power differences, small (PD1), large (PD2), and never-married (PD3), respectively, with cluster ethnic diversity below the sample grand mean. When cluster ethnic diversity is at or above the grand mean, the changes are 60.7%, 5.7%, and minus 58.1%. Furthermore, across HC2, under similar conditions, average changes in Other VDSV3 types probabilities are 28.4%, 8.7%, and minus 19.1% across relationship power differences, small (PD1), large (PD2), and never-married (PD3), in cluster ethnic diversity below sample grand mean, compared to 29.5%, 10.9% and minus 18.9% at or above the sample grand mean.
3.3.3 Statistical conclusion validity assessment
Table 14 presents results of the external validity assessment, including the relative index of inequality (RII) estimates comparing predicted marginal probabilities from final models for the poorest and richest groups (SES1 and SES5). The final model probabilities were those adjusted for BCs, NE, PD, and HC (discussed above). The RII estimates confirm that healthcare access contributes to cohort disparities in VDSV in SSA; smaller poor-rich ratios of Discordant VDSV1, VDSV2, and VDSV3 probabilities for each 1-unit increase in BCs among women reporting healthcare systems access in the 12 months preceding the survey compared to those reporting no access. The above-observed patterns are further supported by smaller poor-rich ratios of Other type VDSV1, VDSV2, and VDSV3 probabilities for each 1-unit increase in BCs changes among women reporting healthcare systems access in the 12 months preceding the survey.
Table 14
| VDSV | HC | RII | NE1 | NE1 | NE1 | NE2 | NE2 | NE2 |
|---|---|---|---|---|---|---|---|---|
| PD1 | PD2 | PD3 | PD1 | PD2 | PD3 | |||
| Discord VDSV1 | HC1 | SES1 | 0.61 | 0.90 | 0.93 | 0.62 | 1.05 | 0.92 |
| /SES5 | ||||||||
| HC2 | SES1 | 0.62 | 0.74 | 0.63 | 0.69 | 0.72 | 0.87 | |
| /SES5 | ||||||||
| Discord VDSV2 | HC1 | SES1 | 0.58 | 0.97 | 0.93 | 0.60 | 1.13 | 0.92 |
| /SES5 | ||||||||
| HC2 | SES1 | 0.68 | 0.78 | 0.68 | 0.61 | 0.65 | 0.83 | |
| /SES5 | ||||||||
| Discord VDSV3 | HC1 | SES1 | 0.59 | 0.98 | 0.93 | 0.60 | 1.08 | 0.92 |
| /SES5 | ||||||||
| HC2 | SES1 | 0.65 | 0.78 | 0.54 | 0.65 | 0.75 | 0.79 | |
| /SES5 | ||||||||
| Other VDSV1 | HC1 | SES1 | 0.61 | 1.14 | 0.92 | 0.64 | 0.98 | 0.90 |
| /SES5 | ||||||||
| HC2 | SES1 | 0.71 | 0.66 | 0.88 | 0.57 | 0.76 | 0.70 | |
| /SES5 | ||||||||
| Other VDSV2 | HC1 | SES1 | 0.62 | 1.10 | 0.92 | 0.63 | 0.90 | 0.91 |
| /SES5 | ||||||||
| HC2 | SES1 | 0.64 | 0.65 | 0.84 | 0.67 | 0.75 | 0.80 | |
| /SES5 | ||||||||
| Other VDSV3 | HC1 | SES1 | 0.62 | 1.04 | 0.92 | 0.63 | 0.92 | 0.90 |
| /SES5 | ||||||||
| HC2 | SES1 | 0.66 | 0.65 | 0.84 | 0.65 | 0.71 | 0.82 | |
| /SES5 |
Socioeconomic differences (SES) in healthcare systems access (HC) effects on percent change across birth cohorts (BC) in predicted probabilities of victim decisions in spousal violence (VDSV) in Sub-Saharan Africa, adjusted for neighborhood ethnic heterogeneity (NE) and relationship power differences (PD), Latest Country DHS 2003–2024.
Author calculations using Demographic and Health Surveys (DHS), 2003–2024.
VDSV1, Spousal Violence Accepting Attitudes Despite Spousal Violence Experience; VDSV2, Sought Help for Spousal Violence Despite Spousal Accepting Attitudes; VDSV3, Sought Help for Spousal Violence After Violence Experience; NE1, Less than Sample Grand Mean Cluster Ethnic Diversity; NE2, Sample Grand Mean and Greater; na, Not Applicable; HC1, No Access; HC2, Access in Past 12 Months; SES5, Richest Wealth Quintile; SES1, Poorest Wealth Quintile; PD1, Final Say in Household Decisions; PD2, No Final Say; PD3, Never Married; Discord, Discordant Decisions; Other, Unknown or Concordant Decisions; RII, Relative Index of Inequality Estimates (SES5/SES1).
4 Discussion and conclusion
Contradictory evidence exists on whether medicine may explain social disparities in health perceptions. This study examines whether medicine could explicate social differences, particularly cohort differences in victim decisions in spousal violence (VDSV) in sub-Saharan Africa (SSA); herein, “medicine” serves as a controlled environment or “mesocosm” for observing natural behaviors (Odum, 1984), while VDSV represents spousal violence (SV) perceptions.
Across BCs, a greater percentage change in predicted marginal probabilities for other type VDSV compared to discordant VDSV was observed at mean values. When analyzing neighborhood ethnic heterogeneity, a smaller increase across BCs in predicted marginal probabilities was observed for discordant VDSV compared to other type VDSV in higher cluster ethnic diversity areas (NE2) compared to lower cluster ethnic diversity areas (NE1); observed differences diminished after adjusting for relationship power differences and healthcare system access.
Regarding the overall direction of change across BCs, the findings suggest that across large power difference (PD1), both Discordant and Other type VDSV probabilities increase across BCs; younger cohorts exhibit higher VDSV rates. Across never-married women (PD3), both Discordant and Other type VDSV probabilities decrease across BCs; younger cohorts demonstrate lower VDSV rates. However, across small power difference (PD2), mixed patterns emerged: among those with recent healthcare access (HC2), both Discordant and Other type VDSV predicted marginal probabilities increase across BCs; younger cohorts exhibit greater VDSV rates. However, among those without recent healthcare access (HC1), the probabilities decrease across BCs, which means younger cohorts show lower VDSV rates.
Specifically concerning healthcare access, the following patterns were observed. For large power difference (PD1), for example, women with recent healthcare access (HC2) show about half the percentage change across BCs in Discordant and Other type VDSV-predicted marginal probabilities compared to those without. Similarly, for never-married women (PD3), the change is about a quarter. In contrast, for small power difference (PD2), women with recent healthcare access (HC2) experience a threefold change in Discordant and Other type VDSV-predicted marginal probabilities compared to those without.
Finally, the statistical conclusion validity assessment (Trochim, 2005) using Relative Index of Inequality (RII) estimates (Sergeant and Firth, 2006; O'Donnell and Wagstaff, 2008; Moreno-Betancur et al., 2015) confirms that healthcare systems access modifies socioeconomic health inequalities in the study sample, though some limitations were noted in the validity assessments (Fleck and Kuhn, 1979; White, 2015).
Household-level findings support the medical dominance (MD) theory, which examines social interactions within healthcare systems through the lens of relationship power asymmetry and its effects (Freidson, 1970; Starr, 1982). First, evidence concurs that power-asymmetry relationships, such as those in spouse–partner relationships, identical to physician–patient relationships, are biased across specific social factors (Abbott, 1988; Dillon, 2020); statistical significance for selected social determinants, relationship power differences, and healthcare system accessibility were observed. Moreover, findings challenge the value-free perspective of the sick-role theory (Parsons, 1975; Dillon, 2020), and reveal statistically significant cross-system interaction modification effects for spouse–partner relationships, similar to those in physician–patient relationships; power-asymmetry relationships may be value-influenced (Conrad and Schneider, 1992; Dillon, 2020).
Furthermore, observed cross-systemic interaction effects corroborate macro-societal socio-ecological theories (Bronfenbrenner, 2005; Mackie et al., 2015) by illustrating how structure-constrained human agency can affect VDSV (Archer, 2000; Davidson, 2015); discordant decision-making has been associated with constrained individual agency (Davidson, 2015; Kabiru et al., 2017). Moreover, statistically significant healthcare systems access effects partially support medical mesocosms (Odum, 1984), which suggests that medical dominance (MD) theory via pattern-matching (Trochim, 2005; Punch, 2014) may illuminate socio-behavioral patterns within spousal violence in households in SSA. Finally, healthcare access effects on cohort differences in VDSV highlight the broad positive social impacts of adequate healthcare, including reducing socioeconomic inequalities in health (Phelan et al., 2010; Quesnel-Vallée et al., 2021), despite known limitations (Great Britain Working Group on Inequalities in Health et al., 1982; Lutfey and Freese, 2005; Frohlich and Abel, 2014).
The increase in predicted marginal probabilities for Other type VDSV across BCs concurs with lower acceptance of SV amongst younger age groups in SSA (ICF, 2012b), despite higher SV incidence potentially confounding the results (UN-WOMEN, 2024).
Research on healthcare systems access and spousal violence in SSA suggests that variations in VDSV may relate to differing exposure to anti-violence interventions at healthcare facilities (Sprague et al., 2016; Hatcher et al., 2019). Similarly, the power difference measure reflects differing women's autonomy in healthcare decisions (Rutstein and Rojas, 2006; Croft et al., 2023); going from pre-1986 to post-1986 birth cohorts, observed VDSV predicted marginal probabilities change across both healthcare systems access and relationship power differences (small, large, and never-married). Additionally, study results emphasize the moderating effect of relationship power difference (UN-WOMEN, 2024).
Despite limitations, research in SSA also concurs that medicine can help reduce social health inequalities, for instance, among the urban poor facing poor health outcomes and limited healthcare access (African Population and Health Research Center, 2002, 2014). First, medical research has increased awareness of social health disparities related to urban–rural and within-urban area differences (Ezeh et al., 2017; Lilford et al., 2017). Moreover, access to maternal healthcare, such as the Output-Based Aid (OBA) Voucher Program, has resulted in fewer home deliveries (Bellows et al., 2012) and lower infant mortality risks (Amendah et al., 2013). However, it correlates with higher spousal violence (Izugbara and Ngilangwa, 2010; Njuki et al., 2012) and increased maternal mortality risks due to inadequate healthcare resources (Ziraba et al., 2009b), as well as the threat of catastrophic healthcare costs (Buigut et al., 2015). Additionally, immunization interventions have not fully resolved inequities in access (Ettarh et al., 2012; Egondi et al., 2015).
Still, interpretations must acknowledge several study limitations. First, household surveys pose several challenges. Spatial interpolation of self-reported data for neighborhood-level measures may exacerbate inaccuracies, underestimating highs and overestimating lows (Van Ham and Manley, 2012; Duncan and Kawachi, 2018). Sampling errors can occur (McNabb, 2020; Olson, 2020) due to the underrepresentation of wealthier households (Wolff, 1987) and imprecision at smaller sub-national levels (ICF International, 2012; Greenwell and Salentine, 2018). Additionally, other errors (McNabb, 2020; Olson, 2020), such as non-response and underreporting (Wolff, 1987; Morelli et al., 2015) and their subsequent effects, such as selection, reporting, and recall biases (Wolff, 1987; O'Donnell and Wagstaff, 2008). To address these issues, the results were adjusted for socioeconomic disparities (Trochim, 2005), and sample weights were applied to account for non-response and underreporting (Lee and Forthofer, 2006). Recent surveys helped mitigate recall and reporting biases (Magadi and Desta, 2011), and control groups of unaffected women were included to reduce selection bias (Lee and Forthofer, 2006). Nationally representative household surveys remain crucial in countries with limited vital statistics (Joubert et al., 2012; Ye et al., 2012). However, implementation challenges, such as poor weather and limited resource availability (Iburg et al., 2001; Greenwell and Salentine, 2018), can cause delays between surveys, impacting pooled analyses (Iburg et al., 2001; Croft et al., 2023); predefined data collection periods, DHS Phase Identifiers, were established to help manage these delays (UNICEF, 2015; Greenwell and Salentine, 2018).
Second, outside low-and-middle-income countries, SV interventions target both public health and legal redress systems (Rizo and Macy, 2011; Prosman et al., 2014; Huntley et al., 2019; Satyen et al., 2019), within SSA; however, policy-makers, partly due to reported SV-accepting social norm barriers in legal redress systems (Odero et al., 2014; Mannell et al., 2016; Gillum et al., 2018), primarily advance public health SV interventions (Joyner, 2013), which may bias study findings (Shadish et al., 2001; Trochim, 2005). During the Coronavirus disease (COVID-19) lockdowns, for instance, SV victims increased, but healthcare systems worldwide prioritized COVID-19 (Akudolu et al., 2023; UN-WOMEN, 2024). Some post-pandemic studies suggested roles for alternative SV support from informal neighborhood social networks, multi-sectoral government support, and non-governmental organizations (Kibe et al., 2020; Wood et al., 2022a; Engdawork et al., 2024). Other studies, however, advocated for healthcare systems support, recommending health caregiver re-training (Wood et al., 2022b) and expanded allied health professionals' involvement, such as including radiologists (Matoori et al., 2021).
Third, to mitigate the risk of social desirability bias in discussions about marriage and sexuality (Ezenweke, 2016; Mannell et al., 2016), a behavioral measure was employed to capture SV perceptions (Mackie et al., 2015). Additionally, to mitigate survey data limitations, several constructed or proxy measures, such as healthcare systems access, were incorporated (Croft et al., 2023). Moreover, the measurement framework used, drawn from macro-meso-micro analogy (Mackie et al., 2015), constitutes multiple social theories but limited accounting for between-theory mediation effects (Ransome, 2010); predictive margins estimated socio-ecological theory hypothesized macro, mezzo, micro, and exosystem interaction effects (Wright, 1997; Bronfenbrenner, 2005), achieving reproducibility (Trochim, 2005; Punch, 2014) but compromising other conditional interaction possibilities (Ransome, 2010; Galster, 2012; Dahlgren and Whitehead, 2021). Moreover, pattern-matching Leventhal's “common-sense-model” theory, which utilizes cyclic illness perception measures (Leventhal et al., 2016), VDSV1, VDSV2, and VDSV3, was derived from related measures, SV experience, help-seeking for SV, and SV accepting attitudes, a suboptimal approach due to internal validity risks (Shadish et al., 2001; Trochim, 2005). Overall, non-standardized measures can undermine plausibility testing, aka. related research evidence comparability (Pearlin, 1989; Cohen et al., 1995; Wright, 1997), a critical factor for establishing strong causal associations (Bonita et al., 2006; Oakes and Kaufman, 2017); evidence on challenges associated with different conceptualizations of stress (Pearlin, 1989; Cohen et al., 1995) and social class (Wright, 1997) corroborate this. Nonetheless, differing trends in VDSV patterns 1 and 2 counter VDSV 3, suggesting that alternative measures may provide valuable insights, augmenting existing survey practices, specifically concerning VDSV pattern 3 (Croft et al., 2023).
Furthermore, the question arises, why, despite known limitations (Odum, 1984; Carpenter, 1996), interrogate esoteric human behavior through mesocosms of equivalent better-understood human behavior? For theory and practice, partially significant healthcare system access modification results imply fragmentary multi-contextual importance of healthcare mesocosms. A contra-mesocosm argument of Parsons' teacher–student and physician–patient interactions' mesocosms (Dillon, 2020) maybe that, while current social systemic influence, including systemic interactions influence, is assumed, unique preceding social system influence is ignored, such as across gender, race, and social class (Zgourides and Zgourides, 2000). System stativity and stability are also incorrectly assumed, and person-to-person differences are ignored (Zgourides and Zgourides, 2000). Moreover, a contra-mesocosm argument of the physician–patient and spouse–partner relationships' mesocosm may be that, while spouse–partner power-asymmetry is primarily personal, physician–patient power-asymmetry is mainly professional (Dillon, 2020), as such, equal power asymmetry may be inconsonant.
Contra-mesocosm debates also incorporate pro-microcosm and pro-macrocosm analogy debates. Pro-microcosm analogy debates suggest using smaller social context studies to explicate larger contexts or single-case studies to explicate multi-person case studies. Specifically, pro-microcosm debates include bridging social process expectations and reality (Auyero, 1999) and transcending social attitudes to illustrate the social phenomenon under study (LaPiere, 1934), such as through participatory observation (Hochschild, 1997; Olson, 2020). Pro-macrocosm analogy debates postulate using larger social contexts to explicate smaller contexts or many to explain one, such as multi-country studies. Specifically, pro-macrocosm debates include relatively low costs for comprehensive large-number studies (Lamont and Swidler, 2014) and within-study error correction methods (Jerolmack and Khan, 2014; Lamont and Swidler, 2014) for misreporting (Jerolmack and Khan, 2014) or bias (Lamont and Swidler, 2014), cross-disciplinary transference (Lamont and Swidler, 2014).
Pro-mesocosm debates encompass contra-microcosm and contra-macrocosm analogy debates. Contra-microcosm analogy debates include limited generalizability of study findings (Weiss, 2004; Small, 2009), positionality bias (McCorkel and Myers, 2003; Takacs, 2003), and overdependence on master narratives (McCorkel and Myers, 2003) for unique stories (Katz, 1997). Contra-macrocosm analogy debates include objectivity rather than subjectivity, implying limited in-depth subject study (Lamont and Swidler, 2014), outlier exclusion (Lamont and Swidler, 2014), and methodological individualism (Heath, 2005), as opposed to collectivism, where social groups and structures primarily explain individuals. However, results illustrate mesocosm applicability, MD, to understanding social systems' influence on VDSV within households in SSA, which also endures across different VDSV estimation methods, postulating strong mesocosm effects.
Study results advocate healthcare systems' approaches to social problems (Conrad and Schneider, 1992; Ityo, 2010; UN-WOMEN, 2024) in SSA, specifically healthcare systems' theory-based approaches. Healthcare system access effects indicate VDSV sensitivity to macro-societal changes, suggesting roles for macro-societal policy (UN-WOMEN, 2024). Notably, the data indicate shifts in cohort differences correspond with significant reproductive health policy milestones, such as the 1984 Mexico International Conference on Population Development (United Nations, 1984). Findings emphasize comprehensive yet localized adoption of macro-societal policies, such as supporting evidence-based best practices in the ongoing implementation of The Maputo Protocol of 1995 (Ayeni, 2016; Nyarko, 2016; Mutuku, 2023; Adesina, 2024). Future research may explore the implications of such findings today, particularly in light of donor healthcare funding cuts in developing countries (Bosire, 2025; World Health Organization, 2025).
Statements
Data availability statement
Publicly available datasets were analyzed in this study. This data can be found here: https://dhsprogram.com/data/available-datasets.cfm.
Ethics statement
Ethical approval was not required for the study involving human data in accordance with the local legislation and institutional requirements. Written informed consent to participate in this study was not required in accordance with the national legislation and the institutional requirements.
Author contributions
PE: Writing – original draft, Writing – review & editing, Formal analysis.
Funding
The author(s) declare that financial support was received for the research and/or publication of this article. The funding was provided by the Canadian Queen Elizabeth II Diamond Jubilee Scholarship Program (2015–2020).
Acknowledgments
Thanks to Frontiers in Sociology for editing support. This project benefited from initial review by Professor Bobby Das and Professor Sarah Brauner-Otto of McGill University, Canada. Concept development benefited from conversations with non-profit organizations working in spousal violence-impacted communities, including Bethany, Inc. of Washington, D.C. and the African Population and Health Research Center, Nairobi. Thanks also to Dr. Blessing Mberu of the African Population and Health Research Center for review support.
Conflict of interest
The author declares that the research was conducted in the absence of any commercial or financial relationships that could be construed as a potential conflict of interest.
Publisher’s note
All claims expressed in this article are solely those of the authors and do not necessarily represent those of their affiliated organizations, or those of the publisher, the editors and the reviewers. Any product that may be evaluated in this article, or claim that may be made by its manufacturer, is not guaranteed or endorsed by the publisher.
References
1
Abbott A. D. (1988). The System of Professions: An Essay on the Division of Expert Labor. Chicago: University of Chicago Press. 10.7208/chicago/9780226189666.001.0001
2
Abramsky T. Devries K. Kiss L. Nakuti J. Kyegombe N. Starmann E. et al . (2014). Findings from the SASA! Study: a cluster randomized controlled trial to assess the impact of a community mobilization intervention to prevent violence against women and reduce HIV risk in Kampala, Uganda. BMC Med.12:122. 10.1186/s12916-014-0122-5
3
Adesina O. (2024). Article 9 of The Maputo Protocol and The Advancement of Political Rights for Women in Nigeria. Afr. J. Psychol. Stud. Soc. Issues27, 146–162. 10.6084/m9.figshare.25249972
4
African Population and Health Research Center (2002). Population and Health Dynamics in Nairobi's Informal Settlements.Nairobi: APHRC.
5
African Population and Health Research Center (2014). Population and Health Dynamics in Nairobi's Informal Settlements: Report of the Nairobi Cross-Sectional Slums Survey (NCSS) 2012.Nairobi: APHRC.
6
Africapractice (2024). Femicide in Kenya and the resounding call for accountability. Available online at: https://africapractice.com/insights/ (Accessed August 1, 2024).
7
Ahmad F. Driver N. McNally M. J. Stewart D. E. (2009). “Why doesn't she seek help for partner abuse?” An exploratory study with South Asian immigrant women. Soc. Sci. Med.69, 613–622. 10.1016/j.socscimed.2009.06.011
8
Akudolu L. O. Okolie C. N. Okoro E. A. Nwamuo B. E. Okeke I. Aigbonoga S. et al . (2023). Global rise in gender-based violence against women and girls during COVID-19 lockdown: An insight from Africa. Cogent Arts Humanit.10:2188772. 10.1080/23311983.2023.2188772
9
Alexander G. R. Kogan M. D. Nabukera S. (2002). Racial differences in prenatal care use in the United States: are disparities decreasing?Am. J. Public Health92, 1970–1975. 10.2105/AJPH.92.12.1970
10
Allen M. Devitt C. (2012). Intimate Partner Violence and Belief Systems in Liberia. J. Interpers. Violence27, 3514–3531. 10.1177/0886260512445382
11
Alubo O. Hunduh V. (2017). Medical dominance and resistance in Nigeria's health care system. Int. J. Health Serv.47, 778–794. 10.1177/0020731416675981
12
Amendah D. D. Mutua M. K. Kyobutungi C. Buliva E. Bellows B. (2013). Reproductive health voucher program and facility based delivery in informal settlements in Nairobi: a longitudinal analysis. PLoS ONE8:e80582. 10.1371/journal.pone.0080582
13
Ananth C. V. Misra D. P. Demissie K. Smulian J. C. (2001). Rates of preterm delivery among Black women and White women in the United States over two decades: an age-period-cohort analysis. Am. J. Epidemiol.154, 657–665. 10.1093/aje/154.7.657
14
Andersen R. (2008). Modern Methods for Robust Regression. Los Angeles: Sage Publications. 10.4135/9781412985109
15
Archer M. S. (2000). Being Human: the Problem of Agency. Cambridge, U.K. ; New York: Cambridge University Press. 10.1017/CBO9780511488733
16
Arestoff F. Djemai E. (2016). Women's empowerment across the life cycle and generations: evidence from Sub-Saharan Africa. World Dev.87, 70–87. 10.1016/j.worlddev.2016.06.002
17
Armstrong D. (1995). The rise of surveillance medicine. Sociol. Health Illn.17, 393–404. 10.1111/1467-9566.ep10933329
18
Assari S. (2013). Multilevel approach to intimate partner violence research and prevention. Int. J. Prev. Med.4, 616–617.
19
Auyero J. (1999). “From the client's point (s) of view”: how poor people perceive and evaluate political clientelism. Theory Soc.28, 297–334. 10.1023/A:1006905214896
20
Ayeni V. (2016). “The Impact of the African Charter and the Maputo Protocol in Nigeria,” in The Impact of the African Charter and Maputo Protocol in Selected African States, ed. AyeniV. (South Africa: Pretoria University Law Press), 183–202.
21
Balogun M. O. John-Akinola Y. O. (2015). A qualitative study of intimate partner violence among women in Nigeria. J. Interpers. Violence30, 2410–2427. 10.1177/0886260514553112
22
Bellows B. Kyobutungi C. Mutua M. K. Warren C. Ezeh A. (2012). Increase in facility-based deliveries associated with a maternal health voucher programme in informal settlements in Nairobi, Kenya. Health Policy Plan.28, 134–142. 10.1093/heapol/czs030
23
Berhanie E. Gebregziabher D. Berihu H. Gerezgiher A. Kidane G. (2019). Intimate partner violence during pregnancy and adverse birth outcomes: a case-control study. Reprod. Health16:22. 10.1186/s12978-019-0670-4
24
Bernstein M. Phillips T. Zerbe A. McIntyre J. A. Brittain K. Petro G. et al . (2016). Intimate partner violence experienced by HIV-infected pregnant women in South Africa: a cross-sectional study. BMJ Open6:e011999. 10.1136/bmjopen-2016-011999
25
Bhuwania P. Heymann J. (2022). Tuition-free secondary education and women's attitudes toward intimate partner violence: evidence from Sub-Saharan Africa. SSM - Popul. Health17:101046. 10.1016/j.ssmph.2022.101046
26
Bonita R. Beaglehole R. Kjellström T. (2006). Basic Epidemiology. Geneva: World Health Organization.
27
Bosire N. (2025). Health funding cuts: We must stop weeping and start building. Dly. Nation. Available online at: https://nation.africa/kenya/health/health-funding-cuts-we-must-stop-weeping-and-start-building-4919350 (Accessed May 10, 2025).
28
Bronfenbrenner U. (2005). Making Human Beings Human: Bioecological Perspectives On Human Development. Thousand Oaks: Sage Publications.
29
Buigut S. Ettarh R. Amendah D. D. (2015). Catastrophic health expenditure and its determinants in Kenya slum communities. Int. J. EQUITY Health 14. 10.1186/s12939-015-0168-9
30
Carpenter S. R. (1996). Microcosm experiments have limited relevance for community and ecosystem ecology. Ecology77, 677–680. 10.2307/2265490
31
Christofides N. Jewkes R. (2010). Acceptability of universal screening for intimate partner violence in voluntary HIV testing and counseling services in South Africa and service implications. AIDS Care22, 279–285. 10.1080/09540120903193617
32
Coburn D. (1993). State authority, medical dominance, and trends in the regulation of the health-professions - the ontario case. Soc. Sci. Med.37, 841–850. 10.1016/0277-9536(93)90137-S
33
Coburn D. (1999). Phases of capitalism, welfare states, medical dominance, and health care in Ontario. Int. J. Health Serv.29, 833–851. 10.2190/57WB-A3D1-GE4V-B437
34
Coggon D. Barker D. Rose G. (2009). Epidemiology for the Uninitiated. New York: John Wiley and Sons.
35
Cohen S. Kessler R. C. Gordon L. U. (1995). “Strategies for measuring stress in studies of psychiatric and physical disorders,” in Measuring stress: A guide for health and social scientists, eds. KesslerR. C.GordonL. U. (Oxford: Oxford University Press), 3–26. 10.1093/oso/9780195086416.003.0001
36
Colombini M. Dockerty C. Mayhew S. H. (2017). Barriers and facilitators to integrating health service responses to intimate partner violence in low- and middle-income countries: a comparative health systems and service analysis. Stud. Fam. Plann.48, 179–200. 10.1111/sifp.12021
37
Colombini M. Mayhew S. Watts C. (2008). Health-sector responses to intimate partner violence in low- and middle-income settings: a review of current models, challenges and opportunities. Bull. World Health Organ.86, 635–642. 10.2471/BLT.07.045906
38
Conrad P. (1992). Medicalization and social control. Annu. Rev. Sociol.18, 209–232. 10.1146/annurev.so.18.080192.001233
39
Conrad P. (2005). The shifting engines of medicalization. J. Health Soc. Behav.46, 3–14. 10.1177/002214650504600102
40
Conrad P. (2007). The Medicalization of Society: on the Transformation of Human Conditions into Treatable Disorders. Baltimore: Johns Hopkins University Press. 10.56021/9780801885846
41
Conrad P. Schneider J. W. (1992). Deviance and Medicalization : From Badness To Sickness : With a New Afterword by the Authors. Philadelphia: Temple University Press.
42
Cooper R. J. Bissell P. Ward P. Murphy E. Anderson C. Avery T. et al . (2012). Further challenges to medical dominance? The case of nurse and pharmacist supplementary prescribing. Health16, 115–133. 10.1177/1363459310364159
43
Corburn J. Hildebrand C. (2015). Slum sanitation and the social determinants of women's health in Nairobi, Kenya. J. Environ. Public Health2015:209505. 10.1155/2015/209505
44
Corburn J. Sverdlik A. (2017). Slum upgrading and health equity. Int. J. Environ. Res. Public. Health14:342. 10.3390/ijerph14040342
45
Croft T. N. Allen C. K. Zachary B. W. (2023). Guide to DHS Statistics. Calverton, MD: ORC Macro.
46
Curtis S. L. Diamond I. McDonald J. W. (1993). Birth interval and family effects on postneonatal mortality in Brazil. Demography30, 33–43. 10.2307/2061861
47
Dahlgren G. Whitehead M. (2021). The Dahlgren-Whitehead model of health determinants: 30 years on and still chasing rainbows. Public Health199, 20–24. 10.1016/j.puhe.2021.08.009
48
Davidson A. (2015). Social Determinants of Health: A Comparative Approach. Oxford: Oxford University Press.
49
Decker M. R. Nair S. Saggurti N. Sabri B. Jethva M. Raj A. et al . (2013). Violence-related coping, help-seeking and health care-based intervention preferences among perinatal women in Mumbai, India. J. Interpers. Violence28, 1924–1947. 10.1177/0886260512469105
50
Delamou A. Samandari G. Camara B. S. Traore P. Diallo F. G. Millimono S. et al . (2015). Prevalence and correlates of intimate partner violence among family planning clients in Conakry, Guinea. BMC Res. Notes8, 814–814. 10.1186/s13104-015-1811-7
51
Dietz T. Burns T. R. Buttel F. H. (1990). Evolutionary theory in sociology: an examination of current thinking. Sociol. Forum5, 155–171. 10.1007/BF01112590
52
Dillon M. (2020). Introduction to Sociological Theory: Theorists, Concepts, and Their Applicability to the Twenty-First Century.New York: John Wiley and Sons.
53
Duncan D. T. Kawachi I. (2018). Neighborhoods and Health. New York: Oxford University Press. 10.1093/oso/9780190843496.003.0001
54
Egondi T. Oyolola M. Mutua M. K. Elung'ata P. (2015). Determinants of immunization inequality among urban poor children: evidence from Nairobi's informal settlements. Int. J. Equity Health14:24. 10.1186/s12939-015-0154-2
55
Elder Jr G. H. (1994). Time, human agency, and social change: perspectives on the life course. Soc. Psychol. Q. 4:15. 10.2307/2786971
56
Elff M. (2022). mclogit: Multinomial Logit Models, with or without Random Effects or Overdispersion. Available online at: https://CRAN.R-project.org/package=mclogit (Accessed April 25, 2025).
57
Emina J. Beguy D. Zulu E. M. Ezeh A. C. Muindi K. Elung'ata P. et al . (2011). Monitoring of health and demographic outcomes in poor urban settlements: evidence from the Nairobi Urban Health and Demographic Surveillance System. J. Urban Health88, 200–218. 10.1007/s11524-011-9594-1
58
Engdawork K. Amdework E. Assefa S. Ayode D. Tadele G. (2024). Experiences and lessons from structural interventions against COVID-19 in Addis Ababa, Ethiopia. Front. Sociol.9:1305549. 10.3389/fsoc.2024.1305549
59
Essendi H. Mills S. Fotso J.-C. (2011). Barriers to formal emergency obstetric care services' utilization. J. URBAN Health-Bull. N. Y. Acad. Med.88, 356–369. 10.1007/s11524-010-9481-1
60
Ettarh R. R. Mutua M. K. Kyobutungi C. (2012). Ethnicity and delay in measles vaccination in a Nairobi slum. Trop. Med. Health40:59. 10.2149/tmh.2012-09s
61
Evans R. G. Barer M. L. Marmor T. R. (1994). Why are Some People Healthy and Others Not? The Determinants of Health of Populations. New York: A. de Gruyter. 10.1515/9783112421628
62
Ezeanochie M. C. Olagbuji B. N. Ande A. B. Kubeyinje W. E. Okonofua F. E. (2011). Prevalence and correlates of intimate partner violence against HIV-seropositive pregnant women in a Nigerian population. Acta Obstet. Gynecol. Scand.90, 535–539. 10.1111/j.1600-0412.2011.01083.x
63
Ezeh A. Oyebode O. Satterthwaite D. Chen Y.-F. Ndugwa R. Sartori J. et al . (2017). The history, geography, and sociology of slums and the health problems of people who live in slums. LANCET389, 547–558. 10.1016/S0140-6736(16)31650-6
64
Ezenweke E. O. (2016). Rites of passage and sustainable development in traditional Africa: reflections for contemporary society. J. Relig. Hum. Relat.8, 19–34.
65
Fleck L. Kuhn T. S. (1979). Genesis and Development of a Scientific Fact.Chicago: University of Chicago Press.
66
Fogel R. W. Costa D. L. (1997). A theory of technophysio evolution, with some implications for forecasting population, health care costs, and pension costs. Demography34, 49–66. 10.2307/2061659
67
Foucault M. (1975). The Birth of the Clinic: An Archaeology of Medical Perception. New York: Vintage Books.
68
Fox J. (2016). Applied Regression Analysis and Generalized Linear Models. Third Edition. Los Angeles: SAGE.
69
Freidson E. (1970). Profession of Medicine : A Study of the Sociology of Applied Knowledge. New York: Dodd, Mead.
70
Frohlich K. L. Abel T. (2014). Environmental justice and health practices: understanding how health inequities arise at the local level. Sociol. Health Illn.36, 199–212. 10.1111/1467-9566.12126
71
Galster G. C. (2012). “The mechanism (s) of neighbourhood effects: theory, evidence, and policy implications,” in Neighbourhood effects research: New perspectives (Springer), 23–56. 10.1007/978-94-007-2309-2_2
72
Gamble V. (1997). Under the shadow of Tuskegee: African Americans and health care. Am. J. PUBLIC Health87, 1773–1778. 10.2105/AJPH.87.11.1773
73
Garenne M. (2018). “Family planning and fertility decline in Africa: from 1950 to 2010,” in Family Planning, ed. AmarinZ. O. (Rijeka: IntechOpen), Ch. 7. 10.5772/intechopen.71029
74
Gelman A. Hill J. (2007). Data analysis using regression and multilevel/hierarchical models. Cambridge: Cambridge University Press. 10.32614/CRAN.package.arm
75
Gerhardt U. (1989). Ideas About Illness : An Intellectual and Political History Of Medical Sociology. New York: New York University Press. 10.1007/978-1-349-20016-0
76
Ghasi N. C. Ogbuabor D. C. Onodugo V. A. (2020). Perceptions and predictors of organizational justice among healthcare professionals in academic hospitals in South-Eastern Nigeria. BMC Health Serv. Res.20:155. 10.1186/s12913-020-05187-5
77
Gibbs A. Carpenter B. Crankshaw T. Hannass-Hancock J. Smit J. Tomlinson M. et al . (2017). Prevalence and factors associated with recent intimate partner violence and relationships between disability and depression in postpartum women in one clinic in eThekwini Municipality, South Africa. PLoS ONE12:e0181236. 10.1371/journal.pone.0181236
78
Gillum T. L. Doucette M. Mwanza M. Munala L. (2018). Exploring kenyan women's perceptions of intimate partner violence. J. Interpers. Violence33, 2130–2154. 10.1177/0886260515622842
79
Goffman E. (1974). Stigma: notes on the management of spoiled identity. New York: J. Aronson.
80
Goldman J. Reeves S. Wu R. Silver I. MacMillan K. Kitto S. (2016). A sociological exploration of the tensions related to interprofessional collaboration in acute-care discharge planning. J. Interprof. Care30, 217–225. 10.3109/13561820.2015.1072803
81
Goodson A. Hayes B. (2021). Help-seeking behaviors of intimate partner violence victims: a cross-national analysis in developing nations. J. Interpers. Violence 36, NP4705–NP4727. 10.1177/0886260518794508
82
Great Britain Working Group on Inequalities in Health Black D. Townsend P. Davidson N. (1982). Inequalities in health : the Black report. Harmondsworth, Middlesex, England: Penguin Books.
83
Greenwell F. Salentine S. (2018). “Population-Based Surveys,” in Health Information Systems Strengthening: Standards and Best Practices for Data Sources. (Washington, D.C., United States: Measure Evaluation, USAID). Available online at: https://www.measureevaluation.org/resources/hisdatasourcesguide/module-8-population-based-surveys (Accessed April 25, 2025).
84
Hampanda K. (2016a). Intimate partner violence against HIV-positive women is associated with sub-optimal infant feeding practices in Lusaka, Zambia. Matern. Child Health J.20, 2599–2606. 10.1007/s10995-016-2087-9
85
Hampanda K. Ybarra M. Bull S. (2014). Perceptions of health care services and HIV-related health-seeking behavior among Uganda adolescents. AIDS Care-Psychol. Socio-Med. Asp. AIDSHIV26, 1209–1217. 10.1080/09540121.2014.894612
86
Hampanda K. M. (2016b). Intimate partner violence and HIV-positive women's non-adherence to antiretroviral medication for the purpose of prevention of mother-to-child transmission in Lusaka, Zambia. Soc. Sci. Med.153, 123–130. 10.1016/j.socscimed.2016.02.011
87
Harvey S. Lees S. Mshana G. Pilger D. Hansen C. Kapiga S. et al . (2018). A cluster randomized controlled trial to assess the impact on intimate partner violence of a 10-session participatory gender training curriculum delivered to women taking part in a group-based microfinance loan scheme in Tanzania (MAISHA CRT01): study protocol. BMC Womens Health18:55. 10.1186/s12905-018-0546-8
88
Hatcher A. M. Mkhize S. P. Parker A. de Kadt J. (2022). Depressive symptoms and violence exposure in a population-based sample of adult women in South Africa. PLoS Glob. Public Health2:e0001079. 10.1371/journal.pgph.0001079
89
Hatcher A. M. Smout E. M. Turan J. M. Christofides N. Stöckl H. (2015). Intimate partner violence and engagement in HIV care and treatment among women: a systematic review and meta-analysis. Aids29, 2183–2194. 10.1097/QAD.0000000000000842
90
Hatcher A. M. Woollett N. Pallitto C. C. Mokoatle K. Stöckl H. Garcia-Moreno C. (2019). Willing but not able: Patient and provider receptiveness to addressing intimate partner violence in Johannesburg antenatal clinics. J. Interpers. Violence34, 1331–1356. 10.1177/0886260516651094
91
Heath J. (2005). Methodological individualism. Stanf. Encycl. Philos. 2008 Ed. Available online at: https://plato.stanford.edu/archives/win2008/entries/methodological-individualism/ (Accessed April 24, 2025).
92
Hochschild A. R. (1997). The Time Bind: When Work Becomes Home and Home Becomes Work. 1st ed. New York: Metropolitan Books. 10.2307/41165911
93
Hoffmann J. P. (2004). Generalized Linear Models: An Applied Approach. Boston: Pearson A and B.
94
Hollingshead A. B. Redlich F. C. (1953). Social stratification and psychiatric disorders. Am. Sociol. Rev.18, 163–169. 10.2307/2087725
95
Horn R. Puffer E. S. Roesch E. Lehmann H. (2016). “I don't need an eye for an eye”: Women's responses to intimate partner violence in Sierra Leone and Liberia. Glob. Public Health11, 108–121. 10.1080/17441692.2015.1032320
96
Huntley A. L. Potter L. Williamson E. Malpass A. Szilassy E. Feder G. (2019). Help-seeking by male victims of domestic violence and abuse (DVA): a systematic review and qualitative evidence synthesis. BMJ OPEN9:21960. 10.1136/bmjopen-2018-021960
97
Iburg K. M. Murray C. J. L. Sadana R. Mathers C. D. Lopez A. D. World Health, Organization Global Programme on Evidence for Health Policy (2001). Comparative analyses of more than 50 household surveys on health status/Ritu Sadana... [et al.]. Available online at: https://apps.who.int/iris/handle/10665/67777 (Accessed April 25, 2025).
98
ICF (2012a). Survey Organization Manual for Demographic and Health Surveys. Rockville, MD, USA: ICF.
99
ICF (2012b). The DHS Program STATCompiler. Funded by USAID. Available online at: https://www.statcompiler.com/en/ (Accessed August 1, 2024).
100
ICF (2020). Demographic and Health Survey Interviewer's Manual.Rockville, MD, USA: ICF.
101
ICF International (2012). DHS Sampling and Household Listing Manual. Calverton, MD, USA: ICF International.
102
Illich I. (1976). Medical Nemesis. New York: Bantam Books.
103
IMF (2024). World Economic Outlook, October 2024.Washington, D.C., United States: International Monetary Fund. Available online at: (Accessed December 31, 2024).
104
Itimi K. Dienye P. O. Gbeneol P. K. (2014). Intimate partner violence and associated coping strategies among women in a primary care clinic in Port Harcourt, Nigeria. J. Fam. Med. Prim. Care3:193. 10.4103/2249-4863.141601
105
Ityo A. K. (2010). The medical professionals: a microcosm. Niger. J. Med. 19. Available online at: https://journals.lww.com/njom/Fulltext/2010/19040/The_Medical_Professionals__a_Microcosm.1.aspx (Accessed May 8, 2025).
106
Izugbara C. O. Ngilangwa D. P. (2010). Women, poverty and adverse maternal outcomes in Nairobi, Kenya. BMC Womens Health10:33. 10.1186/1472-6874-10-33
107
Jacobs T. Jewkes R. (2002). Vezimfilho: a model for health sector response to gender violence in South Africa. Int. J. Gynecol. Obstet.78, S51–S56. 10.1016/S0020-7292(02)00044-9
108
Jasso G. (2011). “James S. Coleman,” in The Wiley-Blackwell companion to major social theorists (Malden, MA: Wiley-Blackwell), 219–239. 10.1002/9781444396621.ch28
109
Jefferies H. M. (2016). A comparative, ecological analysis of male-to-female intimate partner violence in the United States and Marlboro County, South Carolina.
110
Jerolmack C. Khan S. (2014). Talk is cheap ethnography and the attitudinal fallacy. Sociol. Methods Res.43, 178–209. 10.1177/0049124114523396
111
Joubert J. Rao C. Bradshaw D. Dorrington R. E. Vos T. Lopez A. D. (2012). Characteristics, availability and uses of vital registration and other mortality data sources in post-democracy South Africa. Glob. Health Action5, 1–19. 10.3402/gha.v5i0.19263
112
Joyner K. (2013). Correspondence: Relevance and feasibility of WHO recommendations for intimate partner violence care in South African primary health settings. Afr. Saf. Promot. J. Inj. Violence Prev.11, 21–27.
113
Joyner K. Mash B. (2012a). A comprehensive model for intimate partner violence in South African primary care: action research. BMC Health Serv. Res.12, 1–10. 10.1186/1472-6963-12-399
114
Joyner K. Mash B. (2014). Quality of care for intimate partner violence in South African primary care: a qualitative study. Violence Vict.29, 652–669. 10.1891/0886-6708.VV-D-13-00005
115
Joyner K. Mash R. (2012b). Recognizing intimate partner violence in primary care: Western Cape, South Africa. PLoS ONE7:e29540. 10.1371/journal.pone.0029540
116
Joyner K. Mash R. J. (2011). The value of intervening for intimate partner violence in South African primary care: project evaluation. BMJ Open1:254. 10.1136/bmjopen-2011-000254
117
Kabiru C. W. Mumah J. N. Maina B. W. Abuya B. A. (2017). Violence victimisation and aspirations–expectations disjunction among adolescent girls in urban Kenya. Int. J. Adolesc. Youth2017, 1–10. 10.1080/02673843.2017.1345769
118
Kanagaratnam P. Mason R. Hyman I. Manuel L. Berman H. Toner B. (2012). Burden of womanhood: tamil women's perceptions of coping with intimate partner violence. J. Fam. Violence27, 647–658. 10.1007/s10896-012-9461-1
119
Kapiga S. Harvey S. Mshana G. Hansen C. H. Mtolela G. J. Madaha F. et al . (2019). A social empowerment intervention to prevent intimate partner violence against women in a microfinance scheme in Tanzania: findings from the MAISHA cluster randomised controlled trial. Lancet Glob. Health7, e1423–e1434. 10.1016/S2214-109X(19)30316-X
120
Katz J. (1997). Ethnography's warrants. Sociol. Methods Res.25, 391–423. 10.1177/0049124197025004002
121
Kaye D. K. Ekstroem A. M. Johansson A. Bantebya G. Mirembe F. M. (2007). Escaping the triple trap: coping strategies of pregnant adolescent survivors of domestic violence in Mulago hospital, Uganda. Scand. J. Public Health35, 180–186. 10.1080/14034940600858490
122
Kenya National Bureau of Statistics, Ministry of Health/Kenya, National AIDS, Control Council/Kenya, Kenya Medical Research Institute, and National Council for Population and Development/Kenya. (2015). Kenya Demographic and Health Survey 2014. Rockville, MD, USA.
123
Kibe P. M. Kisia L. Bakibinga P. (2020). COVID-19 and community healthcare: perspectives from Nairobi's informal settlements. Pan Afr. Med. J.35:106. 10.11604/pamj.supp.2020.35.2.24532
124
Kohli A. Perrin N. Mpanano R. M. Banywesize L. Mirindi A. B. Banywesize J. H. et al . (2015). Family and community driven response to intimate partner violence in post-conflict settings. Soc. Sci. Med.146, 276–284. 10.1016/j.socscimed.2015.10.011
125
Lamont M. Swidler A. (2014). Methodological pluralism and the possibilities and limits of interviewing. Qual. Sociol.37, 153–171. 10.1007/s11133-014-9274-z
126
LaPiere R. T. (1934). Attitudes vs. actions. Soc. Forces13, 230–237. 10.2307/2570339
127
Lee E. S. Forthofer R. N. (2006). Analyzing Complex Survey Data. 2nd ed. Thousand Oaks, CA: Sage Publications. 10.4135/9781412983341
128
Lennan E. (2014). Non-medical prescribing of chemotherapy: engaging stakeholders to maximise success?Ecancermedicalscience8:417. 10.3332/ecancer.2014.417
129
Leventhal H. Phillips L. A. Burns E. (2016). The common-sense model of self-regulation (CSM): a dynamic framework for understanding illness self-management. J. Behav. Med.39, 935–946. 10.1007/s10865-016-9782-2
130
Lewis-Beck M. S. (1995). Data Analysis: An Introduction. Thousand Oaks: Sage Publications. 10.4135/9781412983846
131
Lewis-Beck M. S. Lewis-Beck C. (2016). Applied regression: An introduction. Second Edition. Thousand Oaks, CA: Sage publications. 10.4135/9781483396774
132
Liebetrau A. M. (1983). Measures of Association. Beverly Hills: Sage Publications. 10.4135/9781412984942
133
Lilford R. J. Oyebode O. Satterthwaite D. Melendez-Torres G. J. Chen Y.-F. Mberu B. et al . (2017). Improving the health and welfare of people who live in slums. LANCET389, 559–570. 10.1016/S0140-6736(16)31848-7
134
Luke D. A. (2020). Multilevel Modeling. Second edition. Thousand Oaks, CA: SAGE Publications, Inc. 10.4135/9781544310305
135
Luker K. (2008). Salsa Dancing Into The Social Sciences: Research in an Age of Info-Glut. Cambridge, MS: Harvard University Press.
136
Lutfey K. Freese J. (2005). Toward some fundamentals of fundamental causality: socioeconomic status and health in the routine clinic visit for diabetes1. Am. J. Sociol.110, 1326–1372. 10.1086/428914
137
Mackenbach J. P. Kunst A. E. Cavelaars A. E. Groenhof F. Geurts J. J. Health E. W. G. on S. I. in (1997). Socioeconomic inequalities in morbidity and mortality in western Europe. LANCET349, 1655–1659. 10.1016/S0140-6736(96)07226-1
138
Mackie G. Moneti F. Shakya H. Denny E. (2015). What Are Social Norms? How are they Measured?California: University of California at San Diego.
139
Magadi M. Desta M. (2011). A multilevel analysis of the determinants and cross-national variations of HIV seropositivity in sub-Saharan Africa: Evidence from the DHS. Health Place17, 1067–1083. 10.1016/j.healthplace.2011.06.004
140
Magadi M. A. (2017). Multilevel determinants of teenage childbearing in sub-Saharan Africa in the context of HIV/AIDS. Health Place46, 37–48. 10.1016/j.healthplace.2017.04.006
141
Mahenge B. Stoeckl H. Abubakari A. Mbwambo J. Jahn A. (2016). Physical, sexual, emotional and economic intimate partner violence and controlling behaviors during pregnancy and postpartum among women in dares Salaam, Tanzania. PLoS ONE11:e0164376. 10.1371/journal.pone.0164376
142
Mannell J. Jackson S. Umutoni A. (2016). Women's responses to intimate partner violence in Rwanda: Rethinking agency in constrained social contexts. Glob. Public Health11, 65–81. 10.1080/17441692.2015.1013050
143
Marcotte D. E. (2004). The Economics of Gender and Mental Illness. Emerald Group Publishing Limited. 10.1016/S0194-3960(2004)15
144
Marmot M. Wilkinson R. G. (2006). Social Determinants of Health. Oup Oxford. 10.1093/acprof:oso/9780198565895.001.0001
145
Matoori S. Khurana B. Balcom M. C. Froehlich J. M. Janssen S. Forstner R. et al . (2021). Addressing intimate partner violence during the COVID-19 pandemic and beyond: how radiologists can make a difference. Eur. Radiol.31, 2126–2131. 10.1007/s00330-020-07332-4
146
McCleary-Sills J. Namy S. Nyoni J. Rweyemamu D. Salvatory A. Steven E. (2016). Stigma, shame and women's limited agency in help-seeking for intimate partner violence. Glob. Public Health11, 224–235. 10.1080/17441692.2015.1047391
147
McCorkel J. A. Myers K. (2003). What difference does difference make? Position and privilege in the field. Qual. Sociol.26, 199–231. 10.1023/A:1022967012774
148
McKeown T. (1979). The role of Medicine: Dream, Mirage, or Nemesis?Princeton, NJ: Princeton University Press. 10.1515/9781400854622
149
McNabb D. E. (2020). Nonsampling Error. London, England: SAGE Publications Limited.
150
Measure DHS/ICF International (2013). ICF International, Demographic and Health Surveys Methodology: Standard Recode Manual for DHS 6. Demogr. Health Surv. Toolkit Methodol. Meas. DHS Phase III 2008-2013 Meas. DHSICF Int. Wash. DC USA.
151
Menard S. W. (2002). Longitudinal Research. 2nd ed. Thousand Oaks, Calif: Sage Publications. 10.4135/9781412984867
152
Metheny N. Mkhize S. P. Scott D. Hatcher A. (2024). Violence victimization and depressive symptoms among a sub-sample of sexual and gender minority adults in a population-based South African study. J. Interpers. Violence2024:08862605241243348. 10.1177/08862605241243348
153
Metheny N. Stephenson R. (2019). Help seeking behavior among women who report intimate partner violence in afghanistan: an analysis of the 2015 Afghanistan demographic and health survey. J. Fam. Violence34, 69–79. 10.1007/s10896-018-0024-y
154
Mohammed B. H. Johnston J. M. Harwell J. I. Yi H. Tsang K. W. Haidar J. A. (2017). Intimate partner violence and utilization of maternal health care services in Addis Ababa, Ethiopia. Bmc Health Serv. Res.17:178. 10.1186/s12913-017-2121-7
155
Morelli S. Smeeding T. Thompson J. (2015). Post-1970 trends in within-country inequality and poverty: rich and middle-income countries. Handb. Income Distrib.2, 593–696. 10.1016/B978-0-444-59428-0.00009-6
156
Moreno-Betancur M. Latouche A. Menvielle G. Kunst A. E. Rey G. (2015). Relative index of inequality and slope index of inequality: a structured regression framework for estimation. Epidemiology26:12. 10.1097/EDE.0000000000000311
157
Morgensten J. (2018). Bias in Medical Research. Available online at: https://first10em.com/bias/ (Accessed April 24, 2025). 10.51684/FIRS.5988
158
Mutuku I. (2023). Taking Stock: Maputo Protocol in Advancing Women's Rights. Available online at: http://www.aphrc.org (Accessed August 12, 2024).
159
National Research Council (U.S.) Weinstein M. Vaupel J. W. Wachter K. W. National Research Council (U.S.) (2008). Biosocial Surveys. Washington, DC: National Academies Press.
160
Naved R. T. Al Mamun M. Mourin S. A. Parvin K. (2018). A cluster randomized controlled trial to assess the impact of SAFE on spousal violence against women and girls in slums of Dhaka, Bangladesh. PLoS ONE13:e0198926. 10.1371/journal.pone.0198926
161
Njuki R. Okal J. Warren C. E. Obare F. Abuya T. Kanya L. et al . (2012). Exploring the effectiveness of the output-based aid voucher program to increase uptake of gender-based violence recovery services in Kenya: a qualitative evaluation. BMC Public Health12:426. 10.1186/1471-2458-12-426
162
Nyarko M. G. (2016). “The impact of the African Charter and Maputo Protocol in Ghana,” in The Impact of the African Charter and Maputo Protocol in Selected African States. ed. AyeniV. (South Africa: Pretoria University Law Press), 95–113.
163
Oakes J. M. Kaufman J. S. (2017). Methods in Social Epidemiology. Second edition. San Francisco, CA: Jossey-Bass, A Wiley Brand.
164
Odero M. Hatcher A. M. Bryant C. Onono M. Romito P. Bukusi E. A. et al . (2014). Responses to and resources for intimate partner violence: qualitative findings from women, men, and service providers in Rural Kenya. J. Interpers. Violence29, 783–805. 10.1177/0886260513505706
165
O'Donnell O. A. Wagstaff A. (2008). Analyzing Health Equity Using Household Survey Data: a Guide to Techniques and Their Implementation. World Bank Publications. 10.1596/978-0-8213-6933-3
166
Odum E. P. (1984). The mesocosm. BioScience34, 558–562. 10.2307/1309598
167
Olson K. (2020). Interviewer Effects From a Total Survey Error Perspective. 1st ed. Boca Raton: CRC Press. 10.1201/9781003020219
168
Onoh R. C. Umeora O. U. J. Ezeonu P. O. Onyebuchi A. K. Lawani O. L. Agwu U. M. (2013). Prevalence, pattern and consequences of intimate partner violence during pregnancy at abakaliki southeast Nigeria. Ann. Med. Health Sci. Res.3, 484–491. 10.4103/2141-9248.122048
169
Pannucci C. J. Wilkins E. G. (2010). Identifying and avoiding bias in research. Plast. Reconstr. Surg.126, 619–625. 10.1097/PRS.0b013e3181de24bc
170
Parks M. J. (2013). Urban poverty traps: neighbourhoods and violent victimisation and offending in Nairobi, Kenya. Urban Stud.51, 1812–1832. 10.1177/0042098013504144
171
Parsons T. (1975). The sick role and the role of the physician reconsidered. Milbank Mem. Fund Q. Health Soc.53, 257–278. 10.2307/3349493
172
Patwardhan V. Flor L. Gakidou E. (2023). Gender differences in global Disability-Adjusted Life Years (DALYs): a descriptive Analysis of the global burden of disease study 2021. Popul. Med.5:163644. 10.18332/popmed/163644
173
Pearlin L. I. (1989). The sociological study of stress. J. Health Soc. Behav. 241–256. 10.2307/2136956
174
Phelan J. C. Link B. G. Tehranifar P. (2010). Social conditions as fundamental causes of health inequalities: theory, evidence, and policy implications. J. Health Soc. Behav.51, S28–S40. 10.1177/0022146510383498
175
Porter R. (1985). Patients and Practitioners: Lay Perceptions of Medicine in Pre-Industrial Society. Cambridge ; New York: Cambridge University Press. 10.1017/CBO9780511563690
176
Prabhu M. Mchome B. Ostermann J. Itemba D. Njau B. Thielman N. (2011). Prevalence and correlates of intimate partner violence among women attending HIV voluntary counseling and testing in northern Tanzania, 2005-2008. Int. J. Gynecol. Obstet.113, 63–67. 10.1016/j.ijgo.2010.10.019
177
Prosman G.-J. Wong S. H. L. F. Lagro-Janssen A. L. M. (2014). Why abused women do not seek professional help: a qualitative study. Scand. J. CARING Sci.28, 3–11. 10.1111/scs.12025
178
Punch K. (2014). Introduction to Social Research: Quantitative and Qualitative Approaches. Third edition. Los Angeles, California: SAGE.
179
Quesnel-Vallee A. (2004). Is it really worse to have public health insurance than to have no insurance at all? Health insurance and adult health in the United States. J. Health Soc. Behav.45, 376–392. 10.1177/002214650404500402
180
Quesnel-Vallée A. Bilodeau J. Conway K. (2021). “Social policies and health inequalities,” in The Wiley Blackwell Companion to Medical Sociology, ed. CockerhamW. (Hoboken, NJ: John Wiley and Sons), 322. 10.1002/9781119633808.ch16
181
R Development Core Team (2025). R: A Language and Environment for Statistical Computing. R Found. Stat. Comput. Vienna Austria.
182
Rabe-Hesketh S. Skrondal A. (2022). Multilevel and Longitudinal Modeling Using Stata. Fourth edition. College Station, Texas: Stata Press. Available online at: http://www.mcgill.ca/library/ (Accessed April 1, 2025).
183
Ransome P. (2010). Social Theory for Beginners. 1st Edn. Bristol: Bristol University Press. 10.56687/9781447314387
184
Rees K. Zweigenthal V. Joyner K. (2014a). Health sector responses to intimate partner violence: a literature review. Afr. J. Prim. Health Care Fam. Med.6, 1–8. 10.4102/phcfm.v6i1.712
185
Rees K. Zweigenthal V. Joyner K. (2014b). Implementing intimate partner violence care in a rural sub-district of South Africa: a qualitative evaluation. Glob. Health Action7:24588. 10.3402/gha.v7.24588
186
Rittenhouse D. R. Braveman P. Marchi K. (2003). Improvements in prenatal insurance coverage and utilization of care in California: an unsung public health victory. Matern. Child Health J.7, 75–86. 10.1023/A:1023812009298
187
Ritzer G. (2005). Encyclopedia of Social Theory. Thousand Oaks, CA: Sage Publications. 10.4135/9781412952552
188
Ritzer G. Ryan J. M. (2011). The Concise Encyclopedia of Sociology. Chichester, West Sussex, U.K.; Malden, MA: Wiley-Blackwell. 10.1002/9781444392654
189
Rizo C. F. Macy R. J. (2011). Help seeking and barriers of Hispanic partner violence survivors: a systematic review of the literature. Aggress. Violent Behav.16, 250–264. 10.1016/j.avb.2011.03.004
190
Rose N. (2001). The politics of life itself. Theory Cult. Soc.18, 1–30. 10.1177/02632760122052020
191
Rutstein S. O. Rojas G. (2006). Guide to DHS Statistics. Calverton MD: ORC Macro.
192
R. Williams D. Williams-Morris R. (2000). Racism and mental health: the African American experience. Ethn. Health5, 243–268. 10.1080/713667453
193
Ryder N. B. (1965). The cohort as a concept in the study of social change. Am. Sociol. Rev.30, 843–861. 10.2307/2090964
194
Sampson R. J. (2012). Great American City: Chicago and the Enduring Neighborhood Effect. Chicago: University of Chicago Press. 10.7208/chicago/9780226733883.001.0001
195
Sandstrom K. Kleinman S. (2004). Encyclopedia of Social Theory.Thousand Oaks, CA: SAGE Publications, Inc.
196
Sandstrom R. W. (2007). The meanings of autonomy for physical therapy. Phys. Ther.87, 98–106. 10.2522/ptj.20050245
197
Satyen L. Rogic A. C. Supol M. (2019). Intimate partner violence and help-seeking behaviour: a systematic review of cross-cultural differences. J. Immigr. Minor. Health21, 879–892. 10.1007/s10903-018-0803-9
198
Sauro J. (2015). 7 ways to handle missing data. MeasuringU. Available online at: https://measuringu.com/handle-missing-data/ (Accessed March 16, 2021).
199
Seltzer J. R. (2002). The Origins and Evolution of Family Planning Programs in Developing Countries. London: Rand Corporation.
200
Sergeant J. C. Firth D. (2006). Relative index of inequality: definition, estimation, and inference. Biostatistics7, 213–224. 10.1093/biostatistics/kxj002
201
Shadish W. R. Cook T. D. Campbell D. T. (2001). Experimental and Quasi-Experimental Designs For Generalized Causal Inference. Boston: Houghton Mifflin.
202
Shryock H. S. Siegel J. S. Larmon E. A. (1975). The methods and materials of demography. 3rd print., rev. Washington: U.S. Dept. of Commerce, Bureau of the Census : for sale by the Supt. of Docs. U.S. Govt. Print. Off.
203
Sica G. T. (2006). Bias in research studies. Radiology238, 780–789. 10.1148/radiol.2383041109
204
Silverman D. (1981). The child as a social object: Down's Syndrome children in a paediatric cardiology clinic. Sociol. Health Illn.3, 254–274. 10.1111/1467-9566.ep10486744
205
Silverman D. (1983). The clinical subject: adolescents in a cleft-palate clinic. Sociol. Health Illn.5, 253–274. 10.1111/j.1467-9566.1983.tb00435.x
206
Simister J. G. (2010). Domestic violence and female genital mutilation in Kenya: effects of ethnicity and education. J. Fam. Violence25, 247–257. 10.1007/s10896-009-9288-6
207
Small M. L. (2009). How many cases do I need? On science and the logic of case selection in field-based research. Ethnography10, 5–38. 10.1177/1466138108099586
208
Small M. L. Newman K. (2001). Urban poverty after the truly disadvantaged: the rediscovery of the family, the Neighborhood, and Culture. Annu. Rev. Sociol.27:23. 10.1146/annurev.soc.27.1.23
209
Solar O. Irwin A. (2010). A Conceptual Framework for Action on the Social Determinants of Health.Geneva: World Health Organization (WHO). Available online at: https://iris.who.int/handle/10665/44489 (Accessed April 25 2025).
210
Solar O. Irwin A. WHO Commission on Social Determinants of Health (2007). A Conceptual Framework on the Social Determinants of Health. Geneva: World Health Organization (WHO).
211
Sprague C. Hatcher A. M. Woollett N. Sommers T. Black V. (2016). ‘They can't report abuse, they can't move out. They are at the mercy of these men': exploring connections between intimate partner violence, gender and HIV in South African clinical settings. Cult. Health Sex.18, 567–581. 10.1080/13691058.2015.1096420
212
Sprague S. McKay P. Madden K. Scott T. Tikasz D. Slobogean G. P. et al . (2017). Outcome measures for evaluating intimate partner violence programs within clinical settings: a systematic review of the literature. Trauma Violence Abuse18, 508–522. 10.1177/1524838016641667
213
Starr P. (1982). The Social Transformation of American Medicine. New York: Basic Books.
214
Swart E. (2013). Doing survival: strategies for coping with gender-based violence in kenya's kibera slum. Affil. - J. Women Soc. Work28, 40–50. 10.1177/0886109912470111
215
Takacs D. (2003). How does your positionality bias your epistemology?Thought Action19, 27–38.
216
The Africa Health Agenda International Conference Commission Edwine B. Pokuaa F. A. Francis O. Shabir M. Karim B. . (2021). The State of Universal Health Coverage in Africa. Kenya: Amref Health Africa. Available online at: https://ahaic.org/download/the-state-of-universal-health-coverage-in-africa/ (Accessed April 24, 2025).
217
Thomas S. B. Quinn S. C. (1991). The Tuskegee Syphilis Study, 1932 to 1972: implications for HIV education and AIDS risk education programs in the black community. Am. J. Public Health81, 1498–1505. 10.2105/AJPH.81.11.1498
218
Timmermans S. Oh H. (2010). The continued social transformation of the medical profession. J. Health Soc. Behav.51, S94–S106. 10.1177/0022146510383500
219
Toth F. (2015). Sovereigns under Siege. How the medical profession is changing in Italy. Soc. Sci. Med.136, 128–134. 10.1016/j.socscimed.2015.05.024
220
Trochim W. M. K. (2005). Research Methods: the Concise Knowledge Base. Cincinnati, OH: Atomic Dog Pub.
221
Tusiime S. Musinguzi G. Tinkitina B. Mwebaza N. Kisa R. Anguzu R. et al . (2015). Prevalence of sexual coercion and its association with unwanted pregnancies among young pregnant females in Kampala, Uganda: a facility based cross-sectional study. BMC Womens Health15:79. 10.1186/s12905-015-0235-9
222
Umeora O. U. J. Dimejesi B. I. Ejikeme B. N. Egwuatu V. E. (2008). Pattern and determinants of domestic violence among prenatal clinic attendees in a referral centre, South-east Nigeria. J. Obstet. Gynaecol.28, 769–774. 10.1080/01443610802463819
223
UNICEF (2015). Monitoring the situation of children and women for 20 years: The Multiple Indicator Cluster Surveys (MICS) 1995–2015. New York, NY: United Nations Children's Fund (UNICEF).
224
United Nations (1984). Report of the International Conference on Population, 1984, Mexico City, 6-14 August. New York: United Nations (UN). Available online at: http://digitallibrary.un.org/record/74631/files/E_CONF.76_19-EN.pdf (Accessed April 25, 2025).
225
UN-WOMEN (2024). Facts and figures: Ending violence against women. Available online at: https://www.unwomen.org/en/articles/facts-and-figures/facts-and-figures-ending-violence-against-women (Accessed April 25, 2025).
226
Van Ham M. Manley D. (2012). Neighbourhood effects research at a crossroads. ten challenges for future research introduction. Environ. Plan. A44, 2787–2793. 10.1068/a45439
227
Weiss M. C. Sutton J. (2009). The changing nature of prescribing: pharmacists as prescribers and challenges to medical dominance. Sociol. Health Illn.31, 406–421. 10.1111/j.1467-9566.2008.01142.x
228
Weiss R. S. (2004). In their own words: making the most of qualitative interviews. Contexts3, 44–51. 10.1525/ctx.2004.3.4.44
229
White K. (2015). “Ludwik fleck: thought collectives and the sociology of medical knowledge,” in The Palgrave Handbook of Social Theory in Health, Illness and Medicine, ed. CollyerF. (London: Palgrave Macmillan UK), 141–157. 10.1057/9781137355621_9
230
Wilson P. M. Kendall S. Brooks F. (2007). The expert patients programme: a paradox of patient empowerment and medical dominance. Health Soc. Care Commun.15, 426–438. 10.1111/j.1365-2524.2007.00701.x
231
Wilson W. J. (1987). The Truly Disadvantaged Chicago. IL Univ. Chic.
232
Winship C. Radbill L. (1994). Sampling weights and regression analysis. Sociol. Methods Res.23, 230–257. 10.1177/0049124194023002004
233
Wolff E. N. (1987). International Comparisons of the Distribution of Household Wealth. Oxford: New York: Clarendon Press; Oxford University Press.
234
Wood L. Baumler E. Schrag R. V. Guillot-Wright S. Hairston D. Temple J. et al . (2022a). “Don't know where to go for help”: safety and economic needs among violence survivors during the COVID-19 pandemic. J. Fam. Violence37, 959–967. 10.1007/s10896-020-00240-7
235
Wood L. Schrag R. V. Baumler E. Hairston D. Guillot-Wright S. Torres E. et al . (2022b). On the front lines of the COVID-19 pandemic: occupational experiences of the intimate partner violence and sexual assault workforce. J. Interpers. Violence 37, NP9345–NP9366. 10.1177/0886260520983304
236
World Health Organization (2013). Global and Regional Estimates of Violence Against Women: Prevalence and Health Effects of Intimate Partner Violence and Non-Partner Sexual Violence.Geneva: World Health Organization (WHO).
237
World Health Organization (2025). WHO warns of severe disruptions to health services amid funding cuts. United NationsUN News Glob. Perspect. Hum. Ser. Available online at: https://news.un.org/en/story/2025/04/1162091 (Accessed May 10, 2025).
238
Wright E. O. (1997). Class Counts: Comparative Studies in Class Analysis. Cambridge ; New York : Paris: Cambridge University Press ; Maison des sciences de l'homme.
239
Ye Y. Wamukoya M. Ezeh A. Emina J. B. Sankoh O. (2012). Health and demographic surveillance systems: a step towards full civil registration and vital statistics system in sub-Sahara Africa?BMC Public Health12, 1–11. 10.1186/1471-2458-12-741
240
Zedelius C. M. Müller B. C. N. Schooler J. W. (2017). The Science of Lay Theories : How Beliefs Shape our Cognition, Behavior, and Health. Cham: Springer. 10.1007/978-3-319-57306-9
241
Zgourides G. D. Zgourides C. S. (2000). “Social change and movements,” in CliffsQuickReview Sociology (Foster City, CA: IDG Books Worldwide, Inc.).
242
Zhou M. Desborough J. Parkinson A. Douglas K. McDonald D. Boom K. (2019). Barriers to pharmacist prescribing: a scoping review comparing the UK, New Zealand, Canadian and Australian experiences. Int. J. Pharm. Pract.27, 479–489. 10.1111/ijpp.12557
243
Ziraba A. K. Madise N. Mills S. Kyobutungi C. Ezeh A. (2009a). Maternal mortality in the informal settlements of Nairobi city: what do we know. Reprod Health6, 4755–4756. 10.1186/1742-4755-6-6
244
Ziraba A. K. Mills S. Madise N. Saliku T. Fotso J.-C. (2009b). The state of emergency obstetric care services in Nairobi informal settlements and environs: results from a maternity health facility survey. BMC Health Serv. Res.9:46. 10.1186/1472-6963-9-46
245
Zola I. K. (1972). Medicine as an institution of social control. Sociol. Rev.20, 487–504. 10.1111/j.1467-954X.1972.tb00220.x
Summary
Keywords
victim behavior, social inequality, gender-based violence, social determinants, health inequalities
Citation
Elung'ata P (2025) Medical mesocosms and cohort differences in victim decisions in spousal violence in Sub-Saharan Africa. Front. Sociol. 10:1266401. doi: 10.3389/fsoc.2025.1266401
Received
24 July 2023
Accepted
17 April 2025
Published
07 August 2025
Volume
10 - 2025
Edited by
Andrzej Klimczuk, Warsaw School of Economics, Poland
Reviewed by
Arda Isik, Istanbul Medeniyet University, Türkiye
Usengimana Shadrack Mutembereza, University of KwaZulu-Natal, South Africa
Samuel Iddi, African Population and Health Research Center (APHRC), Kenya
Updates
Copyright
© 2025 Elung'ata.
This is an open-access article distributed under the terms of the Creative Commons Attribution License (CC BY). The use, distribution or reproduction in other forums is permitted, provided the original author(s) and the copyright owner(s) are credited and that the original publication in this journal is cited, in accordance with accepted academic practice. No use, distribution or reproduction is permitted which does not comply with these terms.
*Correspondence: Patricia Elung'ata Thesis.pelungata@yahoo.com
Disclaimer
All claims expressed in this article are solely those of the authors and do not necessarily represent those of their affiliated organizations, or those of the publisher, the editors and the reviewers. Any product that may be evaluated in this article or claim that may be made by its manufacturer is not guaranteed or endorsed by the publisher.